Abstract
Objective
To identify a pharmacological compound targeting macrophages, the most affected immune cells in inflammatory X‐linked adrenoleukodystrophy (cerebral X‐ALD) caused by ABCD1 mutations and involved in the success of hematopoietic stem cell transplantation and gene therapy.
Methods
A comparative database analysis elucidated the epigenetic repressing mechanism of the related ABCD2 gene in macrophages and identified the histone deacetylase (HDAC) inhibitor Vorinostat as a compound to induce ABCD2 in these cells to compensate for ABCD1 deficiency. In these cells, we investigated ABCD2 and pro‐inflammatory gene expression, restoration of defective peroxisomal β‐oxidation activity, accumulation of very long‐chain fatty acids (VLCFAs) and their differentiation status. We investigated ABCD2 and pro‐inflammatory gene expression, restoration of defective peroxisomal ß‐oxidation activity, accumulation of very long‐chain fatty acids (VLCFA) and differentiation status. Three advanced cerebral X‐ALD patients received Vorinostat and CSF and MRI diagnostics was carried out in one patient after 80 days of treatment.
Results
Vorinostat improved the metabolic defects in X‐ALD macrophages by stimulating ABCD2 expression, peroxisomal ß‐oxidation, and ameliorating VLCFA accumulation. Vorinostat interfered with pro‐inflammatory skewing of X‐ALD macrophages by correcting IL12B expression and further reducing monocyte differentiation. Vorinostat normalized the albumin and immunoglobulin CSF‐serum ratios, but not gadolinium enhancement upon 80 days of treatment.
Interpretation
The beneficial effects of HDAC inhibitors on macrophages in X‐ALD and the improvement of the blood‐CSF/blood‐brain barrier are encouraging for future investigations. In contrast with Vorinostat, less toxic macrophage‐specific HDAC inhibitors might improve also the clinical state of X‐ALD patients with advanced inflammatory demyelination.
Introduction
X‐linked adrenoleukodystrophy (X‐ALD) is a neurodegenerative disease (OMIM #300100) caused by mutations in the ATP‐binding cassette subfamily D member 1 (ABCD1) gene, which encodes a peroxisomal transporter crucial for the import of coenzyme A‐activated very long‐chain fatty acids (VLCFAs) into peroxisomes for degradation. 1 , 2 , 3 Accordingly, ABCD1 deficiency results in accumulation of VLCFAs in tissues and body fluids of patients. 4 Cerebral ALD (CALD), the most severe form, affects ~60% of male X‐ALD patients and is characterized by a rapidly progressive inflammatory destruction of brain white matter. 5 , 6 , 7 If untreated, CALD results in vegetative state or death within a few years after disease onset. 5 , 6 , 8 , 9 The inflammatory brain lesions are characterized by impaired integrity of the blood‐cerebrospinal fluid/blood‐brain barrier (BCSFB/BBB) and recruitment of immune cells from the periphery. 10 If the onset is detected early, the inflammatory demyelination can be stopped by hematopoietic stem cell transplantation (HSCT) or gene therapy (HSCGT) without major disabilities. 11 , 12 However, HSCT/HSCGT have limited effect in more advanced patients. Both procedures may require up to 16 months to halt cerebral demyelination, and the necessary neurotoxic myeloablative chemo‐conditioning will further contribute to disease progression. 13 Thus, for patients with advanced cerebral involvement (Loes score > 9) no effective treatment options are available. 14 Pharmacological treatment of CALD may offer advantages in comparison to HSCT/HSCGT by having a lower mortality risk and immediate applicability of therapeutic effects.
Among different HSC‐derived immune cells, ABCD1 deficiency most severely affects monocytes/macrophages in terms of impaired VLCFA metabolism. 15 Moreover, pro‐inflammatory skewed X‐ALD macrophages are less able to adopt an anti‐inflammatory state as shown in vitro and postmortem. 15 , 16 Thus, the presence of metabolically intact macrophages derived by HSCT/HSCGT appears to be key for the success in halting the inflammatory demyelination. One possibility to revert the metabolic defect in X‐ALD macrophages could be by pharmacological upregulation of the ABCD2 gene. 17 Upon overexpression, ABCD2 can compensate for ABCD1 deficiency in cultured cells and in Abcd1‐deficient mice. 18 , 19 , 20 , 21 However, in human monocytes/macrophages, ABCD2 is barely expressed. 15
Here, we compared the epigenetic marks at the human ABCD2 locus of monocytes/macrophages and T cells (high ABCD2 expression). Based on these results, we evaluated the therapeutic potential of the histone deacetylase (HDAC) inhibitor Vorinostat (Zolinza®, suberoylanilide hydroxamic acid, SAHA) for the neuroinflammation in CALD. Vorinostat, an anti‐cancer agent, 22 , 23 had positive effects on neuroinflammation in an animal model of inflammatory demyelination 24 and significantly reduced the incidence of graft‐versus‐host disease after HSCT. 25 , 26 Vorinostat and other pan‐HDAC inhibitors like phenylbutyrate and valproic acid were previously suggested as treatment options in X‐ALD, because of improving X‐ALD related features in other ABCD1‐deficient cell types. 17 , 21 , 27 , 28 , 29
Here, we thoroughly evaluated the properties of Vorinostat in vitro in macrophages derived from seven X‐ALD patients. Based on these positive observations, three boys with advanced CALD, who had been diagnosed too late for HSCT/HSCGT and were left without alternative therapeutic options received Vorinostat on compassionate use.
Materials and Methods
Patients and healthy volunteers
Upon obtained informed consent and approval by the Ethical Committee of the Medical University of Vienna (EK1462/2014), peripheral blood samples were drawn from 18 healthy volunteers and from seven X‐ALD patients with AMN. Patients’ details are described in Table S1. The accumulation of VLCFAs in plasma and leukocytes of AMN patients was confirmed by measuring the total amount of the fatty acids C26:0, C24:0, and C22:0 by GC–MS as described previously. 15 Three childhood CALD patients with advanced disease progression received Vorinostat orally under a compassionate‐use label after written informed consent from the patients’ parents. Written informed consent to publish the medical data and MRI images of the three Vorinostat‐treated CALD patients was obtained from the patients’ parents.
In vitro differentiation of human monocytes to macrophages and activation with LPS
For macrophage differentiation and polarization, CD14+ monocytes (1 × 10⁶ cells/well) were isolated and characterized by flow cytometry as described previously 15 , 16 and seeded in RPMI medium (Sigma‐Aldrich) containing 1% Penicillin/Streptomycin, 1% glutamine, 1% Fungizone, and 10% fetal calf serum, supplemented with either 50 ng/mL human recombinant GM‐CSF or M‐CSF (PeproTech) for 7 days. For β‐oxidation assays, M‐CSF‐differentiated macrophages were polarized into an anti‐inflammatory phenotype with 100 ng/ml IL‐4 (Novartis) and 10 ng/ml M‐CSF for 2 days. To analyse pro‐inflammatory cytokine gene expression, M‐CSF‐differentiated macrophages were stimulated with 100 ng/ml LPS (E. coli 055:B5, #L4005, Sigma) and treated with vehicle control or Vorinostat (#10009929, Cayman Chemicals) for 24 h. ELISA to measure secreted IL12p40 was described previously. 16 To determine mean cell size and number of adherent or nonadherent cells, a CASY automated cell counter (Omni Life Sciences) was used. For detachment, adherent macrophages were incubated with 300 µL Gibco™ TrypLE™ Select (10×) (Gibco, Life Technologies) for 15 min at 37°C shaking every few minutes and was gently removed with a cell scraper.
RNA isolation and reverse transcription coupled‐quantitative PCR (RT‐qPCR)
RNA isolation and RT‐qPCR analysis were carried out as previously described. 15 , 16 In addition, the reference gene RACK1 (NM_006098) was analysed for normalization purposes as indicated by using the gene‐specific primers and probe: forward 5′gccataccaaggatgtgctg‐3′, reverse 5′‐tggttggtcttcagcttgca‐3′, TexasRed‐cgcccaacagcagcaaccct‐BHQ2.
β‐Oxidation of 1‐14C‐labeled fatty acids
Detached macrophages (1–2 × 10⁶ per condition) were washed and resuspended in sucrose buffer (250 mmol/L sucrose, 3 mmol/L imidazole, 1 mmol/L EDTA, pH 7.4 at 4°C). Protein levels were determined and used for normalization. β‐Oxidation of radio‐labeled fatty acids to acetate was carried out as described previously. 3 , 15
Lipid analysis
C26:0‐lysophophatidylcholine was analyzed in differentiated macrophages following the protocol for dried blood spots as described previously. 30
Analysis of Chromatin Immunoprecipitation‐DNA Sequencing (ChIP‐Seq) data for different histone modifications
ChIP‐Seq datasets of monocytes/macrophages and T cells were retrieved from the International Human Epigenome Consortium (IHEC) data portal. 31 The datasets were preselected by assay category “histone” and tissue “blood.” The consortia BLUEPRINT, CEEHRC (Canadian Epigenetics, Environment and Health Research Consortium), DEEP (Deutsches Epigenom Programm) and Roadmap provided data on the human ABCD2 locus in both T‐cells and monocytes/macrophages and, thus, were included in our comparative study. For further data analysis and visualization, the software Integrative Genomics Viewer was used. 32 As reference genome, hg19 was selected for CEEHRC, DEEP, and Roadmap, and hg38 for BLUEPRINT.
Immunohistochemical analysis of B cells in human postmortem brain tissue
CD20 and IgG staining was performed as described previously. 33 The postmortem tissue of four CALD patients and six control cases were described in detail previously. 16
Statistical analysis
For normally distributed data, we performed one‐way ANOVA and Sidak’s or Dunnett’s multiple comparison test as indicated. For not normally distributed data, we used the nonparametric Mann–Whitney or Friedman tests and post hoc Dunn’s multiple comparison test. The P‐values were calculated and the null hypothesis was denied for P‐values <0.05. GraphPad Prism 7 (GraphPad Software) was used for graphical display and statistical analysis.
Results
The ABCD2 gene is epigenetically repressed in monocytes and macrophages
Upon infiltrating the brain parenchyma, monocytes, which normally express ABCD1 but barely ABCD2, 15 differentiate into mature macrophages. Thus, we first investigated how differentiation of monocytes to macrophages affects ABCD1 and ABCD2 expression and found that also macrophages hardly express the ABCD2 gene (Fig. 1A). In contrast, ABCD1 was already highly expressed in monocytes and even further increased after differentiation with GM‐CSF, which is assumed to have pro‐inflammatory properties. 34 Interestingly, upon differentiation with M‐CSF, a cytokine required for the maintenance of most macrophage populations at steady state, 34 ABCD1 expression did not differ from that of monocytes (Fig. 1B).
Figure 1.
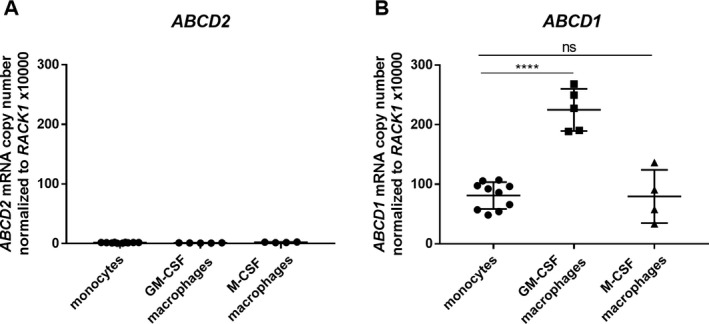
ABCD2 gene expression remains at low levels compared to ABCD1 after differentiation using GM‐CSF or M‐CSF in human monocyte‐derived macrophages. Monocytes were isolated from leukocyte concentrates derived from healthy donors by plasmapheresis and were differentiated toward macrophages with 50 ng/mL GM‐CSF or M‐CSF for 7 days. Absolute mRNA levels were determined by RT‐qPCR using standard concentration curves of plasmids containing (A) ABCD2 and (B) ABCD1 and for normalization RACK1 cDNA. Each data point represents a replicate (well) from three healthy donors (controls 1–3). For statistical analysis one‐way ANOVA and Sidak’s multiple comparison test were used. ****P < 0.0001, ns = not significant.
Unlike monocytes/macrophages, T cells highly express the ABCD2 gene. 15 In order to elucidate the underlying cause for the differential expression in these cell types, we next sought to identify potential epigenetic mechanisms that repress ABCD2 in the macrophage lineage. Data retrieved from a recent study of the differential DNA methylation patterns in human purified blood cells 35 indicated no major differences in DNA methylation within the ABCD2 promoter region that would explain the large differential expression between T cells and monocytes. Based on the low density of CpG sites in the promoter and small differences in methylation levels, we assume that DNA methylation is not causally involved in the silencing of the ABCD2 gene.
Besides DNA methylation, also histone modifications regulate gene expression. While promoter regions of actively expressed genes are characterized by high histone 3 lysine 4 tri‐methylation (H3K4me3), low histone 3 lysine 4 mono‐methylation (H3K4me1), and high histone 3 lysine 27 acetylation (H3K27ac), active enhancer regions show high H3K4me1 and H3K27ac modifications. 36 In addition, expressed genes are marked by high levels of histone 3 lysine 36 tri‐methylation (H3K36me3), which are associated with active transcription by RNA‐polymerase II within gene body regions (Fig. 2A). Importantly, H3K4me3 and H3K27ac can occur in a peak‐valley‐peak (PVP) pattern at the promoter region due to a nucleosome‐depleted region allowing promoter accessibility for transcription factors and RNA‐polymerase II. In contrast, repressed but not inactivated promoters are often marked by low H3K4me3 and H3K27ac spanning the whole promoter region (Fig. 2B). 37 Here, we compared ChIP‐Seq data sets from four different consortia that had been deposited at the IHEC 31 and found similar epigenetic patterns of the ABCD2 locus (Fig. 2C and D show exemplary data). As expected, H3K36me3, indicative of active expression, was high at intragenic regions of ABCD2 in T cells but barely detectable in monocytes/macrophages (Fig. 2C and D). At the ABCD2 promoter, T cells show a PVP of H3K4me3 and H3K27ac characteristic for active promoters. Monocytes/macrophages, however, harbor a broader single peak for H3K4me3 and H3K27ac modifications, centered at the position of the valley in the PVP of T cells, possibly indicating a cell type‐specific nucleosome positioning and repressed state of ABCD2 (Fig. 2C and D).
Figure 2.
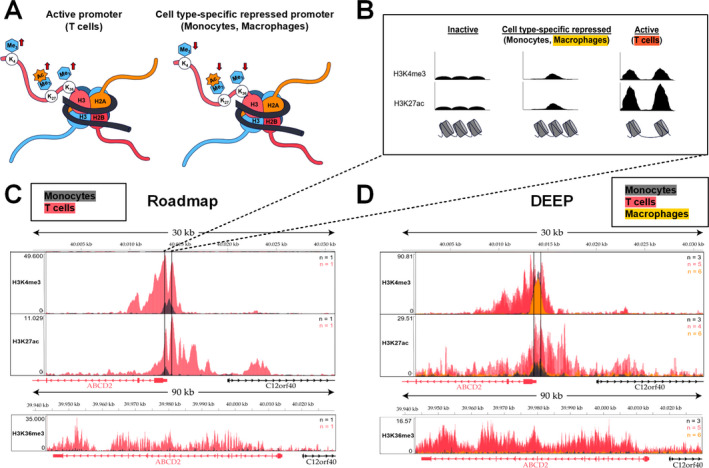
Comparison of activating histone modifications indicates a cell type‐specific repressed state of the ABCD2 promoter in monocytes and macrophages. ChIP‐Seq data of activating histone modifications retrieved from the International Human Epigenome Consortium (IHEC) were compared in human monocytes (dark grey), macrophages (orange) and T cells (red) to analyse the mechanism of differential ABCD2 expression, which is high in T cells but barely detectable in monocytes/macrophages. (A) An active promoter is characterized by high trimethylation of histone 3 lysine 4 (H3K4me3) and acetylation (ac) of H3K27. In addition, active expression of a gene is associated with high H3K36me3 marks at intragenic regions. The vice versa pattern could indicate a cell type‐specific, repressed state as indicated in the scheme. (B) Nucleosome‐free regions of DNA are easily accessible for transcription factors and the RNA‐polymerase II and, thus, depending on flanking histone modifications can be linked with an active or poised promoter. Accordingly, the analysis of ChIP‐Seq data reveals the associated characteristic peak‐valley‐peak pattern of H3K4me3 and H3K27ac at a promoter linked to active gene expression. However, a peak spanning the promoter region is associated with a repressed state, while low levels of these modifications typically indicate an inactivated state. (C, D) In the upper panel, a 30‐kb region (GRCh37; Chr 12: 40,000,000–40,031,000) surrounding the ABCD2 promoter is depicted. Within the promoter region (marked with vertical lines) data from the consortia Roadmap (C) and DEEP (D) show a typical peak‐valley‐peak pattern for H3K4me3 and H3K27ac in T cells (red) indicating an active promoter. In monocytes (dark grey) and macrophages (orange), these modifications span a broader region around the promoter. The bottom panels show elevated H3K36me3 marks at intragenic regions of ABCD2 in T cells, indicating active expression, but barely detectable signals in monocytes/macrophages in datasets from both consortia (C, D). n = number of tracks per cell type.
Vorinostat efficiently induces ABCD2 expression and improves VLCFA metabolism in X‐ALD macrophages
Our epigenetic analysis suggests that interfering with the histone modification state of the ABCD2 gene could alter its expression in macrophages. Thus, we treated macrophages from three controls with different doses of the pan‐HDAC inhibitor Vorinostat and observed a dose‐dependent increase in ABCD2 mRNA levels (Fig. 3A). At concentrations of >5 µmol/L, we noted cytotoxic effects on differentiated macrophages in a viability assay based on Calcein AM staining (data not shown). In a dose‐dependent manner, Vorinostat treatment increased the degradation rate of C26:0 in macrophages derived from healthy controls (Fig. 3B) as well as X‐ALD patients (Fig. 3C, AMN 1 and AMN 2). Next, we asked whether the increased levels of peroxisomal β‐oxidation are sufficient to reduce the accumulation of VLCFA in X‐ALD macrophages. After 5 days 2.5 µmol/L Vorinostat treatment, we observed a decrease in C26:0‐lysophosphatidylcholine (LPC) when compared to DMSO‐treated cells. It should be noted, however, that despite the average decrease in 50%, the C26:0‐LPC levels were still higher than those in untreated healthy control macrophages (Fig. 3D).
Figure 3.
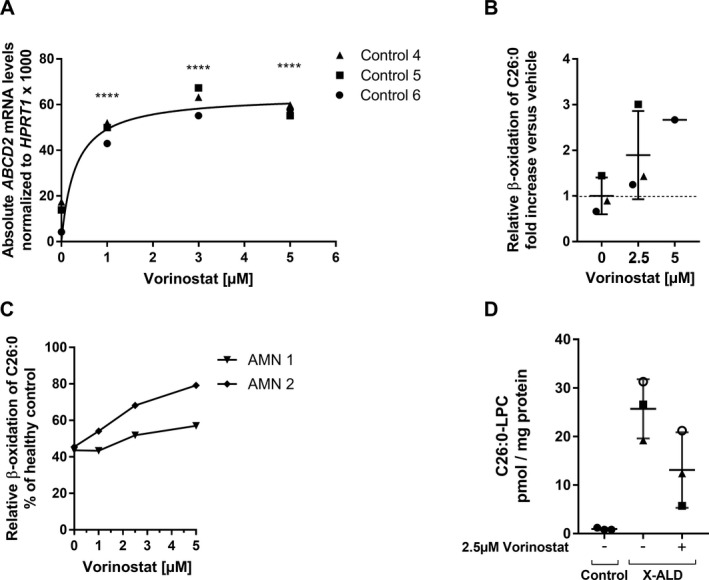
Vorinostat treatment efficiently induces ABCD2 expression, improves β‐oxidation and accumulation of the VLCFA C26:0 in healthy controls and X‐ALD macrophages. (A) Macrophages (M‐CSF) from three healthy donors (Control 4, 5, and 6) were differentiated with 50 ng/mL M‐CSF for 7 days, then treated with 1, 3, and 5 µmol/L Vorinostat for 24 h and absolute ABCD2 mRNA levels were determined and normalized to HPRT1. (B) Macrophages from three healthy donors were differentiated as described in (A) and further activated by 100 ng/mL IL‐4 to obtain activated anti‐inflammatory macrophages. In the presence of IL‐4, macrophages were treated with 2.5 µmol/L Vorinostat (n = 3) or 5 µmol/L Vorinostat (n = 1) for 48 h prior to measuring C26:0 degradation levels via β‐oxidation. The obtained β‐oxidation rates for C26:0 (pmol/min/mg protein) of the added cells are depicted as fold increase versus the mean of DMSO‐treated controls (n = 3). (C) A dose–response curve for the β‐oxidation of C26:0 was generated with 1, 2.5, and 5 µmol/L Vorinostat in macrophages (as described in (B)) from two X‐ALD patients (AMN 1 and AMN 2). The measured activities are shown as % of the DMSO‐treated healthy control (Control 10) value. (D) Macrophages (M‐CSF) from X‐ALD patients (n = 3) were stimulated with 2.5 µmol/L Vorinostat for 5 days and the levels of C26:0‐LPC (pmol/ mg protein) were measured and compared to DMSO‐treated (n = 3) or untreated healthy control (n = 3) macrophages respectively. The statistical tests, one‐way ANOVA and Dunnett’s multiple comparison, were used to analyse induction of ABCD2 in macrophages from controls (n = 3). ****P < 0.0001.
Macrophage differentiation and anti‐inflammatory properties after Vorinostat treatment
Vorinostat strongly interfered with differentiation of monocytes into macrophages, as shown by a retained monocyte‐like cell size (Fig. 4A) and a reduced number of adherent cells, typical for macrophages differentiated with M‐CSF for 7 days in vitro (Fig. 4B). We previously found that X‐ALD‐derived macrophages are less able to adapt an anti‐inflammatory state after in vitro stimulation with LPS for 24 h and especially showed increased expression of TNF and IL12B in comparison to controls. 16 Thus, we investigated how Vorinostat affects this elevated pro‐inflammatory response in X‐ALD macrophages. First, we confirmed that Vorinostat treatment induced ABCD2 expression also in LPS‐stimulated X‐ALD and control macrophages (Fig. 4C). We did not observe significant differences in the ability of ABCD2 induction between macrophages derived from X‐ALD patients and control cells. Vorinostat significantly reduced IL12B mRNA levels in macrophages derived from all seven X‐ALD patients (Fig. 4D). However, the TNF mRNA levels after Vorinostat treatment were not significantly reduced, although macrophages derived from five of seven X‐ALD patients showed a trend toward lower TNF levels (Fig. 4E). We further analysed the secretion of the cytokine IL12p40, which is encoded by IL12B and found lowered levels of IL12p40 in the supernatant of macrophages derived from three X‐ALD patients upon Vorinostat treatment (Fig. 4D). Together, these results show that Vorinostat abrogates repressed ABCD2 expression in differentiated human macrophages and partially improves the impaired ability to resolve a pro‐inflammatory status of LPS‐stimulated X‐ALD macrophages.
Figure 4.
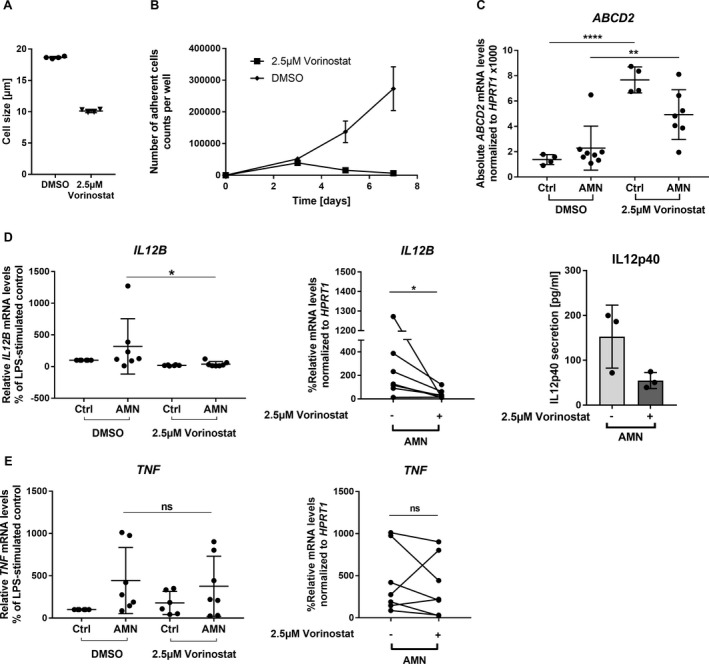
Vorinostat interferes with the differentiation of monocytes to macrophages in vitro and shows differential anti‐inflammatory effects in LPS‐activated X‐ALD macrophages. (A and B) The ability of human blood‐derived monocytes to differentiate toward macrophages when applying M‐CSF in the presence of 2.5 µmol/L Vorinostat was analysed in control macrophages using two replicates from two different donors. For the differentiation analysis, we determined (A) the mean cell size after 7 days and (B) the adherence to the cell culture plate after 3, 5, and 7 days of cultivation. (C–E) To assess whether Vorinostat can efficiently reduce the elevated pro‐inflammatory gene expression of IL12B and TNF in X‐ALD, macrophages (M‐CSF) from healthy donors and X‐ALD patients were stimulated with 100 ng/mL LPS for 24 h. In the presence of LPS, macrophages (Ctrl, n = 4 or n = 6; AMN, n = 7) were treated with 2.5 µmol/L Vorinostat or its solvent DMSO before the mRNA levels of ABCD2 (C), and the pro‐inflammatory cytokines IL12B (D) and TNF (E) were determined by RT‐qPCR and normalized to HPRT1. In addition, supernatants of stimulated macrophages were harvested and IL12p40 secretion was measured by ELISA (D). The efficacy of ABCD2 induction in control and X‐ALD macrophages was analysed by one‐way ANOVA and Sidak’s multiple comparisons test. (D and E) For comparison purposes, the levels of LPS‐treated controls were set to 100% for each experiment and the Vorinostat‐induced changes of pro‐inflammatory gene expression in X‐ALD were subjected to statistical analysis applying the nonparametric Friedman test and Dunn’s multiple comparison test. The error bars in panel (A) represent SD. *P < 0.05, **P < 0.01, ****P < 0.0001, ns = not significant.
Vorinostat partially normalized signs of neuroinflammation in an advanced CALD patient
Based on available knowledge together with our present findings, Vorinostat was offered to three boys diagnosed with CALD on compassionate use. In these patients, demyelination with Loes scores of 20, 20, and 18 points, respectively, (Fig. 5A–C) was too advanced for HSCT or HSCGT as worthwhile therapy (recommended at Loes scores < 9). All three received Vorinostat for up to 80 days (Fig. 5D–F). The dose‐limiting toxicity of Vorinostat was thrombocytopenia, which caused a transient reduction and pause (patient CALD1, Fig. 5D) or permanent withdrawal (patients CALD2 and CALD3, Fig. 5E and F) of Vorinostat. Patients CALD2 and CALD3 also experienced relevant gastrointestinal toxicity and patient CALD1, after >60 days of treatment, some limited hair loss.
Figure 5.
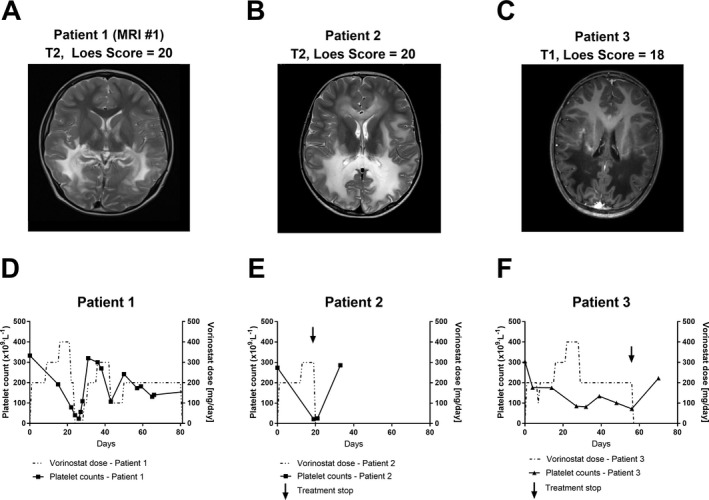
Vorinostat treatment withdrawal was required due to the severity of induced thrombocytopenia in two of three treated CALD patients who showed advanced lesions on brain MRIs. (A–C) The brain MRIs (T1‐ or T2‐weighted as indicated) obtained from three patients with advanced CALD with assigned Loes scores of 20, 20, and 18 are shown before they received 100–400 mg/day Vorinostat. (D–F) Vorinostat dose (dashed line) and platelet (thrombocyte) counts (solid line) are depicted for each patient during the treatment period. The arrow indicates the treatment stop for CALD patient 2 and 3.
Although the clinical disease status further progressed in these patients, most likely due to the advanced disease state of the patients and the short treatment period, some effects could be observed. Measurement of the VLCFA C26:0 in plasma from patient CALD1 indicated a decrease shortly after Vorinostat was started (Fig. 6A and B). Before Vorinostat treatment, the levels of total CSF protein, albumin, IgG, IgA, and IgM as well as their CSF/serum ratios were clearly increased (Table 1). This is in agreement with the observed gadolinium enhancement (not shown) along the demyelinating brain lesions (Fig. 5A, MRI#1), indicating a disruption of the BCSFB/BBB. Remarkably, after 80 days of Vorinostat treatment, the CSF levels of albumin, IgG, IgA, and IgM as well as their CSF/serum ratios were normalized (Table 1). The CSF/serum quotient of each Ig (QIg) class plotted against the CSF/serum quotient of albumin (QAlb) in the Reiber scheme allows a refined interpretation of these parameters and the relative contributions of BCSFB/BBB disruption and intrathecal antibody production. 8 The scheme for patient CALD1 before Vorinostat treatment (Fig. 6C) visualizes the BCSFB/BBB disturbance and intrathecal synthesis of all three Ig classes, while the scheme post‐treatment (Fig. 6D) shows normalization of QAlb and QIgG, QIgA and QIgM implying a restored BCSFB/BBB integrity and abrogation of neuroinflammatory signs. However, a few months later an additional brain MRI revealed expansion of the demyelinating brain lesions and gadolinium enhancement (not shown) indicating ongoing BBB breakdown (Fig. 6E, MRI#2).
Figure 6.
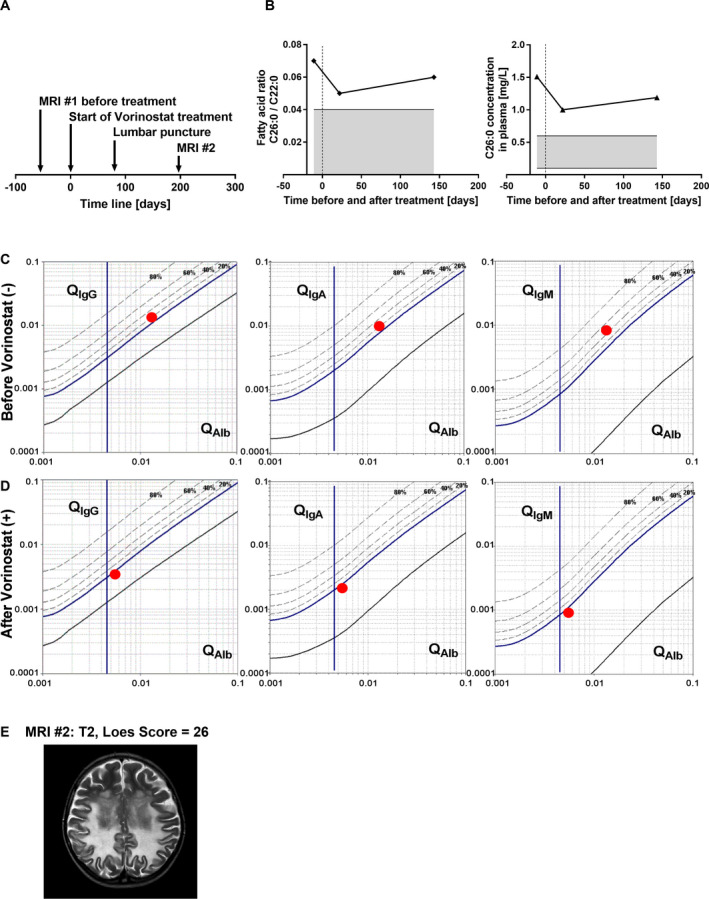
Medication with Vorinostat reversed intrathecal immunoglobulin synthesis and the disturbed BCSFB/BBB permeability but did not stop disease progression in a patient with advanced CALD. (A) As shown in the scheme, blood serum and lumbar puncture‐derived CSF were collected from patient CALD1 at the start of treatment with Vorinostat (day 0) and after 80 days of treatment and processed for analysis of albumin (Alb) and Ig levels. (B) The values of the VLCFA C26:0, measured by GC–MS, in the plasma from patient CALD1 are depicted before and during Vorinostat treatment and were normalized to the fatty acid C22:0 or are shown as mg per L plasma. The grey area indicates the normal range during physiological conditions. (C‐D) The ratios (CSF/serum level) of IgG, IgA, and IgM are plotted against the CSF/serum ratio of albumin (red dot, patient CALD1) on logarithmic scales in the Reiber Scheme, (C) before (−) and (D) after (+) Vorinostat treatment. The vertical line indicates the age‐dependent threshold for Alb permeability under physiological conditions on the x‐axis. The dashed lines indicate the percentage of intrathecal synthesis for each Ig class on the y‐axis. (E) An additional brain MRI (#2, T2‐weighted) was obtained 197 days after starting Vorinostat medication and the assigned Loes score of 26 indicated progression of the inflammatory demyelination.
Table 1.
Cerebrospinal fluid and serum levels of albumin and immunoglobulins in a patient with advanced CALD before and after Vorinostat treatment.
| Vorinostat | CSF (mg/L) | Serum (g/l) | Q (CSF/Serum) ×1000 | Local synthesis (%) 1 | |||||
|---|---|---|---|---|---|---|---|---|---|
| − | + | − | + | Normal range | − | + | − | + | |
| Total protein | 841.1 | 276.4 | − | − | − | − | − | − | |
| Albumin | 542.7 | 191.0 | 40.4 | 34.2 | 35–55 | 13.4 | 5.6 | − | − |
| IgG | 109.8 | 15.6 | 8.4 | 4.6 | 7–18 | 13.0 | 3.4 | 16.0 | 0.0 |
| IgA | 17.0 | 2.4 | 1.7 | 1.1 | 0.9–4.5 | 9.8 | 2.1 | 20.0 | 0.0 |
| IgM | 3.8 | 0.2 | 0.5 | 0.18 | 0.6–2.8 | 8.3 | 0.0 | 46.0 | 0.0 |
To further explore the origin of the observed intrathecal Ig synthesis, we analysed active demyelinating lesions in postmortem brain tissue derived from four CALD patients and compared those to control cases with intact brain tissue (Fig. 7). Immunohistochemistry revealed in addition to a high infiltration of monocytes/macrophages 16 a significant recruitment and accumulation of B cells (CD20+) in the perivascular space (Fig. 7A), however not in the brain parenchyma. In good agreement to previous studies, staining of IgG revealed few antibody‐producing plasma cells in the perivascular cuffs in one of the four CALD cases (Fig. 7B).
Figure 7.
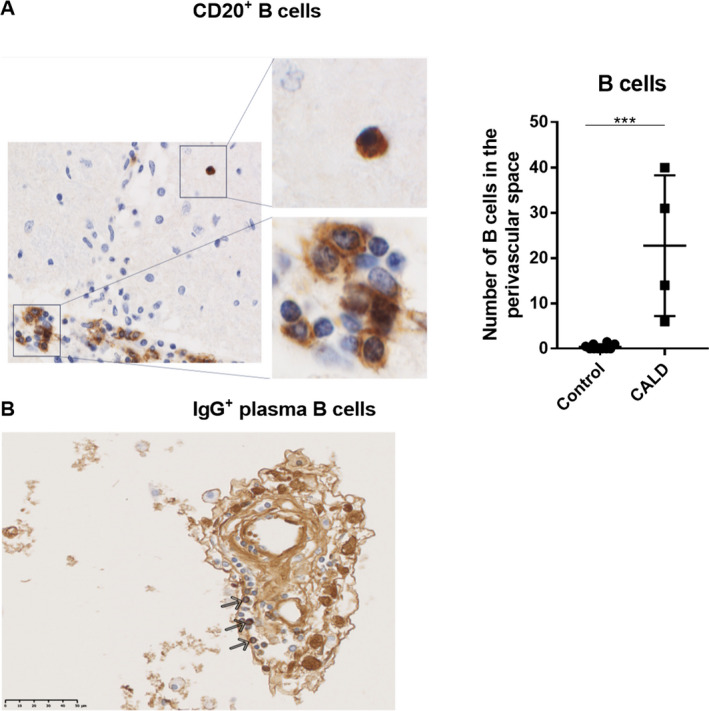
Perivascular B cell accumulation in CALD brain lesions. The light microscopy views depict immunohistochemical staining (brown) of (A) CD20+ B cells and (B) IgG+ plasma B cells (arrows) accumulating in the perivascular space in areas of active demyelinating lesions in postmortem brain tissue of a CALD patient. Perivascular CD20+ B cells were quantified in four untreated CALD cases (n = 4) and compared to controls lacking any signs of brain inflammation (n = 10). An occasional (very rare) parenchymal cell is shown in the magnified view (top right panel). For statistical analysis, the nonparametric Mann–Whitney test was performed. ***P < 0.001.
Discussion
HSCT or HSCGT can halt both inflammation and demyelination in CALD patients, but the underlying mechanism is not fully understood. However, it is believed that the predominant mechanism is mediated by donor‐derived or autologous, genetically corrected macrophages entering the inflammatory brain lesion site. 6 , 16 As other peripheral immune cells have no major metabolic defect in X‐ALD, 15 a pharmacological correction of the impaired monocyte/macrophage lineage and possibly also CNS‐resident mononuclear phagocytes (including microglial cells) appears to be a promising therapeutic strategy to correct the function of mononuclear phagocytes in X‐ALD more rapidly than HSCT or HSCGT. During HSCT, it is assumed that macrophages replace nonfunctional microglial cells in the CNS. In X‐ALD, previous reports indicated a preactivated and proapoptotic phenotype of microglial cells associated with prelesional areas. 38 , 39 , 40 Intriguingly, a recent study found positive effects of Vorinostat treatment on murine microglia of a stroke model. 41 Thus, Vorinostat could be beneficial not only for monocytes/macrophages, but also for microglial cells showing metabolic and functional defects in the context of X‐ALD.
Under healthy conditions, the brain availability of Vorinostat is probably low due to clearance of the compound by BCSFB/BBB efflux transporters. 42 In X‐ALD, however, changes have been observed in molecules associated with BBB integrity, 9 which is further disrupted with the onset of inflammatory CALD. Therefore, in X‐ALD patients, Vorinostat may reach macrophages in the brain parenchyma at efficacious doses and the therapeutic effect may further be extended to other brain cell types.
Based on our epigenetic analysis of the ABCD2 promotor, we focused on HDAC inhibitors to functionally rescue macrophages in X‐ALD. We specifically selected Vorinostat because of its property to metabolically and immunologically improve X‐ALD macrophages, which is essential for efficient clearance of myelin debris enriched in VLCFAs and, thus, contributing to an anti‐inflammatory milieu in the CALD lesions. 43 In vitro, Vorinostat lowered the secretion of the pro‐inflammatory cytokine IL12p40 in LPS‐activated X‐ALD macrophages, which is a chemoattractant mainly produced by monocytes/macrophages and regulates T cell responses. 44 In contrast, Vorinostat showed dose‐dependent effects on TNF expression, indicating that Vorinostat is not solely an anti‐inflammatory compound but depending on the dosage, has differential properties in human X‐ALD derived macrophages. In addition, Vorinostat interferes with the differentiation of monocyte‐derived cells 24 like macrophages (cf. Fig. 4), thus possibly directly lowering the number of activated monocyte‐derived macrophages entering the CALD brain parenchyma and thereby additionally reducing local proinflammatory cytokine secretion.
Based on the available data, three advanced CALD patients, not eligible for HSCT/HSCGT received compassionate Vorinostat treatment. Due to the progressed disease state of these patients, the primary goal of this off‐label application was to assess the potential of Vorinostat to interfere with disease progression, using the correction of the BCSFB/BBB integrity as a positive readout. The assessment of the CSF/serum Ig and albumin quotients demonstrated a normalization of the BCSFB/BBB integrity in patient CALD1 comparable to neurological asymptomatic X‐ALD or arrested atypical CALD patients. 8 This observation fits a previous report showing that Vorinostat positively affects the integrity of the blood‐retinal barrier in experimental autoimmune uveitis mice. 45 Three months after performing the CSF diagnostics and 3 weeks after Vorinostat discontinuation, brain MRI of patient CALD1 showed expansion of the demyelinating lesions and gadolinium enhancement. Several reasons could account for these two observations. The tightening of the BCSFB/BBB permeability after Vorinostat application might have been timely connected to Vorinostat intake and thus, might have been lost after discontinuation of the treatment. The improvement of the BCSFB/BBB permeability could also represent a temporary tightening, similar to that recently observed, although to a much lower extent, after HSCGT intervention. 12 Alternatively, the correction might have been partial, thus preventing the infiltration of larger molecules such as albumin and Igs but not of low‐MW molecules like gadolinium. In addition, the properties of the BBB as a true barrier and the BCSFB as an “educational gate” might be related to the observed disparate effects by Vorinostat. 46 Accordingly, despite the partial/temporary improvement of the BCSFB/BBB permeability, Vorinostat treatment did not halt the far advanced white matter destruction in this CALD patient. Thus, although Vorinostat seems to promptly improve the tightness of the BCSFB/BBB, beneficial effects on myelin loss may require treatment commencement at earlier disease stages.
We conclude that Vorinostat treatment may have beneficial effects on BCSFB/BBB integrity in CALD patients. However, like for HSCT/HSCGT, also a pharmacological treatment with Vorinostat seems to require a disease state that is not too far advanced. Based on these results, it is not possible to predict a positive outcome even when treatment is started at an earlier disease stage. All three CALD patients developed severe thrombocytopenia and, thus, a reduced drug intake or even an early treatment withdrawal was required. Currently, more selective HDAC inhibitors, specifically targeting class I HDACs are investigated in preclinical and clinical trials for cancer, inflammatory, and neurodegenerative diseases. Due to lower cytotoxicity with maintained anti‐inflammatory and neuroprotective effects, some of these compounds might be more suitable for CALD treatment than Vorinostat. 47 In particular, monocyte/macrophage‐selective HDAC inhibitors sparing major side effects like thrombocytopenia are highly attractive candidates for further investigations. 48 , 49 In summary, a pharmacological treatment without severe side effects, that positively affects the BCSFB/BBB and possibly ameliorates the inflammatory demyelination in CALD patients, would not necessarily be restricted to patients uneligible for HSCT or HSCGT but could represent a sequential treatment option to bridge the time gap between diagnosis and other interventions.
Conflict of Interest
We declare that we have no competing interests.
Author Contributions
Conceptualization: J Berger, I Weinhofer, and B Zierfuss; Methodology: I Weinhofer, B Zierfuss, JS Kühl, W Köhler, A Bley, K Zauner, J Binder, K Martinović, C Seiser, C Hertzberg, S Kemp, G Egger, G Leitner, J Bauer, C Wiesinger and M Kunze; Investigations: I Weinhofer, B Zierfuss, JS Kühl, W Köhler, A Bley, K Zauner, J Binder, K Martinović, C Seiser, C Hertzberg, S Kemp, G Egger, G Leitner, J Bauer, C Wiesinger, and M Kunze; Writing: I Weinhofer, B Zierfuss, J Berger, and S Forss‐Petter; Funding acquisition: J Berger, C Wiesinger.
Supporting information
Table S1. Description of controls and X‐ALD patients.
Acknowledgements
We especially thank Martina Rothe, Marianne Leisser, and Ulrike Köck for technical assistance. We acknowledge the help of Prof. Andreas Spittler from the Flow Cytometry Core Facility of the Medical University of Vienna, Austria. This work was supported by grants P26112‐B19, DK W1205, DOC 33‐B27, and P31082‐B21 from the Austrian Science Fund and the Association Européenne contre les Leucodystrophies (ELA 2018‐003I2).
Funding Information
This work was supported by grants P26112‐B19, DK W1205, DOC 33‐B27 and P31082‐B21 from the Austrian Science Fund and the Association Européenne contre les Leucodystrophies (ELA 2018‐003I2).
Funding Statement
This work was funded by Association Européenne contre les Leucodystrophies grant ELA 2018‐003I2; Austrian Science Fund grants DK W1205, P26112‐B19, P31082‐B21, and DOC 33-B27.
References
- 1. Moser HW, Smith KD, Watkins PA, et al. X‐linked Adrenoleukodystrophy In: Scriver AL, Beaudet AL, Sly WS. and Valle DCR, eds. The metabolic and molecular bases of inherited disease. pp. 3257–3301. New York: McGraw Hill, 2001. [Google Scholar]
- 2. Mosser J, Douar AM, Sarde CO, et al. Putative X‐linked adrenoleukodystrophy gene shares unexpected homology with ABC transporters. Nature 1993;361:726–730. [DOI] [PubMed] [Google Scholar]
- 3. Wiesinger C, Kunze M, Regelsberger G, et al. Impaired very long‐chain acyl‐CoA β‐oxidation in human X‐linked adrenoleukodystrophy fibroblasts is a direct consequence of ABCD1 transporter dysfunction. J Biol Chem 2013;288:19269–19279. [DOI] [PMC free article] [PubMed] [Google Scholar]
- 4. Berger J, Gartner J. X‐linked adrenoleukodystrophy: clinical, biochemical and pathogenetic aspects. Biochim Biophys Acta 2006;1763:1721–1732. [DOI] [PubMed] [Google Scholar]
- 5. Kemp S, Berger J, Aubourg P. X‐linked adrenoleukodystrophy: clinical, metabolic, genetic and pathophysiological aspects. Biochim Biophys Acta (BBA)‐Mol Basis Dis 2012;1822:1465–1474. [DOI] [PubMed] [Google Scholar]
- 6. Berger J, Forss‐Petter S, Eichler FS. Pathophysiology of X‐linked adrenoleukodystrophy. Biochimie 2014;98:135–142. [DOI] [PMC free article] [PubMed] [Google Scholar]
- 7. Kemp S, Huffnagel IC, Linthorst GE, et al. Adrenoleukodystrophy – neuroendocrine pathogenesis and redefinition of natural history. Nat Rev Endocrinol 2016;12:606–615. [DOI] [PubMed] [Google Scholar]
- 8. Korenke GC, Reiber H, Hunneman DH, Hanefeld F. Inthrathecal IgA synthesis in X‐Linked cerebral adrenoleukodystrophy. J Child Neurol 1997;12:314–320. [DOI] [PubMed] [Google Scholar]
- 9. Musolino PL, Gong Y, Snyder JM, et al. Brain endothelial dysfunction in cerebral adrenoleukodystrophy. Brain 2015;138(Pt 11):3206–3220. [DOI] [PMC free article] [PubMed] [Google Scholar]
- 10. Powers JM, Liu Y, Moser AB, Moser HW. The inflammatory myelinopathy of adreno‐leukodystrophy: cells, effector molecules, and pathogenetic implications. J Neuropathol Exp Neurol 1992;51:630–643. [DOI] [PubMed] [Google Scholar]
- 11. Cartier N, Hacein‐Bey‐Abina S, Bartholomae CC, et al. Hematopoietic stem cell gene therapy with a lentiviral vector in X‐linked adrenoleukodystrophy. Science 2009;326:818–823. [DOI] [PubMed] [Google Scholar]
- 12. Eichler F, Duncan C, Musolino PL, et al. Hematopoietic stem‐cell gene therapy for cerebral adrenoleukodystrophy. N Engl J Med 2017;377:1630–1638. [DOI] [PMC free article] [PubMed] [Google Scholar]
- 13. Raymond GV, Aubourg P, Paker A, et al. Survival and functional outcomes in boys with cerebral adrenoleukodystrophy with and without hematopoietic stem cell transplantation. Biol Blood Marrow Transplant 2019;25:538–548. [DOI] [PubMed] [Google Scholar]
- 14. Loes DJ, Hite S, Moser H, et al. Adrenoleukodystrophy: a scoring method for brain MR observations. Am J Neuroradiol 1994;15:1761–1766. [PMC free article] [PubMed] [Google Scholar]
- 15. Weber FD, Wiesinger C, Forss‐Petter S, et al. X‐linked adrenoleukodystrophy: very long‐chain fatty acid metabolism is severely impaired in monocytes but not in lymphocytes. Hum Mol Genet 2014;23:2542–2550. [DOI] [PMC free article] [PubMed] [Google Scholar]
- 16. Weinhofer I, Zierfuss B, Hametner S, et al. Impaired plasticity of macrophages in X‐linked adrenoleukodystrophy. Brain 2018;141:2329–2342. [DOI] [PMC free article] [PubMed] [Google Scholar]
- 17. Berger J, Pujol A, Aubourg P, Forss‐Petter S. Current and future pharmacological treatment strategies in X‐linked adrenoleukodystrophy. Brain Pathol. 2010;20:845–856. [DOI] [PMC free article] [PubMed] [Google Scholar]
- 18. Netik A, Forss‐Petter S, Holzinger A, et al. Adrenoleukodystrophy‐related protein can compensate functionally for adrenoleukodystrophy protein deficiency (X‐ALD): implications for therapy. Hum Mol Genet 1999;8:907–913. [DOI] [PubMed] [Google Scholar]
- 19. Pujol A, Ferrer I, Camps C, et al. Functional overlap between ABCD1 (ALD) and ABCD2 (ALDR) transporters: a therapeutic target for X‐adrenoleukodystrophy. Hum Mol Genet 2004;13:2997–3006. [DOI] [PubMed] [Google Scholar]
- 20. Muneer Z, Wiesinger C, Voigtländer T, et al. Abcd2 is a strong modifier of the metabolic impairments in peritoneal macrophages of ABCD1‐deficient mice. PLoS One 2014;9:e108655. [DOI] [PMC free article] [PubMed] [Google Scholar]
- 21. Kemp S, Wei H‐M, Lu J‐F, et al. Gene redundancy and pharmacological gene therapy: implications for X‐linked adrenoleukodystrophy. Nat Med 1998;4:1261–1268. [DOI] [PubMed] [Google Scholar]
- 22. Marks PA, Breslow R. Dimethyl sulfoxide to vorinostat: development of this histone deacetylase inhibitor as an anticancer drug. Nat Biotechnol 2007;25:84–90. [DOI] [PubMed] [Google Scholar]
- 23. Kelly WK, O’Connor OA, Krug LM, et al. Phase I study of an oral histone deacetylase inhibitor, suberoylanilide hydroxamic acid, in patients with advanced cancer. J Clin Oncol 2005;23:3923–3931. [DOI] [PMC free article] [PubMed] [Google Scholar]
- 24. Ge Z, Da Y, Xue Z, et al. Vorinostat, a histone deacetylase inhibitor, suppresses dendritic cell function and ameliorates experimental autoimmune encephalomyelitis. Exp Neurol 2013;241:56–66. [DOI] [PubMed] [Google Scholar]
- 25. Reddy P, Sun Y, Toubai T, et al. Histone deacetylase inhibition modulates indoleamine 2,3‐dioxygenase‐dependent DC functions and regulates experimental graft‐versus‐host disease in mice. J Clin Invest 2008;118:2562–2573. [DOI] [PMC free article] [PubMed] [Google Scholar]
- 26. Choi SW, Braun T, Henig I, et al. Vorinostat plus tacrolimus/methotrexate to prevent GVHD after myeloablative conditioning, unrelated donor HCT. Blood 2017;130:1760–1767. [DOI] [PMC free article] [PubMed] [Google Scholar]
- 27. Singh J, Khan M, Singh I. HDAC inhibitor SAHA normalizes the levels of VLCFAs in human skin fibroblasts from X‐ALD patients and downregulates the expression of proinflammatory cytokines in Abcd1/2‐silenced mouse astrocytes. J Lipid Res 2011;52:2056–2069. [DOI] [PMC free article] [PubMed] [Google Scholar]
- 28. Singh J, Khan M, Pujol A, et al. Histone deacetylase inhibitor upregulates peroxisomal fatty acid oxidation and inhibits apoptotic cell death in Abcd1‐deficient glial cells. PLoS One 2013;8:e70712. [DOI] [PMC free article] [PubMed] [Google Scholar]
- 29. Gondcaille C, Depreter M, Fourcade S, et al. Phenylbutyrate up‐regulates the adrenoleukodystrophy‐related as a nonclassical peroxisome proliferator. J Cell Biol 2005;169:93–104. [DOI] [PMC free article] [PubMed] [Google Scholar]
- 30. Huffnagel IC, van de Beek M‐C, Showers AL, et al. Comparison of C26:0‐carnitine and C26:0‐lysophosphatidylcholine as diagnostic markers in dried blood spots from newborns and patients with adrenoleukodystrophy. Mol Genet Metab 2017;122:209–215. [DOI] [PubMed] [Google Scholar]
- 31. Stunnenberg HG; International Human Epigenome Consortium S , Hirst M, Abrignani S, et al. The International human epigenome consortium: a blueprint for scientific collaboration and discovery. Cell 2016;167:1145–1149. [DOI] [PubMed] [Google Scholar]
- 32. Robinson JT, Thorvaldsdóttir H, Winckler W, et al. Integrative genomics viewer. Nat Biotechnol 2011;29:24–26. [DOI] [PMC free article] [PubMed] [Google Scholar]
- 33. Bauer J, Lassmann H. Neuropathological techniques to investigate central nervous system sections in multiple sclerosis. pp. 211–229. New York, NY: Humana Press, 2014. [DOI] [PubMed] [Google Scholar]
- 34. Hamilton JA, Achuthan A. Colony stimulating factors and myeloid cell biology in health and disease. Trends Immunol 2013;34:81–89. [DOI] [PubMed] [Google Scholar]
- 35. Reinius LE, Acevedo N, Joerink M, et al. Differential DNA methylation in purified human blood cells: implications for cell lineage and studies on disease susceptibility. PLoS One 2012;7:e41361. [DOI] [PMC free article] [PubMed] [Google Scholar]
- 36. Kim TK, Shiekhattar R. Architectural and functional commonalities between enhancers and promoters. Cell 2015;162:948–959. [DOI] [PMC free article] [PubMed] [Google Scholar]
- 37. Cheng J, Blum R, Bowman C, et al. A role for H3K4 monomethylation in gene repression and partitioning of chromatin readers. Mol Cell 2014;53:979–992. [DOI] [PMC free article] [PubMed] [Google Scholar]
- 38. Gong Y, Sasidharan N, Laheji F, et al. Microglial dysfunction as a key pathological change in adrenomyeloneuropathy. Ann Neurol 2017;82:813–827. [DOI] [PMC free article] [PubMed] [Google Scholar]
- 39. Bergner CG, van der Meer F, Winkler A, et al. Microglia damage precedes major myelin breakdown in X‐linked adrenoleukodystrophy and metachromatic leukodystrophy. Glia 2019;67:1196–1209. [DOI] [PMC free article] [PubMed] [Google Scholar]
- 40. Eichler FS, Ren J, Cossoy M, et al. Is microglial apoptosis an early pathogenic change in cerebral X‐linked adrenoleukodystrophy? Ann Neurol 2008;63:729–742. [DOI] [PubMed] [Google Scholar]
- 41. Li S, Lu X, Shao Q, et al. Early histone deacetylase inhibition mitigates ischemia/reperfusion brain injury by reducing microglia activation and modulating their phenotype. Front Neurol 2019;10:893. [DOI] [PMC free article] [PubMed] [Google Scholar]
- 42. Hanson JE, La H, Plise E, et al. SAHA enhances synaptic function and plasticity in vitro but has limited brain availability in vivo and does not impact cognition. PLoS One 2013;8:e69964. [DOI] [PMC free article] [PubMed] [Google Scholar]
- 43. Lohman R‐J, Iyer A, Fairlie TJ, et al. Differential anti‐inflammatory activity of HDAC inhibitors in human macrophages and rat arthritis. J Pharmacol. Exp Ther 2016;356:387–396. [DOI] [PubMed] [Google Scholar]
- 44. Cooper AM, Khader SA. IL‐12p40: an inherently agonistic cytokine. Trends Immunol 2007;28:33–38. [DOI] [PubMed] [Google Scholar]
- 45. Fang S, Meng X, Zhang Z, et al. Vorinostat modulates the imbalance of T cell subsets, suppresses macrophage activity, and ameliorates experimental autoimmune uveoretinitis. NeuroMolecular Med 2016;18:134–145. [DOI] [PubMed] [Google Scholar]
- 46. Shechter R, London A, Schwartz M. Orchestrated leukocyte recruitment to immune‐privileged sites: absolute barriers versus educational gates. Nat Rev Immunol 2013;13:206–218. [DOI] [PubMed] [Google Scholar]
- 47. Falkenberg KJ, Johnstone RW. Histone deacetylases and their inhibitors in cancer, neurological diseases and immune disorders. Nat Rev Drug Discov 2014;13:673–691. [DOI] [PubMed] [Google Scholar]
- 48. Needham LA, Davidson AH, Bawden LJ, et al. Drug targeting to monocytes and macrophages using esterase‐sensitive chemical motifs. J Pharmacol Exp Ther 2011;339:132–142. [DOI] [PubMed] [Google Scholar]
- 49. Das Gupta K, Shakespear MR, Iyer A, et al. Histone deacetylases in monocyte/macrophage development, activation and metabolism: refining HDAC targets for inflammatory and infectious diseases. Clin Transl Immunol 2016;5:e62. [DOI] [PMC free article] [PubMed] [Google Scholar]
Associated Data
This section collects any data citations, data availability statements, or supplementary materials included in this article.
Supplementary Materials
Table S1. Description of controls and X‐ALD patients.


