Abstract
In eukaryotes, mature mRNA is formed through modifications of precursor mRNA, one of which is 5’ cap biosynthesis, involving RNA cap guanine‐N7 methyltransferase (N7‐MTase). N7‐MTases are also encoded by some eukaryotic viruses and facilitate their replication. N7‐MTase inhibitors have therapeutic potential, but their discovery is difficult because long RNA substrates are usually required for activity. Herein, we report a universal N7‐MTase activity assay based on small‐molecule fluorescent probes. We synthesized 12 fluorescent substrate analogues (GpppA and GpppG derivatives) varying in the dye type, dye attachment site, and linker length. GpppA labeled with pyrene at the 3’‐O position of adenosine acted as an artificial substrate with the properties of a turn‐off probe for all three tested N7‐MTases (human, parasite, and viral). Using this compound, a N7‐MTase inhibitor assay adaptable to high‐throughput screening was developed and used to screen synthetic substrate analogues and a commercial library. Several inhibitors with nanomolar activities were identified.
Keywords: cap, fluorescent probes, high-throughput screening, methyltransferases, pyrenes
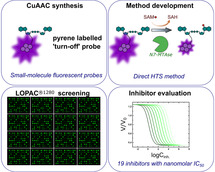
Methyltransfer erasers: m7G cap biosynthesis is an important step in mRNA maturation, involving mRNA cap guanine‐N7 methyltransferase, which is a potential target for antiviral and anticancer therapies. This is the first report of a direct HTS, fluorescence‐based method for monitoring of the N7‐methylation process and the selection of specific N7‐methyltransferase inhibitors.
Introduction
In eukaryotic cells, before a newly synthesized mRNA is translated into the protein, it undergoes a series of modifications (mRNA maturation), occurring both co‐ and post‐transcriptionally. One step of mRNA maturation involves the addition of a so‐called cap structure at the 5’‐end. The cap is composed of a positively charged nucleobase, N7‐methylguanosine, and a negatively charged 5’,5’‐triphosphate bridge, which are involved in interactions with specific proteins and regulate many crucial processes, including translation initiation and mRNA transport and turnover.1
The biosynthesis of the cap engages three enzymes. First, RNA 5’‐triphosphatase (TPase) hydrolyzes the bond between the β‐ and γ‐phosphates of the RNA 5’‐triphosphate. Then, guanylyltransferase (GTase) transfers the GMP moiety from GTP to the RNA 5’‐end to produce GpppRNA.2 The final step is the methylation of the guanosine at the N7 position by mRNA cap guanine‐N7 methyltransferase (N7‐MTase), which transfers the methyl group from S‐adenosyl‐l‐methionine (SAM) to Gppp‐capped RNA and releases S‐adenosyl‐l‐homocysteine (SAH) as a by‐product. This mechanism is conserved in all eukaryotic organisms and involves nucleophilic substitution with SAM, as an electrophile, providing the methyl group for the nucleotide N7 position, a nucleophile.3 The catalytic mechanism requires approximation of the substrate and a proper orientation of the cap N7‐nucleophile toward S‐CH3.4
In mammals, the first two capping steps are catalyzed by a bifunctional capping enzyme (CE) that possesses the activity of both TPase and GTase.5 Human mRNA cap N7‐MTase (RNMT) is a nuclear protein consisting of a catalytic domain and N‐terminal domain.6 The latter is not required for catalytic activity, but is responsible for binding the RNMT‐activating miniprotein (RAM), which stabilizes the catalytically optimal RNMT structure.7 Reduced RNMT activity has recently been reported to inhibit the proliferation and to increase the apoptosis of breast cancer cells.8 Hence, RNMT–RAM is a promising target for anticancer therapy.
Eukaryotic viruses also cap their mRNAs to mask them from the innate immune system and increase the expression of pathogenic proteins.9 Some viruses (e.g., adenovirus and herpesvirus) are dependent on host enzymes to cap their mRNAs,3, 10 whereas others encode their own proteins to cap mRNA.11 The latter use capping mechanisms that are either analogous to eukaryotic mRNA capping or rely on mechanistically distinct pathways.12 For instance, in alphaviruses, N7‐MTase transfers the methyl group directly to the GTP molecule, and the resultant m7GTP is incorporated into the 5’‐end of mRNA,11 whereas nonsegmented negative‐sense viruses incorporate GDP instead of GMP during cap biosynthesis.13 Poxviruses (including vaccinia virus and African swine fever virus) encode trifunctional mRNA CEs, which possess all three activities (TPase, GTase, and N7‐MTase).12, 14 The vaccinia CE (VCE) is a heterodimeric protein consisting of two subunits, D1, which is responsible for the activity, and D12, stimulating substrate binding by D1.15 Coronaviruses (CoVs) also use their own capping mechanism, which is still not fully understood but presumably resembles that of alphaviruses or conventional capping.16 Nonstructural protein nsp14 has been identified as having an N7‐MTase activity in the severe acute respiratory syndrome CoV.17 Their reliance on their own enzymatic apparatus to cap mRNA makes viral N7‐MTases potential targets for the treatment of many viral infections. In flaviviruses (e.g., dengue, West Nile, and Zika viruses), widely known for their pathogenic effects, NS5 RNA MTases are necessary for virus replication and have already been tested as potential drug targets.18, 19
N7‐MTases are also considered drug targets in parasite infections.20 Ecm1 from Encephalitozoon cuniculi is one of the best characterized parasitic N7‐MTases and also the smallest known N7‐MTase, and is thus often used as a model protein.21 Ecm1 is also known for its ability to transfer groups larger than methyl, thereby allowing the modification of the cap N7 position with, for example, bioorthogonal functional groups such as allyl, alkyne, or azide, which can be further used for fluorescent labeling and mRNA imaging within the cell.22
Because of the significant therapeutic potential of N7‐MTases, finding new potent and selective N7‐MTase inhibitors is of great interest. Several SAM and SAH analogues (e.g., the naturally occurring nucleoside sinefungin) have been reported to inhibit the activity of various N7‐MTases.23, 24 However, targeting the SAM‐binding pocket is nonspecific and increases toxicity.25 Designing inhibitors that target the RNA cap‐binding site in N7‐MTases could afford more‐specific inhibition. Some nucleotide‐like inhibitors, based on the exploration of specific features of the N7‐MTase binding pocket, have already been reported.26, 27 In order to find new N7‐MTase inhibitors, cost‐effective methods, suitable for high‐throughput experiments, are required. However, designing N7‐methylation assays is demanding, as the natural substrate for most N7‐MTases is GpppRNA, the large‐scale synthesis of which is challenging.28 To overcome this problem, ligation of two shorter RNA fragments has been proposed.29 Other approaches to the discovery N7‐MTase inhibitors employ radiolabeled substrates, such as [methyl‐3H]‐SAM26, 28 or 32P‐labeled GpppA‐RNA.19 However, the disadvantages of these methods are the use of radioactivity and the necessity of separating substrates and products by thin‐layer chromatography. Other methods include fragment‐based X‐ray crystallographic screening30 and whole‐cell yeast‐based screening.31, 32 A competitive fluorescent immunoassay, based on fluorescence polarization and using a SAH antibody, has also been reported,33 and BODIPY‐labeled GTP was applied in a fluorescence polarization assay to identify dengue virus MTase inhibitors targeting the GTP‐binding site.34 A time‐resolved fluorescence method for studies on SARS‐nsp14 enzyme has also been developed.35
All of these methods provided insights into N7‐MTase activity and inhibition. However, to the best of our knowledge, there is no direct method allowing N7‐MTase activity to be monitored in real‐time by using small molecular probes. In this study, we sought to develop a fluorescent assay for direct monitoring of mRNA cap N7‐MTase activity that relies on structurally simple substrates and is adaptable to HTS inhibitor discovery. To this end, we used three model N7‐MTases, a human RNMT–RAM, the parasite Ecm1 enzyme, and VCE. The methodology was initially optimized for Ecm1 and then adapted to RNMT–RAM and VCE. As our preliminary experiments indicated that a dinucleotide is a minimal substrate for efficient catalysis (Figure S1 in the Supporting Information),23 we focused on fluorescently labeled GpppA and GpppG analogues as potential substrates that represent a reasonable compromise between structural complexity and the requirements of the enzyme. We aimed to identify probes that change emission properties upon N7‐methylation (Figure 1) and screen various fluorescent tags, followed by the optimization of the position and type of the dye attached (linker length) for the best hit. The optimized structure was then used to demonstrate its utility for the development of HTS inhibitor discovery assay based on direct fluorescence intensity (FLINT) measurements.
Figure 1.
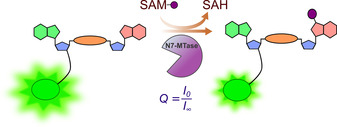
The principle of monitoring N7 methylation by using a fluorescence‐based approach.
Results
Synthesis
To select the most suitable fluorescent dye for probe development, we synthesized a set of alkyne‐functionalized precursors (compounds 1–5) which were subsequently converted into various fluorescent probes (compounds 6–10). We began with the synthesis of seven GpppA derivatives functionalized at the adenosine moiety (compounds 6 a–g; Figure 2). To this end, a GpppA analogue equipped with an alkyne handle (1) was synthesized in a few steps, starting from an appropriate ADP precursor functionalized with propargylamine at the 3’‐O position (Figure S2). P‐imidazolide of (N‐propargyl)‐3’‐carbamoyloadenosine diphosphate36 was coupled with the triethylammonium salt of GMP in DMF, with MgCl2 as a reaction mediator, to give 1, which was purified by semipreparative RP‐HPLC in 41 % yield. Compound 1 was transformed into fluorescently labeled probes 6 a–g in CuAAC reactions with azide‐functionalized fluorescent dyes (Figure 2 A). The reactions were carried out in a DMSO/H2O solution (ratio dependent on the fluorescent tag solubility) under standard catalytic conditions (copper(II) sulfate/sodium‐l‐ascorbate mixture). To quench the reactions, an aqueous solution of ethylenediaminetetraacetic acid disodium salt was added. The probes were purified by analytical or semipreparative HPLC (Table S1). The other alkyne‐functionalized GpppA and GpppG analogues (2–4) and corresponding probes (7–9) were synthesized by using a similar approach and previously reported functionalization strategies (Figure S2A, B).36, 37 Additionally, the product analogue 5 was synthesized by N7‐methylation of compound 1 and functionalized to yield probes 10 a,b (Figure S2C). The structures of the fluorescent nucleotides were confirmed by HRMS. For nonfluorescent precursors, 1H, 31P, and 1H,1H COSY NMR spectra were additionally recorded (see the Supporting Information).
Figure 2.
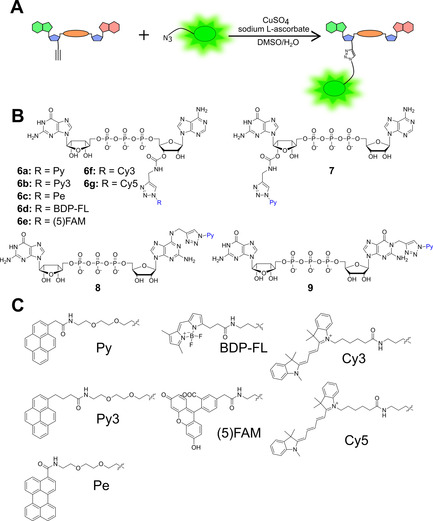
A) Synthesis of fluorescently labeled dinucleotide cap analogues. B) Structures of the fluorescent probes synthesized in this work. C) Structures of tested dyes.
Overall, a set of 12 fluorescently labeled nucleotides was synthesized (Figure 2 B). Different fluorescent dyes were tested for labeling at the adenosine 3’‐O position, including pyrene (Py, 6 a; Py3, 6 b), perylene (Pe, 6 c), boron dipyrromethene analogue (BDP‐FL, 6 d), 5‐carboxyfluorescein (5‐FAM, 6 e), cyanine 3 (Cy3, 6 f), and cyanine 5 (Cy5, 6 g; Figure 2 C). Different Py‐labeling positions were also explored, including the 2’‐O/3’‐O positions of guanosine (7), N6 position of adenosine (8), and N1 position of guanosine (9). The effect of linker elongation was also explored for one probe (6 b).
Preliminary spectroscopic and enzymatic studies
We next characterized the spectroscopic properties of GpppA‐derived fluorescent probes 6 a–g by registering their absorption, fluorescence excitation, and emission spectra. For all the compounds, the spectral shape and absorption maxima were analogous to those of isolated fluorescent tags (Figure S3, Table 1). The Py‐modified probe 6 a showed only monomer emission at the studied concentrations (<10 μm).
Table 1.
Spectral properties of fluorescently labeled GpppA and GpppG analogues.[a]
|
Compound |
λ max [nm] |
λ max [nm] |
QY [%] |
Q Ecm1 [−] |
|---|---|---|---|---|
|
abbreviation (no.) |
Absorption |
Emission |
|
|
|
Gp3A‐3’‐O‐Py (6 a) |
330, 345 |
378, 398 |
12.3±0.3 |
1.5 |
|
Gp3A‐3’‐O‐Py3 (6 b) |
330, 345 |
378, 398 |
29.8±0.5 |
3.4 |
|
Gp3A‐3’‐O‐Pe (6 c) |
418, 443 |
493 |
99.8±0.9 |
1.0 |
|
Gp3A‐3’‐O‐BDP‐FL (6 d) |
505 |
513 |
54.8±0.1 |
1.0 |
|
Gp3A‐3’‐O‐5‐FAM (6 e) |
498 |
528 |
44.7±0.3 |
1.0 |
|
Gp3A‐3’‐O‐Cy3 (6 f) |
545 |
563 |
49.2±0.1 |
1.1 |
|
Gp3A‐3’‐O‐Cy5 (6 g) |
642 |
660 |
22.6±0.9 |
1.1 |
|
2’‐O/3’‐O‐Py‐Gp3A (7) |
330, 345 |
378, 398 |
11.4±0.3 |
1.1 |
|
Gp3A(N6)‐Py (8) |
330, 345 |
378, 398 |
14.9±0.4 |
1.1 |
|
Gp3G(N1)‐Py (9) |
330, 345 |
378, 398 |
3.9±0.1 |
1.1 |
|
m7Gp3A‐3’‐O‐Py (10 a) |
330, 345 |
378, 398 |
6.57±0.03 |
product[b] |
|
m7Gp3A‐3’‐O‐Py3 (10 b) |
330, 345 |
378, 398 |
4.01±0.02 |
product[b] |
[a] Data are the means±SD of three independent experiments. [b] Obtained by chemical synthesis. Q Ecm1: quenching factor for N7‐methylation reaction by Ecm1. QY: quantum yield.
Subsequently, we subjected probes 6 a–g to enzymatic N7‐methylation by using Ecm1 as a model enzyme to identify those that could act as FLINT probes. Each probe was incubated with Ecm1 (10 nm) in the presence of excess SAM (Figure 3 A), and FLINT was measured time dependently at the dye emission maximum. To quantify FLINT changes, a quenching factor (Q) was determined for each probe as the ratio of FLINT before and after complete N7‐methylation. If Q was <1, the compound was a turn‐on FLINT probe; if Q was >1, the compound was a turn‐off FLINT probe; and if Q was ≈1, the compound was not a FLINT probe, which could result from either an absence of fluorescence changes or the lack of the enzymatic reaction. Among all the studied probes, only a Py‐labeled probe (6 a) showed a Q value >1 (≈1.5; Table 1). This result indicated that the fluorescence of Py was stronger quenched by interactions with an N7‐methylated (product) than non‐methylated (substrate) guanosine. Hence, we selected Py as the most suitable label and focused on maximizing the response. We evaluated a series of ribose and nucleobase functionalized dinucleotides, such as Py‐labeled GpppN at the 2’‐O/3’‐O position of guanosine (7), N6 position of adenine (8), and N1 position of the second guanine in GpppG (9). For each probe, we determined Q and found that only probe 6 a notably changed its FLINT upon incubation with SAM and Ecm1 (Figure 3 B).
Figure 3.
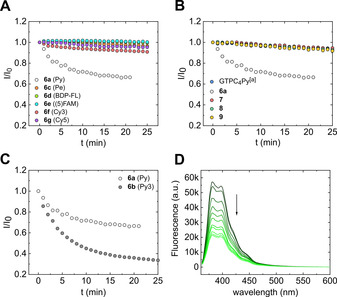
Structural optimization of fluorescent probes for N7‐MTases by measuring fluorescence intensity changes at the emission maximum during incubation of different probes with Ecm1: A) Gp3A analogues labeled with the indicated fluorescence tags at the adenosine ribose moiety (2 μm), SAM (50 μm) and Ecm1 (10 nm); B) Py‐labeled Gp3A functionalized at different positions: adenosine ribose (6 a), guanosine ribose (7 a), and the N6 position of adenine (8) or Gp3G functionalized at the N1 position (9; 2 μm), SAM (50 μm) and Ecm1 (10 nm). [a] Compound GTPC4Py is a GTP molecule labeled with Py via terminal butynyl‐C‐phosphonate group and was taken from fluorescent probes library described in Kasprzyk[40]; C) Py‐labeled Gp3A analogues differing in the length of the linker between Py and the cap moiety (2 μm), SAM (50 μm) and Ecm1 (10 nm); D) Emission spectra registered at 1‐min intervals during incubation of probe 6 b (2 μm) with SAM (50 μm) and the Ecm1 enzyme (10 nm).
Probes 7, 8, and 9 showed virtually no changes in fluorescence (Figure 3 B), although all of them were N7‐methylated to some extent, as independently determined using HPLC‐MS (Figure S4). Finally, we tested the influence of the length of the linker connecting Py and the 3’‐O position of adenosine ribose and found that a longer linker (Py3, 6 b) led to a more than twofold increase in the response upon N7‐methylation compared to probe 6 a (Figure 3 C).
To additionally confirm our observations that FLINT values of probes 6 a and 6 b decreased over time as a result of enzymatic N7‐methylation, we synthesized two N7‐methylated fluorescent probes (10 a and 10 b) and determined their quantum yields (QYs; Table 1) using a comparative method.38 QYs of m7GpppA‐derived probes were two to seven times lower than those of their non‐methylated forms. This finding also indicated that the largest difference between the substrate and the product of the enzymatic N7‐methylation reaction could be expected for probe 6 b (QY: 29.8 % vs. 4.0 % for 10 b).
Eventually, we selected 6 b as the most suitable fluorescent probe for the development of a FLINT assay.
Development of an activity assay
To optimize the N7‐MTase assay conditions, we characterized steady‐state parameters for the methylation of probe 6 b by Ecm1 and RNMT–RAM. To this end, probe 6 b was incubated at concentrations of 0–15 μm with SAM as a cosubstrate (50 μm for Ecm1 or 20 μm for RNMT–RAM) and the enzymes (10 nm Ecm1, 20 nm RNMT–RAM) at 30 °C, and FLINT was measured over time. We did not include SAH degrading enzymes in the assay, as we assumed that product inhibition will be negligible in the initial phase of the reaction. The initial reaction rates were plotted as a function of the probe concentration, followed by fitting to the Michaelis–Menten equation and the determination of kinetic parameters (K M, V max, and k cat; Figure 4 A). The calculated K M values were in the micromolar range for both enzymes: 22.0±2.4 μm for Ecm1 and 11.4±2.8 μm for RNMT–RAM (Table 2). Based on these results, we established the probe concentration at 2 μm, which was slightly lower than both K M values. The catalytic effectiveness of the enzymes (k cat/K M value)39 was 0.075 s−1⋅μm −1 for Ecm1 and 0.014 s−1⋅μm −1 for RNMT–RAM. The values suggested that probe 6 b was better accepted as a substrate by the Ecm1 enzyme than by RNMT–RAM.
Figure 4.
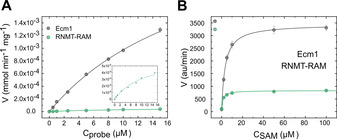
Steady‐state kinetic parameters for N7‐methylation of probe 6 b catalyzed by Ecm1 and RNMT–RAM. A) Initial rate as a function of probe 6 b concentration in the presence of the SAM cosubstrate and the N7‐MTases: 10 nm Ecm1/50 μm SAM or 20 nm RNMT–RAM/20 μm SAM. B) Initial rate as a function of SAM cosubstrate concentrations in the presence of 2 μm of probe 6 b and the N7‐MTases: Ecm1 (10 nm) and RNMT–RAM (20 nm). Data are the mean±SD of three independent experiments. Calculated kinetic parameters are shown in Table 2.
Table 2.
Steady‐state kinetic parameters for Ecm1 and RNMT–RAM catalysis of N7‐methylation of probe 6 b.
|
Enzyme |
K M |
V max |
k cat |
k cat/K M |
|---|---|---|---|---|
|
|
[μm][a] |
[mmol min−1 mg−1][a] |
[s−1][a] |
[s−1⋅μm −1][a] |
|
Ecm1 (10 nm) |
22.0±2.4 |
(3.13±0.24)×10−13 |
1.64±0.13 |
0.074±0.010 |
|
RNMT–RAM |
11.4±2.8 |
(0.065±0.001)×10−3 |
0.160±0.025 |
0.014±0.004 |
|
(20 nm) |
Conditions: [a] 0–15 μm probe 6 b; 20 μm SAM for RNMT–RAM and 50 μm SAM for Ecm1.
To set the concentration of the SAM cosubstrate, we investigated the saturating concentrations for Ecm1 and RNMT–RAM N7‐MTases in the presence of set concentration of probe 6 b (Figure 4 B). The final concentrations of the cofactor (SAM) used in the assay were then set to the values from the higher plateau. Finally, we established that the optimal conditions to monitor N7‐MTase activity were: 2 μm probe 6 b, 50 μm SAM, and 10 nm Ecm1 or 2 μm probe 6 b, 20 μm SAM, and 20 nm RNMT–RAM (Tables S2 and S3).
For the optimized conditions, we determined z‐factor values to validate our Ecm1 and RNMT–RAM activity assays and to establish their suitability for HTS experiments. To this end, we measured changes in FLINT at 1‐minute intervals for a set of 153 (for Ecm1) or 132 (for RNMT–RAM) positive and negative control samples. The positive control samples (no inhibition) consisted of a solution of probe 6 b in the presence of SAM and an appropriate enzyme. The negative controls additionally contained a universal MTase inhibitor, sinefungin (25 μm for Ecm1 and 30 μm for RNMT–RAM). The z factors for both assays (0.74 for Ecm1 and 0.67 for RNMT–RAM; Figure S5) met the criterion (z>0.5) for an HTS method; hence, both assays were found to be suitable for the screening of compound libraries.
Inhibition studies
Preliminary inhibitor screenings against Ecm1 and RNMT–RAM were performed using an in‐house library of substrate analogues. To this end, a series of GpppA derivatives substituted at the C8 or C6 position of guanosine were synthesized (Figure S6). We tested C8‐methyl, C8‐trifluoromethyl, and C8‐phenyl modifications, as well as a 6‐S substitution of guanosine. To verify the effect of the second nucleotide on inhibitory properties, we also examined a 6‐SGDP mononucleotide.
Probe 6 b (2 μm), an enzyme (10 nm Ecm1 or 20 nm RNMT–RAM), and SAM (50 or 20 μm, respectively) were incubated with half‐log dilutions of a potential inhibitor (0.003 nm to 100 μm), and the reaction progress was monitored by reading FLINT at 378 nm (excitation at 345 nm) at 1‐minute intervals. The initial rates were plotted as a function of the inhibitor concentration, and the data were fitted to a four‐parameter dose‐response curve (Hill equation) to determine IC50 values (Figure 5, Table 3). The calculated IC50 values varied for Ecm1 from 14 nm to 32.6 μm, and p values (Hill slope) varied from −2.6 to −0.8 (Table 3). We found C8‐methyl‐modified GpppA to be the most potent N7‐MTase inhibitor among the tested compounds. We also observed that 6‐SGpppA was a stronger inhibitor of Ecm1 than was 6‐SGDP, which indicated that the presence of the second nucleotide is important for inhibitory properties. In general, the inhibitory potency decreased in the order 8‐Me>8‐CF3>6‐S>8‐Ph> unmodified, that is, GpppA was the weakest of the tested inhibitors. Hence, we concluded that C8‐ and 6‐S‐substituted guanine nucleotides were a promising group of N7‐MTase inhibitors.
Figure 5.
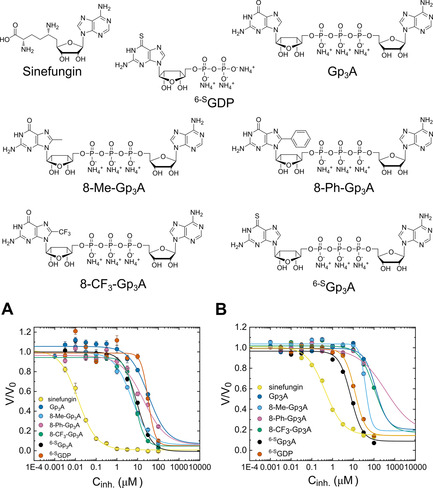
Inhibition of A) Ecm1 and B) RNMT–RAM N7‐MTase activity toward probe 6 b by selected substrate analogues and sinefungin. All reaction mixtures contained probe 6 b (2 μm) and either SAM (50 μm), Ecm1 (10 nm) or SAM (20 μm), RNMT–RAM (20 nm) in 50 mm Tris⋅HCl buffer (pH 7.5). The mixtures were incubated at 30 °C in a 96‐well plate. The fluorescence measurements were carried out for excitation at 345 nm and emission at 378 nm by using plate reader. Data are the mean±SD of three independent experiments. The determined IC50 and Hill slope values are shown in Table 3.
Table 3.
IC50 and p values obtained in the N7‐methylation activity assay (both Ecm1 and RNMT–RAM) for five selected potential inhibitors and GpppA and sinefungin as a control.[a]
|
Compound |
Ecm1 |
RNMT–RAM |
||
|---|---|---|---|---|
|
|
IC50 (μm) |
p |
IC50 (μm) |
p |
|
Gp3A |
32.6±3.4 |
−1.0±0.2 |
>100 |
n.d. |
|
8‐Me‐Gp3A |
5.21±0.68 |
−1.0±0.1 |
39.3±7.6 |
≈−2.0 |
|
8‐Ph‐Gp3A |
19.4±3.5 |
−0.8±0.1 |
>100 |
n.d. |
|
8‐CF3‐Gp3A |
7.33±0.54 |
−1.9±0.2 |
104±14 |
−1.2±0.2 |
|
6‐SGDP |
32.1±2.1 |
−2.6±0.6 |
12.0±1.0 |
−1.7±0.2 |
|
6‐SGp3A |
8.93±0.81 |
−1.3±0.1 |
7.55±1.00 |
−1.5±0.3 |
|
Sinefungin |
0.014±0.002 |
−1.0±0.1 |
0.44±0.06 |
−1.0±0.1 |
[a] Data are the means±SD of three independent experiments.
The determined IC50 values for the human enzyme RNMT–RAM were 5 to 30 times higher than those for Ecm1. The only exception was 6‐SGp3A, which was a better inhibitor for RNMT–RAM than it was for Ecm1. This finding suggested that the 6‐S modification was more suitable for RNMT–RAM inhibition. For both enzymes, sinefungin was the strongest inhibitor, with the IC50 value of two (Ecm1) or one (RNMT–RAM) order of magnitude lower than that for the best nucleotide inhibitor (8‐Me‐GpppA or 6−SGpppA, respectively). However, sinefungin, as a SAM analogue, is not a selective inhibitor and can influence a number of different MTases. Properly designed nucleotide compounds with a substrate‐like structure have a better chance to selectively inhibit N7‐MTases only. Therefore, further exploration of nucleotide modifications could be beneficial for drug design.
We next used our method to screen a commercially available library of pharmacologically active compounds (LOPAC®1280) against Ecm1. The experiments were carried out under optimized conditions, that is, 2 μm probe 6 b, 50 μm SAM, and 10 nm Ecm1 in 50 mm Tris⋅HCl, pH 7.5. The compounds were screened at 10 μm. The experiments were carried out in a 96‐well plate format, wherein each plate contained 80 test compounds and 16 control wells. Fourteen of the 1280 test compounds showed interference with Py fluorescence and had to be tested on a separate plate. Relative reaction progress values were calculated by normalizing the initial rate to the maximum initial rate, without an inhibitor (Figure 6 A). The candidate selection cutoff was set at 10 % of the maximum reaction rate, leading to the identification of 56 potential hits. The hits were further evaluated for their IC50 values (Figure 6 B, Tables 4 and S4). Consequently, 14 compounds showed IC50 values below 400 nm, of which four compounds had IC50 values <50 nm. The most potent inhibitor was a suramin analogue, NF 023, with an IC50 value of 15 nm, which was similar to that of sinefungin (14 nm). The other three most potent inhibitors were aurintricarboxylic acid (AA), reactive blue 2, and suramin (Figure 7 A, Table 4). Another group of identified N7‐MTase inhibitors included three small molecules consisting of aromatic rings modified with hydroxyl groups, namely, galloflavin (IC50=120±20 nm), quercetin (IC50=120±20 nm), and myricetin (IC50=140±10 nm). Using RP‐HPLC analysis, we independently confirmed that each of these compounds inhibited the N7‐methylation process (Figures S7 and S8).
Figure 6.
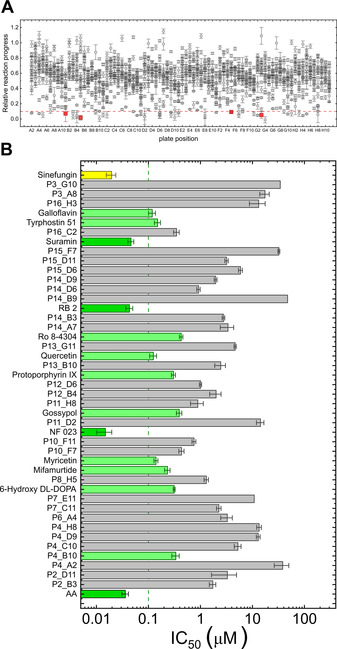
A) Relative reaction progress of Ecm1‐catalyzed N7‐methylation of probe 6 b in the presence of 1280 compounds from the LOPAC®1280 library. Data are the mean±SD of two independent experiments. Data point for four most potent found inhibitors are highlighted in red; B) IC50 values of selected compounds against Ecm1 N7‐MTase activity for 6 b (relative reaction progress ≤10 %) and sinefungin as a control. Dark green columns are for inhibitors with IC50 < 50 nm, light green for inhibitors with IC50 between 50 nm and 500 nm and yellow for sinefungin control. Data are the mean±SD of two or three independent experiments. The determined IC50 values are shown in Table S4.
Table 4.
IC50 values obtained in the N7‐methylation activity assay (Ecm1, RNMT–RAM, and VCE) for eight selected potential inhibitors and sinefungin as a control.[a]
|
Compound |
IC50 [μm] |
||
|---|---|---|---|
|
|
RNMT–RAM |
Ecm1 |
VCE |
|
aurintricarboxylic acid |
0.47±0.01 |
0.031±0.005 |
n.d. |
|
NF 023 |
1.80±0.33 |
0.015±0.005 |
n.d. |
|
reactive blue 2 |
3.30±0.73 |
0.043±0.007 |
n.d. |
|
suramin |
0.70±0.08 |
0.046±0.006 |
0.083±0.015 |
|
galloflavin |
n.d. |
0.12±0.02 |
n.d. |
|
quercetin |
n.d. |
0.12±0.02 |
n.d. |
|
myricetin |
n.d. |
0.14±0.01 |
n.d. |
|
8‐Me‐Gp3A |
39.3±7.6 |
5.21±0.68 |
31.0±6.8 |
|
sinefungin |
0.53±0.07 |
0.014±0.002 |
0.078±0.026 |
[a] Data are the means±SD of two or three independent experiments.
Figure 7.
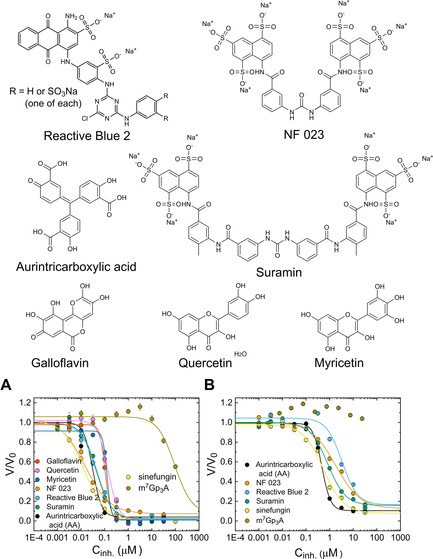
Inhibition of N7‐MTase activities of A) Ecm1 and B) RNMT–RAM toward 6 b by the most potent selected substrate analogues and sinefungin. All reaction mixtures contained probe 6 b (2 μm) and either SAM (50 μm), Ecm1 (10 nm) or SAM (20 μm), RNMT–RAM (20 nm) in 50 mM Tris⋅HCl buffer (pH 7.5). The mixtures were incubated at 30 °C in a 96‐well plate reader. The fluorescence measurements were carried out for excitation at 345 nm and emission at 378 nm. Data are the mean±SD of two or three independent experiments. The determined IC50 and Hill slope values are shown in Table 4.
Selected Ecm1 inhibitors from the LOPAC®1280 library were next tested against RNMT–RAM (Figure 7 B, Table 4). The IC50 values for RNMT–RAM were approximately one order of magnitude higher than those for Ecm1, similar to the previous results for the GpppA‐based inhibitors. Finally, the same methodology was used to evaluate selected compounds with VCE (Figure S9). In this case, IC50 values were determined for three inhibitors identified in studies with the two other enzymes, suramin from the LOPAC®1280 library, 8‐Me‐GpppA from the substrate minilibrary, and sinefungin. The experiment was carried out as previously for Ecm1, with 2 μm probe 6 b, 50 μm SAM, and 5U of VCE incubated with half‐log dilutions of the inhibitors (Figure S10). We found no direct correlation between the IC50 values determined for VCE and Ecm1. After normalizing the IC50 values of the most potent inhibitors to the values of sinefungin for all three N7‐MTases, we concluded that while NF 023 was the best Ecm1 inhibitor, aurintricarboxylic acid and suramin were the most potent ones for RNMT–RAM (Figure S11). The IC50 values of suramin and sinefungin were similar (0.083 μm and 0.078 μm) for the VCE enzyme. However, the lack of differences between such potent inhibitors may be due to method limitations.
Discussion
In this study, we sought to develop a straightforward and cost‐effective method for direct monitoring of mRNA cap N7‐MTase activity based on changes in FLINT and adaptable to high‐throughput inhibitor screening. As a model of a well‐characterized MTase, we selected Ecm1 from E. cuniculi. The conditions optimized for Ecm1 were subsequently successfully applied to human RNMT in a complex with RAM and to the viral protein VCE.
Among various fluorescent probes derived from the GpppA dinucleotide, only a Py3‐labeled compound was found to be suitable as a FLINT probe. This finding is consistent with our previous observations on 7‐methylguanosine mononucleotides, which revealed that Py was a unique fluorophore, with fluorescence properties variably amenable to quenching by different nucleobases.40 Further detailed structural optimization led to the selection of probe 6 b as an MTase substrate with fluorescent properties that were most sensitive to the N7‐methylation status. Ecm1 and RNMT–RAM fluorescent assays were developed and validated by determining their z‐factors. Both assays were found to be suitable for HTS experiments, as their z‐factor values exceeded 0.5 (0.74 for Ecm1 and 0.67 for RNMT–RAM).
These assays were used to screen a small collection of five nucleotides substituted at the C8 or C6 position, which led to the identification of several moderately potent compounds, including 8‐Me‐GpppA as the most potent inhibitor of Ecm1 and 6‐SGpppA as the most potent inhibitor of RNMT–RAM. These results suggest a possibility of selective targeting of N7‐MTases from different sources with substrate‐derived inhibitors.
We finally applied our method to high‐throughput screening of a commercially available library consisting of 1,280 drug‐like molecules against the Ecm1 MTase. Consequently, 56 hits were identified, which showed at least 90 % inhibition of the reaction. Further evaluation of these 56 compounds identified a suramin analogue, NF 023, as the most potent inhibitor, with the potency similar to that of sinefungin under assay conditions. Suramin was also a strong N7‐MTase inhibitor, albeit weaker than NF 023 was. Suramin and suramin analogues act on multiple biological targets,41 often interacting with nucleotide‐binding sites of targeted proteins.42 In particular, histone MTases have been identified among suramin‐sensitive enzymes.43 AA was also confirmed as an N7‐MTase inhibitor. This compound polymerizes in aqueous solutions, which results in unspecific inhibition of protein‐nucleic acid interactions.44 AA has already been found to inhibit an N7‐MTase from CoV32 by interaction with the 3’‐OH group in the protein‐bound SAM.45 Similar to suramin, AA affects many molecular targets, thus showing reduced selectivity. Other identified inhibitors included the flavonoids galloflavin, quercetin, and myricetin, which appear to be promising for further structure optimization, owing to their relatively low molecular weights. Quercetin and myricetin have already been found to inhibit activity of SARS‐nsp14 guanine‐N7 methyltransferase, and human RNMT–RAM enzymes.35 An interesting finding was that reactive blue 2 also potently inhibited N7‐MTases. Based on the comparison of our hits with structurally similar library compounds with lower or no activity, we conclude that the presence of sulfonic groups tends to increase the inhibitory potential. Naphthyl‐sulfo groups of suramin have been found to compete with peptides in the N7‐arginine MTase reaction catalyzed by the PRTM1 enzyme.46 An anionic sulfonate substituent forms hydrogen bonds with guanidinonitrogens, and the naphthalene ring interacts with the arginine side chain through van der Waals interactions and π‐stacking.46 Some other interesting hits that were identified included tyrphostin 51, mifamurtide, protoporphyrin IX, 6‐hydroxy‐DL‐DOPA, cefsulodin, and Ro 8–4304. To the best of our knowledge, their inhibitory properties for mRNA cap N7‐MTases are reported here for the first time. The most potent inhibitors selected by our fluorescence assay should be further evaluated in studies on mRNA 5’ cap biosynthesis using short and long GpppRNA substrates
Conclusions
In conclusion, we report a direct assay for real‐time monitoring of the activities of mRNA cap N7‐MTases and their inhibition. The method is based on changes in FLINT of a synthetically available Py‐labeled GpppA analogue (probe 6 b) and does not require complicated sample preparation or an experimental setup. The assay was found to be applicable to N7‐MTases from different sources and was successfully implemented for N7‐MTase inhibitor discovery. Limitations of the assay include potential interference from compounds with emissive properties similar to those of Py (UV and near‐visible range) and a relatively high probe concentration (low‐micromolar range) required for the optimal kinetics. Nevertheless, our method was suitable for determining IC50 parameters for all interfering compounds from LOPAC®1280.
Experimental Section
All experimental details can be found in the Supporting Information.
Conflict of interest
The authors declare no conflict of interest.
Supporting information
As a service to our authors and readers, this journal provides supporting information supplied by the authors. Such materials are peer reviewed and may be re‐organized for online delivery, but are not copy‐edited or typeset. Technical support issues arising from supporting information (other than missing files) should be addressed to the authors.
Supplementary
Acknowledgements
We thank Dr. Mikolaj Chrominski for providing reagents for the study. This work was financially supported by the National Science Centre (grant numbers UMO‐2016/23/N/ST4/03169 and UMO‐2019/32/T/ST4/00091 to R.K. and 2015/18/E/ST5/00555 to J.K.) and by the Foundation for Polish Science (TEAM/2016‐2/13 to J.J.).
R. Kasprzyk, M. Fido, A. Mamot, P. Wanat, M. Smietanski, M. Kopcial, V. H. Cowling, J. Kowalska, J. Jemielity, Chem. Eur. J. 2020, 26, 11266.
Contributor Information
Dr. Joanna Kowalska, Email: jkowalska@fuw.edu.pl.
Prof. Dr. Jacek Jemielity, Email: j.jemielity@cent.uw.edu.pl.
References
- 1. Topisirovic I., Svitkin Y. V., Sonenberg N., Shatkin A. J., Wiley Interdiscip. Rev. RNA 2011, 2, 277–298; [DOI] [PubMed] [Google Scholar]; Ziemniak M., Strenkowska M., Kowalska J., Jemielity J., Future Med. Chem. 2013, 5, 1141–1172. [DOI] [PubMed] [Google Scholar]
- 2. Chu C., Das K., Tyminski J. R., Bauman J. D., Guan R., Qiu W., Montelione G. T., Arnold E., Shatkin A. J., Proc. Natl. Acad. Sci. USA 2011, 108, 10104–10108. [DOI] [PMC free article] [PubMed] [Google Scholar]
- 3. Shuman S., Nat. Rev. Mol. Cell Biol. 2002, 3, 619–625. [DOI] [PubMed] [Google Scholar]
- 4. Fabrega C., Hausmann S., Shen V., Shuman S., Lima C. D., Mol. Cell 2004, 13, 77–89. [DOI] [PubMed] [Google Scholar]
- 5. Shatkin A. J., Manley J. L., Nat. Struct. Biol. 2000, 7, 838–842. [DOI] [PubMed] [Google Scholar]
- 6. Byszewska M., Smietanski M., Purta E., Bujnicki J., Rna Biol. 2014, 11, 1597–1607. [DOI] [PMC free article] [PubMed] [Google Scholar]
- 7. Varshney D., Petit A. P., Bueren-Calabuig J. A., Jansen C., Fletcher D. A., Peggie M., Weidlich S., Scullion P., Pisliakov A. V., Cowling V. H., Nucleic Acids Res. 2016, 44, 10423–10436. [DOI] [PMC free article] [PubMed] [Google Scholar]
- 8. Dunn S., Lombardi O., Lukoszek R., Cowling V. H., Open Biol. 2019, 9, 190052. [DOI] [PMC free article] [PubMed] [Google Scholar]
- 9. Furuichi Y., Shatkin A. J., Adv. Virus Res. 2000, 55, 135–184. [DOI] [PMC free article] [PubMed] [Google Scholar]
- 10. Harwig A., Landick R., Berkhout B., Viruses 2017, 9, 309. [DOI] [PMC free article] [PubMed] [Google Scholar]
- 11. Decroly E., Ferron F., Lescar J., Canard B., Nat. Rev. Microbiol. 2012, 10, 51–65. [DOI] [PMC free article] [PubMed] [Google Scholar]
- 12. Shuman S., Prog. Nucleic Acid Res. Mol. Biol. 2001, 66, 1–40. [DOI] [PubMed] [Google Scholar]
- 13. Li J., Wang J. T., Whelan S. P., Proc. Natl. Acad. Sci. USA 2006, 103, 8493–8498. [DOI] [PMC free article] [PubMed] [Google Scholar]
- 14. Yu L., Martins A., Deng L., Shuman S., J. Virol. 1997, 71, 9837–9843. [DOI] [PMC free article] [PubMed] [Google Scholar]
- 15. Zheng S., Shuman S., RNA 2008, 14, 696–705. [DOI] [PMC free article] [PubMed] [Google Scholar]
- 16. Chen Y., Guo D., Virol. Sin. 2016, 31, 3–11. [DOI] [PMC free article] [PubMed] [Google Scholar]
- 17. Chen Y., Cai H., Pan J., Xiang N., Tien P., Ahola T., Guo D., Proc. Natl. Acad. Sci. USA 2009, 106, 3484–3489. [DOI] [PMC free article] [PubMed] [Google Scholar]
- 18. Lim S. P., Noble C. G., Shi P. Y., Antiviral Res. 2015, 119, 57–67. [DOI] [PubMed] [Google Scholar]
- 19. Dong H., Ren S., Zhang B., Zhou Y., Puig-Basagoiti F., Li H., Shi P. Y., J. Virol. 2008, 82, 4295–4307. [DOI] [PMC free article] [PubMed] [Google Scholar]
- 20. Okombo J., Chibale K., Expert Opin. Ther. Pat. 2016, 26, 107–130. [DOI] [PubMed] [Google Scholar]
- 21. Hausmann S., Vivarès C. P., Shuman S., J. Biol. Chem. 2002, 277, 96–103. [DOI] [PubMed] [Google Scholar]
- 22. Holstein J. M., Anhäuser L., Rentmeister A., Angew. Chem. Int. Ed. 2016, 55, 10899–10903; [DOI] [PubMed] [Google Scholar]; Angew. Chem. 2016, 128, 11059–11063; [Google Scholar]; Muttach F., Masing F., Studer A., Rentmeister A., Chem. Eur. J. 2017, 23, 5988–5993; [DOI] [PubMed] [Google Scholar]; Holstein J. M., Muttach F., Schiefelbein S. H. H., Rentmeister A., Chem. Eur. J. 2017, 23, 6165–6173. [DOI] [PubMed] [Google Scholar]
- 23. Hausmann S., Zheng S., Fabrega C., Schneller S. W., Lima C. D., Shuman S., J. Biol. Chem. 2005, 280, 20404–20412. [DOI] [PubMed] [Google Scholar]
- 24. Hercik K., Brynda J., Nencka R., Boura E., Arch. Virol. 2017, 162, 2091–2096; [DOI] [PubMed] [Google Scholar]; Jain R., Butler K. V., Coloma J., Jin J., Aggarwal A. K., Sci. Rep. 2017, 7, 1632; [DOI] [PMC free article] [PubMed] [Google Scholar]; Pugh C. S., Borchardt R. T., Stone H. O., J. Biol. Chem. 1978, 253, 4075–4077. [PubMed] [Google Scholar]
- 25. Zhang J., Zheng Y. G., ACS Chem. Biol. 2016, 11, 583–597. [DOI] [PMC free article] [PubMed] [Google Scholar]
- 26. Lim S. P., Sonntag L. S., Noble C., Nilar S. H., Ng R. H., Zou G., Monaghan P., Chung K. Y., Dong H., Liu B., Bodenreider C., Lee G., Ding M., Chan W. L., Wang G., Jian Y. L., Chao A. T., Lescar J., Yin Z., Vedananda T. R., Keller T. H., Shi P. Y., J. Biol. Chem. 2011, 286, 6233–6240. [DOI] [PMC free article] [PubMed] [Google Scholar]
- 27. Podvinec M., Lim S. P., Schmidt T., Scarsi M., Wen D., Sonntag L. S., Sanschagrin P., Shenkin P. S., Schwede T., J. Med. Chem. 2010, 53, 1483–1495. [DOI] [PubMed] [Google Scholar]
- 28. Chung K. Y., Dong H., Chao A. T., Shi P. Y., Lescar J., Lim S. P., Virology 2010, 402, 52–60. [DOI] [PubMed] [Google Scholar]
- 29. Barral K., Sallamand C., Petzold C., Coutard B., Collet A., Thillier Y., Zimmermann J., Vasseur J. J., Canard B., Rohayem J., Debart F., Decroly E., Antiviral Res. 2013, 99, 292–300. [DOI] [PubMed] [Google Scholar]
- 30. Coutard B., Decroly E., Li C., Sharff A., Lescar J., Bricogne G., Barral K., Antiviral Res. 2014, 106, 61–70. [DOI] [PubMed] [Google Scholar]
- 31. Chrebet G. L., Wisniewski D., Perkins A. L., Deng Q., Kurtz M. B., Marcy A., Parent S. A., J. Biomol. Screening 2005, 10, 355–364. [DOI] [PubMed] [Google Scholar]
- 32. Sun Y., Wang Z., Tao J., Wang Y., Wu A., Yang Z., Wang K., Shi L., Chen Y., Guo D., Antiviral Res. 2014, 104, 156–164. [DOI] [PMC free article] [PubMed] [Google Scholar]
- 33. Lim S. P., Bodenreider C., Shi P. Y., Methods Mol. Biol. 2013, 1030, 249–268. [DOI] [PubMed] [Google Scholar]
- 34. Geiss B. J., Stahla-Beek H. J., Hannah A. M., Gari H. H., Henderson B. R., Saeedi B. J., Keenan S. M., J. Biomol. Screening 2011, 16, 852–861. [DOI] [PMC free article] [PubMed] [Google Scholar]
- 35. Aouadi W., Eydoux C., Coutard B., Martin B., Debart F., Vasseur J. J., Contreras J. M., Morice C., Quérat G., Jung M. L., Canard B., Guillemot J. C., Decroly E., Antiviral Res. 2017, 144, 330–339. [DOI] [PMC free article] [PubMed] [Google Scholar]
- 36. Wanat P., Kasprzyk R., Kopcial M., Sikorski P. J., Strzelecka D., Jemielity J., Kowalska J., Chem. Commun. 2018, 54, 9773–9776. [DOI] [PubMed] [Google Scholar]
- 37. Mamot A., Sikorski P., Warminski M., Kowalska J., Jemielity J., Angew. Chem. Int. Ed. 2017, 56, 15628–15632; [DOI] [PubMed] [Google Scholar]; Angew. Chem. 2017, 129, 15834–15838; [Google Scholar]; Jiang H., Congleton J., Liu Q., Merchant P., Malavasi F., Lee H. C., Hao Q., Yen A., Lin H., J. Am. Chem. Soc. 2009, 131, 1658–1659; [DOI] [PMC free article] [PubMed] [Google Scholar]; Kopcial M., Wojtczak B. A., Kasprzyk R., Kowalska J., Jemielity J., Molecules 2019, 24, 1899. [DOI] [PMC free article] [PubMed] [Google Scholar]
- 38. Würth C., Grabolle M., Pauli J., Spieles M., Resch-Genger U., Nat. Protoc. 2013, 8, 1535–1550. [DOI] [PubMed] [Google Scholar]
- 39. Eisenthal R., Danson M. J., Hough D. W., Trends Biotechnol. 2007, 25, 247–249. [DOI] [PubMed] [Google Scholar]
- 40. Kasprzyk R., Starek B. J., Ciechanowicz S., Kubacka D., Kowalska J., Jemielity J., Chemistry 2019, 25, 6728–6740. [DOI] [PubMed] [Google Scholar]
- 41. La Rocca R. V., Stein C. A., Myers C. E., Cancer Cells 1990, 2, 106–115; [PubMed] [Google Scholar]; Larsen A. K., Cancer Chemother. Pharmacol. 1993, 32, 96–98. [DOI] [PubMed] [Google Scholar]
- 42. Zimmermann S., Hall L., Riley S., Sørensen J., Amaro R. E., Schnaufer A., Nucleic Acids Res. 2016, 44, e24; [DOI] [PMC free article] [PubMed] [Google Scholar]; Trapp J., Meier R., Hongwiset D., Kassack M. U., Sippl W., Jung M., ChemMedChem 2007, 2, 1419–1431; [DOI] [PubMed] [Google Scholar]; Xu Y., Triantafyllou I., Cable M., Palermo R., Anal. Biochem. 2008, 372, 89–95. [DOI] [PubMed] [Google Scholar]
- 43. Drake K. M., Watson V. G., Kisielewski A., Glynn R., Napper A. D., Assay Drug Dev. Technol. 2014, 12, 258–271; [DOI] [PMC free article] [PubMed] [Google Scholar]; Horiuchi K. Y., Eason M. M., Ferry J. J., Planck J. L., Walsh C. P., Smith R. F., Howitz K. T., Ma H., Assay Drug Dev. Technol. 2013, 11, 227–236; [DOI] [PMC free article] [PubMed] [Google Scholar]; Ibanez G., Shum D., Blum G., Bhinder B., Radu C., Antczak C., Luo M., Djaballah H., Comb. Chem. High Throughput Screening 2012, 15, 359–371. [DOI] [PMC free article] [PubMed] [Google Scholar]
- 44. Gonzalez R. G., Haxo R. S., Schleich T., Biochemistry 1980, 19, 4299–4303. [DOI] [PubMed] [Google Scholar]
- 45. Milani M., Mastrangelo E., Bollati M., Selisko B., Decroly E., Bouvet M., Canard B., Bolognesi M., Antiviral Res. 2009, 83, 28–34. [DOI] [PMC free article] [PubMed] [Google Scholar]
- 46. Feng Y., Li M., Wang B., Zheng Y. G., J. Med. Chem. 2010, 53, 6028–6039. [DOI] [PubMed] [Google Scholar]
Associated Data
This section collects any data citations, data availability statements, or supplementary materials included in this article.
Supplementary Materials
As a service to our authors and readers, this journal provides supporting information supplied by the authors. Such materials are peer reviewed and may be re‐organized for online delivery, but are not copy‐edited or typeset. Technical support issues arising from supporting information (other than missing files) should be addressed to the authors.
Supplementary


