

During December 2019, a new coronavirus (COVID‐19) was identified in Wuhan, China. 1 The spread of COVID‐19 since identification has quickly emerged as a global issue with the World Health Organization declaring a pandemic on March 11. 2 To date (March 29, 2020), there have been over 716,000 reported cases across 177 countries/regions, with deaths approaching 34,000. 1 Those who are older than 65 years of age generally face the most extreme consequences of contracting COVID‐19. Data from the United States have confirmed that up to 30% of people 65 or older contracting COVID require hospitalization, while up to 10% will die. 3
Aging populations in rural and remote communities may be especially vulnerable to the COVID‐19 pandemic, and in part, this is due to the availability and capacity of rural health services. Edwards et al 4 investigated the perspectives that rural hospital decision‐makers had in relation to service delivery during a pandemic avian influenza scenario. Findings from 17 hospitals concluded that key issues surround (i) a lack of staff, (ii) the need for coordinated health services, and (iii) operational and facility issues. Similarly, Harrod et al 5 confirmed that staffing constraints also hinder rural hospital performance during a time of crisis. Finally, irrespective of hospital capacity issues existing during crisis, research has confirmed that compared to urban communities, rural communities typically face poorer access to health services. 6 This is especially problematic during a pandemic.
For rural communities, responding to the COVID‐19 pandemic requires unique service offerings. Consequently, the most pressing issue that geographically large, developed countries with widely dispersed rural localities (for example, the United States, Canada, and Australia) face in tackling the spread and consequences of COVID‐19 surrounds the identification of priority areas where unique service offerings and resources should be dedicated. Spatial methods have been effective toward identifying where health service gaps exist, 6 , 7 and they have also confirmed that compared to urban regions, rural areas often experience further travel times to essential services. 8 Already, in light of COVID‐19, seminal work by Boulos and Geraghty 9 synthesized the extent of spatial applications currently used to track incidences of COVID‐19. They also clarify where geographic information system (GIS) methods can inform decision‐making and suggest that spatial methods can be applied to identify new sites for health services to address COVID‐19 incidences. In the absence of funding and time to develop new sites of service delivery in rural localities, spatial methods can identify rural priority areas where unique service offerings (including the better coordination of services 4 ) are necessary.
Introducing the Percent, Number, Availability and Capacity (PNAC) Approach
Priority areas have an overrepresentation of a vulnerable population while also limited health and social services, or capacity within services, to address a health issue. Toward the identification of priority areas, spatial approaches have considered both domains separately: (i) population at‐risk and (ii) health service availability and capacity. For example, in the context of people with disability, my previous work 8 has clarified priority areas as ones that meet the criteria of having both a statistically significant number and percentage of people with disability. Conversely, Chandak et al 6 have identified areas requiring improved service offerings as ones that have a poor availability of services.
A spatial approach which identifies priority areas fitting the criteria of having a significant geographic prevalence of a vulnerable population while also poor access to health services can be a powerful method to support COVID‐19 service planning efforts, and it can support the evidence‐based delivery of resources and/or unique service offerings within rural areas. The proposed Percent, Number, Availability and Capacity (PNAC) spatial approach combines traditional single domain approaches and considers a priority area as one which has a significantly high percentage and number of vulnerable people, while also considering the availability and capacity of health services for priority areas.
The remainder of this commentary applies the methodology to identify priority rural areas within Queensland, Australia, under the context of COVID‐19. Queensland has a large geographic footprint compared to other Australian states, 10 with a considerable proportion of land considered remote or very remote. 11 Additionally, it has a higher proportion of people living outside of the capital city (51.4%) compared to other states in Australia (for example, 35.3% in New South Wales, 24.2% in Victoria, and 22.5% in South Australia). 12 Hence it is an exemplar candidate to illustrate the value the PNAC approach in light of COVID‐19.
COVID‐19 Case Study: Queensland, Australia PNAC Application
People aged 65 and older were considered the population of interest for this COVID‐19 case study, as those 65 and older who contract COVID‐19 generally experience the most severe consequences necessitating hospital admission. Data for this case study were identified from a set of public and non‐public data being collated for use within the Epidoros‐V2 spatial platform. 13 Data were identified from 3 sources: (i) the Australian Bureau of Statistics, (ii) Health Direct, and (iii) The Australian Institute of Health and Welfare. The Australian Bureau of Statistics 2016 Population and Housing census data 14 were used to identify the number and percentage of people aged 65 and older within each Queensland Statistical Area 1 (the second smallest statistical area within the Australian Statistical Geography Standard) classified as remote or very remote. The locations of hospitals within Queensland were derived from Health Direct's 2019 National Health Service Directory. 15 The number of beds per hospital was identified via the Australian Institute of Health and Welfare's My Hospital Data. 16 As a bed range is provided (for example, 0–50 beds, 50–100 beds), the upper bound of each range was used, except for hospitals with greater than 500 beds, where the number 500 was used.
Distinct measures used across the PNAC domains were as follows (with specific measure in brackets): percentage [percentage of people aged 65 and older within each statistical area], number [number of people aged 65 and older within each statistical area], availability [travel time to the closest hospital], and capacity [number of beds within the closest hospital]. All spatial analyses in line with this study were conducted via Esri's ArcMap 10.4.1 (Esri, Redlands, California), while descriptive statistics and outliers established via IBM's SPSS (IBM Corp, Armonk, New York).
In total 36 priority rural regions were identified. The mean travel time to the closest hospital was 26.96 minutes (standard deviation = 44.98 minutes), minimum travel time 0.65 minutes, and maximum travel time 214.86 minutes. In terms of capacity, the closest hospital to all areas had between 0 and 50 beds. In relation to travel time, 3 regions were extreme outliers, with a travel time above the upper outer fence of a produced box plot (see Figure 1 below). In terms of informing a rural response to COVID‐19, while the PNAC application identified priority regions for consideration, the 3 rural outliers based on travel time to the nearest hospital may be initial candidates for unique service offerings as they face exceptionally long travel times to the closest hospital. Two maps in Figure 2 clarify (i) priority areas, and (ii) travel time to the closest hospital.
Figure 1.
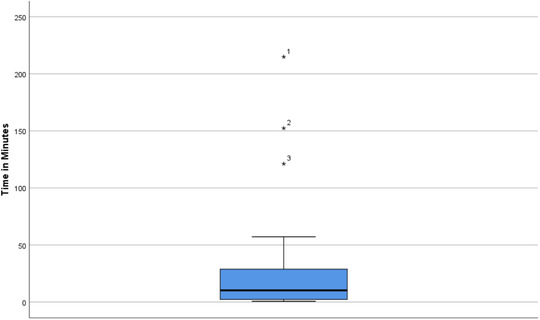
Travel Time From Priority Rural Area to Closest Hospital.
Figure 2.
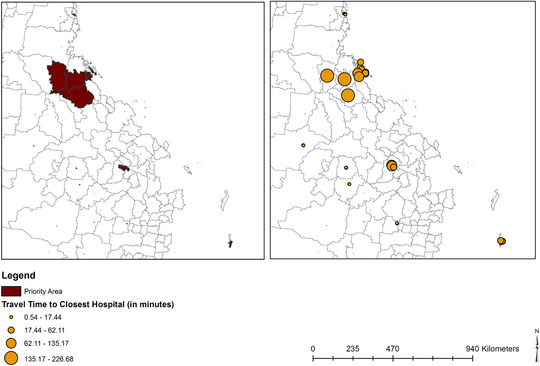
Priority Areas and Travel Time to the Closest Hospital.
Future Considerations and Concluding Remarks
The PNAC approach can be applied to support rural health service planners’ identification of priority rural areas which require targeted health support to address incidences of COVID‐19 amongst people aged 65 and older. Dependent on the extent of data available, measures used across each PNAC domain can be amended. For example, in relation to the Capacity domain, a ratio of people per health service could be used (see Ref. (7) where this measure has been used). While, in relation to Availability, the number of services available within a specified radius (as done in my earlier work 17 ), or the geographic location where services are clustered (as done by Chandak et al 6 ) may be best.
Rural locations have distinct demographic and health service capacity issues requiring tailored approaches to service delivery. It is expected that future applications of the PNAC method could be of particular benefit to rural service planning in light of COVID‐19, as the approach considers both the demographic distribution (for example age) and service capacity issues unique to rural areas. However, it is important that COVID‐19 service planning decisions within regions identified via the PNAC method are culturally and contextually appropriate, and they are informed by stakeholders with lived‐experience working within identified rural areas.
Acknowledgments: The data, maps or techniques used in this research draw on EpidorosTM first developed by Griffith University in 2008 in partnership with Metro South Health and Esri Australia with additional funding from the Australian Research Council and the Motor Accident Insurance Commission Qld. Dr Ali Lakhani would also like to thank Professor Elizabeth Kendall for providing continual mentorship and indicating that such work is necessary, and Dr Peter Grimbeek and Dr Ori Gudes for their statistical and spatial advice respectively.
For further information, contact: Ali Lakhani, Senior Lecturer in Public Health, The School of Psychology and Public Health, La Trobe University, 360 Collins Street, Melbourne, VIC, 3000, Australia; e‐mail: a.lakhani@latrobe.edu.au
References
- 1. Hopkins J . CSSE Coronavirus COVID‐19 Global Cases (dashboard) ; 2020. https://coronavirus.jhu.edu/map.html. Accessed March 29, 2020.
- 2. World Health Organization . Rolling Updates on Coronavirus Disease (COVID‐2019) ; 2020. https://www.who.int/emergencies/diseases/novel-coronavirus-2019/events-as-they-happen. Accessed March 29, 2020.
- 3. Centers for Disease Control and Prevention . Coronavirus Disease 2019 (COVID‐19): older adults; 2020.
- 4. Edwards JC, Kang J, Silenas R. Promoting regional disaster preparedness among rural hospitals. J Rural Health. 2008;24(3):321‐325. [DOI] [PubMed] [Google Scholar]
- 5. Harrod M, Manojlovich M, Kowalski CP, Saint S, Krein SL. Unique factors rural veterans’ affairs hospitals face when implementing health care‐associated infection prevention initiatives. J Rural Health. 2014;30(1):17‐26. [DOI] [PubMed] [Google Scholar]
- 6. Chandak A, Nayar P, Lin G. Rural‐urban disparities in access to breast cancer screening: a spatial clustering analysis. J Rural Health. 2019;35(2):229‐235. [DOI] [PubMed] [Google Scholar]
- 7. Daly MR, Mellor JM, Millones M. Defining primary care shortage areas: do GIS‐based measures yield different results? J Rural Health. 2019;35(1):22‐34. [DOI] [PubMed] [Google Scholar]
- 8. Lakhani A, Parekh S, Gudes O, et al. Disability support services in Queensland, Australia: identifying service gaps through spatial analysis. Appl Geogr. 2019; 110:102045. [Google Scholar]
- 9. Kamel Boulos MN, Geraghty EM. Geographical tracking and mapping of coronavirus disease COVID‐19/severe acute respiratory syndrome coronavirus 2 (SARS‐CoV‐2) epidemic and associated events around the world: how 21st century GIS technologies are supporting the global fight against outbreaks and epidemics. Int J Health Geogr. 2020;19(1):8. [DOI] [PMC free article] [PubMed] [Google Scholar]
- 10. Australian Government Geoscience Australia . Area of Australia—states and territories. 2020.
- 11. Queensland Health . Rural and remote areas. 2014.
- 12. Queensland Government Statistician's Office . Queensland Compared, Census 2016. 2016.
- 13. Lakhani A, Kendall E. Epidoros‐V2: a spatial data matrix to inform rehabilitation health service provision. Paper presented at Institute of Australian Geographers Conference 2019, Hobart, Australia.
- 14. Australian Bureau of Statistics . Census of Population and Housing—2016. 2016.
- 15. Health Direct Australia Ltd . National Health Services Directory (NHSD) (Point) 2019. Accessed from AURIN (https://aurin.org.au/) March 5, 2020.
- 16. Australia Institute of Health and Welfare . MyHospitals. 2020.
- 17. Lakhani A, Watling DP, Gudes O, et al. Clarifying the geographic dispersion of essential health services for people with spinal cord injury in rural and remote Queensland: A spatial study. Bold Ideas Better Solutions Symposium; 2019; Brisbane, Australia. [Google Scholar]