

Abstract
Hydroxychloroquine (HCQ) is a promising candidate for Coronavirus disease of 2019 (COVID‐19) treatment. The optimal dosing of HCQ is unknown. Our goal was to integrate historic and emerging pharmacological and toxicity data to understand safe and efficacious HCQ dosing strategies for COVID‐19 treatment. The data sources included were (i) longitudinal clinical, pharmacokinetic (PK), and virologic data from patients with severe acute respiratory syndrome‐2 (SARS‐CoV‐2) infection who received HCQ with or without azithromycin (n = 116), (ii) in vitro viral replication data and SARS‐CoV‐2 viral load inhibition by HCQ, (iii) a population PK model of HCQ, and (iv) a model relating chloroquine PKs to corrected QT (QTc) prolongation. A mechanistic PK/virologic/QTc model for HCQ was developed and externally validated to predict SARS‐CoV‐2 rate of viral decline and QTc prolongation. SARS‐CoV‐2 viral decline was associated with HCQ PKs (P < 0.001). The extrapolated patient half‐maximal effective concentration (EC50) was 4.7 µM, comparable to the reported in vitro EC50s. HCQ doses > 400 mg b.i.d. for ≥5 days were predicted to rapidly decrease viral loads, reduce the proportion of patients with detectable SARS‐CoV‐2 infection, and shorten treatment courses, compared with lower dose (≤ 400 mg daily) regimens. However, HCQ doses > 600 mg b.i.d. were also predicted to prolong QTc intervals. This prolongation may have clinical implications warranting further safety assessment. Due to COVID‐19's variable natural history, lower dose HCQ regimens may be indistinguishable from controls. Evaluation of higher HCQ doses is needed to ensure adequate safety and efficacy.
Study Highlights.
WHAT IS THE CURRENT KNOWLEDGE ON THE TOPIC?
☑ Hydroxychloroquine (HCQ) is an emerging therapy for Coronavirus disease of 2019 (COVID‐19), however, optimal dose is not known.
WHAT QUESTION DID THIS STUDY ADDRESS?
☑ Emerging data and relationships among natural history, pharmacokinetics (PKs), and rate of viral load decline in patients with COVID‐19 has been quantified, validated, and integrated with emerging in vitro data, historical population PKs, and corrected QT prolongation models for HCQ.
WHAT DOES THIS STUDY ADD TO OUR KNOWLEDGE?
☑ We provide rationale for range of high‐dose HCQ regimens to be used for most effective treatment of patients with COVID‐19 and in the upcoming clinical trials. Low doses of HCQ (e.g., 400 mg q.d.) might not offer substantial benefit.
HOW MIGHT THIS CHANGE CLINICAL PHARMACOLOGY OR TRANSLATIONAL SCIENCE?
☑ Pharmacological rationale and dosing tools for use of HCQ in patients with COVID‐19 can be used to rationalize and utilize use of this medicine in the current pandemic.
Coronavirus disease of 2019 (COVID‐19), caused by the virus severe acute respiratory syndrome coronavirus 2 (SARS‐CoV‐2), was first identified in Wuhan, China, in December 2019. 1 It has rapidly become a global pandemic, with cases reported in > 197 countries. Limited data are available to guide treatment selection. Hydroxychloroquine (HCQ), a chloroquine (CQ) derivative historically used for malaria and autoimmune diseases, has shown potent in vitro activity against both SARS‐CoV‐1 and SARS‐CoV‐2. 2 , 3 , 4 Mechanistically, SARS‐CoV‐2 inhibition is believed to be due to multiple steps, including a change in the pH of the cell membrane that reduces viral entry and inhibition of later stages of replication. 3 HCQ also causes immunomodulation, and, thus, may suppress the cytokine storm associated with advanced stages of COVID‐19 illness. 5
In a small, nonrandomized, open‐label clinical trial in France, 20 patients with COVID‐19, who received HCQ dosed as 200 mg t.i.d. were compared with a convenience sample of patients who only received supportive care. 6 In this study, HCQ was well‐tolerated, however, approximately one third of patients remained viremic by nasopharyngeal swabs after 6 days. A small study in China reported no apparent clinical benefit of 400 mg daily HCQ administered for 5 days compared with placebo in patients with COVID‐19, the majority of whom had mild disease. 7
Based on in vitro data, several HCQ regimens have been proposed, including 200 mg q.i.d. and 400 mg b.i.d. followed by 200 mg daily for 4 days, but none of these regimens have been evaluated clinically. 8 The Centers for Disease Control (CDC) also provides anecdotal dosing suggestions, but explicitly states optimal dosing and duration of HCQ for COVID‐19 are unknown. 8 With promising initial clinical and in vitro results for HCQ, our goal was to integrate all available pharmacological data and mechanistic knowledge related to COVID‐19, to date, which include novel in vitro pharmacokinetic/pharmacodynamic (PK/PD) data for SARS‐CoV‐2, historical data on viral replication of similar coronaviruses (e.g., SARS‐CoV‐1, first observed in 2002 in China), historical data on population PKs and safety of HCQ from large patient cohorts, and newly emerging clinical PK/PD data from patients with COVID‐19. We use translational PK/PD modeling to propose optimized HCQ dosing regimens, which ensure the highest likelihood of success as a COVID‐19 treatment.
Methods
Data
In vitro HCQ and CQ drug sensitivity data for SARS‐CoV‐2, reported as percent inhibition, were obtained from 24‐hour and 48‐hour experiments in Vero or VeroE6 cells derived from African green monkey kidney epithelium. 3 , 9 , 10 The experiments are described in detail in the original publications. Estimated, apparent half‐maximal effective concentration (EC50) values were reported, whereas the 90% effective concentration values were obtained by digitizing the graph of antiviral activity for HCQ using the software WebPlotDigitizer version 4.2. 11
In vitro viral replication data were obtained from longitudinal data profiling the growth of SARS‐CoV‐1 in Vero cells over 11 days. 12 RNA extraction and quantitative real‐time polymerase chain reaction (PCR) were performed, and viral load was reported as cycle threshold (CT). Viral load was calculated from the CT reported in the original publication as 1/log2(CT). 13
In vivo data was obtained from a published nonrandomized single arm open label study of HCQ 200 mg t.i.d., with or without azithromycin, for treatment of SARS‐CoV‐2 infection in France. 6 Participants had PCR confirmed SARS‐CoV‐2 infection by nasopharyngeal swab and swab samples were obtained daily. Controls were selected by convenience at multiple hospitals in France. Viral load was calculated from CT. 13 One sparse serum HCQ concentration was reported for each patient on days 2, 4, or 6 of treatment. Sixteen patients in the control arm (samples = 69), 14 patients in the HCQ arm (samples = 93), and 6 patients in the HCQ with azithromycin arm (samples = 40) contributed viral load samples over 6 days. Additional patient characteristics and results are reported in the original publication. 6 An external cohort of 80 patients receiving 200 mg t.i.d. for 10 days was used for external model validation. 14
Translational and clinical PK/PD‐viral kinetics models
A published two‐compartment population PK model for HCQ was used to predict plasma drug concentrations for different dosing regimens of HCQ. 15 Published scaling parameters were used to simulate lung concentrations and the fraction unbound was assumed to be the same in the lung as in the plasma (0.5). 3
In vitro viral growth, death, and saturable growth parameters were estimated using data from SARS‐CoV‐1 in the software Nonlinear Mixed Effects Modeling version 7.4 (NONMEN Icon Development Solutions, Ellicott City, MD). 12 The drug effect over time on viral replication rate was established by simulating unbound plasma concentrations or unbound lung tissue concentrations using a previously defined partition coefficient (102.45; HCQ unbound fraction assumed to be ~ 50%) and using the established in vitro sigmoidal efficacy parameters. 3 , 9 , 10 Regimens of HCQ included 50–800 mg b.i.d. for 7 days. The drug effect on the viral replication rate was simulated by fixing EC50 to one of the reported in vitro values, ranging from 0.72 µM to 17.31 µM. 3 , 9 , 10 Each regimen was simulated with each EC50 values 500 times.
The PK/PD analysis of the in vivo viral load data was performed sequentially. The control patients' longitudinal viral load was analyzed to inform the unperturbed viral growth. A previously published population PK model was used to define the individual PK profile for each patient treated with HCQ (with and without azithromycin). 15 Plasma and serum concentrations were assumed to be comparable. 16 Subsequently, longitudinal plasma PK and viral load were linked to predict the impact of time varying HCQ concentrations on viral replication. Viral dynamics (VL) were described using the viral kinetic model (Eq. 1), where k g and k d represent first‐order growth and death rates, respectively. MAXvirus stands for the saturated maximal viral load. Drug (PK/PD) effect (Edrug) was included as a linear function increasing k d (Eq. 2), where the slope (sl) of the function is estimated, and C p represents the drug concentration predicted with the PK model. A function (Eq. 3) independent of the drug effect was added during the model validation stage to improve predictions at later time points (beyond day 6). This function might mimic the immune response (IR), which comes on board once the viral load is reduced to a certain level, described as a function of the immune effect (IE) and time.
| (1) |
| (2) |
| (3) |
Finally, participants' sex, age, baseline viral load, clinical status time between onset of symptoms and inclusion, and the use of concomitant azithromycin were tested as potential covariates. PK/PD parameters were estimated using the LAPLACE estimation method with INTERACTION, and the M3 method was applied to handle data below the limit of quantification by estimating the likelihood of the predicted viral load being less than the lower limit of assay quantification. 17 , 18 Interindividual variability parameters were modeled exponentially and the residual variability was described using proportional error. Model selection and evaluation were done by the likelihood ratio test, goodness of fit plots, and visual predictive checks. The final model was used to externally predict %PCR‐negative patients from the new patient cohort who received 200 mg t.i.d. with azithromycin for 10 days.
Simulations and dose optimization
Simulated regimens of HCQ included 200, 400, 600, and 800 mg b.i.d. for 5, 7, and 10 days with and without loading dose. All simulations included 100 virtual patients, simulated 1,000 times. Large variation in the basal viral load range was assumed. The PK model was used to generate the virtual individual PK profiles. 6 The percentage of patients with positive PCR results was computed longitudinally throughout and at the end of the treatment. Regimens were evaluated based on the proportion of patients with viral loads above the lower limit of assay quantification. All model simulations were performed using NONMEM and the PKPDsim package in R software version 3.6.1.
PK/PD‐corrected QT simulations
To predict the risk of corrected QT (QTc) prolongation associated with HCQ, we used a published PK‐QTc model established for high‐dose CQ in children, describing a linear PK‐QTc relationship where for every 1 nM increase in CQ concentration there was a 0.006 ms (95% confidence interval 0.004–0.009) increase in QT interval. 19 A conservative upper boundary estimate (0.009 ms/nM) was used assuming that HCQ and CQ have a similar PK‐QTc relationship. This relationship was validated as it successfully predicted QTc prolongation in adults, after a single dose of 600 mg CQ reported by Mzayek et al. 20 A conservative assumption was made that the PK‐QTc relationship remains linear and it does not reach a maximal effect.
We assumed a trial population of 1,000 patients with a baseline QTc of 394 ± 30 SD. We conducted simulations of each HCQ dosing regimen in this population using the established population PK model (including intersubject variability) and predicted the peak HCQ concentrations during treatment. We assumed all changes in QTc were attributed to PK variability. The maximum delta QTc during treatment was predicted using the linear PK‐QTc relationship for CQ (0.009 ms/nM); the maximum predicted QTc was the sum of the baseline and the delta QTc. Although the baseline QTc distribution contained variability, the slope used (0.009 ms/nM) did not. The proportion of patients with a delta QTc > 60 ms or predicted peak QTc on treatment > 500 ms were reported.
Sensitivity analysis
The natural course of disease progression is variable and might impact the benefit of HCQ therapy. We explored various models of natural history for COVID‐19 based on the viral load distribution from the control arms in two recently reported studies. 6 , 21 Three natural history scenarios were explored for several plausible control arms with low, high, and mixed baseline viral load. Viral load decline of various HCQ doses was compared with the control arm under different assumptions.
Results
Translational PK/PD model
The PK/PD viral kinetic model structure is shown in Figure 1 . The translational PK/PD model included the unperturbed growth rate of SARS‐CoV‐1 in vitro, the clinical population PK model, and the HCQ in vitro efficacy parameters in SARS‐CoV‐2. 3 , 9 , 10 , 12 , 15 The in vitro viral kinetic model included a first‐order growth (0.577 day‐1) and death rate (0.0631 day‐1) and saturated maximal viral load (Table S1 ). The simulated unbound lung concentrations were above the EC50 for all evaluated dosing regimens, including a subtherapeutic 10 mg dose. For unbound plasma concentration, the impact of the drug effect on viral replication increased with the dose but was highly sensitive to the in vitro EC50 values (Figure 2 ). For all reported EC50s, higher doses increased the rate of viral decline.
Figure 1.
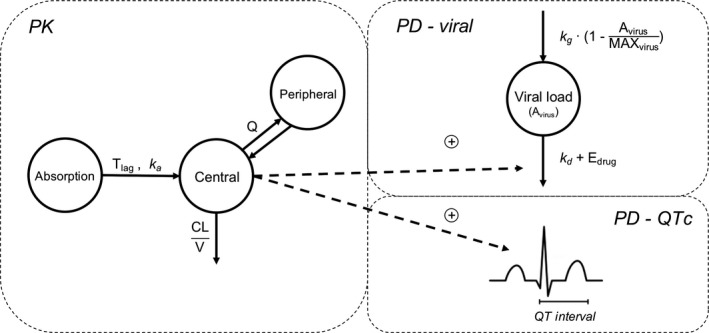
Pharmacokinetic/pharmacodynamic (PK/PD)‐viral kinetics model diagram. A previously published two‐compartment plasma PK model was used to simulate plasma concentration. 15 PD compartments included a one‐compartment model describing viral growth, death, and drug effect, and a model describing drug effect on QTc prolongation. 19 represents the PD relationship for hydroxychloroquine (HCQ) plasma concentration (C p). In the in vitro model, is characterized by a maximum effect (Emax) function , whereas for the clinical model it is described using a linear function (. CL, clearance; EC50, half‐maximal effective concentration; QTc, corrected QT; V, volume of distribution.
Figure 2.
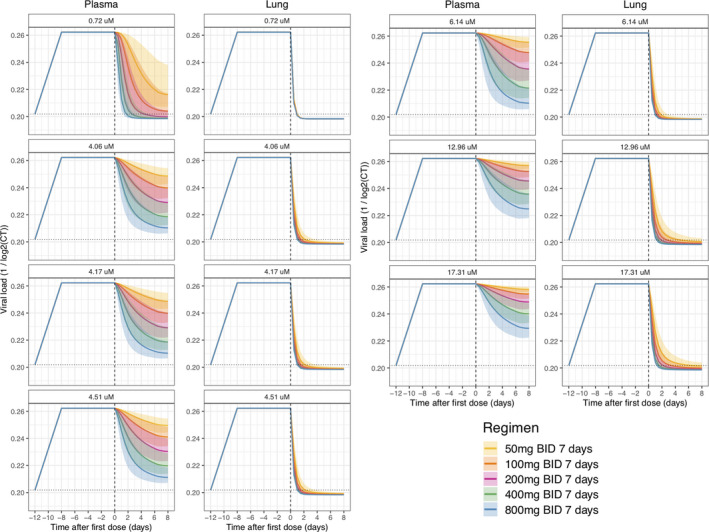
Translational pharmacokinetic/pharmacodynamic (PK/PD) simulation. Simulated scenarios of drug effect on in vitro replication rate based on reported hydroxychloroquine (HCQ) efficacy. 3 , 9 , 10 Viral kinetics were estimated from in vitro replication rate of severe acute respiratory syndrome‐coronavirus (SARS‐CoV)‐1 and unbound drug concentration in plasma and lungs were simulated with HCQ PK model. 12 , 15 Solid continuous line represents the 50th percentile of the simulated data and shaded areas represent the 95% prediction intervals for median, 2.5th, and 97.5th percentiles obtained from 500 simulated datasets. Dotted horizontal lines represent the baseline level, whereas dashed vertical lines indicate the start of treatment.
Clinical PK/PD model
HCQ concentrations from the clinical cohort fell within the range expected from historical population profiles (Figure 3a left). 6 , 15 Figure 3b shows the reconstructed individual PK profiles in the treatment group. The patients' viral load is displayed in Figure 3a (right).
Figure 3.
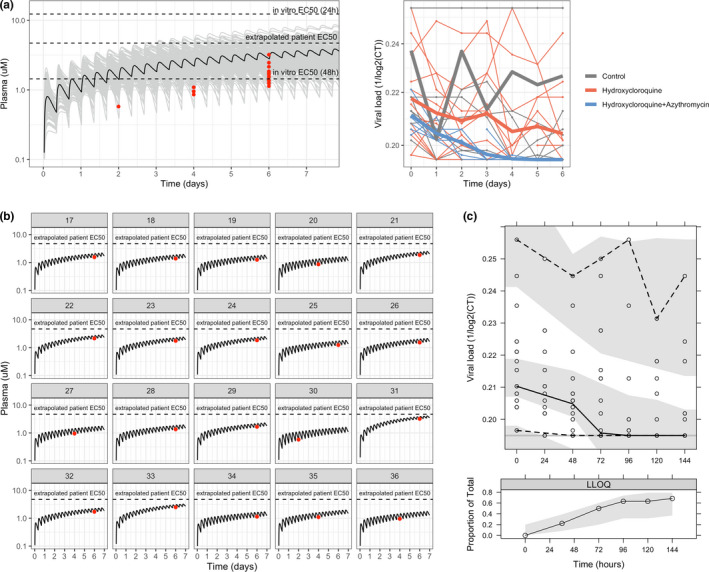
Data and model for clinical data. (a) Raw pharmacokinetic (PK) and viral load data. In the PK graph, raw data is shown in red, whereas black and grey lines represent the typical and population plasma PK simulation (n = 200) using the PK model. In vitro half‐maximal effective concentration (EC50s) indicated in the graph were calculated considering total drug using the values reported in Yao et al. 3 In the viral load graph (left), thick lines represent the mean profiles of each group, whereas the thin ones represent the individual profiles. (b) Individual PK plasma profile predicted with the PK model for each patient treated with hydroxychloroquine (HCQ). (c) Visual predictive check of population PK/pharmacodynamic model. The solid continuous line represents the 50th percentile of the observations, dashed lines represent 2.5th and 97.5th percentiles of observations, and shaded areas represent the 95% prediction intervals for median, 2.5th, and 97.5th percentiles obtained from 1,000 simulated datasets. The lower panel shows the proportions of below the limit of quantification values observed (solid line), with 95% prediction variability shown by shaded area. CT, cycle threshold; LLOQ, lower limit of quantification.
Viral response to treatment was significantly associated (P < 0.001) to HCQ PK concentrations using a linear effect model (Figure 1 and Table S1 ). Each 1 μM increase in plasma HCQ is associated with a 28% decrease in viral load per day. The PK/PD model was significantly better compared with a drug effect model (P < 0.001), confirming a significant concentration‐effect relationship. In addition, a maximum effect (Emax) model to link drug concentrations to effect was also tested, however, it was not identifiable. This is most likely due to the limited clinical PK concentration range.
The effect of azithromycin on viral load decline was not significant. Among the covariates explored, two asymptomatic patients in the treatment group seemed to have a lower baseline viral load and cleared the virus by the second day (Figure S1 ). The visual predictive check (Figure 3c ) shows good agreement between the raw data and model simulations, both for the longitudinal viral load dynamics and for the proportion of censored PCR samples, associated with undetectable viral load.
Comparison of in vitro and in vivo EC50 predictions
The estimated plasma concentrations for 50% viral inhibition in patients was 4.7. This value is in closer agreement with the in vitro values reported after a 24‐hour incubation (EC50 = 6.14 µM) compared with 48‐hour incubation (EC50 = 0.72 µM) by Yao et al., and was also comparable to the values reported by Liu et al. (EC50 = 4.06 µM, 4.51 µM) and by Touret et al. (4.14 µM; Figure 4 ). 3 , 9 , 10
Figure 4.
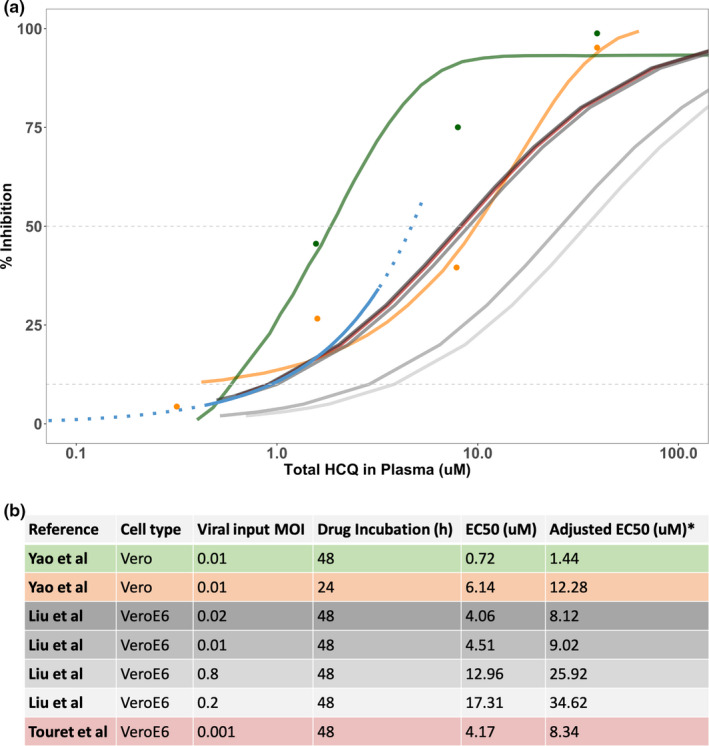
Comparison of EC50 values. (a) Comparison of percentage of viral inhibition for hydroxychloroquine (HCQ) by data source, including digitized 48‐hour in vitro data (green), 24‐hour in vitro data (orange) obtained from Yao et al., 3 in vitro data from Liu et al. 9 and Touret et al., 10 and longitudinal clinical data (blue; solid line = available data; dashed line = extrapolated data. Raw data and curves from Yao et al. 3 were digitized and displayed directly in the plot. The model used for these data is shown in the original manuscript and used a sigmoidal concentration‐response function . For the recently added references (Liu et al. 9 and Touret et al. 10 ), a Hill coefficient equal to 1 was assumed, and the different points for plotting purposes were calculated from the half‐maximal effective concentration (EC50) values provided in the original manuscripts. (b) Table including the EC50 values and in vitro experimental conditions from Yao et al., Liu et al., and Touret et al. 3 , 9 , 10 *Adjusted EC50 was calculated to obtain the total drug value as follows: , where fu = 0.5.
Pharmacokinetic simulations
HCQ PKs, relative to in vitro and extrapolated in vivo EC50, are summarized in Figure 5 and Figure S2 (with population variability). Simulated unbound lung concentration are shown in Figure S3 .
Figure 5.
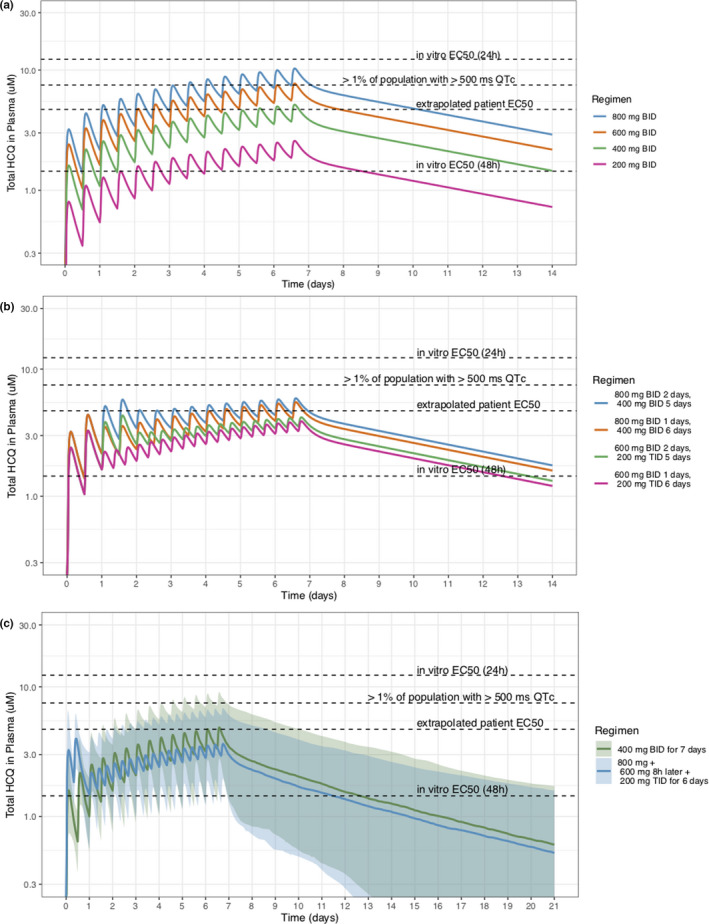
Pharmacokinetic (PK) simulations for optimal dose. (a) Population PK plasma profiles following different twice daily regimens. (b) Population PK plasma profiles following different combinations of loading and maintenance dosing. (c) Proposed dosing schemes with interindividual variability. Hydroxychloroquine (HCQ) concentration is detectable in plasma for up to 21 days. Apparent in vitro half‐maximal effective concentration (EC50s) were adjusted to account for plasma protein binding. QTc, corrected QT.
Optimal dosing regimens are those that, to the extent possible, are close or above the clinical EC50 values and below 7.5 µM, identified as the mean concentration associated with > 1% of patients having an increase in > 60 ms QTc while on treatment. Regimens that give ~ 800 mg/day either loaded upfront, or as 400 mg b.i.d., seem to have good efficacy and safety, and HCQ is detectable in plasma for up to 21 days (Figure 5c ).
External validation and simulations for optimal dose range
For PK/PD‐viral kinetics simulations, a median baseline CT of 27.13 (2.5–97.5%; 15.00–34.35) was assumed (Figure 6a ). First, we predicted the longitudinal viral loads of an external study of 80 patients receiving 200 mg t.i.d. of HCQ with azithromycin (Figure 6a ). The model predicted the viral decline in the first week, however, it overpredicted later time points. After incorporating a time varying function to mimic a delayed immune effect, predictions aligned well with the data throughout treatment (Figure 6a ). The simulations performed in order to obtain the predicted percentage of patients with positive PCR accounted for interindividual variability in the PK and growth rate kinetics. The data were not sufficient to identify variability in the drug effect and it was not included in our simulations.
Figure 6.
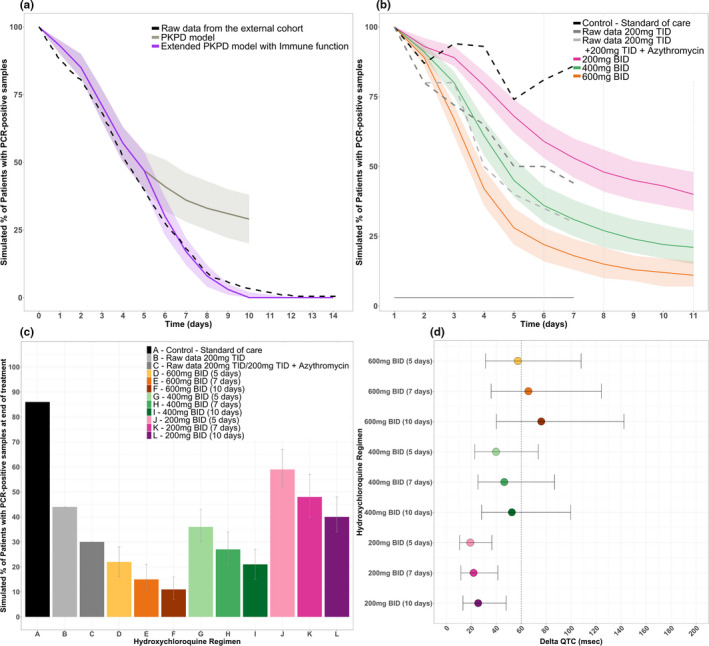
Efficacy and safety simulations. (a) External validation of the model using original structure and extended structure with immune effect. (b) Predicted proportion of adults with detectable viral loads over time, stratified by regimen. (c) Median simulated proportion of adults with detectable viral loads at the end of treatment, stratified by regimen. (d) Predicted delta corrected QT (QTc; using a baseline QTc of 394 ± 30 SD) for each regimen of interest. PCR, polymerase chain reaction; PKPD, pharmacokinetic pharmacodynamic.
HCQ 800 mg b.i.d. for 10 days was predicted to produce the lowest percentage of patients with detectable viral loads (9%), however, it was predicted to result in a significant probability of QTc prolongation (data not shown). Both 400 mg b.i.d. for 7 or 10 days, and 600 mg b.i.d. for 5, 7, or 10 days were predicted to have lower detectable viral loads than those previously studied (Figure 6b,c ). Dosing regimens that included loading doses 800 mg b.i.d. and 600 mg b.i.d. for 1 or 2 days followed by a maintenance dose of 400 mg b.i.d. or 200 mg t.i.d. are shown in Figure S4 . By comparison, 200 mg b.i.d. or t.i.d. regimens showed modest efficacy. Reaching EC50 levels faster by using higher doses seems to offer more benefit compared with extending treatment duration.
Prediction of QTc prolongation
Both longer durations and higher doses of HCQ resulted in greater QTc prolongation (Figure 6d ; Table S2 ). An average patient with baseline QTc value of 420 ms or less could receive higher doses of 400 mg b.i.d. over 5 or 7 days with minimal risk (1.0% and 2.0%) of QTc prolongation (Table S3 ). Given the number of assumptions, reported numbers should be interpreted more as an indication of risk, which remain to be determined in clinical trials.
Sensitivity analysis
The viral load decline in the control arms was substantially different in the two reported clinical studies (Figure 7a ). 6 , 21 We explored HCQ efficacy under different control arm scenarios. Different viral growth and death values were obtained when the model was fit to each study's control arm. This represents the intrinsic variability of disease progression, and, accordingly, resulted in different viral kinetics over time, suggesting large uncertainty and variability in the natural history of disease. Two dosing regimens (400 mg HCQ daily and 400 mg HCQ b.i.d.) were simulated and overlaid for comparison with the different natural history scenarios (Figure 7b ). This sensitivity analysis revealed that the low‐dose regimen might be indistinguishable from placebo under different control group scenarios. However, higher HCQ doses (≥ 400 mg b.i.d.) are likely to show efficacy in viral clearance regardless of the control arm.
Figure 7.
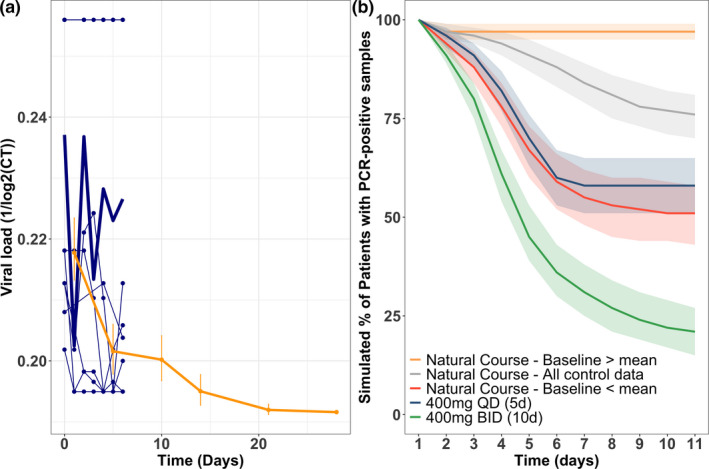
Sensitivity analysis. (a) Raw data of the control arm from the published data from Gautret et al. (blue), 6 and from Cao et al. (yellow). 21 (b) Predicted proportion of adults with detectable viral loads over time assuming different natural course of the disease scenarios (high, low, and mixed baseline) and showing two different treatment options. CT, cycle threshold; PCR, polymerase chain reaction.
Discussion
For HCQ to maximally suppress SARS‐CoV‐2 replication in vivo, the HCQ dose may need to be optimized. To best define the effective HCQ concentrations for treatment of COVID‐19, all available data from in vitro and clinical studies using HCQ for SARS‐CoV‐2 were pooled to quantify the relationship between HCQ PK and SARS‐CoV‐2 viral decline in patients with COVID‐19. We predicted that higher HCQ daily doses (e.g., as high as 800 mg b.i.d.), were associated with rapid rates of viral decline and increased the percentage of PCR‐negative patients but could result in increased risk of QTc prolongation. Regimens that give ~ 800 mg/day either loaded upfront or as 400 mg b.i.d., could be safely tolerated and would reduce the time with a detectable SARS‐CoV‐2 viral load, and, thus, improve treatment outcomes. Higher HCQ doses of up to 800 mg b.i.d. could result in even faster rates of viral decline but there is limited safety information for these high doses.
HCQ pharmacology is complex; HCQ distributes extensively into erythrocytes (whole blood to plasma ratio ~ 3.8, exhibits a long half‐life (123 hours) and a large volume of distribution, all attributed to extensive tissue uptake, clearly important for treatment of COVID‐19 systemic illness. 22 , 23 HCQ and CQ are diprotic weak bases (with PKa of 9.67 and 8.27 vs. 10.18 and 8.38 for HCQ and CQ, respectively). 24 Interestingly, both drugs experience ion‐trapping in which the drug becomes ionized in acidic environments like the lysosome (pH ~ 5.0). This causes an irreversible accumulation, explains the large volume of distribution, and potentially impacts the amount of free drug available in tissues. 25 , 26 HCQ is converted into at least three metabolites (desethylhydroxychloroquine, desethylchloroquine, and bidesethylhdroxychloroquine). Desethylhydroxychloroquine HCQ, the primary metabolite, is pharmacologically active for some nonviral illnesses, and formed by various cytochrome P450 isozymes. For our analysis, we focused on the parent HCQ, as potent in vitro activity against SARS‐CoV‐2 has only been described for the parent compound. 3
For derivation of our dosing rationale, we have utilized HCQ levels in plasma, instead of the lungs. Lung accumulation has been observed for HCQ and CQ in animal PK studies and reported to be substantial (a partition coefficient of 281 (102.45)). The partition coefficient ratio enables quantification of the total drug concentration in the tissue, and by assuming the same fraction of unbound drug in plasma and tissue, one can further estimate unbound concentrations in the tissue. By using this approach, a wide range of doses, including doses as low as 10 mg, seem to be potentially therapeutic. The drug efficacy at the site of action is determined by the fraction of drug unbound in the tissue, which has not been studied for HCQ, and, thus, the amount of free drug in tissue remains unknown. Highly lipophilic drugs for other infectious diseases, like bedaquiline and clofazimine, accumulate in lungs as well, however, the accumulation correlates with binding to macromolecules in tissue, not necessarily to the free fraction. 27 , 28 Based on the physicochemical parameters of HCQ (log P of 3.85 and pKa of 9.67, 8.27), the fraction unbound in tissue is likely low. 29 Therefore, in our study, we conservatively assume that the free fraction in plasma equilibrates between plasma and tissue and consider that to be the fraction of drug that can contribute to drug effect. Tissue binding studies using a rapid equilibrium dialysis assay with lung homogenate should be performed to define an accurate fraction unbound in the tissue.
Using a mechanistic PK/PD modeling approach, we were able to quantify a relationship between HCQ concentration and SARS‐CoV‐2 viral decline. However, we were not able to differentiate if azithromycin offered any additional benefit. The group receiving HCQ and azithromycin had the lowest baseline viral load and showed a similar rate of viral decline compared with the HCQ group. 6 Therefore, it remains unclear if azithromycin offers any additional benefit.
Clinically significant QTc prolongation associated with HCQ have been reported. 30 , 31 , 32 Only two small observational studies have reported associations between HCQ doses of 200–400 mg daily and QTc prolongation 32 , 33 and a concentration‐dependent QTc relationship is not available. As a result, we used CQ as a model to predict QTc prolongation risk. 19 HCQ and CQ have an identical structure with the substitution of a hydroxyl group for HCQ, and both have been found in vitro to inhibit the inward rectifier K+ channels. 34 , 35 This has been associated with QTc prolongation, and docking studies suggest nitrogen in the alkylamine and quinoline ring found in both compounds are responsible for binding with potassium channels. 36 Although a dedicated study is needed, the hydroxyl group in HCQ is unlikely to affect rectifier K+ channels binding as the pKa for the alkylamine nitrogen is similar to that of chloroquine's. 37 In vitro data from CQ identified an hERG IC50 of 2,500 nM. 38 We leveraged a recent study of high‐dose CQ for malaria treatment to predict potential risk of QTc prolongation with HCQ. 19 In support of our findings, a maximum dose of 1,200 mg daily for 2–6 weeks has been well‐tolerated without reported cardiac toxicity. 39 , 40 Based on this evidence, and the PK‐QTc relationship for CQ presented here, we expect a HCQ course of 400–600 mg b.i.d. for 10 days or less is unlikely to be associated with clinically significant cardiac toxicity in patients without a known risk factor for QTc prolongation. 41 As data for HCQ and QTc prolongation are limited, we recommend the highest doses of HCQ be reserved for study in dose escalation studies.
Additional toxicities associated with HCQ include retinopathy and gastrointestinal adverse events. 39 , 42 The mechanism of irreversible retinal damage associated with HCQ is unknown, but it has been associated with HCQ doses > 5 mg/kg and in patients who receive HCQ for > 5 years. 42 Retinopathy associated with use < 1 month of HCQ has not been reported, and this side effect is less likely in the acute setting. 30 , 43 Gastrointestinal toxicity with HCQ is concentration‐related and could be a limiting factor to dosage of HCQ but doses up to 1,200 mg have been reported to be well‐tolerated without adverse events in patients with cancer and rheumatologic disease in other studies. 39 , 40
There were a few limitations to this study. First, clinical HCQ data are limited to nonrandomized studies, and a clear model for the natural rate of viral decline is not well defined. To explore this effect, we compared viral kinetic trends on treatment to the extracted baseline data from Cao et al. (n = 100 hospitalized patients who received supportive care). 21 Second, the translational viral replication was obtained from SARS‐CoV‐1 data. SARS‐CoV‐1 and SARS‐CoV‐2 share an estimated 79.6% sequence homology. 44 Third, we imputed the PK profiles for HCQ using population PK parameters derived from a pool of both healthy and malaria‐infected patients. Fourth, we were not able to predict how concomitant HCQ and azithromycin may impact the risk of QTc prolongation or anticipate how underlying risk factors for QTc prolongation could impact the PK‐QTc relationship due to the lack of available data. Closely monitored clinical trials will be needed to confirm that high‐dose HCQ is safe with or without azithromycin. Finally, our model used plasma HCQ concentrations to predict nasopharyngeal viral loads, which may not fully correlate with clinical improvement or viral load measured at different sites, however, it has generally been accepted that viral decline is a desirable marker leading to clinical improvement. 45 , 46 , 47 , 48 , 49 , 50 In addition, all relevant assumptions made during the analysis are summarized in Supplementary Table S4 .
Treatment options for COVID‐19 can most effectively be advanced by utilizing all available data and pharmacologically driven drug repurposing. Suboptimal dosing can result in wasted time and resources. Even more problematic is the potential to declare a drug ineffective because of misdosing. Using PK‐exposure modeling, we predict that higher doses of HCQ will be needed to achieve cure within 7 days for all patients. Given the observed prolonged viral shedding in patients with COVID‐19, these data support the possibility that early treatment with high‐dose HCQ could reduce transmissibility and potentially reduce the risk of late clinical decompensation. However, given the possibility of QTc prolongation with high‐dose regimens, rigorous trials must precede widespread clinical usage. We predict that higher HCQ doses, (> 400 mg b.i.d.) are most efficacious for viral suppression and should be further examined in clinical trials to evaluate safety and efficacy.
Funding
No funding was received for this work.
Conflict of Interest
The authors declared no conflict of interest.
Author Contributions
All authors wrote the manuscript. B.P.S., M.G.‐C., J.E., E.H., E.W., R.M.S., F.A., and A.L. designed the research. B.P.S., M.G.‐C., J.E., E.H., E.W., R.M.S., F.A., and A.L. performed the research. B.P.S., M.G.‐C., J.E., E.H., E.W., R.M.S., F.A., and A.L. analyzed the data.
Supporting information
Fig S1
Fig S2
Fig S3
Fig S4
Table S1
Table S2
Table S3
Table S4
Acknowledgment
The investigators thank the Savic laboratory for all their help and support during this project. We would also like to thank Tia Tummino for her help addressing reviewer comments.
Linked article: This article is linked to Letter to Editor by Standing, J.F. Clin. Pharmacol. Ther. 108, 187 (2020) https://doi.org/10.1002/cpt.1872 Response Letter to Editor by Garcia‐Cremades, M. et al. Clin. Pharmacol. Ther. 108, 189 (2020) https://doi.org/10.1002/cpt.1873
References
- 1. World Health Organization . (2020). Coronavirus disease (COVID‐19) outbreak situation <https://www.who.int/emergencies/diseases/novel‐coronavirus‐2019> (Geneva, Switzerland,2020).
- 2. Biot, C. et al. Design and synthesis of hydroxyferroquine derivatives with antimalarial and antiviral activities. J. Med. Chem. 49, 2845–2849 (2006). [DOI] [PubMed] [Google Scholar]
- 3. Yao, X. et al. In vitro antiviral activity and projection of optimized dosing design of hydroxychloroquine for the treatment of severe acute respiratory syndrome Coronavirus 2 (SARS‐CoV‐2). Clin. Infect. Dis. (2020). 10.1093/cid/ciaa237 [DOI] [PMC free article] [PubMed] [Google Scholar]
- 4. Wang, M. et al. Remdesivir and chloroquine effectively inhibit the recently emerged novel coronavirus (2019‐nCoV) in vitro. Cell Res. 30, 269–271 (2020). [DOI] [PMC free article] [PubMed] [Google Scholar]
- 5. Schrezenmeier, E. & Dorner, T. Mechanisms of action of hydroxychloroquine and chloroquine: implications for rheumatology. Nat. Rev. Rheumatol. 16, 155–166 (2020). [DOI] [PubMed] [Google Scholar]
- 6. Gautret, P. et al. Hydroxychloroquine and azithromycin as a treatment of COVID‐19: results of an open‐label non‐randomized clinical trial. Int. J. Antimicrob. Agents 105949, (2020). 10.1016/j.ijantimicag.2020.105949 [DOI] [PMC free article] [PubMed] [Google Scholar]
- 7. Jun, C. et al. A pilot study of hydroxychloroquine in treatment of patients with common coronavirus disease‐19 (COVID‐19). J. Zhejiang Univ. (Med Sci) 49, (2020). 10.3785/j.issn.1008-9292.2020.03.03 [DOI] [Google Scholar]
- 8.Centers for Disease Control and Prevention. Information for clinicians on therapeutic options for COVID‐19 patients <https://www.cdc.gov/coronavirus/2019‐ncov/hcp/therapeutic‐options.html> (2020).
- 9. Liu, J. et al. Hydroxychloroquine, a less toxic derivative of chloroquine, is effective in inhibiting SARS‐CoV‐2 infection in vitro. Cell Discov. 6, 16 (2020). [DOI] [PMC free article] [PubMed] [Google Scholar]
- 10. Touret, F. et al. In vitro screening of a FDA approved chemical library reveals potential inhibitors of SARS‐CoV‐2 replication. bioRxiv. 10.1101/2020.04.03.023846 [DOI] [PMC free article] [PubMed] [Google Scholar]
- 11. Rohatgi, A.W. WebPlotDigitizer <https://automeris.io/WebPlotDigitizer> (2019).
- 12. Kaye, M. SARS‐associated coronavirus replication in cell lines. Emerg. Infect. Dis. 12, 128–133 (2006). [DOI] [PMC free article] [PubMed] [Google Scholar]
- 13. Mulangu, S. et al. A randomized, controlled trial of Ebola virus disease therapeutics. N. Engl. J. Med. 381, 2293–2303 (2019). [DOI] [PMC free article] [PubMed] [Google Scholar]
- 14. Gautret, P. et al. Clinical and microbiological effect of a combination of hydroxychloroquine and azithromycin in 80 COVID‐19 patients with at least a six‐day follow up: an observational study. Travel Med Infect Dis. (2020). 10.1016/j.tmaid.2020.101663 [DOI] [PMC free article] [PubMed] [Google Scholar]
- 15. Lim, H.S. et al. Pharmacokinetics of hydroxychloroquine and its clinical implications in chemoprophylaxis against malaria caused by Plasmodium vivax . Antimicrob. Agents Chemother. 53, 1468–1475 (2009). [DOI] [PMC free article] [PubMed] [Google Scholar]
- 16. Uges, D.R. Plasma or serum in therapeutic drug monitoring and clinical toxicology. Pharm. Weekbl. Sci. 10, 185–188 (1988). [DOI] [PubMed] [Google Scholar]
- 17. Ahn, J.E. , Karlsson, M.O. , Dunne, A. & Ludden, T.M. Likelihood based approaches to handling data below the quantification limit using NONMEM VI. J. Pharmacokinet. Pharmacodyn. 35, 401–421 (2008). [DOI] [PubMed] [Google Scholar]
- 18. Beal, S.L. Ways to fit a PK model with some data below the quantification limit. J. Pharmacokinet. Pharmacodyn. 28, 481–504 (2001). [DOI] [PubMed] [Google Scholar]
- 19. Ursing, J. et al. High‐dose chloroquine for uncomplicated Plasmodium falciparum malaria is well tolerated and causes similar QT interval prolongation as standard‐dose chloroquine in children. Antimicrob. Agents Chemother. 64, (2020). 10.1128/AAC.01846-19 [DOI] [PMC free article] [PubMed] [Google Scholar]
- 20. Mzayek, F. et al. Randomized dose‐ranging controlled trial of AQ‐13, a candidate antimalarial, and chloroquine in healthy volunteers. PLoS Clin. Trials 2, e6 (2007). [DOI] [PMC free article] [PubMed] [Google Scholar]
- 21. Cao, B. et al. A trial of lopinavir‐ritonavir in adults hospitalized with severe Covid‐19. N. Engl. J. Med. (2020). 10.1056/NEJMoa2001282 [DOI] [PMC free article] [PubMed] [Google Scholar]
- 22. Balevic, S.J. et al. Pharmacokinetics of hydroxychloroquine in pregnancies with rheumatic diseases. Clin. Pharmacokinet. 58, 525–533 (2019). [DOI] [PMC free article] [PubMed] [Google Scholar]
- 23. Hydroxychloroquine. Package Insert. (Concordia Pharmaceuticals Inc., St. Michael, Barbados, 2017). [Google Scholar]
- 24. Chinappi, M. , Via, A. , Marcatili, P. & Tramontano, A. On the mechanism of chloroquine resistance in Plasmodium falciparum . PLoS One 5, e14064 (2010). [DOI] [PMC free article] [PubMed] [Google Scholar]
- 25. Collins, K.P. , Jackson, K.M. & Gustafson, D.L. Hydroxychloroquine: a physiologically‐based pharmacokinetic model in the context of cancer‐related autophagy modulation. J. Pharmacol. Exp. Ther. 365, 447–459 (2018). [DOI] [PMC free article] [PubMed] [Google Scholar]
- 26. Daniel, W.A. , Bickel, M.H. & Honegger, U.E. The contribution of lysosomal trapping in the uptake of desipramine and chloroquine by different tissues. Pharmacol. Toxicol. 77, 402–406 (1995). [DOI] [PubMed] [Google Scholar]
- 27. Sarathy, J.P. et al. Prediction of drug penetration in tuberculosis lesions. ACS Infect. Dis. 2, 552–563 (2016). [DOI] [PMC free article] [PubMed] [Google Scholar]
- 28. Strydom, N. et al. Tuberculosis drugs' distribution and emergence of resistance in patient's lung lesions: A mechanistic model and tool for regimen and dose optimization. PLoS Med. 16, e1002773 (2019). [DOI] [PMC free article] [PubMed] [Google Scholar]
- 29. Warhurst, D.C. , Steele, J.C. , Adagu, I.S. , Craig, J.C. & Cullander, C. Hydroxychloroquine is much less active than chloroquine against chloroquine‐resistant Plasmodium falciparum, in agreement with its physicochemical properties. J. Antimicrob. Chemother. 52, 188–193 (2003). [DOI] [PubMed] [Google Scholar]
- 30. de Olano, J. , Howland, M.A. , Su, M.K. , Hoffman, R.S. & Biary, R. Toxicokinetics of hydroxychloroquine following a massive overdose. Am. J. Emerg. Med. 37, e5–e8 (2019). [DOI] [PubMed] [Google Scholar]
- 31. O'Laughlin, J.P. , Mehta, P.H. & Wong, B.C. Life threatening severe QTc prolongation in patient with systemic lupus erythematosus due to hydroxychloroquine. Case Rep. Cardiol. 2016, 4626279 (2016). [DOI] [PMC free article] [PubMed] [Google Scholar]
- 32. Chen, C.Y. , Wang, F.L. & Lin, C.C. Chronic hydroxychloroquine use associated with QT prolongation and refractory ventricular arrhythmia. Clin. Toxicol. (Phila). 44, 173–175 (2006). [DOI] [PubMed] [Google Scholar]
- 33. Negoescu, A. , Thornback, A. , Wong, E. & Ostor, A.J. Long QT and hydroxychloroquine; a poorly recognised problem in rheumatology patients. In ACR/ARHP Annual Meeting (2013). Abstract number 2045.
- 34. Kazama, I. , Maruyama, Y. , Murata, Y. & Sano, M. Voltage‐dependent biphasic effects of chloroquine on delayed rectifier K(+)‐channel currents in murine thymocytes. J. Physiol. Sci. 62, 267–274 (2012). [DOI] [PMC free article] [PubMed] [Google Scholar]
- 35. Giudicessi, J.R. , Noseworthy, P.A. , Friedman, P.A. & Ackerman, M.J. Urgent guidance for navigating and circumventing the QTc‐prolonging and torsadogenic potential of possible pharmacotherapies for coronavirus disease 19 (COVID‐19). Mayo Clin. Proc. (2020). 10.1016/j.mayocp.2020.03.024 [DOI] [PMC free article] [PubMed] [Google Scholar]
- 36. Rodriguez‐Menchaca, A.A. et al. The molecular basis of chloroquine block of the inward rectifier Kir2.1 channel. Proc. Natl. Acad. Sci. USA 105, 1364–1368 (2008). [DOI] [PMC free article] [PubMed] [Google Scholar]
- 37. Newton, D.W. & Kluza, R.B. pKa values of medicinal compounds in pharmacy practice. Drug Intell. Clin. Phar. 12, 546–554 (1978). [Google Scholar]
- 38. White, N.J. Cardiotoxicity of antimalarial drugs. Lancet Infect. Dis. 7, 549–558 (2007). [DOI] [PubMed] [Google Scholar]
- 39. Munster, T. et al. Hydroxychloroquine concentration‐response relationships in patients with rheumatoid arthritis. Arthritis Rheum. 46, 1460–1469 (2002). [DOI] [PubMed] [Google Scholar]
- 40. Rangwala, R. et al. Phase I trial of hydroxychloroquine with dose‐intense temozolomide in patients with advanced solid tumors and melanoma. Autophagy 10, 1369–1379 (2014). [DOI] [PMC free article] [PubMed] [Google Scholar]
- 41. Tisdale, J.E. et al. Development and validation of a risk score to predict QT interval prolongation in hospitalized patients. Circ. Cardiovasc. Qual. Outcomes 6, 479–487 (2013). [DOI] [PMC free article] [PubMed] [Google Scholar]
- 42. Melles, R.B. & Marmor, M.F. The risk of toxic retinopathy in patients on long‐term hydroxychloroquine therapy. JAMA Ophthalmol. 132, 1453–1460 (2014). [DOI] [PubMed] [Google Scholar]
- 43. Chansky, P.B. & Werth, V.P. Accidental hydroxychloroquine overdose resulting in neurotoxic vestibulopathy. BMJ Case Rep. 2017, (2017). 10.1136/bcr-2016-218786 [DOI] [PMC free article] [PubMed] [Google Scholar]
- 44. Zhou, P. et al. A pneumonia outbreak associated with a new coronavirus of probable bat origin. Nature 579, 270–273 (2020). [DOI] [PMC free article] [PubMed] [Google Scholar]
- 45. Zou, L. et al. SARS‐CoV‐2 viral load in upper respiratory specimens of infected patients. N. Engl. J. Med. 382, 1177–1179 (2020). [DOI] [PMC free article] [PubMed] [Google Scholar]
- 46. Pan, Y. , Zhang, D. , Yang, P. , Poon, L.L.M. & Wang, Q. Viral load of SARS‐CoV‐2 in clinical samples. Lancet Infect. Dis. 20, 411–412 (2020). [DOI] [PMC free article] [PubMed] [Google Scholar]
- 47. Wolfel, R. et al. Virological assessment of hospitalized patients with COVID‐2019. Nature (2020). 10.1038/s41586-020-2196-x [DOI] [PubMed] [Google Scholar]
- 48. Wang, W. et al. Detection of SARS‐CoV‐2 in different types of clinical specimens. JAMA (2020). 10.1001/jama.2020.3786 [DOI] [PMC free article] [PubMed] [Google Scholar]
- 49. Zou, X. , Chen, K. , Zou, J. , Han, P. , Hao, J. & Han, Z. Single‐cell RNA‐seq data analysis on the receptor ACE2 expression reveals the potential risk of different human organs vulnerable to 2019‐nCoV infection. Front. Med. (2020). 10.1007/s11684-020-0754-0 [DOI] [PMC free article] [PubMed] [Google Scholar]
- 50. Xu, H. et al. High expression of ACE2 receptor of 2019‐nCoV on the epithelial cells of oral mucosa. Int. J. Oral Sci. 12, 8 (2020). [DOI] [PMC free article] [PubMed] [Google Scholar]
Associated Data
This section collects any data citations, data availability statements, or supplementary materials included in this article.
Supplementary Materials
Fig S1
Fig S2
Fig S3
Fig S4
Table S1
Table S2
Table S3
Table S4