

Abstract
The aim of our study was to evaluate the therapeutic effect of antiviral drugs on coronavirus disease 2019 (COVID‐19) pneumonia. Patients confirmed with COVID‐19 pneumonia were enrolled and divided into seven groups according to the treatment option. Information including age, sex, and duration from illness onset to admission, clinical manifestations, and laboratory data at admission, and length of hospital stay were evaluated. The chest computed tomography (CT) imaging obtained at admission and after a 5‐day treatment cycle were assessed. The clinical symptoms and laboratory tests at discharge were also assessed. At admission, no significant differences were found among the groups, including the duration from illness onset to admission, clinical symptoms, and main laboratory results. No significant differences were found among the groups in terms of the proportion of patients with pneumonia resolution (P = .151) after treatment or the length of hospital stay (P = .116). At discharge, 7 of 184 (4%) patients had a mild cough while their other symptoms had disappeared, and the proportion of patients with abnormal liver function and with increased leukocytes, neutrophils or erythrocyte sedimentation rate among the 184 patients were close to those at admission. According to the results, the inclusion of antiviral drugs in therapeutic regimens based on symptomatic treatment had no significant additional impact on the improvement in COVID‐19 patients. In addition, the results of chest CT imaging, clinical manifestations, and laboratory tests at discharge were not completely consistent.
Keywords: antiviral drug, COVID‐19 pneumonia, CT imaging, therapeutic effect
Highlights
Therapeutic effect of commercial antiviral drugs on COVID‐19 pneumonia.
1. INTRODUCTION
Coronavirus disease 2019 (COVID‐19) pneumonia is caused by a new type of coronavirus (severe acute respiratory syndrome coronavirus 2 [SARS‐CoV‐2]) that has spread rapidly throughout China and other countries. 1 , 2 As of 10 March 2020, there have been more than 80 000 confirmed patients and more than 3000 confirmed deaths related to the virus in China (Xinhua News). Due to the rapid spread and atypical early symptoms of infection, the virus has caused a worldwide epidemic, posing a serious threat to the health of the people of China and the world. 3 , 4 , 5 Although the development of vaccines, small molecules, and biotherapies that specifically target SARS‐CoV‐2 is important, the creation of drugs and biological products can take months to years, making it difficult to benefit current infected patients.
At present, a few potential treatment options for COVID‐19 pneumonia are being discussed. As a broad‐spectrum antiviral drug that has been widely used clinically for the treatment of viral diseases, 6 interferon‐α was used to treat SARS‐CoV and Middle East respiratory syndrome(MERS)‐CoV patients 7 , 8 and has now been selected for the treatment of COVID‐19 pneumonia in China. 9 A deep‐learning‐based drug–target interaction prediction shows that antiretroviral drugs used for the prevention and treatment of human immunodeficiency virus have also been considered to be potential options. 10 According to the current guidelines, 9 drugs including interferon‐α, remdesivir, and lopinavir/ritonavir have been recommended for the treatment of COVID‐19 pneumonia. 9 , 11 , 12 These medicines come from experience in treating SARS, MERS, and other novel influenza viruses. 13 , 14 , 15 More relevant treatment options have been summarized in a previous report. 16 Despite this, the treatment of COVID‐19 pneumonia remains challenging, as there are no specific and effective drugs for the disease. The purpose of the present study was to determine the therapeutic effect of available antiviral drugs on COVID‐19 pneumonia.
2. MATERIALS AND METHODS
2.1. Study population
This study was approved by the Institutional Review Board of Shanghai Public Health Clinical Center (YJ‐2020‐S035‐01). COVID‐19‐infected patients admitted to our center confirmed by positive COVID‐19 nucleic acid antibody testing were eligible for the study 17 and were observed from 20 January 2020 to 7 February 2020. All patients received symptomatic treatment, some of whom received randomized antiviral drugs. According to the treatment option, administered over a 5‐day cycle, these patients were divided into the symptomatic treatment group, arbidol group, lopinavir/ritonavir group, arbidol + lopinavir/ritonavir group, interferon group, interferon + lopinavir/ritonavir group, and interferon + darunavir group (doses: interferon, interferon‐α2β [aerosol inhalation], 100 000 U/kg, two times/day; arbidol, 200 mg, three times/day; lopinavir/ritonavir, two tablets, two times/day; darunavir, one tablet, one time/day). Our exclusion criteria were as follows: (a) patients who did not undergo thin‐section computed tomography (CT) at admission or after treatment, (b) patients with CT images that did not demonstrate any pneumonia at admission, (c) patients with a duration of treatment less than 5 days, (d) patients infected with other common bacteria, (e) patients whose treatment plan was changed, (f) patients who were not discharged, and (g) patients categorized as severe at admission. 18
Information from the patients' medical records, including age, sex, duration from illness onset to admission and length of hospital stay, was recorded. Clinical manifestations including fever, cough, little phlegm, runny nose, chest congestion, headache, and myalgia or fatigue and laboratory results including alanine aminotransferase (ALT), aspartate aminotransferase (AST), leukocytes, neutrophils, lymphocytes, and erythrocyte sedimentation rate at admission were collected.
2.2. Imaging examinations
All patients underwent chest CT scans at admission and at day 1 or day 2 after treatment. The scanner was a 64‐section scanner (SCENARIA 64 CT; Hitachi Medical, Japan) with the following protocol: 120 kV; automatic tube current; iterative reconstruction technique; slice thickness, 5 mm; interval, 5 mm; pitch, 1.5; collimation, 0.625 mm; rotation time, 0.35 seconds; matrix, 512 × 512; and breath‐holding following inspiration. All examinations were performed from the apex of the lungs to the diaphragmatic surface. A mediastinal (width, 350 HU; level, 40 HU) window and a lung (width, 1200 HU; level −600 HU) window were used.
2.3. Image analysis
According to previous reports, the most common manifestations of COVID‐19 pneumonia on thin‐section CT images are ground‐glass opacities, the crazy‐paving pattern and consolidation. 19 , 20 , 21 To determine whether the disease had been resolved after treatment, the Quantitative Evaluation System of CT for Pneumonia (YT‐CT‐Lung; YITU Healthcare Technology, China) was applied as the CT image analysis tool. This system combines a convolutional neural network and a thresholding method to detect pulmonary shadows. The CT value distribution in the lungs is calculated to obtain a histogram, which is subsequently used to calculate the pulmonary inflammation volume (pneumonia volume). A decreased patient pneumonia volume after treatment was considered resolution; otherwise, progression was considered. Then, the proportion of the resolution of each group was obtained. In addition, the chest CT findings were also reviewed by two radiologists (YS and XS, with approximately 32 and 6 years of experience in thoracic imaging, respectively) to ensure the reliability of the results (improvement or progression).
2.4. Determination of therapeutic effects between treatment plans
The therapeutic effects between treatment plans were assessed from short‐term and long‐term perspectives. The short‐term perspective was described as the proportion of improvement (decrease in the pneumonia volume after treatment) among the groups. Similarly, the length of hospital stay among the groups was used as a long‐term perspective. In addition, the results of clinical manifestations and laboratory tests at discharge were also collected.
2.5. Data analysis
Data are presented as the means ± standard deviations, medians, and interquartile ranges (IQRs), or numbers (%), as appropriate. Continuous variables were compared with the Kruskal‐Wallis test, analysis of variance (ANOVA) or the permutation test for one‐way ANOVA. The frequencies of the categorical variables were compared by the Pearson χ 2 or Fisher's exact tests. All analyses were considered statistically significant at a P value of less than .05.
3. RESULTS
3.1. Clinical and laboratory findings before treatment
Of the 241 patients considered as of 7 February 2020, 57 patients were excluded, and 184 patients were enrolled in this retrospective, single‐center study. The demographics, duration from illness onset to admission and clinical symptoms are shown in Table 1. The 184 patients were aged from 15 to 84 years (49 ± 15 years) and consisted of 99 (54%) men and 85 (46%) women. The median duration from illness onset to admission was 4.0 days (IQR: 3.0‐7.0). On admission, the most common clinical manifestation was fever (144/184, 78%), followed by cough (83/184, 45%), myalgia or fatigue (55/184, 30%), little phlegm (47/184, 26%), headache (22/184, 12%), stuffy or runny nose (13/184, 7%), and chest congestion (12/184, 6%).
Table 1.
Demographic and clinical manifestations of COVID‐19 pneumonia patients
| All patients (n = 184) | Symptomatic treatment (n = 17) | Arbidol (n = 30) | Lopinavir/ritonavir (n = 27) | Arbidol+ lopinavir/ritonavir (n = 25) | Interferon (n = 41) | Interferon + lopinavir/ritonavir (n = 21) | Interferon + darunavir (n = 23) | P value | |
|---|---|---|---|---|---|---|---|---|---|
| Age,y | 48.7 ± 15.6 | 49.0 ± 14.3 | 47.0 ± 15.6 | 49.4 ± 14.8 | 54.0 ± 15.4 | 46.2 ± 18.1 | 47.1 ± 15.3 | 50.3 ± 13.2 | .578 a |
| Sex | .564 b | ||||||||
| Male | 99 (54%) | 8 (47%) | 18 (60%) | 15 (56%) | 16 (64%) | 17 (42%) | 11 (52%) | 14 (61%) | |
| Female | 85 (46%) | 9 (53%) | 12 (40%) | 12 (44%) | 9 (36%) | 24 (59%) | 10 (48%) | 9 (39%) | |
| Duration, d | 4.0 (3.0‐7.0) | 4.0 (2.0‐6.0) | 4.0 (3.0‐6.5) | 5.0 (3.0‐8.0) | 3.0 (2.0‐6.0) | 5.0 (3.0‐8.0) | 6.0 (3.0‐9.0) | 5.0 (2.0‐7.0) | .245 c |
| Clinical manifestations | |||||||||
| Fever | 144 (78%) | 14 (82%) | 20 (67%) | 23 (85%) | 23 (92%) | 30 (73%) | 18 (86%) | 16 (70%) | .277 b |
| Cough | 83 (45%) | 4 (24%) | 15 (50%) | 14 (52%) | 12(48%) | 21 (51%) | 5 (24%) | 12 (52%) | .174 b |
| Little phlegm | 47 (26%) | 2 (12%) | 6 (20%) | 9 (33%) | 5 (20%) | 14 (34%) | 3 (14%) | 8 (35%) | .254 b |
| Stuffy and runny nose | 13 (7%) | 1 (6%) | 1 (3%) | 1 (4%) | 0 (0%) | 7 (17%) | 1 (5%) | 2 (9%) | .201 d |
| Chest congestion | 12 (6%) | 1 (6%) | 1 (3%) | 3 (11%) | 1 (4%) | 1 (2%) | 4 (19%) | 1 (4%) | .250 d |
| Headache | 22 (12%) | 1 (6%) | 5 (17%) | 2 (7%) | 1 (4%) | 6 (15%) | 4 (19%) | 3 (13%) | .624 d |
| Myalgia or fatigue | 55 (30%) | 5 (29%) | 12 (40%) | 5 (19%) | 9 (36%) | 12 (29%) | 6 (29%) | 6 (26%) | .709 b |
Note: Data are mean ± SD, n (%), and median (IQR).
Abbreviations: ANOVA, analysis of variance; COVID‐19, coronavirus disease 2019; duration, duration from illness onset to admission; IQR, interquartile range.
P value comparing groups is from ANOVA.
P value comparing groups is from χ 2 tests.
P value comparing groups is from the Kruskal‐Wallis test.
P value comparing groups is from Fisher's exact test.
On admission, 36 of 184 (20%) patients had different degrees of liver dysfunction (ALT or AST above normal range) (Table 2). A small percentage of patients had an increase in leukocyte count (4/184, 2%) or neutrophil count (10/184, 5%). The lymphocyte count was below the normal range in 92 (50%) patients, and the erythrocyte sedimentation rate was elevated in most patients (169/184, 92%).
Table 2.
Laboratory results of COVID‐19 pneumonia patients at admission
| All patients (n = 184) | Symptomatic treatment (n = 17) | Arbidol (n = 30) | Lopinavir/ritonavir (n = 27) | Arbidol + lopinavir/ritonavir (n = 25) | Interferon (n = 41) | Interferon + lopinavir/ritonavir (n = 21) | Interferon + darunavir (n = 23) | P value | |
|---|---|---|---|---|---|---|---|---|---|
| Alanine aminotransferase (normal range 9.0‐50.0), U/L | 23.0 (15.0‐34.0) | 17.0 (13.0‐31.5) | 17.5 (13.0‐28.0) | 25.0 (19.0‐35.0) | 24.0 (19.0‐39.0) | 25.0 (14.5‐33.0) | 20.0 (15.0‐33.0) | 27.0 (16.0‐36.0) | .153 a |
| Increased | 19 (10%) | 3 (18%) | 2 (7%) | 1 (4%) | 5 (20%) | 2 (5%) | 4 (19%) | 2 (9%) | .199 b |
| Aspartate aminotransferase (normal range 15.0‐40.0), U/L | 24.0 (15.0‐34.0) | 28.0 (22.5‐31.5) | 22.5 (18.0‐31.0) | 24.0 (21.0‐35.0) | 28.0 (23.5‐50.0) | 24.0 (20.0‐31.0) | 22.0 (19.5‐33.0) | 24.0 (19.0‐33.0) | .230 a |
| Increased | 32 (17%) | 3 (18%) | 3 (10%) | 5 (19%) | 8 (32%) | 6 (15%) | 3 (14%) | 3 (13%) | .531 b |
| Leukocytes (normal range 3.5‐9.5), ×109/L | 4.7 (3.9‐5.9) | 4.4 (4.1‐6.4)0 (0%) | 4.3 (3.3‐5.5) | 5.0 (3.6‐6.1) | 4.2 (3.7‐5.2) | 5.3 (4.1‐6.7) | 4.6 (3.7‐5.2) | 5.2 (4.4‐5.9) | .320 a |
| Increased | 4 (2%) | 2 (7%) | 0 (0%) | 0 (0%) | 1 (2%) | 0 (0%) | 1 (4%) | .635 b | |
| Neutrophils (normal range 1.8‐6.3), ×109/L | 2.8 (2.3‐3.8) | 2.7 (2.1‐3.8) | 2.7 (1.8‐4.0) | 2.8 (2.1‐3.9) | 2.7 (2.3‐3.5) | 3.1 (2.4‐4.2) | 3.0 (2.4‐3.7) | 3.0 (2.5‐4.0) | .825 a |
| Increased | 10 (5%) | 1 (6%) | 4 (13%) | 1 (4%) | 0 (0%) | 2 (5%) | 1 (5%) | 1 (4%) | .584 b |
| Lymphocytes (normal range 1.1‐3.2), ×109/L | 1.2 ± 0.5 | 1.3 ± 0.5 | 1.1 ± 0.4 | 1.2 ± 0.6 | 1.0 ± 0.5 | 1.4 ± 0.6 | 1.2 ± 0.4 | 1.3 ± 0.4 | .070 a |
| Decreased | 92 (50%) | 7 (41%) | 17 (57%) | 13 (48%) | 17 (68%) | 18 (44%) | 10 (48%) | 10 (44%) | .495 c |
| Erythrocyte sedimentation rate (normal range 0.0‐15.0), mm/h | 64.1 ± 36.1 | 61.8 ± 28.3 | 62.3 ± 39.2 | 70.6 ± 41.7 | 62.5 ± 29.4 | 58.8 ± 38.1 | 73.4 ± 39.2 | 63.4 ± 32.8 | .777 d |
| Increased | 169 (92%) | 15 (88%) | 25 (83%) | 23 (85%) | 22 (88%) | 34 (83%) | 20 (95%) | 20 (87%) | .916 b |
Note: Data are median (IQR), n (%) and mean ± SD. Increased means exceeding the upper limit of the normal range and decreasing means less than the lower limit of the normal range.
Abbreviations: ANOVA, analysis of variance; COVID‐19, coronavirus disease 2019; IQR, interquartile range.
P value comparing groups is from the Kruskal‐Wallis test.
P value comparing groups is from Fisher's exact test.
P value comparing groups is from the Pearson χ 2 test.
P value comparing groups is from ANOVA.
Before treatment onset, there were no significant differences in terms of the patients' demographics, duration from illness onset to admission, clinical symptoms or main laboratory results among the groups receiving different treatment options.
3.2. CT imaging results before and after treatment
The pneumonia volumes for the different groups are presented in Table 3. On admission, the average pneumonia volume in the 184 patients was 217.0 ± 258.9 cm3. After treatment, an improvement in pulmonary involvement (Figures 1 and 2) was observed in more than half of the patients (98/184, 53%) (Table 4) despite an increase in the average pneumonia volume (286.4 ± 340.7). Among the groups receiving different treatment options, the average pneumonia volume in all groups increased to varying degrees after treatment except for the interferon + lopinavir/ritonavir group (before: 263.0 ± 318.0, after: 223.1 ± 316.1). However, no significant difference in the volume change (after‐before) of pneumonia was demonstrated among the groups (P = .151).
Table 3.
Pneumonia volumes before and after treatment in COVID‐19 pneumonia patients
| All patients (n = 184) | Symptomatic treatment (n = 17) | Arbidol (n = 30) | Lopinavir/ritonavir (n = 27) | Arbidol + lopinavir/ritonavir (n = 25) | Interferon (n = 41) | Interferon + lopinavir/ritonavir (n = 21) | Interferon + darunavir (n = 23) | P value | |
|---|---|---|---|---|---|---|---|---|---|
| Pneumonia volume | |||||||||
| Before treatment | 217.0 ± 258.9 | 173.7 ± 195.8 | 257.2 ± 350.7 | 277.0 ± 291.0 | 279.9 ± 244.9 | 126.9 ± 172.2 | 263.0 ± 318.0 | 172.8 ± 170.2 | |
| After treatment | 286.4 ± 340.7 | 251.3 ± 198.3 | 313.0 ± 370.3 | 398.6 ± 397.7 | 442.9 ± 331.3 | 166.1 ± 227.3 | 223.1 ± 316.1 | 240.1 ± 433.2 | |
| After‐before | 68.7 ± 247.1 | 77.5 ± 239.4 | 55.8 ± 220.7 | 118.2 ± 219.4 | 164.1 ± 328.8 | 39.19 ± 159.1 | −37.83 ± 122.7 | 67.63 ± 380.1 | .151 |
Note: Data is mean ± SD. P value comparing groups is from the permutation test for one‐way analysis of variance.
Abbreviation: COVID‐19, coronavirus disease 2019.
Figure 1.
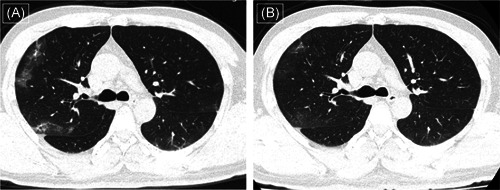
Computed tomography (CT) images (A) of a 40‐year‐old man who presented with fever (37.8°C) and myalgia at admission show multiple patchy ground‐glass opacities distributed in the peripheral part of the lungs. After symptomatic treatment along with darunavir for 5 days, follow‐up CT images show resolution (B)
Figure 2.
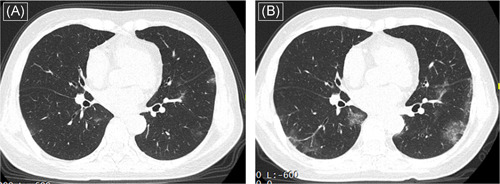
Computed tomography (CT) images (A) of a 64‐year‐old woman who presented with fever (38.0°C) and cough at admission show less patchy ground‐glass opacities distributed in the peripheral part of the lungs. After symptomatic treatment for 5 days, follow‐up CT images show the progression (B)
Table 4.
Proportions of pneumonia resolution after treatment and length of hospital stay of COVID‐19 pneumonia patients
| All patients (n = 184) | Symptomatic treatment (n = 17) | Arbidol (n = 30) | Lopinavir/ritonavir (n = 27) | Arbidol + lopinavir/ritonavir (n = 25) | Interferon (n = 41) | Interferon + lopinavir/ritonavir (n = 21) | Interferon + darunavir (n = 23) | P value | |
|---|---|---|---|---|---|---|---|---|---|
| Pneumonia resolution | 98 (53%) | 7 (41%) | 16 (53%) | 12 (44%) | 9 (36%) | 24 (59%) | 16 (76%) | 14 (61%) | .116 a |
| Length of hospital stay | 17.3 ± 7.0 | 20.0 ± 6.0 | 15.7 ± 6.4 | 18.4 ± 7.2 | 18.5 ± 9.5 | 16.5 ± 5.5 | 16.2 ± 7.1 | 17.4 ± 7.0 | .355 b |
Note: Data are n (%) and mean ± SD.
Abbreviation: COVID‐19, coronavirus disease 2019.
P value comparing groups is from the Fisher's exact test.
P value comparing groups is from the permutation test for one‐way analysis of variance.
After treatment, the highest proportion of pneumonia resolution was in the interferon + lopinavir/ritonavir group (16/21, 76%), followed by the interferon + darunavir (14/23, 61%), interferon (24/41, 59%), arbidol (16/30, 53%), lopinavir/ritonavir (12/27, 44%), symptomatic treatment (7/17, 41%), and arbidol + lopinavir/ritonavir groups (9/25, 36%) (Table 4). Similarly, there was no significant difference in the proportion of pneumonia resolution among the groups after the 5‐day treatment cycle (P = .116).
3.3. Length of hospital stay
The average duration of hospital stay in 184 patients was close to 17.0 days (Table 4). Patients in the symptomatic treatment group showed the longest average length of hospital stay (20.0 ± 6.0), followed by the arbidol + lopinavir/ritonavir (18.5 ± 9.5), lopinavir/ritonavir (18.4 ± 7.2), interferon + darunavir (17.4 ± 7.0), interferon (16.5 ± 5.5), interferon + lopinavir/ritonavir (16.2 ± 7.1), and arbidol (15.7 ± 6.4) groups. No significant difference in the length of hospital stay was shown among the groups (P = .355).
3.4. Clinical symptoms and laboratory tests at discharge
For the 184 patients with COVID‐19 pneumonia in our study, 7 of 184 (4%) had a mild cough at discharge, while their other symptoms had disappeared. Regarding laboratory tests, 35 of 184 (19%) patients had abnormal liver function (ALT or AST above normal range) (Table 5). A small percentage of patients had an increase in leukocyte count (8/184, 4%) or neutrophil count (11/184, 6%). The lymphocyte count was below the normal range in 29 (16%) patients, and the erythrocyte sedimentation rate was elevated in most patients (154/184, 84%).
Table 5.
Laboratory results of COVID‐19 pneumonia patients at discharge
| All patients (n = 184) | Symptomatic treatment (n = 17) | Arbidol (n = 30) | Lopinavir/ritonavir (n = 27) | Arbidol + lopinavir/ritonavir (n = 25) | Interferon (n = 41) | Interferon + lopinavir/ritonavir (n = 21) | Interferon + darunavir (n = 23) | P value | |
|---|---|---|---|---|---|---|---|---|---|
| Alanine aminotransferase (normal range 9.0‐50.0), U/L | 25.0 (17.0‐40.0) | 17.5 (15.0‐31.5) | 22.5 (15.5‐36.3) | 29.0 (21.0‐62.0) | 30.0 (19.5‐49.0) | 23.0 (12.5‐34.5) | 21.0 (15.5‐33.0) | 28.0 (18.0‐40.0) | .028 a |
| Increased | 31 (17%) | 3 (18%) | 3 (10%) | 11 (41%) | 6 (24%) | 5 (12%) | 1 (5%) | 2 (9%) | .019 b |
| Aspartate aminotransferase (normal range 15.0‐40.0), U/L | 21.0 (17.0‐27.5) | 18.0 (15.5‐26.0) | 19.0 (14.8‐28.3) | 22.0 (17.0‐35.0) | 24.0 (19.0‐31.0) | 20.0 (16.5‐24.0) | 20.0 (16.5‐30.5) | 22.0 (17.0‐29.0) | .157 a |
| Increased | 15 (8%) | 1 (6%) | 2 (7%) | 5 (19%) | 3 (12%) | 1 (2%) | 2 (10%) | 1 (4%) | .340 b |
| Leukocytes (normal range 3.5‐9.5), ×109/L | 5.6 (4.6‐6.7) | 4.9 (4.1‐7.2) | 5.5 (4.8‐6.6) | 5.2 (4.4‐7.0) | 5.1 (4.7‐5.8) | 6.6 (5.2‐7.2) | 5.0 (4.5‐5.7) | 6.3 (5.5‐6.7) | .051 a |
| Increased | 8 (4%) | 2 (12%) | 3 (10%) | 0 (0%) | 1 (4%) | 1 (2%) | 0 (0%) | 1 (4%) | .293 b |
| Neutrophils (normal range 1.8‐6.3), ×109/L | 3.2 (2.6‐4.0) | 2.7 (1.9‐4.1) | 3.0 (2.6‐3.9) | 3.0 (2.1‐4.9) | 3.1 (2.6‐3.6) | 3.6 (2.6‐4.4) | 3.0 (2.7‐3.8) | 3.8 (3.5‐4.4) | .082 a |
| Increased | 11 (6%) | 2 (12%) | 4 (13%) | 0 (0%) | 1 (4%) | 2 (4.9%) | 1 (5%) | 1 (4%) | .421 b |
| Lymphocytes (normal range 1.1‐3.2), ×109/L | 1.69 ± 0.58 | 1.9 ± 0.6 | 1.8 ± 0.5 | 1.7 ± 0.6 | 1.4 ± 0.5 | 1.9 ± 0.7 | 1.4 ± 0.4 | 1.6 ± 0.5 | .001 c |
| Decreased | 29 (16%) | 2 (12%) | 2 (7%) | 3 (11%) | 6 (24%) | 5 (12%) | 5 (23%) | 6 (26%) | .315 b |
| Erythrocyte sedimentation rate (normal range 0.0‐15.0), mm/h | 53.3 ± 33.6 | 75.0 (36.5‐98.5) | 38.5 (22.0‐79.8) | 64.0 (31.0‐85.0) | 40.0 (32.0‐79.5) | 35.0 (12.0‐52.0) | 53.0 (42.5‐87.5) | 46.0 (37.0‐87.0) | .005 a |
| Increased | 154 (84%) | 15 (88%) | 25 (83%) | 23 (85%) | 23 (92%) | 27 (66%) | 20 (95%) | 21 (91%) | .052 b |
Note: Data are median (IQR), n (%) and mean ± SD. Increased means exceeding the upper limit of the normal range and decreasing means less than the lower limit of the normal range.
Abbreviations: ANOVA, analysis of variance; COVID‐19, coronavirus disease 2019; IQR, interquartile range.
P value comparing groups is from the Kruskal‐Wallis test.
P value comparing groups is from the Fisher's exact test.
P value comparing groups is from ANOVA.
4. DISCUSSION
We report a cohort of 184 laboratory‐ and chest CT‐confirmed COVID‐19 pneumonia patients receiving different treatment options. Our results revealed the clinical characteristics of patients with COVID‐19 pneumonia in Shanghai, China, and found that antiviral drugs added to a symptomatic treatment were not associated with improvements in pulmonary involvement or length of hospital stay in these patients.
Our study showed that fever (144, 78%) and cough (83, 45%) were the most common clinical manifestations in COVID‐19 pneumonia, which is consistent with previous reports. 19 , 22 , 23 Increased ALT or AST were observed in 36 (20%) patients, indicating that SARS‐CoV‐2 affects liver function. 24 The blood counts obtained on admission showed decreased lymphocytes in 92 (50%) patients and an increased erythrocyte sedimentation rate in 169 (92%) patients, which is evidence that the immune system is affected by viral infection. 25 This is because the systemic inflammatory responses and immune system disturbances caused by viral infections affect multiple systems during disease progression. Angiotensin‐converting enzyme 2 (ACE2) has been identified as a functional receptor for SARS‐CoV‐2 and is highly expressed in the lung. 26 By interacting with the ACE2 receptor and mediated by the viral spike (S) protein, SARS‐CoV‐2 infects human respiratory epithelial cells, causing respiratory symptoms. 26 In addition, single‐cell RNA sequencing data has shown that ACE2 is also expressed in the heart, kidney, liver, and bladder, suggesting a risk of SARS‐CoV‐2 invasion in these areas. 27 , 28
After treatment, a resolution of pneumonia on chest CT was observed in 98 patients (53%). However, the average pneumonia volume at admission was 217.0 cm3 (5.9% of the total lung volume on average) and had increased to 286.5 cm3 (8.1% of the total lung volume on average). This is mainly attributed to the apparent progression of pneumonia in some patients, leading to an increase in the average amount of pneumonia volume. We speculate that these patients were in a progressive or peak stage with regard to the pneumonia observed on chest CT, 20 and continued attention to these patients is needed to evaluate their progression during this period.
The resolution or progression of pneumonia after treatment was applied as one of the measures to evaluate the treatment efficacy. We did not find that, compared with symptomatic treatment alone, the addition of lopinavir/ritonavir significantly increased the proportion of patients showing improvement in pneumonia, whether used alone or in combination with interferon‐α2β or arbidol. A recent report found that the addition of lopinavir/ritonavir did not significantly accelerate clinical improvement or reduce mortality in COVID‐19 patients. 29 Neither the current study nor the previous study found evidence that lopinavir/ritonavir significantly benefited clinical outcomes. In addition, the efficacy of arbidol monotherapy in treating mild/moderate COVID‐19 patients had previously been explored. 30 Consistent with our research, arbidol did not seem to help improve the clinical efficacy of COVID‐19 treatment. At present, no study has evaluated the effect of interferon therapy alone or in combination with darunavir in treating COVID‐19 pneumonia. In our study, however, we found that the addition of interferon‐α2β did not cause pleasant results in the treatment of COVID‐19 pneumonia.
We further evaluated the length of hospital stay among all groups and used it as an indicator of treatment efficiency in our study. For adults with severe COVID‐19, treatment with lopinavir/ritonavir did not shorten the duration of hospital stay. 29 Similarly, for adult patients hospitalized with mild/moderate COVID‐19 in our study, no significant benefit was observed with lopinavir/ritonavir treatment alone or in combination with interferon‐α2β or arbidol beyond that of symptomatic treatment. In addition, compared with symptomatic treatment alone, the combination of antiviral drugs, including arbidol, darunavir or interferon‐α2β, and symptomatic treatment did not significantly decrease the length of hospital stay, indicating that the inclusion of these antiviral drugs may have no additional effect in shorting the length of hospital stay. Taken together, by evaluating the percentage of patients with pneumonia resolution and the length of hospital stay among the groups, the inclusion of antiviral drugs for symptomatic treatment was shown to have no benefit to the clinical improvement of COVID‐19 patients.
With regard to the laboratory tests of the 184 patients performed at discharge, the proportions of patients with abnormalities of liver function and with increased leukocytes, neutrophils or erythrocyte sedimentation rate were close to those at admission; however, the proportion of patients with abnormalities of lymphocyte levels decreased from 50% to 16%. We found that a few patients had a mild cough (<5%), while the other clinical manifestations had disappeared at discharge. For COVID‐19 pneumonia patients, fitness for discharge from the hospital is made on the basis of improved clinical symptoms, evidence of improved lung imaging and viral clearance in respiratory samples. 9 , 18 Thus, the results of chest CT imaging, clinical symptoms, and laboratory examinations at discharge were not completely consistent. In addition, there were significant differences in the levels of ALT and the erythrocyte sedimentation rates between the groups at discharge. We speculate that this is because the tissues assessed to obtain the laboratory results were at different stages of the recovery process.
There are several limitations in our research. First, the treatment period was set as 5 days; thus, the optimal treatment time may not have been reached. Second, we failed to observe the effects of antiviral therapy, as the quantitative detection of the viral load was not accessible. Third, the CT follow‐up findings were not included in the study, which may be useful for the evaluation of treatment efficiency. In addition, a nonsignificant P value does not necessarily exclude differences in treatment effects among groups.
In conclusion, the inclusion of antiviral drugs in therapeutic regimens based on symptomatic treatment has no significant additional impact on the improvement of hospitalized adult patients with COVID‐19 pneumonia. In addition, the results of chest CT imaging, clinical manifestations, and laboratory tests at discharge were not completely consistent.
CONFLICT OF INTERESTS
The authors declare that there are no conflict of interests.
AUTHOR CONTRIBUTIONS
YS, XS, and YL had the idea for and designed the study and drafted the original manuscript. RL and YT contributed to the statistical analysis. NS, GC, and PS took responsibility for the integrity of the data and the accuracy of the data analysis. FS, FS, and YS provided supports for the research and designed the method. XS and YS revised the manuscript. All authors read and approved the final manuscript.
ACKNOWLEDGMENTS
This study was supported by the Shanghai Shenkang Hospital Development Center Funding (SHDC12019128) and the National Natural Science Foundation of China (61671281).
Shi X, Lu Y, Li R, et al. Evaluation of antiviral therapies for coronavirus disease 2019 pneumonia in Shanghai, China. J Med Virol. 2020;92:1922–1931. 10.1002/jmv.25893
Xiudong Shi and Yang Lu contributed equally to this study.
REFERENCES
- 1. Zhou P, Yang X‐L, Wang X‐G, et al. A pneumonia outbreak associated with a new coronavirus of probable bat origin. Nature. 2020.579(7798):270–273. [DOI] [PMC free article] [PubMed] [Google Scholar]
- 2. Wu F, Zhao S, Yu B, et al. A new coronavirus associated with human respiratory disease in China. Nature. 2020;579:1‐5. [DOI] [PMC free article] [PubMed] [Google Scholar]
- 3. Columbus C, Brust KB, Arroliga AC. 2019 novel coronavirus: an emerging global threat. Bayl Univ Med Cent Proc. 2020;33(2):209‐212. [DOI] [PMC free article] [PubMed] [Google Scholar]
- 4. Lai C‐C, Shih T‐P, Ko W‐C, Tang H‐J, Hsueh P‐R. Severe acute respiratory syndrome coronavirus 2 (SARS‐CoV‐2) and corona virus disease‐2019 (COVID‐19): the epidemic and the challenges. Int J Antimicro Agents. 2020;55:105924. [DOI] [PMC free article] [PubMed] [Google Scholar]
- 5. Luo GG, Gao SJ. Global health concerns stirred by emerging viral infections. J Med Virol. 2020;92(4):399‐400. [DOI] [PMC free article] [PubMed] [Google Scholar]
- 6. Kim Y, Liu H, AC, et al. Reversal of the progression of fatal coronavirus infection in cats by a broad‐spectrum coronavirus protease inhibitor. PLoS Pathog. 2016;12(3):e1005531. [DOI] [PMC free article] [PubMed] [Google Scholar]
- 7. Momattin H, Al‐Ali AY, Al‐Tawfiq JA. A systematic review of therapeutic agents for the treatment of the Middle East respiratory syndrome coronavirus (MERS‐CoV). Travel Med Infect Dis. 2019;30:9‐18. [DOI] [PMC free article] [PubMed] [Google Scholar]
- 8. Momattin H, Mohammed K, Zumla A, Memish ZA, Al‐Tawfiq JA. Therapeutic options for Middle East respiratory syndrome coronavirus (MERS‐CoV)—possible lessons from a systematic review of SARS‐CoV therapy. Int J Infect Dis. 2013;17(10):e792‐e798. [DOI] [PMC free article] [PubMed] [Google Scholar]
- 9. Jin Y‐H, Cai L, Cheng Z‐S, et al. A rapid advice guideline for the diagnosis and treatment of 2019 novel coronavirus (2019‐nCoV) infected pneumonia (standard version). Mil Med Res. 2020;7(1):4. [DOI] [PMC free article] [PubMed] [Google Scholar]
- 10. Beck BR, Shin B, Choi Y, Park S, Kang K. Predicting commercially available antiviral drugs that may act on the novel coronavirus (2019‐nCoV), Wuhan, China through a drug‐target interaction deep learning model. bioRxiv. 2020. [DOI] [PMC free article] [PubMed] [Google Scholar]
- 11. Chang Y‐C, Tung Y‐A, Lee K‐H. Potential therapeutic agents for COVID‐19 based on the analysis of protease and RNA polymerase docking. Preprints. 2020. [Google Scholar]
- 12. Wang M, Cao R, Zhang L, et al. Remdesivir and chloroquine effectively inhibit the recently emerged novel coronavirus (2019‐nCoV) in vitro. Cell Res. 2020;30(3):269‐271. [DOI] [PMC free article] [PubMed] [Google Scholar]
- 13. Chu CM. Role of lopinavir/ritonavir in the treatment of SARS: initial virological and clinical findings. Thorax. 2004;59(3):252‐256. [DOI] [PMC free article] [PubMed] [Google Scholar]
- 14. Wang Y, Fan G, Salam A, et al. Comparative effectiveness of combined favipiravir and oseltamivir therapy versus oseltamivir monotherapy in critically ill patients with influenza virus infection. J Infect Dis. 2019. 10.1093/infdis/jiz656 [DOI] [PubMed] [Google Scholar]
- 15. Sheahan TP, Sims AC, Leist SR, et al. Comparative therapeutic efficacy of remdesivir and combination lopinavir, ritonavir, and interferon beta against MERS‐CoV. Nat Commun. 2020;11(1):222. [DOI] [PMC free article] [PubMed] [Google Scholar]
- 16. Lu H. Drug treatment options for the 2019‐new coronavirus (2019‐nCoV). Biosci Trends. 2020;14:69‐71. [DOI] [PubMed] [Google Scholar]
- 17. Zhang N, Wang L, Deng X, et al. Recent advances in the detection of respiratory virus infection in humans. J Med Virol. 2020;92(4):408‐417. [DOI] [PMC free article] [PubMed] [Google Scholar]
- 18. National Health Commission of the People's Republic of China . Diagnosis and treatment protocols of pneumonia caused by a novel coronavirus (trial version 7). 2020. www.nhc.gov.cn/yzygj/s7653p/202003/46c9294a7dfe4cef80dc7f5912eb1989/files/ce3e6945832a438eaae415350a8ce964.pdf
- 19. Song F, Shi N, Shan F, et al. Emerging coronavirus 2019‐nCoV pneumonia. Radiology. 2020;295:210‐217. [DOI] [PMC free article] [PubMed] [Google Scholar]
- 20. Pan F, Ye T, Sun P, et al. Time course of lung changes on chest CT during recovery from 2019 novel coronavirus (COVID‐19) pneumonia. Radiology, 10.1148/radiol.20202003 [DOI] [PMC free article] [PubMed] [Google Scholar]
- 21. Wang Y, Wang Y, Chen Y, Qin Q. Unique epidemiological and clinical features of the emerging 2019 novel coronavirus pneumonia (COVID‐19) implicate special control measures. J Med Virol. 2020. 10.1002/jmv.25748 [DOI] [PMC free article] [PubMed] [Google Scholar]
- 22. Huang C, Wang Y, Li X, et al. Clinical features of patients infected with 2019 novel coronavirus in Wuhan, China. Lancet. 2020;395(10223):497‐506. [DOI] [PMC free article] [PubMed] [Google Scholar]
- 23. Zhu Y, Gao ZH, Liu YL, et al. Clinical and CT imaging features of 2019 novel coronavirus disease (COVID‐19). J Infect. 2020. 10.1016/j.jinf.2020.02.022 [DOI] [PMC free article] [PubMed] [Google Scholar]
- 24. Zhang C, Shi L, Wang F‐S. Liver injury in COVID‐19: management and challenges. Lancet Gastroenterol Hepatol. 2020;5:428‐430. [DOI] [PMC free article] [PubMed] [Google Scholar]
- 25. Chen X, Ling J, Mo P, et al. Restoration of leukomonocyte counts is associated with viral clearance in COVID‐19 hospitalized patients. medRxiv. 2020. [Google Scholar]
- 26. Turner AJ, Hiscox JA, Hooper NM. ACE2: from vasopeptidase to SARS virus receptor. Trends Pharmacol Sci. 2004;25(6):291‐294. [DOI] [PMC free article] [PubMed] [Google Scholar]
- 27. Zou X, Chen K, Zou J, Han P, Hao J, Han Z. Single‐cell RNA‐seq data analysis on the receptor ACE2 expression reveals the potential risk of different human organs vulnerable to 2019‐nCoV infection. Front Med. 2020:1–8. [DOI] [PMC free article] [PubMed] [Google Scholar]
- 28. Chai X, Hu L, Zhang Y, et al. Specific ACE2 expression in cholangiocytes may cause liver damage after 2019‐nCoV infection. bioRxiv. 2020. [Google Scholar]
- 29. Cao B, Wang Y, Wen D, et al. A trial of lopinavir–ritonavir in adults hospitalized with severe Covid‐19. N Engl J Med. 2020. https://www.nejm.org/doi/full/10.1056/NEJMoa2001282 [DOI] [PMC free article] [PubMed] [Google Scholar]
- 30. Li Y, Xie Z, Lin W, et al. Efficacy and safety of lopinavir/ritonavir or arbidol in adult patients with mild/moderate COVID‐19: an exploratory randomized controlled trial. 2020. https://www.cell.com/pb‐assets/products/coronavirus/MEDJ1.pdf [DOI] [PMC free article] [PubMed]