

Abstract
We aimed to systematically review the clinical characteristics of coronavirus disease 2019 (COVID‐19). Seven databases were searched to collect studies about the clinical characteristics of COVID‐19 from January 1, 2020 to February 28, 2020. Then, meta‐analysis was performed by using Stata12.0 software. A total of 38 studies involving 3062 COVID‐19 patients were included. Meta‐analysis showed that a higher proportion of infected patients was male (56.9%). The incidence rate of respiratory failure or acute respiratory distress syndrome was 19.5% and the fatality rate was 5.5%. Fever (80.4%), fatigue (46%), cough (63.1%), and expectoration (41.8%) were the most common clinical manifestations. Other common symptoms included muscle soreness (33%), anorexia (38.8%), chest tightness (35.7%), shortness of breath (35%), dyspnea (33.9%). Minor symptoms included nausea and vomiting (10.2%), diarrhea (12.9%), headache (15.4%), pharyngalgia (13.1%), shivering (10.9%), and abdominal pain (4.4%). The proportion of patients that was asymptomatic was 11.9%. Normal leukocyte counts (69.7%), lymphopenia (56.5%), elevated C‐reactive protein levels (73.6%), elevated ESR (65.6%), and oxygenation index decreased (63.6%) were observed in most patients. About 37.2% of patients were found with elevated D‐dimer, 25.9% of patients with leukopenia, along with abnormal levels of liver function (29%), and renal function (25.5%). Other findings included leukocytosis (12.6%) and elevated procalcitonin (17.5%). Only 25.8% of patients had lesions involving a single lung and 75.7% of patients had lesions involving bilateral lungs. The most commonly experienced symptoms of COVID‐19 patients were fever, fatigue, cough, and expectoration. A relatively small percentage of patients were asymptomatic. Most patients showed normal leucocytes counts, lymphopenia, elevated levels of C‐reactive protein and ESR. Bilateral lung involvement was common.
Keywords: clinical characteristics, coronavirus disease 2019, meta‐analysis, pneumonia, systematical review
Highlights
COVID‐19 is a new respiratory disease which needs quick identification of infected patients.
The most common symptoms of COVID‐19 patients were fever, fatigue, cough, and expectoration.
A relatively small percentage of patients were asymptomatic.
Most patients showed normal leucocytes counts, lymphopenia, elevated levels of C‐reactive protein and ESR.
1. INTRODUCTION
Since December 2019, a number of cases of unexplained pneumonia have been reported in Wuhan, Hubei Province, China. On January 7, 2020, the Chinese Center for Disease Control and Prevention (CCDC) detected a novel coronavirus from a patient's throat swab, 1 which the World Health Organization (WHO) named as 2019‐nCoV on January 12, 2020. 2 Subsequently, novel coronavirus‐infected pneumonia (NCIP) spread to the whole world within a short time, and WHO declared NCIP as a Public Health Emergency of International Concern on January 30, 2020. 3 Then they renamed it coronavirus disease 2019 (COVID‐19) on February 11, 2020. 4 In the past 2 months, the COVID‐19 pandemic had spread to the whole world. As the COVID‐19 pandemic accelerates, Director‐General of WHO said on March 11 that COVID‐19 can be characterized as a pandemic. 5 According to data released by WHO, as of 08:00 on April 7, the COVID‐19 epidemic has affected 211 countries, areas or territories with a total of 1 214 466 confirmed cases and 67 767 deaths worldwide. 6 The confirmed cases in America, Italy, and Spain have surpassed 100 000 and the cases continue to climb rapidly over the whole world. 6
As a new infectious disease, it is particularly important to find out its clinical characteristics, especially in the early stage, which is helping to detect and isolate patients earlier and to minimize its spread. 7 Although many clinical studies of this disease, have been published, most of them were single‐centre, and in the same hospital. Due to the different designs and insufficient sample sizes, the clinical symptoms, the laboratory, and imaging results of the studies were different. In terms of systematic review, a recent meta‐analysis by Sun et al, 8 showed that the incidence of fever was 89.1% while the incidence of cough was 72.2% in COVID‐19 patients. Another study by Li et al, 9 indicated that the main clinical symptoms of COVID‐19 patients were fever (88.5%), cough (68.6%) and myalgia or fatigue (35.8%). However, only 10 studies were included in these studies. Moreover, there have been many large‐scale clinical research studies published, 10 , 11 and the reported results were not all the same. Therefore, we collected the latest studies about the clinical characteristics of COVID‐19 and conducted this up‐dated meta‐analysis to provide references for further clinical practice.
2. MATERIALS AND METHODS
2.1. Search databases and search strategies
PubMed, Foreign Medical Literature Retrieval Service (FMRS), The Cochrane Library, EMBASE, Wanfang, VIP and CNKI database were electronically searched to collect clinical studies on the clinical characteristics of COVID‐19 from January 1, 2020 to February 28, 2020. We also performed a manual search of the reference lists of included studies to avoid omitting any eligible study. When duplicate studies described the same population, the most informative or recent study was included. There was no language restriction placed in the literature search, but only literature published online were included. The following terms were used in search alone or in combination: “Coronavirus” OR “2019‐nCoV” OR “COVID‐19” OR “SARS‐CoV‐2”.
2.2. Inclusion and exclusion criteria
The inclusion criteria were as follows: (1) cohort studies, case‐control studies, and case series studies; (2) the study population included individuals diagnosed with COVID‐19; (3) the primary outcomes were: clinical symptoms, signs, laboratory, and imaging results; the secondary outcomes were the incidence of respiratory failure (RF) or acute respiratory distress syndrome (ARDS), fatality rate, etc.
The exclusion criteria were as follows: (1) overlapping or duplicate studies; (2) Tthe epidemiological analysis with only secondary outcomes such as fatality rate, without the primary outcomes; (3) had no clinical indicators or lacking necessary data; (4) case reports and studies with a sample size less than 10.
2.3. Data extraction and quality assessment
Two reviewers according to the inclusion and exclusion criteria independently selected the literature, and extracted data to an Excel database. And any disagreement was resolved by consensus. Data extraction includes the first author's surname and the date of publication of the article, study region/country, study design, sample size, age, outcome measurement data such as clinical symptoms; relevant elements of bias risk assessment.
The included studies of this meta‐analyses were observational case series studies, so the British National Institute for Clinical Excellence (NICE) 12 was used to evaluate the study quality by two independent reviewers. The evaluation included 8 items and the total score was 8. Studies with a score greater than 4 were seen as high‐quality.
2.4. Statistical analyses
All the meta‐analyses were performed by using STATA 12 (StataCorp, Texas). In this study, incidence rates r of the included studies were first transformed by the double arcsine method to make them conform to normal distribution and then we carried out the single‐arm meta‐analyses with the transformed rate tr. The heterogeneity between studies was analyzed by the chi‐square test with significance set at P < 0.10 and the heterogeneity was quantified using the I 2 statistic. The fixed‐effects model was utilized when there was no statistical heterogeneity between the results of each study; if there was statistical heterogeneity, the subgroup analysis, sensitivity analysis were employed to explore the source of heterogeneity. After eliminating the influence of clinical heterogeneity, the random effect model was used for meta‐analysis. Pooled incidence rates R were back‐calculated from transformed rates tr using the R = [sin(tr/2)]2. Funnel plot together with Egger's regression asymmetry test and Begg's test were used to evaluate publication bias. A two‐tailed P < .05 was considered statistically significant.
3. RESULTS
3.1. Literature retrieval
Altogether, 2387 records were identified during the initial retrieval. After a detailed assessment based on the inclusion criteria, 38 studies 13 , 14 , 15 , 16 , 17 , 18 , 19 , 20 , 21 , 22 , 23 , 24 , 25 , 26 , 27 , 28 , 29 , 30 , 31 , 32 , 33 , 34 , 35 , 36 , 37 , 38 , 39 , 40 , 41 , 42 , 43 , 44 , 45 , 46 , 47 , 48 , 49 , 50 involving 3 062 COVID‐19 patients were included in this meta‐analysis (Figure 1).
Figure 1.
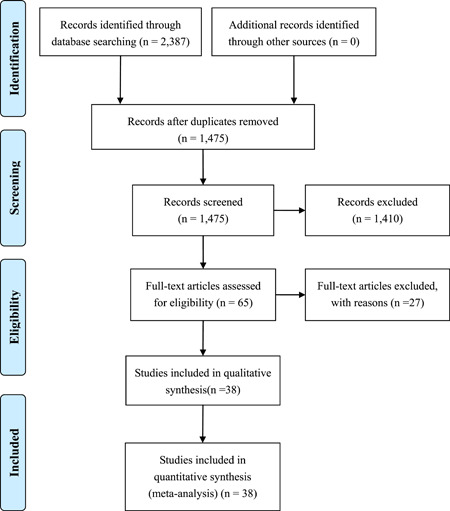
Flow chart of literature screening
3.2. Characteristics of articles
All studies included in the meta‐analysis were conducted in China and the publication time of the included studies was between February 4, 2020 to February 28, 2020. These retrospective studies examined Chinese patients distributed across 31 provinces.
The quality scores of the included studies were 5 to 8, all of them were high‐quality studies (≥ 4 scores). Most of the studies were single‐center and the criteria for inclusion and exclusion were not clearly explained (Table 1).
Table 1.
Basic characteristics of included studies
| Region | No. patients | Study population | Age,a y | Male, % | Outcomes | Quality score | Study | Publication date |
|---|---|---|---|---|---|---|---|---|
| Jilin | 50 | Jan 28 to Feb 21, four hospitals in Jilin Province | 44.52 ± 16.12 | 60 | ① | 8 | Wang et al 49 | Feb 28 |
| Wuhan | 29 | Jan 14 to Jan 29, Tongji Hospital Affiliated to Huazhong University of Science and Technology | 56 (26‐79) | 72.4 | ①②⑤ | 7 | Chen et al 50 | Feb 07 |
| Shenzhen | 12 | Jan 11 to Feb 2, The Third People's Hospital of Shenzhen | 63 (46‐73) | 66.7 | ①②③④ | 6 | Chen et al 13 | Feb 26 |
| Anhui | 79 | Jan 22 to Feb 18, Anhui Provincial Hospital | 45.1 ± 16.6 | 57 | ①②⑤④ | 5 | Fang et al 14 | Feb 25 |
| Beijing | 40 | Jan 21 to Feb, Chinese People's Liberation Army General Hospital | 39.9 ± 18.2 | 65 | ①②③ | 6 | Yu et al 15 | Feb 17 |
| Nanjing | 42 | Jan 19 to Feb, Nanjing Hospital Affiliated to Nanjing University of Traditional Chinese Medicine | 43 ± 16.8 | 55 | ①② | 5 | Zhang et al 16 | Feb 19 |
| Wuhan | 30 | Jan 10 to Jan 31, Jianghan University Affiliated Hospital | 35 ± 8 | 33.3 | ①②③④ | 6 | Liu et al 17 | Feb 17 |
| Wuhan | 54 | Jan to Feb, Wuhan Fourth Hospital | 51.5 | 69 | ①②③ | 7 | Li et al 18 | Feb 23 |
| Chongqing | 143 | Jan 23 to Feb 8, Chongqing Three Gorges Central Hospital | 45.13 ± 1.04 | 51 | ①②⑤ | 6 | Xiao et al 19 | Feb 27 |
| Tianjin | 88 | Jan 21 to Feb 8, Tianjin Haihe Hospital | 48.52 ± 15.67 | 56 | ① | 7 | Sun et al 20 | Feb 24 |
| Hubei | 46 | Jan 22 to Feb 5, HUbei Provincial Hospital of Integrated Chinese and Western Medicine | 54.58 ± 17 | 56 | ① | 7 | Xu B 21 | Feb 25 |
| Beijing | 26 | Jan, Chinese People's Liberation Army General Hospital | 39.77 ± 15.55 | 69 | ① | 6 | Zhuang et al 22 | Feb 19 |
| Shanghai | 50 | NR | 50.4 ± 16.8 | 56 | ①②③ | 6 | Lu et al 23 | Feb 10 |
| Zhejiang | 62 | Jan 10 to Jan 26, Seven hospitals in Zhejiang Province | 41 | 55.4 | ①②③⑤④ | 6 | Xu et al 24 | Feb 19 |
| Wuhan | 140 | Jan 16 to Feb 3, No. 7 hospital of Wuhan | 57.0 | 50.7 | ①②③ | 6 | Zhang et al 25 | Feb 23 |
| Wuhan | 138 | Jan 1 to Jan 28, Zhongnan Hospital of Wuhan University | 56 (42‐68) | 54.3 | ①②③⑤④ | 6 | Wang et al 26 | Feb 08 |
| Hubei | 137 | Dec 30 to Jan 24, nine tertiary hospitals in Hubei Province | 55 ± 16 | 44.5 | ①②⑤④ | 6 | Kui et al 27 | Feb 18 |
| Wuhan | 41 | Before Jan 2, Hospitals in Hubei Province | 49 (41‐58) | 70.5 | ①②③⑤④ | 6 | Huang et al 28 | Feb 15 |
| Wuhan | 99 | Jan 1 to Jan 20, Wuhan Jinyintan Hospital | 55.5 ± 13.1 | 67.7 | ①②③⑤④ | 6 | Chen et al 29 | Feb 15 |
| 31 Provinces | 1099 | 552 hospitals in 31 provinces | 47.0 | 58 | ①②③⑤④ | 8 | Guan et al 30 | Feb 06 |
| Sichuan | 17 | Jan 22 to Feb 10, Dazhou Central Hospital | 45 (22‐65) | 52.9 | ①⑤④ | 6 | Li et al 31 | Feb 11 |
| Beijing | 13 | Jan 1 to Feb 4, three hospitals in Beijing | 34 | 77 | ①⑤④ | 8 | Chang et al 32 | Feb 07 |
| 4 Provinces | 121 | Jan 18 to Feb 2, four hospitals in four Chinese provinces | 45.3 (18‐80) | 50 | ①③ | 8 | Bernheim et al 33 | Feb 20 |
| Zhuhai, Shanghai, Nanchang | 21 | Jan 18 to Jan 27, three hospitals in Nanchang, Shanghai, Zhuhai | 51 ± 14.5 | 62 | ①③ | 6 | Chung et al 34 | Feb 04 |
| Shenzhen | 15 | Jan 16 to Feb 6, Shenzhen Third People's Hospital | 4‐14 | 33.3 | ①③ | 6 | Feng et al 35 | Feb 16 |
| Zhejiang | 52 | Jan 9 to Feb 3, The First Affiliated Hospital of Zhejiang University | 44 ± 14 | 56 | ① | 6 | Wang et al 36 | Feb 25 |
| Chongqing | 80 | Jan to Feb, three hospitals in Chongqing | 44 ± 11 | 80 | ①②③ | 7 | Wu et al 37 | Feb 21 |
| Guangdong | 35 | Dec 23 to Feb 14, Guangdong Second People's Hospital | 44.0 ± 15.2 | 80 | ①②③ | 6 | Huang et al 38 | Feb 28 |
| Wuhan | 36 | Jan to Feb, Zhongnan Hospital of Wuhan University | 72.45 ± 6.82 | 56 | ①②③ | 6 | Cao et al 39 | Feb 28 |
| Wuhan | 42 | Jan 16 to Feb 18, Zhongnan Hospital of Wuhan University | 51.6 | 69 | ②③ | 6 | Liao et al 40 | Feb 26 |
| Zhejiang | 40 | Jan 17 to Jan 28, Wenzhou Sixth People′s Hospital | 45.9 | 55 | ①③ | 6 | Yu et al 41 | Feb 26 |
| Anhui | 12 | Jan 26 to Feb 6, The First Affiliated Hospital of Anhui Medical University | 37 | 57 | ①②③ | 6 | Li et al 42 | Feb 24 |
| Hubei | 41 | Xiaochang First People's Hospital | 48.45 | 78 | ②③ | 6 | Liu et al 43 | Feb 18 |
| Wuhan | 32 | Before Jan 25, Affiliated Xiaogan Hospital of Wuhan University of Science and Technology | NR | 50 | ①②③ | 6 | Wang et al 44 | Feb 19 |
| Wuhan | 54 | Jan 1 to Jan 31, The Affiliated Puren Hospital of Wuhan University of Science and Technology | 60.1 ± 17 | 54 | ①② | 7 | Cheng et al 45 | Feb 19 |
| Shenzhen | 12 | Jan 11 to Jan 20, Shenzhen Third People's Hospital | 10‐72 | 67 | ①② | 5 | Liu et al 46 | Feb 12 |
| Wuhan | 30 | Affiliated Hospital of Wuhan University | 50.17 ± 17.6 | 60 | ①③ | 5 | Zhong et al 47 | Feb 13 |
| Xian | 10 | Jan, The First Affiliated Hospital of Xi'an Jiaotong University | 41.8 ± 13.6 | 60 | ①②③ | 5 | Gao et al 48 | Feb 13 |
Note: ①, symptoms; ②, laboratory findings; ③, imaging; ④, the incidence rate of RF or ARDS; ⑤, fatality rate; NR, not reported.
Reported variously as range or mean ± SD or median, and interquartile range (IQR) values.
3.3. Results of meta‐analysis
3.3.1. Gender distribution
A total of 38 studies 13 , 14 , 15 , 16 , 17 , 18 , 19 , 20 , 21 , 22 , 23 , 24 , 25 , 26 , 27 , 28 , 29 , 30 , 31 , 32 , 33 , 34 , 35 , 36 , 37 , 38 , 39 , 40 , 41 , 42 , 43 , 44 , 45 , 46 , 47 , 48 , 49 , 50 involving 3 062 COVID‐19 patients were included. There was no significant heterogeneity across enrolled studies (I 2 = 39.7%). The fix‐effects model was used in the meta‐analysis, which showed that the proportion of male was 56.9% (95% CI, 54.96%‐58.42%) (Figure 2).
Figure 2.
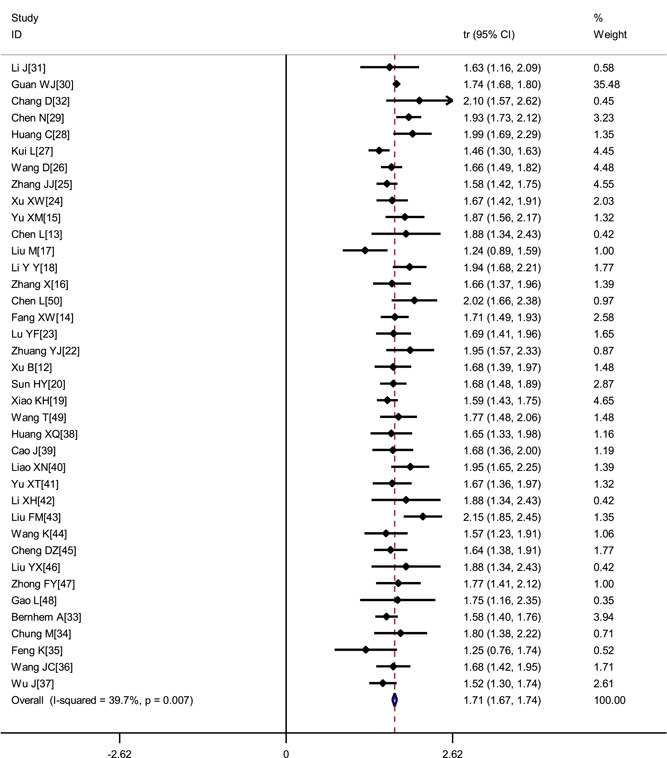
Transformed proportion of males in COVID‐19 patients
3.3.2. Clinical symptoms
The incidence of most commonly experienced symptoms were as follows: Fever (80.4%; 95% CI, 73.0%‐86.9%), fatigue (46%; 95% CI, 38.2%‐54%), cough (63.1%; 95% CI, 57.9%‐68.2%), expectoration (41.8%; 95% CI, 33.9%‐50%). Muscle soreness (33%), anorexia (38.8%), chest tightness (35.7%), shortness of breath (35%), dyspnea (33.9%) also occurred frequently. Less frequent symptoms were nausea and vomiting (10.2%), diarrhea (12.9%), headache (15.4%), pharyngalgia (13.1%), shivering (10.9%), and abdominal pain (4.4%). Patients who were asymptomatic was 11.9% (Table 2, Figures 3 and 4).
Table 2.
Meta‐analysis of different clinical symptoms in COVID‐19 patients
| Symptoms | No. studies | No. patients | Heterogeneity | Model | Meta analysis | ||
|---|---|---|---|---|---|---|---|
| P | I 2 | R (95% CI) | P | ||||
| Fever | 35 | 2966 | <.001 | 95% | Random | 0.804 (0.730, 0.869) | <.001 |
| Cough | 36 | 2979 | <.001 | 85.5% | Random | 0.631 (0.579, 0.682) | <.001 |
| Fatigue | 26 | 2595 | <.001 | 92.6% | Random | 0.460 (0.382, 0.540) | <.001 |
| Muscle soreness | 25 | 2444 | <.001 | 91.3% | Random | 0.330 (0.260,0.405) | <.001 |
| Headache | 24 | 2452 | <.001 | 82.1% | Random | 0.154 (0.116,0.196) | <.001 |
| Diarrhea | 24 | 2378 | <.001 | 85.5% | Random | 0.129 (0.899,0.174) | <.001 |
| Expectoration | 17 | 1908 | <.001 | 88.2% | Random | 0.418 (0.339,0.500) | <.001 |
| Dyspnea | 14 | 955 | <.001 | 90.7% | Random | 0.339 (0.242,0.443) | <.001 |
| Chest tightness | 14 | 660 | <.001 | 92.0% | Random | 0.357 (0.232,0.493) | <.001 |
| Nausea and vomiting | 10 | 1638 | <.001 | 86.5% | Random | 0.102 (0.054,0.163) | <.001 |
| Pharyngalgia | 10 | 751 | <.001 | 85.5% | Random | 0.131 (0.074,0.203) | <.001 |
| Shortness of breath | 8 | 1379 | <.001 | 91.8% | Random | 0.350 (0.217,0.498) | <.001 |
| Anorexia | 6 | 467 | <.001 | 97.3% | Random | 0.388 (0.141,0.671) | <.001 |
| Abdominal pain | 5 | 545 | .161 | 39.1% | Random | 0.044 (0.025,0.069) | <.001 |
| Shivering | 5 | 314 | .057 | 56.4% | Random | 0.110 (0.058,0.174) | <.001 |
| Chest pain | 2 | 87 | <.001 | 94.8% | Random | 0.283 (0.010,0.729) | .017 |
| Asymptomatic | 5 | 158 | <.001 | 80.7% | Random | 0.119 (0.029,0.258) | <.001 |
Figure 3.

Transformed incidence rate of fever in COVID‐19 patients
Figure 4.
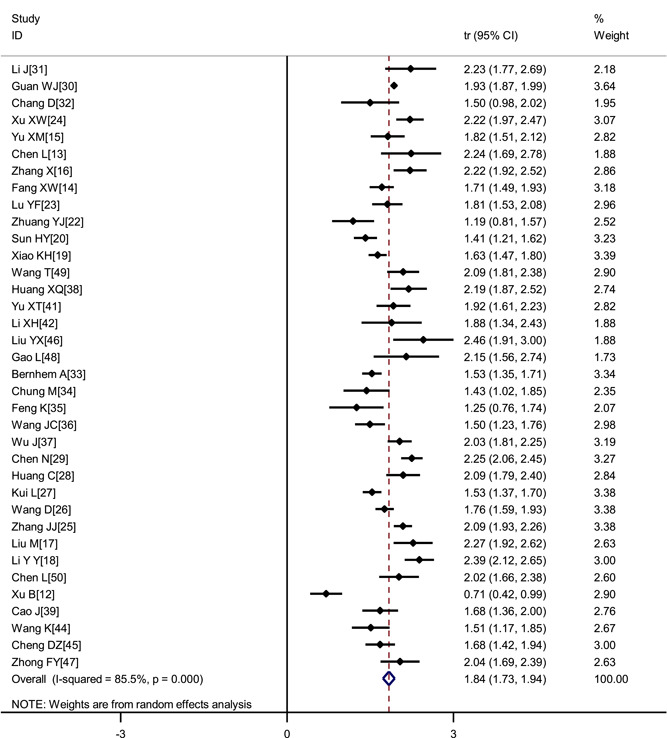
Transformed incidence rate of cough in COVID‐19 patients
3.3.3. Laboratory indicators
Most patients showed normal leucocytes counts (69.7%; 95% CI, 62.8%‐76.2%), lymphopenia (56.5%; 95% CI, 46.5%‐66.4%), elevated C‐reactive protein (73.6%; 95% CI, 66.1%‐80.4%) and Erythrocyte Sedimentation Rate (ESR) (65.6%; 95% CI, 36.8%‐89.3%), and the oxygenation index decreased (63.6%; 95% CI, 32.4%‐89.5%). Also observed were elevated levels of liver function (29%), renal function(25.5%) and D‐dimer (25.9%). Only a few patients had leukocytosis (12.6%) and elevated procalcitonin (17.5%) (Table 3).
Table 3.
Meta‐analysis of different auxiliary examination results in COVID‐19 patients
| Outcomes | No. studies | No. patients | Heterogeneity | Meta analysis | |||
|---|---|---|---|---|---|---|---|
| P | I 2 | Model | R (95% CI) | P | |||
| CT lesions involving single lung | 12 | 600 | <.001 | 89.3% | Random | 0.258 (0.156, 0.374) | <.001 |
| CT lesions involving bilateral lungs | 22 | 2185 | <.001 | 95.1% | Random | 0.757 (0.657, 0.845) | <.001 |
| Leukocytosis | 15 | 1992 | <.001 | 83.3% | Random | 0.126 (0.084, 0.174) | <.001 |
| Normal leukocytes | 10 | 642 | .001 | 68.5% | Random | 0.697 (0.628, 0.762) | <.001 |
| leukopenia | 22 | 2258 | <.001 | 89.3% | Random | 0.259 (0.196, 0.327) | <.001 |
| Lymphopenia | 24 | 2507 | <.001 | 95.3% | Random | 0.565 (0.465, 0.664) | <.001 |
| High C‐reactive protein | 21 | 2238 | <.001 | 90.8% | Random | 0.736 (0.661, 0.804) | <.001 |
| High procalcitonin | 9 | 1701 | <.001 | 95.6% | Random | 0.175 (0.078, 0.299) | <.001 |
| High D‐dimer | 6 | 414 | <.001 | 94.8% | Random | 0.372 (0.177, 0.591) | <.001 |
| Decreased oxygenation index | 4 | 113 | <.001 | 90.5% | Random | 0.636 (0.324, 0.895) | <.001 |
| High ESR | 3 | 195 | <.001 | 93.9% | Random | 0.656 (0.368, 0.893) | <.001 |
| Abnormal liver function | 10 | 549 | <.001 | 86.6% | Random | 0.290 (0.175, 0.421) | <.001 |
| Abnormal renal function | 5 | 231 | <.001 | 94.2% | Random | 0.255 (0.056, 0.535) | <.001 |
| RF or ARDS | 8 | 1499 | <.001 | 97.6% | Random | 0.195 (0.050, 0.403) | <.001 |
| Fatality rate | 8 | 1765 | <.001 | 87.9% | Random | 0.055 (0.023, 0.100) | <.001 |
3.3.4. Imaging
There were 28 studies reported the imaging in COVID‐19 patients. The results of the meta‐analysis showed that 25.8% (95% CI, 15.6%‐37.4%) of patients had lesions involving the single lung and 75.7% (95% CI, 65.7%‐84.5%) involving bilateral lungs (Table 3).
3.3.5. Incidence of RF or ARDS
There were 8 studies reporting the incidence of RF or ARDS in COVID‐19 patients. The random‐effects model was used in the meta‐analysis, which showed that the incidence of RF or ARDS was 19.5% (95% CI, 5%‐40.3%) (Table 3).
3.3.6. Fatality rate
A total of 8 studies including 1 765 patients with COVID‐19 were included. The meta‐analysis result of the random effects model showed that the fatality rate in COVID‐19 was 5.5% (95% CI, 2.3%‐10.0%) (Table 3).
3.3.7. Subgroup analysis
There was significant heterogeneity across enrolled studies. To explore the sources of heterogeneity, we performed a subgroup analysis by sample size (< 50, 50‐100, and ≥100) and study region (Hubei Province and outside Hubei Province). As shown in Table 4, the results of subgroup analysis were consistent with the integrated results. In addition, the subgroup analysis to some extent decreased the heterogeneity between the studies. But when the study population was outside Hubei Province, a drop was observed in the incidence of fever and fatigue.
Table 4.
Subgroup analysis of different clinical symptoms in COVID‐19 patients
| Outcomes | No. studies | No. patients | Heterogeneity | Model | Meta‐analysis | ||
|---|---|---|---|---|---|---|---|
| P | I 2 | R (95% CI) | P | ||||
| Fever | |||||||
| Hubei Province | 13 | 865 | <.001 | 93.4% | Random | 0.87 (0.81, 0.92) | <.001 |
| Outside Hubei Province | 22 | 2101 | <.001 | 83.3% | Random | 0.76 (0.67, 0.84) | <.001 |
| Sample size <50 | 21 | 570 | <.001 | 75.5% | Random | 0.81 (0.74, 0.87) | <.001 |
| Sample size 50‐100 | 9 | 618 | <.001 | 18.4% | Random | 0.82 (0.79, 0.85) | <.001 |
| Sample size ≥100 | 6 | 1778 | <.001 | 98.8% | Random | 0.75 (0.52, 0.93) | <.001 |
| Fatigue | |||||||
| Hubei Province | 10 | 704 | <.001 | 90.9% | Random | 0.62 (0.49, 0.73) | <.001 |
| Outside Hubei Province | 16 | 1891 | <.001 | 85.1% | Random | 0.36 (0.29, 0.43) | <.001 |
| Sample size <50 | 14 | 419 | <.001 | 82.9% | Random | 0.49 (0.37, 0.60) | <.001 |
| Sample size 50‐100 | 8 | 519 | <.001 | 92.3% | Random | 0.42 (0.27, 0.57) | <.001 |
| Sample size ≥100 | 5 | 1657 | <.001 | 97.5% | Random | 0.46 (0.28, 0.65) | <.001 |
| Cough | |||||||
| Hubei Province | 13 | 865 | <.001 | 90.9% | Random | 0.64 (0.53, 0.74) | <.001 |
| Outside Hubei Province | 23 | 2114 | <.001 | 80.0% | Random | 0.63 (0.57, 0.68) | <.001 |
| Sample size <50 | 21 | 583 | <.001 | 83.5% | Random | 0.64 (0.54, 0.73) | <.001 |
| Sample size 50‐100 | 9 | 618 | <.001 | 88.4% | Random | 0.66 (0.54, 0.76) | <.001 |
| Sample size ≥100 | 6 | 1778 | <.001 | 89.9% | Random | 0.59 (0.50, 0.67) | <.001 |
3.3.8. Sensitivity analysis
To determine the sensitivity, we removed each study one by one and the pooled results did not change substantially, indicating the reliability and stability of our meta‐analysis (eg, Figure 5).
Figure 5.

Sensitivity analysis of the proportion of males in COVID‐19 patients
3.4. Publication bias
According to the funnel plot regarding the proportion of men in COVID‐19 patients, together with Egger's regression asymmetry test and Begg's test, this indicated there was no notable evidence of publication bias, the P values were .531 and .269, respectively (Figure 6).
Figure 6.

Evaluation of publication bias using a funnel plot based on the proportion of males
4. DISCUSSION
2019‐nCoV is a type of coronaviruses which belongs to the β‐coronavirus cluster, a positive‐stranded single‐stranded RNA virus. 51 In the past two decades, humans have experienced three fatal coronavirus infections. They are the outbreak of Severe Acute Respiratory Syndrome (SARS) in 2002, Middle East Respiratory Syndrome (MERS) in 2012 and COVID‐19 in 2019. 52 As a newly emerging infectious disease, it is critical to understand and identify the key clinical characteristics of COVID‐19 patients to help in early detection and isolation of infected individuals, as well as minimize the spread of the disease.
In this study, we updated the evidence and conducted this meta‐analysis to systematically review the clinical characteristics of COVID‐19 patients. Our analysis consisted of 3 062 COVID‐19 patients in 31 provincial‐level regions in China. The results showed that the most common symptoms of patients with COVID‐19 were fever (80.4%), cough (63.1%), fatigue (46%), and muscle soreness (33%), which were basically consistent with the findings of Sun et al. 8 Some patients also experienced gastrointestinal symptoms, such as anorexia, nausea, vomiting diarrhea, etc. And some patients were asymptomatic. Therefore, for patients with a history of living in an epidemic area or having had contact with someone with suspected or confirmed COVID‐19 infection in the 14 days before the onset of symptoms, the fever clinic physicians should be alert to identify non‐respiratory symptoms.
On blood biochemical examination, most patients showed normal leucocyte counts and lymphopenia. Only a few patients had leukocytosis and elevated procalcitonin, confirming that this disease is transmitted by a virus. Therefore, the clinician should pay attention to identify the presence of bacterial infection, and routine antibiotics should be avoided. Some patients presented with liver and renal functions abnormalities, which manifested as an increase in alanine aminotransferase (ALT), aspartate aminotransferase (AST) and creatinine. So intense monitoring and evaluation of the function of important organs in COVID‐19 patients should be considered. In our study, the incidence of RF or ARDS in hospitalized patients was 19.5% and the case fatality rate was 5.5%, lower than those of the other two widely contagious coronavirus diseases, SARS (9.6%) 53 and MERS (35%). 54 However, the case fatality rate was higher than that reported by CCDC (2.38%). 55 This may be explained by the fact that the patients included in our study were all hospitalized. In most of them, the condition was serious or critical. For example, Chen et al 13 included 12 critically ill patients.
This study has several strengths, including its large sample size and the high quality of the included studies. We conducted subgroup analysis according to the studies’ region and sample size and conducted a sensitivity analysis by excluding each study one by one. The results did not change significantly, indicating the reliability and stability of our results. However, the results of subgroup analysis also showed that patients outside the Hubei Province had a lower ratio of fever and fatigue than patients in Hubei Province. According to CCDC, the case‐fatality in Hubei Province was also higher than that outside Hubei Province. 55 All the above results indicated that the patients outside the Hubei Province had relatively mild symptoms.
Nevertheless, some limitations should be noted in our meta‐analysis. First, most of our included studies are single‐center, which may have admission bias and selection bias. Second, all of the included studies were retrospective studies, so we cannot rule out the influence of other confounding factors. The sample size in each studies is small, so the test efficiency may be insufficient. Third, most of our included studies did not clarify the inclusion criteria, course of disease, and severity of disease. Finally, this meta‐analysis indicated a significant heterogeneity between the studies. Due to too many outcomes, there was no subgroup analysis and sensitivity analysis for each outcome indicator. So the subgroup analysis fails to eliminate all sources of heterogeneity, which will affect the accuracy of the results of the meta‐analysis.
5. CONCLUSION
In summary, current evidence shows that the most commonly experienced symptoms of COVID‐19 patients were fever, fatigue, cough, and expectoration. A relatively small percentage of patients were asymptomatic. Most patients showed normal leucocytes, lymphopenia, elevated levels of C‐reactive protein and ESR. Bilateral lung involvement was common. Due to the limited quality and quantity of the included studies, more high‐quality prospective studies are required to verify the above conclusions.
CONFLICT OF INTERESTS
The authors declare that there are no conflict of interests.
AUTHOR CONTRIBUTIONS
Data curation: ZZ, PJ, HL, CH. Funding acquisition: JZ. Methodology: JZ, JP, JZ. Software: JP, ZZ, JZ. Supervision: CZ, JZ. Writing—original draft: JZ, PJ. Writing—review and editing: CZ, JZ.
ACKNOWLEDGMENTS
This study was supported by grants from the National Natural Science Foundation of China (81960343); the Emergency Science and Technology Brainstorm Project for the Prevention and Control of COVID‐19, which is part of the Guangxi Key Research and Development Plan (AB20058002); and the High‐level Medical Expert Training Program of Guangxi“139”Plan Funding (G201903027).
Zhu J, Ji P, Pang J, et al. Clinical characteristics of 3062 COVID‐19 patients: A meta‐analysis. J Med Virol. 2020;92:1902–1914. 10.1002/jmv.25884
Jielong Pang and Zhimei Zhong also contributed equally to this study.
Jieyun Zhu and Pan Ji contributed equally to this study.
Contributor Information
Jianfeng Zhang, Email: zhangjianfeng930@163.com.
Chunling Zhao, Email: chunlingzhao2018@163.com.
REFERENCES
- 1. Xu X, Chen P, Wang J, et al. Evolution of the novel coronavirus from the ongoing Wuhan outbreak and modeling of its spike protein for risk of human transmission. Sci China Life Sci. 2020;63(3):457–460. http://nc.yuntsg.com/one1.do. Accessed March 5, 2020. [DOI] [PMC free article] [PubMed] [Google Scholar]
- 2. WHO . Clinical management of severe acute respiratory infection when Novel coronavirus (nCoV) infection is suspected: interim guidance [Internet]. 2020. https://www.who.int/internalpublicationsdetail/clinicalmanagementofsevereacuterespiratoryinfectionwhennovelcoronavirus(ncov)infectionissuspected. Accessed April 7, 2020.
- 3. WHO . Statement on the second meeting of the International Health Regulations; 2005. Emergency Committee regarding the outbreak of novel coronavirus (2019‐nCoV) [Internet]. https://www.who.int/newsroom/detail/30-01-2020-statement-on-thesecond-meeting-of-the-international-healthregulations-(2005)-emergency-committeeregarding-the-outbreak-of-novel-coronavirus-(2019-ncov). Accessed April 7, 2020.
- 4. WHO . WHO Director‐General's remarks at the media briefing on 2019‐nCoV on 11 February 2020. [Internet]. https://www.who.int/dg/speeches/detail/who-director-general-s-remarks-at-the-media-briefing-on-2019-ncov-on-11-february-2020. Accessed April 7, 2020.
- 5. WHO . WHO Director‐General's opening remarks at the media briefing on COVID‐19–11 March 2020. [Internet]. https://www.who.int/dg/speeches/detail/who-director-general-s-opening-remarks-at-the-media-briefing-on-covid-19-11-march-2020. Accessed April 7, 2020.
- 6. WHO . Coronavirus disease 2019 (COVID‐19) outbrake situation [Internet]. https://www.who.int/emergencies/diseases/novel-coronavirus-2019. Accessed April 7, 2020.
- 7. Zhang MQ, Wang XH, An YL, et al. Clinical features of 2019 novel coronavirus pneumonia in the early stage from a fever clinic in Beijing. Chin J Tuberc Respir Dis. 2020(03):215–218. http://rs.yiigle.com/yufabiao/1181338.htm. Accessed April 7, 2020. [DOI] [PubMed] [Google Scholar]
- 8. Sun P, Qie S, Liu Z, et al. Clinical characteristics of 50466 hospitalized patients with 2019‐nCoV infection. J Med Virol. 2020(92):612–917. 10.1002/jmv.25735. http://nc.yuntsg.com/one1.do [DOI] [PMC free article] [PubMed] [Google Scholar]
- 9. Li L, Huang T, Wang Y, et al. 2019 novel coronavirus patients' clinical characteristics, discharge rate and fatality rate of meta‐analysis. J Med Virol. 2020:jmv.25757. 10.1002/jmv.25757 [DOI] [PMC free article] [PubMed] [Google Scholar]
- 10. Cheng KB, Wei M, Shen H, et al. Clinical characteristics of 463 patients with common and severe type coronavirus disease 2019. Shanghai Med J. 2020;1–15. http://kns.cnki.net/kcms/detail/31.1366.r.20200312.1254.004.html. Accessed March 12, 2020. [Google Scholar]
- 11. Sun WW, Ling F, Pan JR, et al. Epidemiological characteristics of 2019 novel coronavirus family clustering in Zhejiang province. Chin J Prev Med. 2020;54:027. 10.3760/cma.j.cn112150-20200227-00199. http://rs.yiigle.com/yufabiao/1184842.htm [DOI] [PubMed] [Google Scholar]
- 12. NICE . Appendix 4 Quality of case series form [Internet]. https://www.nice.org.uk/guidance/cg3/documents/appendix-4-quality-of-case-series-form2. Accessed April 7, 2020.
- 13. Chen L, Feng S, Wang F, et al . Clinical diagnosis and treatment of critical patients with novel coronavirus pneumonia (report of 12 cases). Chin J Clin Med. 2020;27(01):32–35. http://kns.cnki.net/kcms/detail/31.1794.R.20200225.1126.002.html. Accessed March 5, 2020. [Google Scholar]
- 14. Fang XW, Mei Q, Yang TJ, et al. Clinical characteristics and treatment analysis of 79 cases of COVID‐19. Chin Pharmacol Bull. 2020. http://kns.cnki.net/kcms/detail/34.1086.r.20200224.1340.002.html. Accessed March 5, 2020. [Google Scholar]
- 15. Yu SM, Cui YF, Wang ZX, et al. Analysis of the relationship between clinical features and tongue manifestations of 40 cases with novel coronavirus pneumonia. Beijing J Tradit Chin Med. 2020. http://search.chkd.cnki.net/kcms/detail/11.5635.R.20200215.2008.002.html. Accessed March 5, 2020. [Google Scholar]
- 16. Zhang X, Li L, Dai GC, et al. A preliminary study on the clinical characteristics and Chinese medical syndrome of 42 cases of COVID‐19 in Nanjing. J Nanjing Univ Trad Chin Med. 2020. http://kns.cnki.net/kcms/detail/32.1247.r.20200219.0801.002.html. Accessed March 5, 2020. [Google Scholar]
- 17. Liu M, He P, Liu HG, et al. Clinical characteristics of 30 medical workers infected with new coronavirus pneumonia. Chin J Tuberculos Respirat Dis. 2020. http://rs.yiigle.com/yufabiao/1181989.htm. Accessed March 5, 2020. [DOI] [PubMed] [Google Scholar]
- 18. Li YY, Wang WN, Lei Y, et al. Comparison of the clinical characteristics between RNA positive and negative patients clinically diagnosed with 2019 novel coronaviruspneumonia. Chin J Tuberculos Respirat Dis. 2020. http://rs.yiigle.com/yufabiao/1182631.htm. Accessed March 5, 2020. [DOI] [PubMed] [Google Scholar]
- 19. Xiao KF, Shui LL, Pang XH, et al. The clinical features of the 143 patients with COVID‐19 in North‐East of Chongqing. J Third Mil Med Univ. 2020. 10.16016/j.1000-5404.202002097. Accessed March 5, 2020. [DOI] [Google Scholar]
- 20. Sun HY, Bi YF, Zhu ZG, et al. A preliminary study on TCM syndrome characteristics of 88 patients with COVID‐19 in Tianjin. J Tradit Chin Med. 2020. http://kns.cnki.net/kcms/detail/11.2166.R.20200224.0948.004.html. Accessed March 5, 2020. [Google Scholar]
- 21. Xu B, Fan CY, Zou YL, et al. Analysis of traditional Chinese medicine syndromes of 46 cases of COVID‐19. Chin J Exp Tradit Med Formulae. 10.13422/j.cnki.syfjx.20201029. Accessed March 5, 2020. [DOI] [Google Scholar]
- 22. Zhuang YJ, Chen Z, Li J, et al. Clinical and epidemiological characteristics of 26 patients diagnosed with novel coronavirus pneumonia. Chin J Nosocomiol. http://kns.cnki.net/kcms/detail/11.3456.r.20200219.1312.006.html. Accessed March 5, 2020. [Google Scholar]
- 23. Lu Y, Fang Z, Zeng T, et al. Analysis on Chinese medical clinical characteristics of 50 patients with 2019‐nCoV‐infected pneumonia. Acad J Shanghai Univ Tradit Chin Med. 2019;14:52. http://kns.cnki.net/kcms/detail/31.1788.R.20200208.1112.002.html. Accessed March 5, 2020. [Google Scholar]
- 24. Xu XW, Wu XX, Jiang XG, et al. Clinical findings in a group of patients infected with the 2019 novel coronavirus (SARS‐Cov‐2) outside of Wuhan, China: retrospective case series. Br Med J. 2020;368:m606. [DOI] [PMC free article] [PubMed] [Google Scholar]
- 25. Zhang JJ, Dong X, Cao YY, et al. Clinical characteristics of 140 patients infected with SARS‐CoV‐2 in Wuhan, China. Allergy. 10.1111/all.14238 [DOI] [PubMed] [Google Scholar]
- 26. Wang D, Hu B, Hu C, et al. Clinical characteristics of 138 hospitalized patients with 2019 novel coronavirus‐infected pneumonia in Wuhan, China. JAMA. 2020. https://www-ncbi-nlm-nih-gov.library.westernwyoming.edu/pubmed/?term=32031570. Accessed March 5, 2020. [DOI] [PMC free article] [PubMed]
- 27. Kui L, Fang YY, Deng Y, et al. Clinical characteristics of novel coronavirus cases in tertiary hospitals in Hubei province. Chin Med J. 2020;133(9):1061–1069. 10.1001/jama.2020.1585. Accessed March 5, 2020. [DOI] [PMC free article] [PubMed] [Google Scholar]
- 28. Huang C, Wang Y, Li X, et al. Clinical features of patients infected with 2019 novel coronavirus in Wuhan, China. Lancet. 2020;395(10223):497‐506. [DOI] [PMC free article] [PubMed] [Google Scholar]
- 29. Chen N, Zhou M, Dong X, et al. Epidemiological and clinical characteristics of 99 cases of 2019 novel coronavirus pneumonia in Wuhan, China: a descriptive study. Lancet. 2020;395(10223):507‐513. [DOI] [PMC free article] [PubMed] [Google Scholar]
- 30. Guan WJ, Ni ZY, Hu Y, et al. Clinical characteristics of 2019 novel coronavirus infection in China. N Engl J Med. 2020;382(18):1708–1720. https://www.medrxiv.org/content/10.1101/2020.02.06.20020974v1. Accessed March 5, 2020. [DOI] [PMC free article] [PubMed] [Google Scholar]
- 31. Li J, Li SL, Cai YR, et al. Epidemiological and clinical characteristics of 17 hospitalized patients with 2019 novel coronavirus infections outside Wuhan, China. MedRxiv. https://www.medrxiv.org/content/10.1101/2020.02.11.20022053v1. Accessed March 5, 2020. [Google Scholar]
- 32. Chang D, Lin M, Wei L, et al. Epidemiologic and clinical characteristics of novel coronavirus infections involving 13 patients outside Wuhan, China. JAMA. 2020;323:1092. 10.1001/jama.2020.1623. Accessed March 5, 2020. [DOI] [PMC free article] [PubMed] [Google Scholar]
- 33. Bernheim A, Mei X, Huang M, et al. Chest CT findings in coronavirus disease‐19 (COVID‐19): relationship to duration of infection. Radiology. 2020;295(3):200463. https://www-ncbi-nlm-nih-gov.library.westernwyoming.edu/pubmed/?term=32077789. Accessed March 5, 2020. [DOI] [PMC free article] [PubMed] [Google Scholar]
- 34. Chung M, Bernheim A, Mei X, et al. CT imaging features of 2019 novel coronavirus (2019‐nCoV). Radiology. 2020;295(1):202–207. https://www-ncbi-nlm-nih-gov.library.westernwyoming.edu/pubmed/?term=32017661. Accessed March 5, 2020. [DOI] [PMC free article] [PubMed] [Google Scholar]
- 35. Feng K, Yun YX, Wang XF, et al. Analysis of CT features of 15 children with 2019 novel coronavirus infection. Chin J Pediatr. 2020. http://rs.yiigle.com/yufabiao/1181979.htm. Accessed March 5, 2020. [DOI] [PubMed] [Google Scholar]
- 36. Wang JC, Liu JP, Wang YY, et al. Dynamic changes of chest CT imaging in patients with corona virus disease‐19 (COVID‐19). J Zhejiang Univ Med Sci. 2020. http://kns.cnki.net/kcms/detail/33.1248.R.20200225.1528.004.html. Accessed March 5, 2020. [Google Scholar]
- 37. Wu J, Wu X, Zeng W, et al. Chest CT findings in patients with corona virus disease 2019 and its relationship with clinical features. Invest Radiol. 10.1097/RLI.0000000000000670. Accessed March 5, 2020. [DOI] [PMC free article] [PubMed] [Google Scholar]
- 38. Huang XQ, Nie LH, Li FM, et al. Analysis of Chinese medical characteristics of 35 patients with novel coronavirus pneumonia. J Emerg Tradit Chin Med. 2020. http://kns.cnki.net/kcms/detail/50.1102.R.20200227.1457.003.html. Accessed March 5, 2020. [Google Scholar]
- 39. Cao J, Zhou J, Liao XN, et al. Clinical characteristics and CT signs of corona virus disease 2019 (COVID‐19) in the elderly. Med J Wuhan Univ. http://kns.cnki.net/kcms/detail/42.1677.R.20200227.1000.002.html. Accessed March 5, 2020. [Google Scholar]
- 40. Liao XN, Zhou J, Cao J, et al. Chest CT features comparison between COVID⁃19 and bacterial pneumonia. Med J Wuhan Univ. 2020. http://kns.cnki.net/kcms/detail/42.1677.r.20200225.0852.002.html. Accessed March 5, 2020. [Google Scholar]
- 41. Yu XT, Ye H, Yang SF, et al. Chest CT features of COVID‐19. J Pract Med. 2020. http://kns.cnki.net/kcms/detail/44.1193.R.20200225.1621.002.html. Accessed March 5, 2020. [Google Scholar]
- 42. Li XH, Pan HL, Shu JW, et al. Clinical presentations and CT features of imported corona virus disease 2019. Chin J Med Imaging Technol. 2020. http://kns.cnki.net/kcms/detail/11.1881.R.20200223.1824.001.html. Accessed March 5, 2020. [Google Scholar]
- 43. Liu FM, Ding HL, Gong XM, et al. Chest CT performance and clinical characteristics of coronavirus disease 2019 (COVID‐19). Radiologic Practice. 10.13609/j.cnki.1000-0313.2020.03.001. Accessed March 5, 2020. [DOI]
- 44. Wang K, Kang SR, Tian RH, et al. CT characteristic appearances of patients with novel coronavirus pneumonia. Chin J Clin Med. http://kns.cnki.net/kcms/detail/31.1794.R.20200217.1344.004.html [Google Scholar]
- 45. Cheng DZ, Li Y. Clinical effectiveness and case analysis in 54 NCP patients treated with lanhua qingwen granules. World Chin Med. 2020. http://kns.cnki.net/kcms/detail/11.5529.R.20200218.1552.002.html. Accessed March 5, 2020. [Google Scholar]
- 46. Liu YX, Yang Y, Zhang C, et al. Clinical and biochemical indicators related to lung injury in patients with 2019‐nCoV infection. Scientia Sinica. 2020. http://kns.cnki.net/kcms/detail/11.5840.Q.20200212.0801.006.html. Accessed March 5, 2020. [Google Scholar]
- 47. Zhong FY, Zhang HF, Wang BC, et al. CT findings in 2019 novel coronavirus disease (COVID‐19) patients. Med J Wuhan Univ. 2020. http://kns.cnki.net/kcms/detail/42.1677.R.20200213.1408.001.html. Accessed March 5, 2020. [Google Scholar]
- 48. Gao L, Zhang JP, Lu YH, et al. CT features of patients with imported 2019‐nCov‐pneumonia. J Xi'an Jiaotong Univ Med Sci. 2020. http://kns.cnki.net/kcms/detail/61.1399.r.20200213.1259.009.html. Accessed March 5, 2020. [Google Scholar]
- 49. Wang T, Shi L, Chen YY, et al. Clinical efficacy analysis of 50 cases of corona virus disease 2019 in traditional Chinese medicine. Jilin J Chin Med. 2020. 10.13463/j.cnki.jlzyy.2020.03.001. Accessed March 5, 2020. [DOI] [Google Scholar]
- 50. Chem L, Liu HG, Liu W, et al. Analysis of clinical features of 29 patients with 2019 novel coronavirus pneumonia. Chin J Tuberc Respir Dis. http://rs.yiigle.com/yufabiao/1180104.htm. Accessed March 5, 2020. [DOI] [PubMed] [Google Scholar]
- 51. Su S, Li XC, Hao H, et al. Advances in research on SARS‐CoV‐2. J Xi'an Jiaotong Univ Med Sci. 2020. http://kns.cnki.net/kcms/detail/61.1399.R.20200224.0944.010.html. Accessed March 5, 2020. [Google Scholar]
- 52. Munster VJ, Koopmans M, van Doremalen N, van Riel D, de Wit E. A novel coronavirus emerging in China‐key questions for impact assessment. N Engl J Med. 2020;382(8):692‐694. [DOI] [PubMed] [Google Scholar]
- 53. Hui DSC, Zumla A. Severe acute respiratory syndrome: historical, epidemiologic, and clinical features. Infect Dis Clin North Am. 2019;33(4):869‐889. [DOI] [PMC free article] [PubMed] [Google Scholar]
- 54. Azhar EI, Hui DSC, Memish ZA, Drosten C, Zumla A. The Middle East respiratory syndrome (MERS). Infect Dis Clin North Am. 2019;33(4):891‐905. [DOI] [PMC free article] [PubMed] [Google Scholar]
- 55. Special expert group for control of the epidemic of novel coronavirus pneumonia of the Chinese Preventive Medicine Association . An update on the epidemiological charac teristics of novel coronavirus pneumonia COVID‐19. Zhonghua liu xing bingxue za zhi. 2020;41(2):139‐144. [DOI] [PubMed] [Google Scholar]