

Summary
The global COVID‐19 pandemic has led to a worldwide shortage of ventilators. This shortage has initiated discussions on how to support multiple patients with a single ventilator (ventilator splitting). Ventilator splitting is incompletely tested, experimental and the effects have not been fully characterised. This study investigated the effect of ventilator splitting on system variables (inspiratory pressure, flow and volume) and the possibility of different ventilation targets for each limb using only standard hospital equipment. Experiments were conducted on two test lungs with different compliances (0.02 l.cmH2O−1 and 0.04 l.cmH2O−1). The ventilator was used in both pressure and volume control modes and was set to ventilate the low compliance lungs at end‐tidal volumes of 500 ± 20 ml. A flow restrictor apparatus consisting of a Hoffman clamp and tracheal tube was connected in series to the inspiratory limb of the high compliance test lungs and the resistance modified to achieve end‐tidal volumes of 500 ± 20 ml. The restriction apparatus successfully modified the inspiratory pressure, minute ventilation and volume delivered to the high compliance test lungs in both pressure control (27.3–17.8 cmH2O, 15.2–8.0 l.min−1 and 980–499 ml, respectively) and volume control (21.0–16.7 cmH2O, 10.7–7.9 l.min−1 and 659–498 ml, respectively) ventilation modes. Ventilator splitting is not condoned by the authors. However, these experiments demonstrate the capacity to simultaneously ventilate two test lungs of different compliances, and using only standard hospital equipment, modify the delivered pressure, flow and volume in each test lung.
Keywords: COVID‐19, lung protective ventilation, pandemic, splitting, ventilation
Introduction
The severe acute respiratory syndrome coronavirus 2 (SARS‐CoV‐2) virus and its associated disease, coronavirus disease (COVID‐19), have caused a global pandemic. Patients with COVID‐19 may develop progressive viral pneumonitis leading to severe respiratory failure, requiring mechanical ventilation in up to 17% of cases 1. The combination of unprecedented disease burden and global supply chain disruption has resulted in worldwide shortages of medical equipment.
Ventilators are technically complex, expensive devices and rapidly increasing their production has proven to be difficult. To address the need to immediately increase the number of available ventilators, the concept of ventilating multiple similar patients’ lungs with one ventilator (ventilator splitting) has been previously described 2 and subsequently tested in adult human‐sized sheep 3. The basic principle of ventilator splitting is simple; two or more patients are connected to one ventilator and both are exposed to the same circuit dynamics. However, this presents many challenges, including: ventilator‐patient dyssynchrony; cross‐infection from inter‐patient gas exchange; inability to set individual patient tidal volume, oxygen concentration, positive end‐expiratory pressure; and lack of monitoring of individual tidal volume, flow and pressure 4, 5.
The ventilator splitting system proposed by Neyman and Irvin 2 exposes both patients to the same ventilation dynamics throughout the respiratory cycle. This limits the utility of the design when ventilating two patients with dissimilar lungs 6, due to either pathology, such as acute respiratory distress syndrome or differing patient lung variables.
This paper outlines the use of an inspiratory flow restrictor with ventilator splitting, a novel approach to applying differing driving pressures to two patients connected to the same ventilator 7, thus compensating for differing target tidal volumes and differing lung compliance.
Several design concepts have been proposed that use parts repurposed from fluid or gas plumbing 8 or 3D‐ printed fixed‐flow restrictors 7. This study aims to investigate ventilator splitting with flow restriction using only commonly available medical components.
Methods
The experimental setup is shown in Figs. 1, 2, 3, 4. Standard 22‐mm connection breathing circuits were used except where otherwise stated. In‐line heat and moisture exchangers (HME) were used in place of viral filters to allow pressure monitoring lines to be connected at key points (Fig. 1). The pressure drop across the HME was found to be within 1.36 cmH2O of viral filters, meaning the induced circuit resistances are comparable.
Figure 1.

Experimental setup for characterising ventilator splitting. The flow meter was swapped between limbs for each experiment to measure lung flow and volume. R, resistance element; P, pressure sensor. Lengths (in cm) of 22‐mm tubing used in ventilator splitting experiments are in italics. Lengths denoted with * are internal diameter 9‐mm tracheal tubing with a Hoffman clamp for resistance variation.
Figure 2.
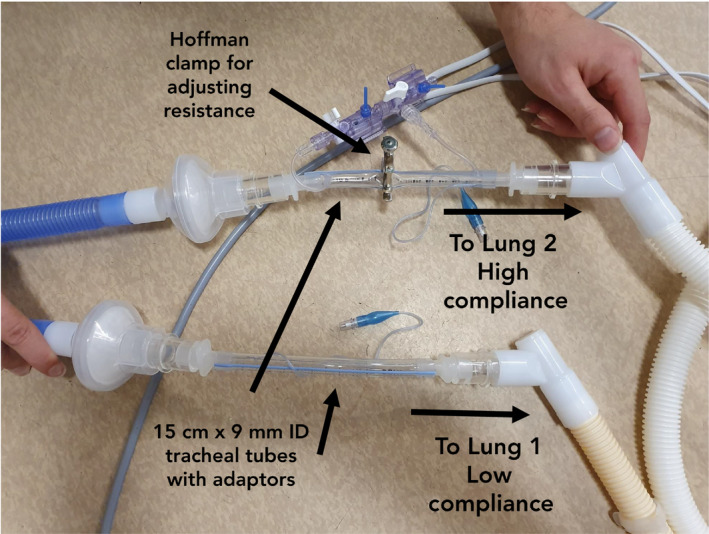
Tracheal tubes can be modified with a Hoffman clamp to create a variable flow restrictor on either patient's inspiratory limb.
Figure 3.

Hamilton flow meter in blue connected to a pair of test lungs.
Figure 4.

Expiratory limb leading back into the ventilator. The one‐way valves are necessary to ensure no backflow occurs due to compliance mismatch. The 3D printed component can be replaced by a commodity Y‐ or T‐splitter and the filters can be repositioned.
The inspiratory limb of the ventilator (Hamilton C6S, Hamilton Medical, Bonaduz, Switzerland) was connected by 50 cm of breathing circuit to a humidifier (FP950, Fisher and Paykel Healthcare, Auckland, New Zealand), with an inline HME. The in‐circuit humidifier was not turned on or filled with water for these experiments. A length of breathing circuit (120 cm) was run from the humidifier to a standard Y‐connector splitting into two inspiratory limbs. From the splitter, two identical limbs were created, simulating the ventilation of two pairs of patient lungs. Each inspiratory limb consisted of a 50 cm length of breathing circuit connected to a 15 cm length of trimmed, 9 mm inner diameter tracheal tube with a commercial tracheal tube to a 15 mm circuit connector on each end. This arrangement was achieved by modifying four tracheal tubes (Fig. 2). A Hoffman clamp (R1, R2, Fig. 1) was placed on the outside of the tracheal tube and adjusted to control flow resistance. The combination of the Hoffman clamp and tracheal tube formed the flow restrictor apparatus.
The flow restrictor apparatus was connected to 140 cm of breathing circuit and was used to connect the built‐in Hamilton flow meter to another HME before connecting to the simulation lungs (Model C500i, Michigan Instruments, Kentwood, MI, USA, Fig. 3). As the ventilator was capable of reading only one flow rate, the flow meter was switched between inspiratory limbs as necessary. Pressure sensors (TruWave, Edwards Lifesciences, Irvine, CA, USA, P1‐P7, Fig. 1) were used to measure pressures in key areas of the circuit. Pressure sensors were placed on either side of the Hoffman clamp to measure the pressure drop across the resistors (P4, P5, Fig. 1). Pressure sensors were also placed near the simulated lungs on the HME to record inspiratory pressures (P2, P6, Fig. 1). Each expiratory limb consisted of 140 cm of tubing, a HME and a one‐way valve (Intersurgical part 1921000, Intersurgical, East Syracuse, NY, USA) which was then connected to a 3D printed Y‐connector (design previously described 7) before re‐entering the ventilator expiratory limb (Fig. 4). The 3D printed connector allowed the side‐by‐side placement of HMEs, which facilitated sidestream pressure sensors (P3, P7, Fig. 1) to measure expiratory pressures. These pressure sensors would not be required in clinical use. Finally, a sidestream pressure sensor was placed on the HME at the origin of the inspiratory circuit limb, connected directly to the ventilator (P1).
The baseline circuit characteristics in pressure control ventilation were determined by connecting a low compliance (0.02 l.cmH2O−1) test lung to the ventilator. The restrictor was excluded from the circuit and the ventilator configured as per Table 1. Following the baseline measurement, the flow restrictor was introduced with no Hoffman clamp resistance and the changes in key parameters recorded to measure the effect of the presence of an open flow restrictor.
Table 1.
Ventilator settings for a single non‐compliant lung for pressure and volume control ventilation
| Variable | Pressure control setting | Volume control setting |
|---|---|---|
| Peak pressure; cmH2O | 30 | 29 |
| Exhaled minimum volume; l.min−1 | 7.9 | 7.9 |
| Tidal volume; ml | 492 | 498 |
| I:E ratio | 1:2.0 | 1:2.2 |
| Rate; breaths.min−1 | 16 | 16 |
| Pressure control; cmH2O | 24 | – |
| Positive end expiratory pressure; cmH2O | 5 | 5 |
| Pressure max time; s | 1.25 | |
| Peak flow rate; l.min−1 | – | 100 |
| Volume target; ml | – | 480/960 |
With the flow restrictor in place, the ventilator was split (as described above) to support both the low compliance test lung and an additional high compliance test lung (0.04 l.cmH2O−1). The baseline circuit state was measured with no flow restriction applied. Subsequently, the resistance on the inspiratory circuit of the high compliance lung was adjusted using the Hoffman clamp (Fig. 2) to increase flow resistance until the end‐tidal volume of the high compliance lung (as read on the ventilator) was within the desired range (500 ± 20 ml). Finally, the ventilator flow sensor was returned to the low compliance lung to ensure the pressures and volumes remained adequate for the original test lung.
Volume control ventilation was tested in a similar fashion. Baseline circuit characteristics were measured by connecting the single low compliance lung to the ventilator with the flow restrictor excluded. The settings and measured data are presented in Table 1. Subsequently, the flow restrictor (with no clamp applied) was included to determine the effect on measured variables. In order to test the effect of the flow restrictor, the high compliance lung was connected via the splitter assembly. Due to the different targets in volume control ventilation, the target volume on the ventilator was doubled (from 480 to 960 ml) and the peak flow rate adjusted to maintain the inspiratory/expiratory ratio. Initial baseline data were recorded for both test lungs without the Hoffman clamp. The flow resistance to the high compliance lung was then adjusted via the Hoffman clamp until the end‐tidal volume was within the desired ranges of 500 ± 20 ml. Finally, the ventilator flow meter was returned to the inspiratory limb of the low compliance lung to ensure that parameters remained within the target ranges.
All pressures were recorded via a LabJack U6 Pro (LabJack, Lakewood, CO, USA) at a sampling rate of 10 Hz. All flows were collected by the built‐in Hamilton flow meter and recorded manually. Hoffman clamp resistance was calculated by dividing the mean pressure differential across the clamp by the flow ([P4‐P5]/Q), where Q is the expiratory minute volume reported by the Hamilton flow sensor. Pressure data were averaged over three breaths, whereas flow and volume data were averaged using the built‐in filters within the ventilator.
Results
In pressure control ventilation mode, minimal differences in measured ventilator pressure, volume and flow were recorded after adding the unclamped flow restrictor section (Table 2). Measured peak ventilator pressure reduced from 34.8 to 33.5 cmH2O and plateau pressure increased from 29.4 to 29.7 cmH2O, well within the accuracy of the pressure sensors used (± 1.36 cmH2O). A 1 ml increase in end‐tidal volume was caused by adding the flow restrictor.
Table 2.
Quantifying the effect of adding the tracheal tube to measured ventilator variables under pressure control
| Measured variable | No flow restrictor | Flow restrictor present |
|---|---|---|
| Peak ventilator pressure; cmH2O | 34.8 | 33.5 |
| Plateau ventilator pressure; cmH2O | 29.4 | 29.7 |
| Plateau patient inspiratory pressure; cmH2O | 28.4 | 27.8 |
| Positive end expiratory pressure; cmH2O | 4.9 | 5.0 |
| Tidal volume; ml | 498 | 499 |
| Exhaled minute volume; l.min−1 | 7.9 | 8.0 |
| Tracheal tube resistance; cmH2O.l−1.min−1 | – | 0 |
After adding the second limb and test lung to the ventilator, the measured variables were highly mismatched between both test lungs before the institution of the flow restrictor. The most affected variables were volume (510 ml and 980 ml for the low and high compliance lungs, respectively), expired minute volume (8.3 l and 15.2 l, respectively) and peak inspiratory pressure at the patient (29.3 and 27.3 cmH2O, respectively, Fig. 5, Table 3). Positive end‐expiratory pressure was unaffected by the splitting configuration. Flow and volume were measured on the high compliance lungs, and the Hoffman clamp resistance was increased until the measured volume was within the desired range of 500 ± 20 ml. At this point, peak inspiratory pressure, volume and flow were tested again on the low compliance lung, and a match between the pairs of test lungs was demonstrated (Table 3).
Figure 5.

Pressure traces for pressure control ventilation with both low and high compliance lungs with the flow restrictor clamped and unclamped. Top panel, no clamp applied; bottom panel, Hoffman clamp applied. Green Line, P1 ventilator pressure; blue Line, P2 inspiratory pressure for low compliance lung; red line, P6 inspiratory pressure for high compliance lung; black line, P2 inspiratory pressure for single lung.
Table 3.
Comparison of measured variables before and after adjusting the flow restrictor during pressure control ventilation
| Measured variable | No restrictor | With restrictor | ||
|---|---|---|---|---|
| Low compliance lung | High compliance lung | Low compliance lung | High compliance lung | |
| Peak patient inspiratory pressure; cmH2O | 29.3 | 27.3 | 33.2 | 17.8 |
| Positive end expiratory pressure; cmH2O | 4.7 | 4.7 | 4.7 | 4.7 |
| Tidal volume; ml | 510 | 980 | 495 | 499 |
| Exhaled minute volume; l.min−1 | 8.3 | 15.2 | 7.9 | 8.0 |
| Tracheal tube resistance; cmH2O.l−1.min−1 | 0 | 0 | 0 | 0.6 |
As seen with pressure control ventilation, the addition of the unclamped flow restrictor had minimal effect on the measured variables in volume control ventilation (Table 4). Most notably, there was a measured phase shift in the signals of around half a second, potentially due to the longer flow travel time added by the length of tracheal tube.
Table 4.
Quantifying the effect of adding the flow restrictor to measured ventilator variables under volume control ventilation
| Measured variable | No flow restrictor | Open flow restrictor included |
|---|---|---|
| Peak ventilator pressure; cmH2O | 28.6 | 28.5 |
| Peak patient inspiratory pressure; cmH2O | 29.3 | 29.0 |
| Positive end expiratory pressure; cmH2O | 4.8 | 4.8 |
| Tidal volume; ml | 495 | 497 |
| Exhaled minute volume; l.min−1 | 8.0 | 7.9 |
| Tracheal tube resistance; cmH2O.l−1 min−1 | – | 0 |
With volume control ventilation, the addition of the second circuit with different compliance lungs had a large impact on the end‐tidal volume (340–659 ml for the low and high compliance lungs, respectively) and expired minute ventilation (5.4–10.7 l, respectively). Peak patient pressure decreased from 21.8 to 21.0 cmH20 (low to high compliance lung, respectively, Fig. 6). Again, PEEP was unaffected by the splitting. These results mirror those found in pressure control ventilation, although to slightly different degrees (the difference in volume was much higher in pressure control ventilation than in volume control ventilation; 470 ml vs. 319 ml, respectively). As with pressure control ventilation, the Hoffman clamp was used to increase resistance on the inspiratory limb of the high compliance lungs until the target range of 500 ± 20 ml was reached. After setting the restrictor, the flow sensor was moved back to the low compliance lungs, ensuring that the inspiratory pressure, flow and volumes were closely matched for both test lungs (Table 5).
Figure 6.
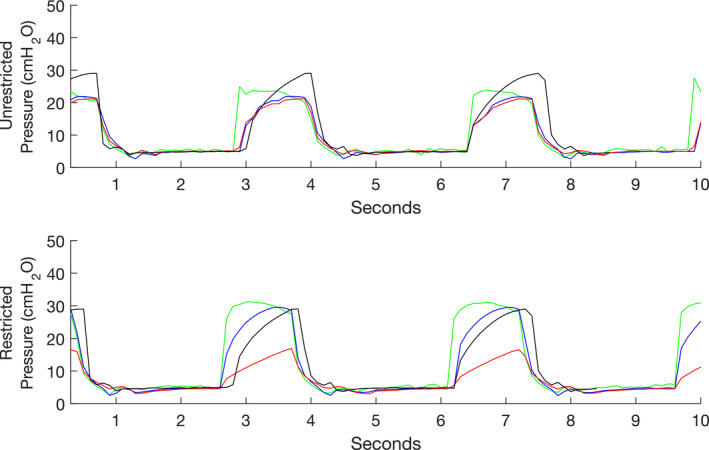
Pressure traces for volume control ventilation with both low and high compliance lungs with the flow restrictor clamped and unclamped. Top panel, no clamp applied; bottom panel, Hoffman clamp applied. Green Line, P1 ventilator pressure; blue line, P2 inspiratory pressure for low compliance lung; red line, P6 inspiratory pressure for high compliance lung; black line, P2 inspiratory pressure for single lung.
Table 5.
Comparison of measured variables before and after using the flow restrictor during volume control ventilation
| Measured variable | No restriction | With restriction | ||
|---|---|---|---|---|
| Low compliance lung | High compliance lung | Low compliance lung | High compliance lung | |
| Peak patient inspiratory pressure; cmH20 | 21.8 | 21.0 | 29.4 | 16.7 |
| Positive end expiratory pressure; cmH20 | 4.8 | 4.8 | 4.8 | 4.8 |
| Tidal volume; ml | 340 | 659 | 491 | 498 |
| Exhaled minute volume; l.min−1 | 5.4 | 10.7 | 7.9 | 7.9 |
| Tracheal tube resistance; cmH2O.l−1.min−1 | 0 | 0 | 0 | 0.5 |
Discussion
This is the first paper to describe a method of ventilation splitting that allows real‐time adjustment of driving pressure and continuous monitoring of airway pressure, flow and tidal volume using only standard medical equipment.
The publication of this study is intended to prompt discussion and debate. Our methods are not intended for clinical use, except in a dire emergency. The safety problems associated with ventilator splitting have been well described in the recent Anaesthesia Patient Safety Foundation Joint Statement 9.
Ventilation splitting is an unregulated and under‐tested therapy. As the COVID‐19 pandemic progresses, some centres may consider ventilator splitting on compassionate grounds as a means of meeting time‐critical demand for ventilators. In the USA, the Food and Drug Administration has passed emergency use authorisation for splitting ventilation between patients 10.
While ventilator splitting has, at face value, validity in addressing ventilator shortages, we agree that, on sober reflection, it is a solution that needs to be considered very carefully as it may cause more harm than good. Many of the challenges intrinsic to this technique have relatively straightforward engineering solutions, but when applied to the complex environment of clinical care there are far more challenges that also need to be considered. For instance, in this study, we have not addressed the issues of infection control. Decontamination and breathing circuit filtration has been addressed in the recent guidance from the Anesthesia Patient Safety Foundation 11.
This experiment demonstrates that, in order to deliver a safe tidal volume and airway pressure, a resistance mechanism is required on one inspiratory limb of the circuit. One way of achieving this is through use of a tracheal tube and Hoffman clamp. In this bench study, it was only necessary to adjust the inspiratory circuit resistance for the more compliant pair of lungs. In the postulated clinical implementation, it would be prudent to place flow restrictors on both inspiratory limbs simultaneously in case the relative driving pressure requirements of each patient's lungs were to change. This would reduce the need for aerosol‐generating circuit disconnections. We propose the use of flow restrictors in all instances of ventilator splitting, irrespective of the baseline driving pressure requirements.
As pressure drop across a constriction is flow‐dependent, flow restrictors change the dynamic component of the total circuit/patient compliance. Accordingly, the effect of a flow restrictor on tidal volume is dependent on the simulated lung not reaching an inspiratory pause. This may limit the maximum inspiratory time or pressure delivered to a patient via a flow restrictor.
In these experiments, pressure control ventilation did not require the adjustment of ventilator settings after initial configuration for the non‐compliant lung. As anticipated, volume control ventilation required increasing the target volume to the sum of the target tidal volumes. Consistent with the characteristic fixed‐flow waveform of volume control ventilation, the pressure drop across the flow resistor was more sensitive to adjustment in volume control ventilation than when using the ramped flow waveform of pressure control ventilation. Further research on static inline flow restrictors may take advantage of this property.
The addition of one‐way valves on the expiratory limbs of the circuit was found to be crucial to avoid inspiratory backflow in the presence of an inspiratory flow restrictor. The need for these valves may be a function of this particular ventilator's design. In these experiments, a custom 3D‐printed Y‐splitter was used at the end of the expiratory limb. In clinical practice, this could be replaced by standard Y or T breathing circuit connectors.
In this study, a single disposable flow sensor was available. We suggest the use of two disposable flow sensors to enable intermittent measurement of flow, airway pressure (post‐restrictor) and tidal volume. Flow sensors could be connected to both patients simultaneously, and three‐way taps with Luer connectors could be used to switch between each flow sensor when patient monitoring is required, although this proposed solution requires testing to confirm that it provides accurate data. Many ventilators will not have the same kind of in‐circuit flow sensors (some are built‐in), so this may not be possible in all scenarios. An alternative device such as a pneumotachograph or commercial electronic flow sensor may also be substituted.
In this experiment with simulated lungs, a single step adjustment for compliance was achieved. There was no apparent interaction between the lung simulators. Due to the limitations of the simulators, this may not be reflected in patients. In practice, disconnection of either patient is likely to cease ventilation to both patients. This could be mitigated with a circuit cap or clamp.
This study has several limitations. We have investigated ventilating two lung simulators with similar target tidal volumes and differing compliance. However, there are many variables that may affect the circuit dynamics, and these may be explored further with computational fluid dynamics simulations. This ventilator setup is unable to deliver differential PEEP to the simulated lungs. This is a significant limitation, as carefully titrated PEEP is a key aspect of the optimal management of acute respiratory distress syndrome. Furthermore, it is not clear what effect spontaneous respiratory efforts would have in this system. This would be a highly complex interaction with very unpredictable, potentially deleterious effects.
In conclusion, we have demonstrated in this bench study that it is possible to achieve ventilation of two test lungs with differential driving pressures using standard medical equipment. Pressure control and volume control ventilation modes are both feasible. The use of this method in the clinical context has not been validated and therefore the authors do not recommend its use until further clinical studies have been completed.
Acknowledgements
We thank Dr D. Duke for his feedback and input into the experimental design, Prof D. Tuxen for his clinical feedback, and Dr A. Burrell and Dr N. Hiscock for their feedback on the manuscript. AS, SL and SG were supported by Monash University, SG is supported by a National Heart Foundation of Australia Fellowship (102062). No other external funding or competing interests declared.
Contributor Information
A. L. Clarke, Email: contact@alexanderclarke.id.au, @fifteenforty.
A. F. Stephens, @AndrewFStephens.
S. Liao, @Sam75681994.
T. J. Byrne, @100percentbyrne.
S. D. Gregory, @drshaungregory.
References
- 1. Zhou F, Yu T, Du R, et al. Clinical course and risk factors for mortality of adult inpatients with COVID‐19 in Wuhan, China: a retrospective cohort study. Lancet 2020; 395: 1054–62. [DOI] [PMC free article] [PubMed] [Google Scholar]
- 2. Neyman G, Irvin CB. A single ventilator for multiple simulated patients to meet disaster surge. Academic Emergency Medicine 2006; 13: 1246–9. [DOI] [PMC free article] [PubMed] [Google Scholar]
- 3. Paladino L, Silverberg M, Charchaflieh JG, et al. Increasing ventilator surge capacity in disasters: ventilation of four adult‐human‐sized sheep on a single ventilator with a modified circuit. Resuscitation 2008; 77: 121–6. [DOI] [PubMed] [Google Scholar]
- 4. Branson RD, Rubinson L. One ventilator multiple patients – what the data really supports. Resuscitation 2008; 79: 171–2. [DOI] [PubMed] [Google Scholar]
- 5. Rubinson L, Branson RD, Pesik N, Talmor D. Positive‐pressure ventilation equipment for mass casualty respiratory failure. Biosecurity and Bioterrorism: Biodefense Strategy, Practice, and Science 2006; 4: 183–94. [DOI] [PubMed] [Google Scholar]
- 6. Iscoe S, Fisher J. Still better multi‐patient ventilation. Resuscitation 2008; 79: 173–4. [DOI] [PubMed] [Google Scholar]
- 7. Clarke AL. 3D printed circuit splitter and flow restriction devices for multiple patient lung ventilation using one anaesthesia workstation or ventilator. Anaesthesia 2020; 75: 819–20. [DOI] [PubMed] [Google Scholar]
- 8. Pinson H. A better way of connecting multiple patients to a single ventilator. 2020. https://medium.com/@pinsonhannah/a-better-way-of-connecting-multiple-patients-to-a-single-ventilator-fa9cf42679c6 (accessed 30/03/2020).
- 9. Anesthesia Patient Safety Foundation . Joint statement on multiple patients per ventilator. 2020. https://www.apsf.org/news-updates/joint-statement-on-multiple-patients-per-ventilator (accessed 30/03/2020).
- 10. FDA . Emergency Use Authorization for Ventilators, anesthesia gas machines modified for use as ventilators, and positive pressure breathing devices modified for use as ventilators (collectively referred to as “ventilators”), ventilator tubing connectors, and ventilator accessories. 2020. https://www.fda.gov/media/136423/download (accessed 06/04/2020).
- 11. Anesthesia Patient Safety Foundation . FAQ on anesthesia machine use, protection, and decontamination during the COVID‐19 pandemic. 2020. https://www.apsf.org/faq-on-anesthesia-machine-use-protection-and-decontamination-during-the-covid-19-pandemic/ (accessed 30/03/2020).