Abstract
Numerous recent works highlight the limited utility of established tumor cell lines in recapitulating the heterogeneity of tumors in patients. More realistic preclinical cancer models are thought to be provided by transplantable, patient-derived xenografts (PDXs). The inter- and intratumor heterogeneity of PDXs, however, presents several challenges in developing optimal quantitative pipelines to assess response to therapy. The objective of this work was to develop and optimize image metrics for 18F-FDG PET to assess response to combination docetaxel and carboplatin therapy in a co-clinical trial involving triple-negative breast cancer PDXs. We characterized the reproducibility of standardized uptake value (SUV) metrics to assess response to therapy, and we optimized a preclinical PERCIST paradigm to complement clinical standards. Considerations in this effort included variability in tumor growth rate and tumor size, solid tumors versus tumor heterogeneity and a necrotic phenotype, and optimal selection of tumor slices versus whole tumor. Methods: A test–retest protocol was implemented to optimize the reproducibility of 18F-FDG PET SUV thresholds, SUVpeak metrics, and preclinical PERCIST parameters. In assessing response to therapy, 18F-FDG PET imaging was performed at baseline and 4 d after therapy. The reproducibility, accuracy, variability, and performance of imaging metrics to assess response to therapy were determined. We defined an index called the Quantitative Response Assessment Score to integrate parameters of prediction and precision and thus aid in selecting the optimal image metric to assess response to therapy. Results: Our data suggest that a threshold of 25% of SUVmax (SUV25) was highly reproducible (<9% variability). The concordance and reproducibility of preclinical PERCIST were maximized at α = 0.7 and β = 2.8 and exhibited a high correlation with SUV25 measures of tumor uptake, which in turn correlated with the SUV of metabolic tumor. Conclusion: The Quantitative Response Assessment Score favors SUV25 followed by SUVpeak for a sphere with a volume of 14 mm3 (SUVP14) as optimal metrics of response to therapy. Additional studies are warranted to fully characterize the utility of SUV25 and preclinical PERCIST SUVP14 as image metrics for response to therapy across a wide range of therapeutic regimens and PDX models.
Keywords: co-clinical trials, triple-negative breast cancer, patient-derived xenografts, quantitative imaging, response to therapy, reproducibility
Co-clinical trials are an emerging area of investigation in which a clinical trial is coupled with a corresponding preclinical trial to inform the corresponding clinical trial (1–7). The preclinical arm of the co-clinical trial generally uses genetically engineered mouse models of human cancer or patient-derived xenografts (PDXs) to aid in assessing therapeutic efficacy, stratifying patients, and designing optimal treatment strategies (8,9). The emergence of genetically engineered mouse models and PDXs as co-clinical platforms is largely motivated by the realization that established cell lines do not recapitulate the heterogeneity of human tumors or the diversity of tumor phenotypes (10) and that better oncology models are needed to support high-impact translational cancer research. To that end, the NCI Patient-Derived Models Repository (https://pdmr.cancer.gov), the EuroPDX Consortium (https://www.europdx.eu), academic institutions, and numerous commercial entities have launched wide-ranging PDX and genetically engineered mouse model repositories to advance the biologic and molecular basis for cancer prevention and treatment toward realization of precision medicine. Importantly, the National Cancer Institute recently launched the Co-Clinical Imaging Research Resources Program Network (https://nciphub.org/groups/cirphub) to advance the utility of oncology models of human cancers in preclinical imaging.
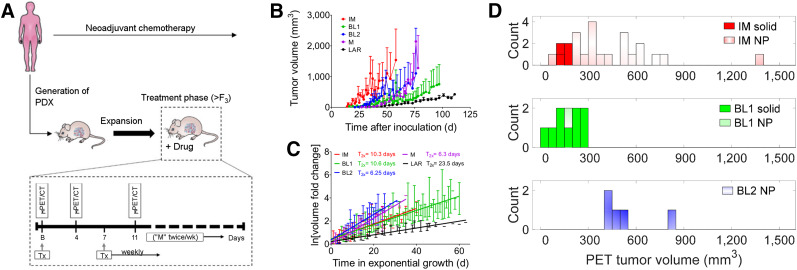
The use of PDXs in preclinical imaging offers numerous advantages in translational imaging research. Chief among them is retention of human tumor heterogeneity, which can be exploited to develop image metrics for heterogeneity and response to therapy. Unlike established tumor cell lines, PDXs also exhibit significant variability in growth profiles both within and between patient-generated PDXs. In addition to biologic variability (due to genotypic variability), the gross phenotype of PDX tumors is also highly variable, with some exhibiting a necrotic phenotype. Clinically, patients with triple-negative breast cancer (TNBC) have shown high sensitivity to the addition of carboplatin to anthracycline and taxane-based neoadjuvant chemotherapy (11). With that in mind, we designed a co-clinical trial to assess the efficacy of 18F-FDG PET in predicting response to docetaxel and carboplatin therapy (Fig. 1A, ClinicalTrial.gov identification number NCT02124902). The clinical arm aims to predict the response to a combination of docetaxel and carboplatin therapy using 18F-FDG PET. The preclinical arm uses tumor biopsies derived from patients in the trial to generate PDXs, which are then used, among other objectives, to optimize 18F-FDG PET imaging biomarkers of response to therapy.
FIGURE 1.
Co-clinical study design and heterogeneity of PDXs. (A) PDXs were generated from patient biopsies derived at baseline. In a preclinical arm, after baseline imaging, PDXs were treated weekly for 4 wk. Tumor volumes were measured by calipers biweekly. Initially, we tested mid-therapy imaging at 4 and 11 d after baseline. In therapy arm, only 4-d time point was used. (B) Growth profile of immunomodulatory, basallike, mesenchymal, and luminal androgen receptor subtypes. (C) Log of volume fold change from start of exponential growth. (D) Histogram of tumor volumes for subtypes used in test–retest studies. B = baseline; BL1 = basallike subtype 1; BL2 = basallike subtype 2; F3 = third generation of PDX from original (F0) PDX; IM = immunomodulatory; LAR = luminal androgen receptor; ln = natural logarithm; M = mesenchymal; “M” = measured; NP = necrotic phenotype; Tx = treatment; T2x = doubling time; μ = preclinical.
Through this framework, we identified 6 TNBC subtypes, including 2 basallike subtypes, an immunomodulatory subtype, a mesenchymal subtype, a mesenchymal stem–like subtype, and a luminal androgen receptor subtype (Supplemental Fig. 1; supplemental materials are available at http://jnm.snmjournals.org). A subset of these PDXs was used to develop optimal quantitative imaging strategies to assess the response to combination docetaxel and carboplatin therapy in TNBC PDXs. We characterized the reproducibility and precision of SUV metrics to assess therapeutic response, and we optimized a preclinical PERCIST paradigm to complement clinical PERCIST standards (12). The performance of SUV quantiles for the whole tumor, a high-intensity single slice, SUVmax, and SUVpeak to assess response to therapy was determined. This work addressed a central effort within the imaging community and the National Cancer Institute to reach a consensus on the reproducibility and utility of imaging metrics for response to therapy in oncology animal models.
MATERIALS AND METHODS
Generation of TNBC PDXs
Gene expression analyses of 93 TNBC PDXs (29,657 unique genes and probes) was performed to identify 6 TNBC subtypes, including 2 basallike subtypes, an immunomodulatory subtype, a mesenchymal subtype, a mesenchymal stem–like subtype, and a luminal androgen receptor subtype (Supplemental Fig. 1) as described previously (13). Details on the animals, surgeries, and tumor xenografts were reported previously (14). All animal experiments complied with the Guidelines for the Care and Use of Research Animals established by Washington University’s Animal Studies Committee.
Characterization of PDX Tumor Growth
After inoculation, the mice were examined 3 times per week for palpable tumors. When a palpable tumor was observed, caliper measurements were made of the major (length) and minor (width) axes biweekly. Tumor volume was calculated as ⅙ × length × width2. The natural growth curves were constructed for each PDX subtype using the daily average and SD for all mice. Tumor size doubling times were determined using the exponential growth region for each mouse individually. The time scale was shifted to the start of exponential growth, and the tumor volumes were normalized to the volume at that time. The mean logarithm of volume fold change from start of exponential growth was plotted against time in exponential growth, and the doubling time was calculated from the slope.
Preclinical Studies
Three distinct experiments were performed. In the first, test–retest studies were performed on consecutive days (Day 1 vs. Day 2) to assess the reproducibility of PET image metrics. Typically, 8–12 PDX mice for each TNBC subtype were used in the study. Care was taken to repeat the exact imaging conditions on days 1 and 2, including the scanner utilized. In total, 46 PDX mice were used in this cohort.
In the second experiment, a cohort of 8 PDX (n = 8) was used to assess the impact of animal handling and imaging on survival using the study design depicted in Figure 1A. A separate cohort of 8 PDX mice (n = 8) was administered treatment weekly, but no imaging was performed. Our results suggested that repeat imaging impacted survival (Supplemental Fig. 2), and for that reason we excluded an 11-d imaging time point from the study design. Previous studies have reported that animal handling has dramatic effects on the biodistribution and image metrics for 18F-FDG uptake (15). This observation has broad implications in developing best practices for therapeutic imaging studies, as it suggests that in designing preclinical therapeutic-imaging protocols, the complexity of a combined therapeutic-imaging study should be minimized so as not to impact the overall objectives of a given investigation.
The third experiment involved a therapeutic arm with imaging. The study design of the therapeutic arm is depicted in Figure 1A. Preclinical imaging was performed at baseline and 4 d after therapy. In all therapeutic studies, docetaxel (20 mg/kg intraperitoneally) and carboplatin (50 mg/kg intraperitoneally) were administered at baseline (after imaging) and weekly for 4 wk. Tumor volumes were measured biweekly as a surrogate measure of response to therapy.
Preclinical Imaging and Image Analysis
Four hours before the imaging session, food was removed from the metabolism cages, whereas water was given ad libitum. The mice were anesthetized with 2%–2.5% isoflurane by inhalation via an induction chamber. Anesthesia was maintained throughout the imaging session by delivering 1%–1.5% isoflurane via a custom-designed nose cone. A heat lamp was used to maintain body temperature. The mice were injected with 18F-FDG (6.66–8.14 MBq) by the tail vein immediately before a dynamic small-animal PET acquisition from 0 to 60 min. PET images were acquired on a microPET Focus 220 scanner (Concorde Microsystems Inc.) or on an Inveon small-animal PET/CT scanner (Siemens Medical Solutions), and the CT images were acquired on the Inveon. CT-based attenuation correction was used. The PET scanners were cross-calibrated according to our standard operating procedures.
Data from 50 to 60 min after injection of 18F-FDG were used in the analysis. The PET/CT image data from all mice were processed in 2 steps. In the first step, the coregistered PET/CT images were analyzed using the Inveon Research Workplace software (Siemens Healthcare). Regions of interest (ROIs) were manually drawn on coregistered PET/CT images. The corresponding voxels were further processed in MATLAB (MathWorks Inc). ROIs and individual voxels were normalized to SUV using the following relation: SUV = [activity (Bq/mL)] × [animal weight (g)]/[injected dose (Bq)]. Multiple analytic pipelines were pursued. The first analysis was the use of image histogram reproducibility analysis (IHRA) to compute tumor thresholds. At each percentage threshold, SUV was calculated as the percentage of SUVmax (i.e., threshold × SUVmax/100). The threshold SUV represents the mean of the voxels with a SUV greater than the threshold SUV. The second analysis was of the SUVmax and SUVpeak for 3 distinct volumes centered on SUVmax. The third analysis was of whole tumor and single slices. The fourth analysis pipeline entailed optimization and evaluation of preclinical PERCIST.
Preclinical PERCIST
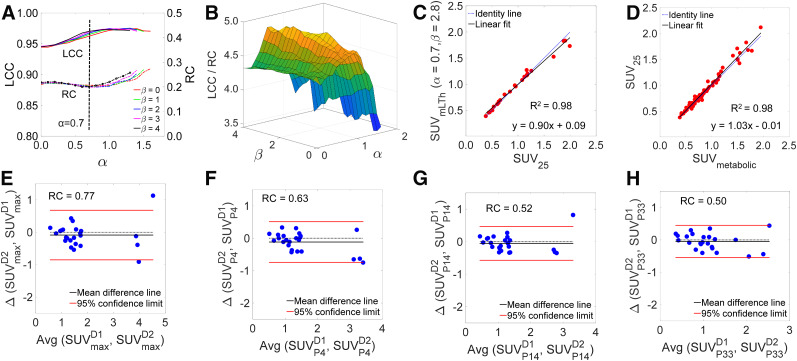
The tumor threshold based on PERCIST (12) is provided by the following formula: α × [mean concentration of liver ROI] + β × [SD of liver ROI]. Liver ROIs were determined 50–60 min after injection of 18F-FDG. Optimization of α and β entails maximizing the Lin concordance correlation coefficient (LCC) while minimizing the repeatability coefficient (RC) (which would minimize the 95% confidence interval [CI], hence maximizing reproducibility); thus, the objective function to maximize is the ratio of LCC (16) to RC. A range of values for α and β was evaluated and optimized. Implementation of preclinical PERCIST relies on evaluation of SUVpeak.
IHRA
IHRA was performed to determine the percentage threshold of SUVmax. At a 100% threshold, SUV corresponds to high-intensity voxels (or SUVmax). At the limit, as the threshold reaches 0%, SUV is identical to SUVmean. At each threshold, the mean of the voxels at the threshold is computed by taking the average over all the voxels in the defined tumor region or threshold. At a threshold of 25%, for example, the mean of voxels greater than or equal to 0.25 × SUVmax is calculated. Therefore, as the percentage threshold decreases, the volume of the tumor region under consideration increases with the addition of lower-intensity voxels. This process is repeated for the whole tumor and for the metabolically active tumor region for each mouse.
Analysis of a Single Slice
To facilitate analysis, results obtained from whole-tumor analysis were compared with those obtained from a single slice. The single slice with the maximum mean activity (the hottest slice) was selected for processing to investigate the reproducibility of the data. The data for the hottest slice were processed using the same procedure as for the whole-tumor-volume data to compute different thresholds of interest.
SUVpeak Analyses
SUVpeak denotes the mean of all the voxels in a sphere centered on the hottest voxel. Three different spheric volumes were considered: spheres with volumes of 4 mm3 (SUVP4), 14 mm3 (SUVP14), and 33 mm3 (SUVP33), corresponding to spheres with radius of 1, 2, and 3 voxels, respectively. SUVpeak was further investigated in the reproducibility and treatment response studies, first to compute the limits of agreement and later to evaluate their performance in assessing the response to therapy.
Image datasets and protocols are available through https://c2ir2.wustl.edu/ by contacting the corresponding author.
Statistical Analysis
The reproducibility analysis included image data from the immunomodulatory and basallike subtype 1 and 2 PDXs. The optimization of preclinical PERCIST, assessment of response to therapy, and performance of image metrics in assessing response to therapy included image data from the immunomodulatory, luminal androgen receptor, mesenchymal, and basallike subtype 1 and 2 PDXs.
Growth Profile of PDXs
Coincidence tests (17) were used to compare the slopes between passages within a PDX subtype and between PDX subtypes. GraphPad Prism, version 7, was used to perform these tests.
Reproducibility Statistics
PDXs were imaged on consecutive days to assess reproducibility. Two methods for assessing reproducibility were used, LCC (16) and Bland–Altman plotting (BA) (18). LCC, being the product of the Pearson correlation coefficient (PCC) and the bias correction factor (BCF), accounts for both precision and accuracy. The method outlined by Watson and Petrie (19) was followed to calculate these metrics. The procedure used to calculate the statistical parameter for the BA plots was summarized by Galbraith et al. (20) and Raunig et al. (21). The day 1 versus day 2 absolute differences were shown to be independent of the means using the Kendal τ test for correlation (20), with Stata, version 12.1.
The SD for the mean difference is calculated using Supplemental Equation 1, and the within-mouse SD is calculated using Supplemental Equation 2, in which Δ denotes the within-mouse difference between the measurements and n denotes the number of paired measurements.
The 95% CI in the BA plots is the limits of agreement, defined as the mean difference ± the RC (Supplemental Eq. 3). These limits are independent of the sample size, so that the result from an individual test–retest experiment is expected to fall within these boundaries 95% of the time.
Assessment of Response to Therapy
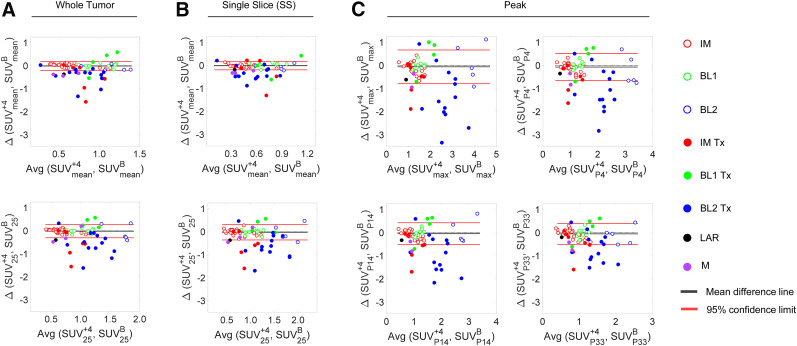
A decrease in tumor volume of greater than 20% was considered a response to therapy; no change or an increase in tumor volume was considered not responsive. The change in image metrics between 4 d after treatment and baseline scan was used as the predictive criterion. To assess the applicability of these parameters, the differences between the baseline and posttreatment values were plotted against the mean of the 2 values on the BA plot for all PDX tumors. If the change in image metric was within the 95% CI, the change was considered indistinguishable from metric variability and the prediction was not evaluated. The two class labels used to assess response to therapy were response and no response (22,23). Endpoint caliper-measured volume changes were considered binary indicators of response to therapy.
Performance Analysis of Image Metrics
The performance of image metrics is tabulated in Supplemental Table 1, and the accuracy of the image metrics by subtype is tabulated in Supplemental Table 2.
Standard performance binary classification metrics were used to assess the response to the therapy including: sensitivity, or the number of positive responses that are correctly classified as positive; specificity, or the number of negative responses that are correctly classified as negative; precision, or the probability that a prediction of positive is actually positive; negative predictive value, or the probability that a prediction of negative is actually negative; accuracy, or the fraction of correct prediction to the total number of observation; and F score, or the harmonic mean of precision and sensitivity (22,23). The evaluations were categorized as true-positive when the outcome was a positive response (true) and the SUV change also predicted a positive response (true); false-negative when the outcome was a positive response (true) but the SUV change predicted a nonresponse (false); true-negative when the outcome was a nonresponse (true) and the SUV change also predicted a nonresponse (true); and false-positive when the outcome was a nonresponse (false) but the SUV change predicted a positive response (true).
Quantitative Response Assessment Score (QRAS)
We defined the index QRAS to integrate parameters of prediction, performance and precision and thus aid in selecting optimal image metrics. QRAS is defined as (RC) · (Uncertainty)/(F score), with lower scores favorable.
Evaluation of Dynamic Range of SUV Metrics
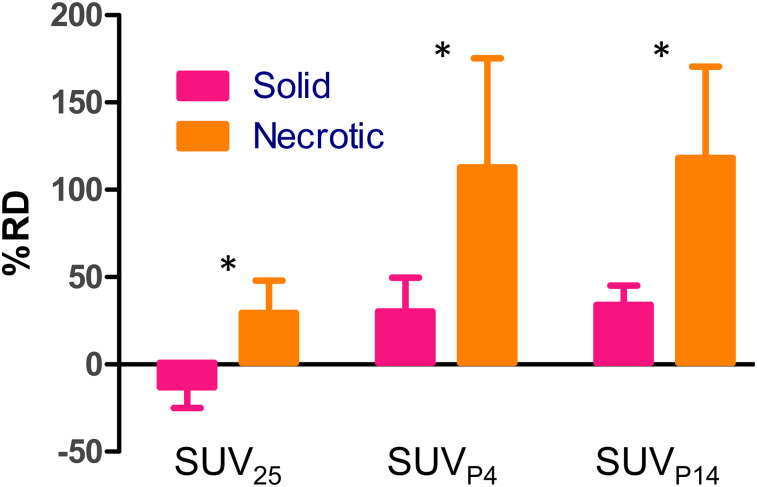
Let D denote the difference in SUV metric between 4 d and baseline. The percentage relative difference is defined as 100 · [D# −Dmean]/Dmean, where D# represents D25, DP4, or DP14.
RESULTS
Variability in PDX Tumor Growth
The caliper volume growth curves for immunomodulatory, basallike subtype 1, basallike subtype 2, mesenchymal, and luminal androgen receptor PDX tumors are depicted in Figure 1B, and the average logarithmic growth curves are in Figure 1C. Coincidence tests for the slopes of the logarithmic growth curves indicated that the immunomodulatory subtype equaled basallike subtype 1, that basallike subtype 2 equaled the mesenchymal type, and that these groups differed from each other and from the luminal androgen receptor subtype (P < 0.0001 for all comparisons). The average doubling times are depicted in Figure 1C. The day-of-scan distribution of PET tumor volumes used for test–retest studies is depicted in Figure 1D.
IHRA to Optimize Image Metrics for Reproducibility
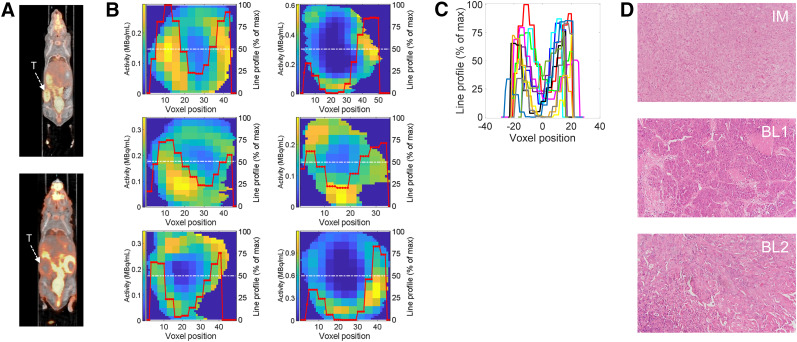
Selected tumor phenotypes are depicted in Figure 2 for basallike subtypes 1 and 2. Normalized line-intensity profiles across individual slices from distinct PDX tumors (Fig. 2B), and when centered at zero (Fig. 2C), illustrate the heterogeneity in the tumors. The minima along the line profiles in Figure 2C vary from 0% to ∼25% of the hottest voxel. Representative samples of hematoxylin and eosin staining for each of the PDXs is depicted in Figure 2D.
FIGURE 2.
Image analytics. (A) Representative 18F-FDG PET coronal slices of PDXs. (B) Representative tumor slices at center coronal plane for immunomodulatory subtype (top), basallike subtype 1 (middle), and basallike subtype 2 (bottom). Red lines denote intensity line profiles along slice center (white lines) normalized to maximum intensity in respective slice (displayed as percentage of maximum intensity). (C) Intensity line profiles of all tumors in A, with their minima centered at zero position to highlight variability in threshold of necrotic phenotype. (D) Representative hematoxylin- and eosin-stained slices of immunomodulatory subtype and basallike subtypes 1 and 2. BL1 = basallike subtype 1; BL2 = basallike subtype 2; IM = immunomodulatory; T = tumor.
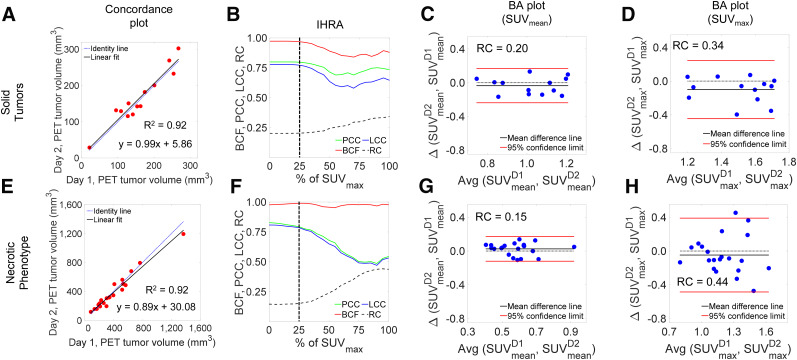
The test–retest PET-derived volume measures are depicted in Figure 3A. There is excellent agreement between the day 1 and day 2 volume measures (R2 = 0.92). The IHRA for solid tumors is depicted in Figure 3B. For SUVmax (i.e., 100% of SUVmax), reproducibility was low (LCC = ∼0.58); with increasing quantiles, LCC saturated at the 25% tumor quantile (LCC = 0.77, PCC = 0.80, and BCF = 0.97). Thus, metabolic tumor volume defined by SUV25 is an inflection point at which the PCC, BCF, and LCC saturate and show a negligible change thereafter. These observations are better reflected by the BA plots of the quantile boundaries shown in Figures 3C and Figure 3D. The 95% CIs of agreement for SUVmean (RC, 0.20) are significantly tighter than those for SUVmax (RC, 0.34).
FIGURE 3.
Concordance and IHRA for solid and necrotic tumor phenotypes. (A) Day 1 vs. day 2 metabolic (PET) tumor volume concordance plot for solid tumors. (B) IHRA depicting BCF, PCC, LCC, and RC as function of percentage (threshold) of SUVmax. (C and D) BA plots for SUVmean and SUVmax. (E–H) Similar parameters for tumors with necrotic phenotype. D1 and D2 denote Day 1 and Day 2, respectively.
Overall, 21 PDX tumors exhibited a necrotic-core phenotype (low 18F-FDG uptake at the core) with varying tumor dimensions. In contrast, solid tumors (n = 13) were defined as having no visual necrotic phenotype. PET-derived volumes ranged from approximately 85 to 1,400 mm3. Despite the range, there was excellent agreement in the day 1 and day 2 concordance plot (Fig. 3E), with a slight bias at high tumor volumes due to a large tumor, at 1,400 mm3, which skewed the linearity. The IHRA for these tumors is depicted in Figure 3F. SUVmax image metrics exhibited poor concordance (LCC, 0.52) with high RC (approaching 0.50). As the intensity quantile reached 25%, both PCC and LCC achieved a value of approximately 0.79 and the LCC peaked (LCC = 0.81) for SUVmean (at 0% IHRA). The BA plots for SUVmean and SUVmax are shown in Figures 3G–3H. The 95% CI range for SUVmax (RC, 0.44) was approximately 3-fold higher than that for SUVmean (RC, 0.15), suggesting poor reproducibility for SUVmax.
High-Intensity-Slice Versus Whole-Tumor Analysis
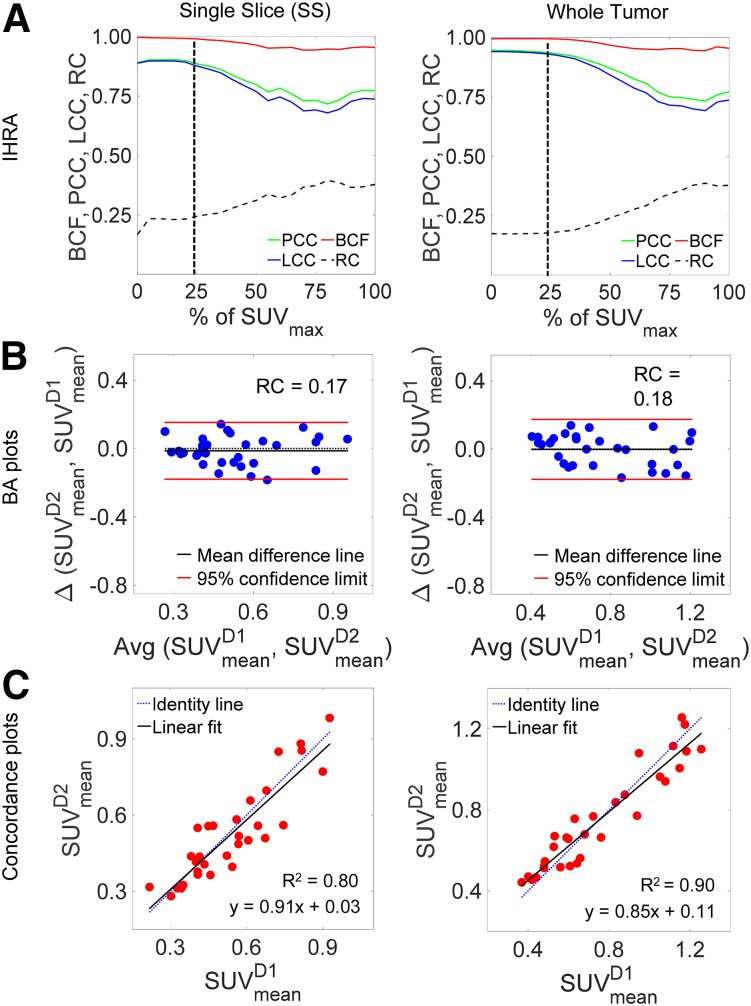
IHRA implemented on a single slice and on the total tumor volume is depicted in Figure 4. All 3 metrics for performance—PCC, BCF, and LCC—peaked at 25% thresholding of SUVmax, with an LCC of 0.88 for a single slice and 0.93 for the total tumor volume. There was a negligible change at quantiles lower than 25%, as the remaining low-intensity voxels in the ROI were included in the analysis (Fig. 4A). The BA plots for a single slice and the whole tumor showed similar statistics (Fig. 4B). There was an excellent correlation between day 1 and day 2 measures, as indicated in Figure 4C.
FIGURE 4.
Concordance and reproducibility analysis of all PDXs in test–retest cohort: IHRA (A), BA plots (B), and concordance plot (C) for single slice and whole tumor. In all 3 cases, PCC, BCF, and LCC show similar trends and LCC approaches plateau at SUV25.
Optimization of Preclinical PERCIST
The IHRA plot of Figure 5A depicts LCC and RC as a function of α and selected β values. Figure 5B depicts the surface plot of the objective function LCC/RC, which is maximized at α = 0.7 and β = 2.8. The tumor SUV BA plot for an optimized liver threshold is depicted in Supplemental Figure 3. Figure 5C depicts the correlation between tumor SUVmean and liver threshold defined by preclinical PERCIST parameters (α = 0.7, β = 2.8) and SUV25, whereas Figure 5D depicts the correlation between SUV25 and SUV of metabolic tumor. There was an excellent correlation between liver-threshold tumor uptake and SUV25 (R2 = 0.98) and between SUV25 and SUV of metabolic tumor (R2 = 0.98), with a slope not significantly different from identity (Supplemental Fig. 4 shows the correlation of SUVmean and SUVmax to SUV of metabolic tumor). The BA plots corresponding to SUVmax and the 3 distinct SUVpeaks are depicted in Figures 5E–5H. With increased peak ROI volumes, there was less variability in test–retest measures as denoted by a reduced RC.
FIGURE 5.
Optimization of preclinical PERCIST. (A) IHRA of preclinical PERCIST depicting LCC and RC as function of α and select β values. (B) Surface plot of objective function LCC/RC, which is maximized at α = 0.7 (dashed line in A) and β = 2.8. (C) Correlation between optimized liver threshold for preclinical PERCIST and SUV25. (D) Correlation between SUV25 and SUV of metabolic tumor (SUVmetabolic). (E–H) BA plots for SUVmax and SUVpeak with SUVP4, SUVP14, and SUVP33.
Prediction of Response to Therapy
In Figure 6, we depict the BA plots of response to therapy for SUVmean and SUV25 using whole tumor (Fig. 6A) and a single slice (Fig. 6B), whereas Figure 6C depicts the BA plots of response to therapy using SUVpeak metrics. The performance of imaging metrics in predicting the response to therapy for data points outside the limits of agreement is summarized in Supplemental Table 1, along with the percentage of datapoints within the limits of agreement. Importantly, the accuracy of predicting response conditioned by subtype is tabulated in Supplemental Table 2. Figure 7 depicts the percentage difference between SUV25 and SUVpeak relative to SUVmean in assessing response to therapy. The figure suggests that all metrics have a higher dynamic range (on the order of 2- to 4-fold) than that of SUVmean to assess response to therapy. Table 1 shows the performance parameters for SUVmax, SUV25, and SUVpeak and the calculated QRAS. Measures of SUV25 scored the lowest (best), followed by SUVP14.
FIGURE 6.
BA plots of image metrics for response assessment. (A) Response to therapy for SUVmean for whole tumor (top) and SUV25 (bottom). (B) Measures similar to those in A but for single high-intensity slice. (C) SUVmax, SUVP4, SUVP14, and SUVP33. Open circles represent test–retest data points; filled circles are posttherapy data points. In general, metrics for response to therapy are outside limits of agreement (test–retest). Dotted lines represent zero bias lines. BL1 = basallike subtype 1; BL2 = basallike subtype 2; IM = immunomodulatory; LAR = luminal androgen receptor; M = mesenchymal; Tx = treatment; B = baseline; +4 = day 4.
FIGURE 7.
Dynamic range of SUV25, SUVP4, and SUVP14 relative to SUVmean. Data represent mean ± SEM. *Significant difference (ANOVA). RD = relative difference.
TABLE 1.
Parameters in Selecting Optimal Image Metrics for Response to Therapy
| SUV metric | RC | F score | Uncertain fraction | QRAS |
| ΔSUVmax | 0.73 | 0.73 | 0.45 | 0.45 |
| ΔSUV25 | 0.28 | 0.72 | 0.31 | 0.12 |
| ΔSUV25 (single slice) | 0.33 | 0.74 | 0.34 | 0.15 |
| ΔSUVP4 | 0.59 | 0.77 | 0.48 | 0.37 |
| ΔSUVP14 | 0.47 | 0.74 | 0.34 | 0.22 |
| ΔSUVP33 | 0.45 | 0.69 | 0.41 | 0.27 |
F score is derived from performance evaluation of response to therapy. “Uncertain fraction” is fraction of data points within limits of agreement for a given image metric QRAS=RC · (uncertain fraction)/(F score). Lower QRAS value is favorable.
DISCUSSION
We generated 5 PDX subtypes of TNBC as a preclinical platform to develop and optimize image metrics for response to therapy. PDXs provided a wide range of phenotypes, which we exploited to develop and test image metrics for response to therapy. In light of the heterogeneity of tumors, we took a top-down image-data–centric approach in optimizing image metrics for reproducibility and response to therapy. We stratified PDX tumors to those exhibiting a solid phenotype and to those exhibiting a necrotic phenotype and implemented IHRA in each group and the combined groups to define optimal measures of 18F-FDG PET uptake in PDXs. For both solid tumors and tumors exhibiting a necrotic phenotype, reproducibility peaked at SUV25. Similarly, in the combined dataset, measures of reproducibility plateaued at SUV25. Thus, SUV25 was optimal to maximize reproducibility. Wu et al. (24) performed extensive histologic analyses of coregistered preclinical 18F-FDG PET images in an effort to define tumor boundaries. In agreement with our findings, Wu et al. (24) concluded that a minimum threshold of up to 30% of maximum tumor voxel counts is needed to define viable tumors.
Clinically, PERCIST (12) is widely used to assess response to therapy (25–28). Wu et al. (24) additionally optimized a PERCIST-motivated cutoff of α × [mean concentration of liver ROI] + β × [SD of liver ROI] with α = 6 and β = 2 to define viable tumors in vivo. To harmonize preclinical efforts with clinical standards of response to therapy assessment, we similarly optimized preclinical PERCIST parameters to maximize concordance and reproducibility. Our data suggest that LCC/RC is maximized at α = 0.7 and β = 2.8. Liver-threshold tumor uptake exhibited a high correlation with SUV25, which in turn highly correlated with the SUVmean of metabolic tumor, suggesting that liver-threshold tumor uptake and SUV25 provide measures of viable metabolic tumor. The clinical utility of PERCIST is that it provides an internal patient-specific reference across diverse subjects. We used a homogeneous population of mice (all being NSG mice of the same approximate weight); thus, variability across species and strains needs to be explored.
In assessing response to therapy, the optimal imaging metric needs to take into account reproducibility, the extent of uncertainty in predicting response to therapy, and the performance of an imaging metric in assessing response to therapy, which led to the development of QRAS. QRAS analysis suggests that SUV25 (whole tumor and single slice), followed by SUVP14, are the optimal metrics to assess response to therapy. When one uses whole-tumor or single-slice measures of uptake, inclusion of low-intensity voxels attributed to the necrotic phenotype is expected to lower the image metrics for 18F-FDG PET uptake and bias against measures of tumor response to therapy. Thus, it is expected that exclusion of tumor voxels attributed to the necrotic phenotype will improve the sensitivity of imaging biomarkers in assessing response to therapy. Indeed, these metrics have a wider dynamic range than SUVmean (∼2- to 4-fold) in predicting response to therapy. The choice between SUV25 and SUVP14 may depend on the dynamic range of response assessment but will ultimately require additional validation in other animal models and therapeutic interventions, and with consideration of confounding factors (e.g., anesthesia). Finally, the accuracy in predicting response to therapy is dependent on the PDX subtype, suggesting that with a priori knowledge of the TNBC subtype, one can define confidence in predicting response to therapy. The timing of response assessment may be a function of subtype as well (which we were unable to investigate in this work). This notion underscores the premise of precision medicine and precision imaging, that is, integrating genomic signatures (defining a subtype in this case) to enhance prediction of response to therapy.
CONCLUSION
The work addressed a central effort within the imaging community and the National Cancer Institute to reach a consensus on the reproducibility and utility of imaging metrics to assess response to therapy in more realistic models of human cancers (e.g., PDXs and genetically engineered mouse models), thus enhancing the translational impact of preclinical imaging studies. In a co-clinical study design using patient-derived tumors, our data suggest that SUV25 18F-FDG PET measures are highly reproducible. Importantly, QRAS scores favor SUV25, followed by SUVP14, as the optimal metrics for response to therapy. The choice between SUV25 and SUVP14 may depend on the dynamic range of response assessment. Additionally, SUV25 correlated with optimized preclinical PERCIST measures of tumor uptake and SUV of metabolic tumor, suggesting that both may provide image metrics for viable tumor. Further studies are warranted to fully characterize the utility of SUV25 and optimized implementation of preclinical PERCIST via SUVP14 as image metrics for response to therapy across a wide range of therapeutic regimens and animal models of human cancer.
DISCLOSURE
This work was supported by National Cancer Institute grants U24CA209837, U54CA224083, and U54CA199092; NIBIB grant P41EB025815; Siteman Cancer Center Support Grant P30CA091842; and internal funds provided by the Mallinckrodt Institute of Radiology. No other potential conflict of interest relevant to this article was reported.
KEY POINTS
QUESTION: What is the optimal 18F-FDG PET SUV image metric for response to therapy in TNBC PDXs?
PERTINENT FINDINGS: In a co-clinical study design using PDXs, our data suggested that SUV25 is highly reproducible. QRAS scores favored SUV25, followed by SUVP14 (for implementation of preclinical PERCIST), as the optimal metrics for response to therapy. The choice between SUV25 and SUVP14 may depend on the dynamic range of response assessment.
IMPLICATIONS FOR PATIENT CARE: This work addressed a central effort within the imaging community and the National Cancer Institute to reach a consensus on the reproducibility and utility of imaging metrics to assess response to therapy in more realistic models of human cancers (e.g., PDXs and genetically engineered mouse models), thus enhancing the translational impact of preclinical imaging studies.
Supplementary Material
REFERENCES
- 1.Chen Z, Akbay E, Mikse O, et al. Co-clinical trials demonstrate superiority of crizotinib to chemotherapy in ALK-rearranged non-small cell lung cancer and predict strategies to overcome resistance. Clin Cancer Res. 2014;20:1204–1211. [DOI] [PMC free article] [PubMed] [Google Scholar]
- 2.Kim HR, Kang HN, Shim HS, et al. Co-clinical trials demonstrate predictive biomarkers for dovitinib, an FGFR inhibitor, in lung squamous cell carcinoma. Ann Oncol. 2017;28:1250–1259. [DOI] [PubMed] [Google Scholar]
- 3.Kwong LN, Boland GM, Frederick DT, et al. Co-clinical assessment identifies patterns of BRAF inhibitor resistance in melanoma. J Clin Invest. 2015;125:1459–1470. [DOI] [PMC free article] [PubMed] [Google Scholar]
- 4.Lunardi A, Ala U, Epping MT, et al. A co-clinical approach identifies mechanisms and potential therapies for androgen deprivation resistance in prostate cancer. Nat Genet. 2013;45:747–755. [DOI] [PMC free article] [PubMed] [Google Scholar]
- 5.Nishino M, Sacher AG, Gandhi L, et al. Co-clinical quantitative tumor volume imaging in ALK-rearranged NSCLC treated with crizotinib. Eur J Radiol. 2017;88:15–20. [DOI] [PMC free article] [PubMed] [Google Scholar]
- 6.Owonikoko TK, Zhang G, Kim HS, et al. Patient-derived xenografts faithfully replicated clinical outcome in a phase II co-clinical trial of arsenic trioxide in relapsed small cell lung cancer. J Transl Med. 2016;14:111. [DOI] [PMC free article] [PubMed] [Google Scholar]
- 7.Sia D, Moeini A, Labgaa I, Villanueva A. The future of patient-derived tumor xenografts in cancer treatment. Pharmacogenomics. 2015;16:1671–1683. [DOI] [PubMed] [Google Scholar]
- 8.Cho SY, Kang W, Han JY, et al. An integrative approach to precision cancer medicine using patient-derived xenografts. Mol Cells. 2016;39:77–86. [DOI] [PMC free article] [PubMed] [Google Scholar]
- 9.Clohessy JG, Pandolfi PP. Mouse hospital and co-clinical trial project: from bench to bedside. Nat Rev Clin Oncol. 2015;12:491–498. [DOI] [PubMed] [Google Scholar]
- 10.Sulaiman A, Wang L. Bridging the divide: preclinical research discrepancies between triple-negative breast cancer cell lines and patient tumors. Oncotarget. 2017;8:113269–113281. [DOI] [PMC free article] [PubMed] [Google Scholar]
- 11.Sharma P, Lopez-Tarruella S, Garcia-Saenz JA, et al. Efficacy of neoadjuvant carboplatin plus docetaxel in triple-negative breast cancer: combined analysis of two cohorts. Clin Cancer Res. 2017;23:649–657. [DOI] [PMC free article] [PubMed] [Google Scholar]
- 12.Wahl RL, Jacene H, Kasamon Y, Lodge MA. From RECIST to PERCIST: evolving considerations for PET response criteria in solid tumors. J Nucl Med. 2009;50(suppl 1):122S–150S. [DOI] [PMC free article] [PubMed] [Google Scholar]
- 13.Lehmann BD, Bauer JA, Chen X, et al. Identification of human triple-negative breast cancer subtypes and preclinical models for selection of targeted therapies. J Clin Invest. 2011;121:2750–2767. [DOI] [PMC free article] [PubMed] [Google Scholar]
- 14.Li S, Shen D, Shao J, et al. Endocrine-therapy-resistant ESR1 variants revealed by genomic characterization of breast-cancer-derived xenografts. Cell Reports. 2013;4:1116–1130. [DOI] [PMC free article] [PubMed] [Google Scholar]
- 15.Fueger BJ, Czernin J, Hildebrandt I, et al. Impact of animal handling on the results of 18F-FDG PET studies in mice. J Nucl Med. 2006;47:999–1006. [PubMed] [Google Scholar]
- 16.Lin LI. A concordance correlation coefficient to evaluate reproducibility. Biometrics. 1989;45:255–268. [PubMed] [Google Scholar]
- 17.Glantz SA. Primer of Biostatistics. New York, NY: McGraw Hill Medical; 2012. [Google Scholar]
- 18.Bland JM, Altman DG. Measuring agreement in method comparison studies. Stat Methods Med Res. 1999;8:135–160. [DOI] [PubMed] [Google Scholar]
- 19.Watson PF, Petrie A. Method agreement analysis: a review of correct methodology. Theriogenology. 2010;73:1167–1179. [DOI] [PubMed] [Google Scholar]
- 20.Galbraith SM, Lodge MA, Taylor NJ, et al. Reproducibility of dynamic contrast-enhanced MRI in human muscle and tumours: comparison of quantitative and semi-quantitative analysis. NMR Biomed. 2002;15:132–142. [DOI] [PubMed] [Google Scholar]
- 21.Raunig DL, McShane LM, Pennello G, et al. Quantitative imaging biomarkers: a review of statistical methods for technical performance assessment. Stat Methods Med Res. 2015;24:27–67. [DOI] [PMC free article] [PubMed] [Google Scholar]
- 22.Jiao Y, Du P. Performance measures in evaluating machine learning based bioinformatics predictors for classifications. Quant Biol. 2016;4:320–330. [Google Scholar]
- 23.Saito T, Rehmsmeier M. The precision-recall plot is more informative than the ROC plot when evaluating binary classifiers on imbalanced datasets. PLoS One. 2015;10:e0118432. [DOI] [PMC free article] [PubMed] [Google Scholar]
- 24.Wu I, Wang H, Huso D, Wahl RL. Optimal definition of biological tumor volume using positron emission tomography in an animal model. EJNMMI Res. 2015;5:58. [DOI] [PMC free article] [PubMed] [Google Scholar]
- 25.Cho SY, Lipson EJ, Im HJ, et al. Prediction of response to immune checkpoint inhibitor therapy using early-time-point 18F-FDG PET/CT imaging in patients with advanced melanoma. J Nucl Med. 2017;58:1421–1428. [DOI] [PMC free article] [PubMed] [Google Scholar]
- 26.Hyun O J, Luber BS, Leal JP, et al. Response to early treatment evaluated with 18F-FDG PET and PERCIST 1.0 predicts survival in patients with Ewing sarcoma family of tumors treated with a monoclonal antibody to the insulinlike growth factor 1 receptor. J Nucl Med. 2016;57:735–740. [DOI] [PMC free article] [PubMed] [Google Scholar]
- 27.Kairemo K, Rohren EM, Anderson PM, et al. Development of sodium fluoride PET response criteria for solid tumours (NAFCIST) in a clinical trial of radium-223 in osteosarcoma: from RECIST to PERCIST to NAFCIST. ESMO Open. 2019;4:e000439. [DOI] [PMC free article] [PubMed] [Google Scholar]
- 28.Kim JE, Chae SY, Kim JH, et al. 3′-deoxy-3′-18F-fluorothymidine and 18F-fluorodeoxyglucose positron emission tomography for the early prediction of response to regorafenib in patients with metastatic colorectal cancer refractory to all standard therapies. Eur J Nucl Med Mol Imaging. 2019;46:1713–1722. [DOI] [PubMed] [Google Scholar]
Associated Data
This section collects any data citations, data availability statements, or supplementary materials included in this article.


