

Abstract
In the United States, chronic viral hepatitis B and C (CHB and CHC), nonalcoholic fatty liver disease (NAFLD), and alcohol‐related liver disease (ALD) are the main causes of liver deaths attributable to hepatocellular carcinoma (HCC) and cirrhosis. Our aim was to assess the changes in the rates of mortality and years of potential life lost (YLL) for HCC and cirrhosis due to different liver diseases. We used multiple‐cause mortality data (2007‐2017) from the National Center for Health Statistics. Annual percentage change (APC) in age‐standardized death rate per 100,000 (ASDR) and age‐standardized years of life lost per 100,000 (ASYLLR) were calculated. In the United States in 2017, there were 2,797,265 deaths with 73,424 liver deaths, contributing to 1,467,742 of YLL. Of the liver deaths, HCC was noted in 12,169 (16.6%) and cirrhosis in 60,111 (82.0%). CHC was responsible for 50.4% of HCC deaths; NAFLD, 35.4%; HBV, 6.0%; ALD, 5.4%; and others, 2.8%. NAFLD was responsible for 48.9% of cirrhosis deaths; ALD, 34.7%; CHC, 12.3%; CHB, 0.9%; and others, 3.2%. Between 2007 and 2017, the increase in ASDR for HCC due to ALD and NAFLD accelerated after 2014 (APC, 11.38% and 6.55%, respectively) whereas CHC stabilized (APC, 0.63%; P = 0.272) after 2011. The increase in ASYLLR of HCC escalated after 2014 for ALD and NAFLD (APC, 12.12% and 6.15%, respectively) and leveled out for CHC after 2012 (APC, −1.05%; P = 0.056). Furthermore, the highest annual increase in ASDR and ASYLLR for cirrhosis was due to ALD (APC, 3.24% and 3.34%, respectively) followed by NAFLD (APC, 1.23% and 0.49%, respectively). Conclusion: Over the past decade, ASDR and ASYLLR due to ALD and NAFLD have been increasing in the United States. The rising burden of HCC and cirrhosis are primarily driven by NAFLD and ALD.
In the United States (U.S.), chronic viral hepatitis B and C (CHB and CHC), non‐alcoholic fatty liver disease (NAFLD) and alcohol‐related liver disease (ALD) are the main causes of liver deaths attributable to hepatocellular carcinoma (HCC) and cirrhosis.Over the past decade, ASDR and ASYLL are increasing in the U.S. The rising burden of HCC and cirrhosis are primarily driven by NAFLD and ALD.
Abbreviations
- AAPC
average annual percentage change
- AIAN
American Indian and Alaskan Native
- ALD
alcoholic liver disease
- APC
annual percentage change
- ASDR
age‐standardized death rate per 100,000
- ASYLLR
age‐standardized years of life lost per 100,000
- CHB
chronic hepatitis B
- CHC
chronic hepatitis C
- CI
confidence interval
- HCC
hepatocellular carcinoma
- ICD
International Classification of Diseases
- NAFLD
nonalcoholic fatty liver disease
- YLL
years of potential life lost
Liver disease is a major cause of morbidity and mortality, with 2 million individuals dying of liver disease each year worldwide.( 1 , 2 , 3 ) The National Center for Health Statistics estimated that liver disease in 2016 was the twelfth leading cause of death worldwide and eighth leading cause of death in the United States.( 2 ) Chronic viral hepatitis B (CHB) and hepatitis C (CHC) infections are the two major causes of liver‐related mortality, but alcohol‐related liver disease (ALD) and nonalcoholic fatty liver diseases (NAFLD) have been increasingly contributing to the burden of liver disease in the United States.( 1 , 3 , 4 ) Although the incidence of CHC has generally decreased, its complications are predicted to increase with the aging baby boomer populations.( 5 ) In contrast, vaccination against hepatitis B and advances in the treatment of both CHB and CHC have potentially reduced the future burden of viral hepatitis in the United States.( 6 ) Despite these reductions in viral hepatitis, death rates due to cirrhosis and hepatocellular carcinoma (HCC) have been predicted to increase in the United States by 2030.( 1 , 6 ) In fact, from 2000 to 2016, deaths from liver cancer increased 43% from 10.5 deaths per 100,000 to 15 deaths per 100,000.( 2 ) It is important to note that there is considerable heterogeneity in the rates of liver cancer in the United States based on geographic location and race.( 7 ) Given the potential shifts from chronic viral hepatitis to NAFLD as the most common cause of liver disease in the United States, the impact on liver‐related mortality from different liver diseases needs to be reassessed.
Previous epidemiologic studies have evaluated trends in liver disease mortality in the United States( 6 ); however, results might have underestimated the etiologic burden of liver deaths by failing to account for missing etiologies in the national mortality database. Moreover, no prior study had accessed the burden of premature death due to liver diseases. Therefore, our aim was to use national mortality data to assess trends in deaths and YLL for HCC and cirrhosis due to different liver diseases over the last decade.
Materials and Methods
Data Sources
We examined the U.S. multiple cause‐of‐death mortality data from the National Vital Statistics System of the National Center for Health Statistics, Centers for Disease Control and Prevention, with 2007‐2017 data obtained from the public‐use multiple cause of death files.( 8 ) Causes of death were coded according to the International Classification of Diseases (ICD) codes in use at the time of death.( 9 ) More than 99% of deaths in the United States are captured by this database.( 10 ) The underlying cause of death is defined by the World Health Organization as “the disease or injury which initiated the train of events leading directly to death, or the circumstances of the accident or violence which produced the fatal injury.”
To overcome misclassification and underestimation of the underlying cause of death abstracted from death certificates,( 11 ) we used the following coding algorithm: We identified decedents having ICD‐10 codes for cirrhosis, HCC, ALD, CHB, CHC, NAFLD, and other liver diseases (autoimmune hepatitis, hemochromatosis, iron overload, Wilson’s disease, cholangitis, biliary cirrhosis, alpha‐1‐antitrypsin deficiency, Budd‐Chiari syndrome, hepatic failure, liver disorder, and drug injury) as the underlying cause of death. Of these, decedents with HCC as an underlying or contributing cause of death were defined as “HCC deaths”; decedents with cirrhosis or complications of cirrhosis as the underlying or contributing cause of death were defined as “cirrhosis deaths”; and a remaining “other liver deaths” encompassed residual causes, including acute liver failure, cholangitis, and posttransplant liver failure. Among decedents with HCC and cirrhosis, NAFLD, CHC, CHB, and ALD were defined by ICD‐10 codes. Because NAFLD is typically undercoded in clinical practice (ICD‐10 codes K76.0 and K75.81), we presumed that NAFLD deaths also included those individuals who were coded for cryptogenic liver disease (K76.9 and K74.6), including cirrhosis in the absence of any other causes of chronic liver diseases or excessive alcohol use. The ICD‐10 codes used are provided in Supporting Table S1; a flow diagram is shown in Supporting Fig. S1.
Sociodemographic variables included age at the time of death, sex, race, marital status, and college degree. Hispanic and Asians were further categorized into the three and six largest ethnic groups represented in the 2010 U.S. census (including Asian‐Pacific Islanders).( 12 )
Statistical Methods
Age‐specific rates for liver deaths were calculated by sex and race/ethnicity from the Survey of Epidemiology and End Results for 2007‐2017 based on the corresponding population estimates and adjusted for population shifts due to hurricanes Katrina and Rita.( 13 ) For Hispanic‐ and Asian‐American subgroups in noncensus years, population sizes in each year were estimated by linear interpolation (2008‐2009), U.S. census data (2010), and extrapolation (2011‐2017), using the 2000 and 2010 U.S. census reports.( 14 ) To understand the burden of premature deaths, years of potential life lost (YLL) were estimated by multiplying the number of deaths with the standard life expectancy at the age at which death occurs.( 15 ) Age‐standardized death rate per 100,000 (ASDR) and age‐standardized years of life lost per 100,000 (ASYLLR) with 95% confidence intervals (CIs) were then calculated by using the direct method based on the census 2000 standard population by 10‐year age groups.
Temporal trends were analyzed by the Joinpoint regression model using the National Cancer Institute’s software.( 16 ) A maximum number of two joinpoints were allowed, and the modified Bayes information criterion( 17 ) was used for model selection. From the selected models, the annual percentage change (APC) for each trend segment and the average annual percentage change (AAPC) for the entire period were reported with 95% CIs. An increasing or decreasing trend was defined if the APC or AAPC was significantly different from 0; otherwise, a stable or level trend was defined. A test for parallelism was used for comparing the trends across groups.
Data Imputation for Unknown Etiology
In 2017, 54.0% and 9.8% of HCC and cirrhosis etiologies were not reported due to the limitation of this data base. Decedents with unknown etiologies were more likely to be older, black, Asian, married, and have a college degree, and less likely to have abused alcohol. Estimates of the etiological contribution using the complete case analysis (restricting the analysis to include only decedents with known etiology) will be biased and the direction of the bias unpredictable (Supporting Table S2). Under missing at random assumption (MAR), a multiple imputation approach using the full conditional specification (FCS) imputation method( 18 ) was adopted to account for unknown etiologies and to estimate the contribution of different liver disease on liver deaths for each year. For imputing unknown etiologies, we considered the following eight etiologies: 1) NAFLD; 2) HCV without HBV or ALD; 3) HBV without HCV or ALD; 4) ALD without HCV or HBV; 5) HCV with ALD without HBV; 6) HBV with ALD without HCV; 7) HCV with HBV or HCV with HBV and ALD; 8) others encompassing residual causes. All variables in Supporting Table S2 that could help make the missing at random assumption plausible were included in the imputation model. The five imputed data sets were created by using the Markov Chain Monte Carlo( 19 ) and FCS imputation methods,( 18 ) as recommended by the Healthcare Cost and Utilization Project. For each imputed data set, eight etiologies were categorized into five etiologies (NAFLD, CHC, CHB, ALD, and others) where decedents with both CHC and CHB were excluded for maintaining a mono‐etiology, decedents with CHC and ALD were categorized into CHC etiology, and decedents with CHB and ALD were categorized into CHB etiology. After the etiological contributions were computed separately on each imputed data set, the estimates of contributions from all imputed data sets were combined into a single estimate using Rubin's rule.( 20 ) All analyses were performed with SAS software, version 9.4 (SAS Institute, Cary, NC).
Results
In 2017, there were 2,797,265 registered deaths in the United States, with 73,424 liver deaths; this contributed to 1,467,742 YLL. In contrast, in 2007, there were 2,398,800 deaths in the United States, with 54,861 liver deaths and 1,205,868 YLL. Of those who died by liver diseases in 2017, approximately 76.5% were 55 years or older, 70.6% were non‐Hispanic white, and 63.5% were male individuals.
Burden of Liver Deaths Related to Hepatocellular Carcinoma and Cirrhosis in 2017
Among liver deaths in 2017, HCC was noted in 12,169 (16.6%) and cirrhosis was noted in 60,111 (82.0%), contributing to 200,300 and 1,211,975 of YLL, respectively. Compared to decedents with cirrhosis, those with HCC were older, more commonly male individuals, and non‐Hispanic black (Table 1).
Table 1.
Characteristics of Decedents With HCC or Cirrhosis in the United States, 2017*
| All | HCC | Cirrhosis | No Cirrhosis or HCC | |
|---|---|---|---|---|
| Number of decedents | 73,424 | 12,169 | 60,111 | 1,144 |
| Age (years), mean ± SD | 63.12 ± 13.00 | 66.96 ± 10.65 | 62.21 ± 13.17 | 70.01 ± 16.75 |
| Age (years), % | ||||
| 0‐44 | 5,346 (7.28%) | 193 (1.59%) | 5,070 (8.43%) | 83 (7.26%) |
| 45‐54 | 11,880 (16.18%) | 876 (7.20%) | 10,892 (18.12%) | 112 (9.79%) |
| 55‐64 | 23,798 (32.41%) | 4,297 (35.31%) | 19,308 (32.12%) | 193 (16.87%) |
| 65‐74 | 18,511 (25.21%) | 3,983 (32.73%) | 14,268 (23.74%) | 260 (22.73%) |
| ≥75 | 13,889 (18.92%) | 2,820 (23.17%) | 10,573 (17.59%) | 496 (43.36%) |
| Male | 46,619 (63.49%) | 9,512 (78.17%) | 36,531 (60.77%) | 576 (50.35%) |
| Race | ||||
| non‐Hispanic white | 51,809 (70.56%) | 7,513 (61.74%) | 43,447 (72.28%) | 849 (74.21%) |
| non‐Hispanic black | 7,220 (9.83%) | 1,857 (15.26%) | 5,222 (8.69%) | 141 (12.33%) |
| Hispanic | 10,469 (14.26%) | 1,784 (14.66%) | 8,596 (14.30%) | 89 (7.78%) |
| non‐Hispanic Asian‐Pacific Islander | 2,125 (2.89%) | 813 (6.68%) | 1,255 (2.09%) | 57 (4.98%) |
| non‐Hispanic AIAN | 1,482 (2.02%) | 147 (1.21%) | 1,327 (2.21%) | 8 (0.70%) |
| Married | 29,966 (41.39%) | 5,940 (49.55%) | 23,558 (39.75%) | 468 (41.12%) |
| College | 14,931 (24.30%) | 2,342 (22.86%) | 12,306 (24.51%) | 283 (28.41%) |
| Contributing causes of deaths † | ||||
| Cardiovascular disease | 18,775 (25.57%) | 2,580 (21.20%) | 15,757 (26.21%) | 438 (38.29%) |
| Non‐liver cancer | 24,269 (33.05%) | 1,223 (10.05%) | 23,040 (38.33%) | 6 (0.52%) |
| Renal disease | 2,381 (3.24%) | 1,019 (8.37%) | 1,284 (2.14%) | 78 (6.82%) |
| Hypertension | 6,012 (8.19%) | 519 (4.26%) | 5,464 (9.09%) | 29 (2.53%) |
| Diabetes | 5,164 (7.03%) | 969 (7.96%) | 4,086 (6.80%) | 109 (9.53%) |
| Lung disease | 5,047 (6.87%) | 970 (7.97%) | 4,003 (6.66%) | 74 (6.47%) |
| Neurological | 3,884 (5.29%) | 635 (5.22%) | 3,196 (5.32%) | 53 (4.63%) |
Decedents with a liver disease as an underlying cause of death were included. All values are displayed as count (%) except where otherwise noted.
Because a decedent can have multiple contributing causes of death, a decedent can be counted in more than one group.
(Source: Centers for Disease Control and Prevention, National Center for Health Statistics, National Vital Statistics System. Mortality Data. https://www.cdc.gov/nchs/nvss/deaths.htm. Updated January 2020. Accessed February 19, 2020).
In 2017, male‐to‐female ratios for ASDR and ASYLLR attributable to HCC were 4.09 and 3.51, respectively, while those attributable to cirrhosis were 1.72 and 1.41, respectively. Age‐specific HCC and cirrhosis death rates increased by age, while the highest YLL was observed in those 55‐64 years. Non‐Hispanic whites accounted for 71% of liver deaths in 2017, followed by Hispanic (14.3%), non‐Hispanic black (9.8%), Asian (2.9%), and non‐Hispanic American Indian and Alaskan Native (AIAN) (2.0%). However, the highest ASDR and ASYLLR for HCC and cirrhosis were observed in non‐Hispanic AIAN (Tables 1 and 2).
Table 2.
ASDR AND ASYLLR Attributable to HCC and Cirrhosis by Sex, Age Group, and Race/Ethnicity for the United States, 2017
| Characteristics | HCC | Cirrhosis | ||
|---|---|---|---|---|
| Deaths (ASDR) | YLL × 103 (ASYLLR) | Deaths (ASDR) | YLL × 103 (ASYLLR) | |
| Overall | 12,169 (2.96) | 202.25 (48.83) | 60,111 (15.68) | 1,246.45 (338.97) |
| Sex | ||||
| Female | 2,657 (1.22) | 46.92 (22.34) | 23,580 (11.7) | 517.11 (275.25) |
| Male | 9,512 (4.99) | 155.33 (78.34) | 36,531 (20.11) | 729.35 (407.52) |
| Age (years)* | ||||
| 0‐44 | 193 (0.1) | 12.27 (6.46) | 5,070 (2.67) | 228.71 (120.41) |
| 45‐54 | 876 (2.02) | 24.24 (56.38) | 10,892 (25.33) | 316.99 (737.32) |
| 55‐64 | 4,297 (9.98) | 88.16 (205.64) | 19,308 (45.04) | 415.13 (968.31) |
| 65‐74 | 3,983 (13.54) | 57.35 (195.61) | 14,268 (48.67) | 208.66 (711.74) |
| ≥75 | 2,820 (13.57) | 20.23 (97.79) | 10,573 (51.12) | 76.96 (372.06) |
| Race/ethnicity | ||||
| non‐Hispanic white | 7,513 (2.44) | 118.53 (39.28) | 43,447 (15.97) | 869.8 (350.18) |
| non‐Hispanic black | 1,857 (4.15) | 34.11 (72.78) | 5,222 (12.08) | 117.45 (263.59) |
| Hispanic | 1,784 (4.64) | 32.18 (72.43) | 8,596 (20.65) | 189.9 (398.92) |
| non‐Hispanic AIAN | 147 (5.51) | 2.5 (84.49) | 1,327 (50.71) | 39.22 (1,482.81) |
| non‐Hispanic Asian‐Pacific Islander | 813 (4.41) | 14 (68.72) | 1,255 (6.89) | 24.67 (121.27) |
| Subrace group | ||||
| Hispanic | ||||
| Mexican | 1,087 (5.53) | 19.49 (84.88) | 5,350 (24.21) | 120.43 (455.9) |
| Puerto Rican | 243 (6.18) | 4.07 (94.22) | 868 (21.58) | 17.4 (391.26) |
| Cuban | 43 (1.6) | 0.63 (25.04) | 268 (10.31) | 4.39 (180.22) |
| non‐Hispanic Asian‐Pacific Islander | ||||
| Indian | 46 (2.29) | 1.23 (38.56) | 210 (8.94) | 4.52 (150.81) |
| Chinese | 170 (4.02) | 2.91 (65.77) | 163 (3.99) | 2.79 (63.58) |
| Filipino | 106 (3.39) | 1.57 (45.84) | 156 (5.02) | 2.48 (73.35) |
| Korea | 82 (4.89) | 1.49 (80.34) | 91 (5.81) | 2.11 (114.72) |
| Japanese | 70 (4.22) | 0.76 (51.9) | 121 (8.22) | 1.57 (141.26) |
| Vietnamese | 167 (11.07) | 2.68 (151.24) | 159 (10.25) | 2.96 (159.62) |
Age standardization is based on the direct method to the census 2000 population by 10‐year age groups.
(Source: Centers for Disease Control and Prevention, National Center for Health Statistics, National Vital Statistics System. Mortality Data. https://www.cdc.gov/nchs/nvss/deaths.htm. Updated January 2020. Accessed February 19, 2020).
Temporal Trends Between 2007 and 2017
Between 2007 and 2017, there was a 64% increase in HCC deaths and a 29% increase in cirrhosis deaths, leading to an increase of 47% and 18% in YLL, respectively. Furthermore, the ASDR and ASYLLR annually increased from 2.3 to 2.96 (AAPC, 2.07%; 95% CI, 1.54‐2.60) and 42.15 to 48.83 (AAPC, 1.23%; 95% CI, 0.77‐1.69), respectively, for HCC; and from 14.56 to 15.68 (AAPC, 0.78%; 95% CI 95%, 0.36‐1.19) and 329.59 to 338.97 (AAPC, 0.35%; 95% CI, 0.01‐0.71), respectively, for cirrhosis (Supporting Tables S3‐S8).
For male individuals, the ASDR for HCC and cirrhosis increased by 29% and 3%, whereas for female individuals, these increases were 26% and 17%, respectively. In fact, analysis of ASDR by sex showed that male and female individuals experienced different trends for cirrhosis (a test for parallelism, P = 0.002) but not for HCC (P = 0.100).
Significant and substantial inclines in the ASDR for HCC were observed across all races except Asians (AAPC, −2.18%), whereas non‐Hispanic white and non‐Hispanic AIAN were the only races with a significant increase of ASDR for cirrhosis and ASYLLR for HCC and cirrhosis (Fig. 1; Supporting Tables S5‐S8).
Fig. 1.
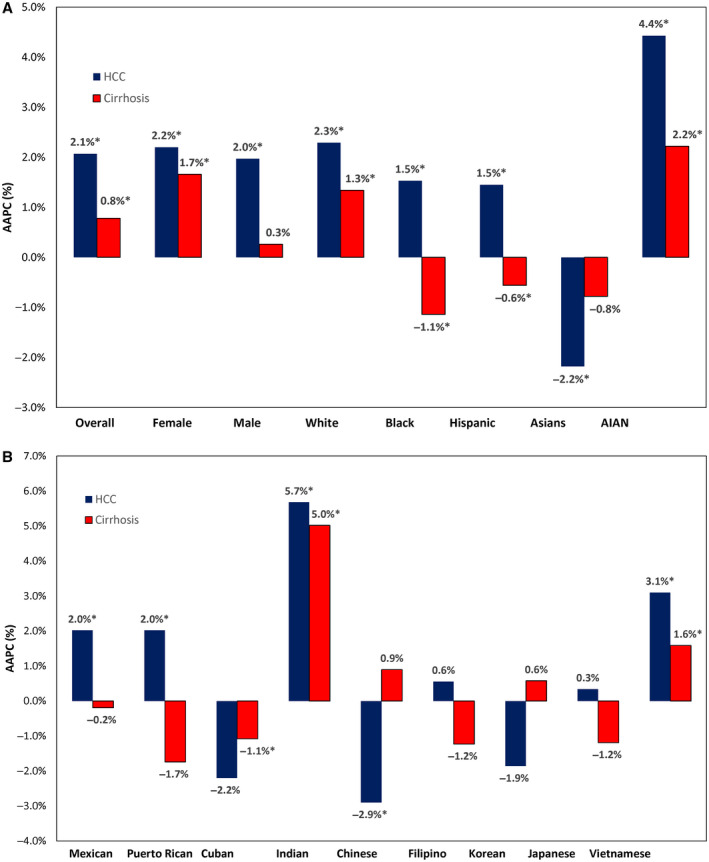
Trend in mortality attributable to HCC and cirrhosis, 2007‐2017. Trends are shown by (A) sex and race/ethnicity and (B) subrace groups.
HCC Death by Etiology of Liver Disease Based on Multiple Imputation
Characteristics of decedents with HCC and cirrhosis due to a common cause of liver disease are shown in Table 3. In 2017, decedents with HCC due to NAFLD were more likely to be older (70.3 years), non‐Hispanic white (70.5%), and with higher cardiovascular disease (23.2%) (Table 3). Decedents with HCC due to ALD tended to be younger (64.6 years), male individuals (88.5%), and with higher comorbidities. The ASDR for HCC ranged from 1.44 for CHC to 1.07 for NAFLD to 0.19 for CHB, whereas the ASYLLR for HCC ranged from 26.1 for CHC to 14.76 for NAFLD to 3.71 for CHB. Between 2007 and 2017, the ASDR and ASYLLR of HCC increased for all etiologies except CHB. The highest average annual increase in ASDR was due to ALD (AAPC, 6.52%), followed by NAFLD (AAPC, 2.99%) and CHC (AAPC, 2.27%) (Fig. 2; Table 4). Joinpoint analysis showed that the increase in ASDR for HCC due to ALD and NAFLD accelerated after 2014 (APC, 11.38% and 6.55% in the 2014‐2017 period), whereas CHC stabilized (APC, 0.63%; P = 0.272) after an increasing trend in the 2007‐2011 period (APC, 4.78%). Similar to the findings in ASDR, the increase in ASYLLR escalated after 2014 for ALD and NAFLD (APC, 12.12% and 6.15%, respectively, in the 2014‐2017 period) and leveled out for CHC after 2012 (APC, −1.05%; P = 0.056) (Fig. 2; Table 4). The contribution of different etiologies to HCC deaths varied markedly across sex, age, and race/ethnicity. In 2017, CHC was responsible for 50.4% of HCC deaths; NAFLD, 35.4%; HBV, 6.0%; ALD, 5.4%; and others, 2.8% (Fig. 3A). NAFLD was the most common cause of HCC deaths in female individuals (42.3%), aged 75 years and over (55.3%), and Hispanic (42.4%), while the least common in male individuals (33.5%), aged less than 45 years (14.3%), and Asian‐Pacific Islanders (9.1%). Across race/ethnicity, the contribution of HCC deaths was highest in non‐Hispanic black for CHC (72.5%); Asians for CHB (74.8%); and Hispanic and non‐Hispanic AIAN for ALD (9.2% and 9.5%, respectively).
Table 3.
Characteristics of Decedents With Cirrhosis or HCC Deaths by Etiology in the Unites States, 2017, by Multiple Imputation
| HCC* | Cirrhosis* | |||||||
|---|---|---|---|---|---|---|---|---|
| NAFLD | CHC | CHB | ALD | NAFLD | CHC | CHB | ALD | |
| Number of decedents† | 4,291 | 6,099 | 727 | 648 | 29,281 | 7,385 | 564 | 20,782 |
| Age in years, mean (SE) | 70.27 (0.19) | 64.89 (0.14) | 65.48 (0.52) | 64.62 (0.38) | 66.13 (0.08) | 60.74 (0.14) | 64.44 (0.65) | 56.78 (0.08) |
| Age, % | ||||||||
| 0‐44 | 0.63 (0.15) | 1.50 (0.17) | 7.62 (0.99) | 2.01 (0.55) | 5.22 (0.14) | 4.97 (0.29) | 9.43 (1.23) | 14.22 (0.24) |
| 45‐54 | 4.74 (0.36) | 7.77 (0.37) | 13.38 (1.27) | 11.91 (1.28) | 12.72 (0.20) | 18.30 (0.45) | 16.05 (1.55) | 26.28 (0.31) |
| 55‐64 | 26.22 (0.80) | 43.39 (0.76) | 23.48 (1.58) | 37.32 (1.92) | 27.21 (0.26) | 45.93 (0.59) | 24.34 (1.82) | 35.31 (0.33) |
| 65‐74 | 33.84 (0.93) | 32.47 (0.71) | 28.68 (1.70) | 32.51 (1.86) | 27.96 (0.26) | 22.17 (0.49) | 22.71 (1.77) | 17.96 (0.27) |
| ≥75 | 34.57 (0.83) | 14.87 (0.50) | 26.84 (1.66) | 16.26 (1.46) | 26.89 (0.26) | 8.63 (0.38) | 27.46 (1.88) | 6.23 (0.17) |
| Male, % | 73.90 (0.76) | 80.31 (0.59) | 78.45 (1.54) | 88.25 (1.27) | 54.67 (0.29) | 65.44 (0.57) | 64.10 (2.02) | 69.15 (0.32) |
| Race, % | ||||||||
| non‐Hispanic white | 70.46 (1.22) | 61.40 (0.91) | 7.57 (1.00) | 61.07 (1.93) | 75.09 (0.27) | 64.47 (0.61) | 34.98 (2.01) | 71.80 (0.31) |
| non‐Hispanic black | 8.60 (0.70) | 21.88 (0.64) | 7.16 (0.99) | 8.42 (1.11) | 8.25 (0.17) | 14.14 (0.45) | 8.47 (1.17) | 7.19 (0.18) |
| Hispanic | 17.61 (0.71) | 13.29 (0.56) | 1.98 (0.57) | 25.29 (1.72) | 13.15 (0.20) | 17.20 (0.45) | 5.39 (0.96) | 15.57 (0.25) |
| non‐Hispanic Asian‐Pacific Islander | 1.71 (0.20) | 1.68 (0.17) | 82.96 (1.41) | 2.62 (0.63) | 1.75 (0.08) | 1.61 (0.15) | 50.11 (2.11) | 1.39 (0.08) |
| non‐Hispanic AIAN | 1.19 (0.26) | 1.25 (0.20) | 0.14 (0.14) | 2.16 (0.57) | 1.47 (0.07) | 1.74 (0.16) | 0.53 (0.31) | 3.57 (0.13) |
| Married, % | 54.13 (1.02) | 44.07 (0.83) | 62.29 (1.85) | 49.06 (2.04) | 44.09 (0.29) | 31.95 (0.55) | 45.39 (2.10) | 35.47 (0.33) |
| College, % | 25.72 (1.39) | 18.65 (0.76) | 36.39 (1.99) | 20.74 (1.83) | 25.17 (0.28) | 13.98 (0.58) | 28.99 (2.07) | 27.20 (0.32) |
| Contributing causes of deaths‡, % | ||||||||
| Cardiovascular disease | 23.20 (0.79) | 19.85 (0.61) | 18.80 (1.47) | 20.85 (1.61) | 27.13 (0.26) | 28.11 (0.54) | 30.30 (1.96) | 23.72 (0.30) |
| Alcohol abuse | 0.00 (0.00) | 9.06 (0.38) | 1.65 (0.47) | 100.00 (0.00) | 0.00 (0.00) | 28.54 (0.53) | 15.02 (1.51) | 100.00 (0.00) |
| Non‐liver cancer | 6.87 (0.43) | 9.44 (0.38) | 9.03 (1.07) | 8.76 (1.12) | 2.35 (0.09) | 2.39 (0.19) | 5.17 (0.94) | 1.34 (0.08) |
| Renal disease | 5.26 (0.47) | 3.43 (0.28) | 3.66 (0.70) | 5.86 (0.92) | 10.54 (0.18) | 8.51 (0.35) | 13.43 (1.44) | 6.67 (0.17) |
| Hypertension | 7.93 (0.53) | 7.57 (0.43) | 6.63 (0.97) | 10.36 (1.21) | 6.07 (0.14) | 9.74 (0.35) | 6.98 (1.08) | 6.79 (0.17) |
| Diabetes | 10.37 (0.50) | 6.19 (0.35) | 6.55 (0.94) | 10.67 (1.22) | 7.44 (0.15) | 9.35 (0.34) | 10.03 (1.28) | 4.50 (0.14) |
| Lung disease | 4.34 (0.41) | 6.10 (0.37) | 2.34 (0.56) | 6.85 (1.01) | 4.53 (0.12) | 7.76 (0.32) | 5.17 (0.94) | 4.71 (0.15) |
| Neurological | 1.36 (0.28) | 1.17 (0.19) | 0.58 (0.29) | 2.37 (0.60) | 2.68 (0.10) | 3.07 (0.21) | 2.66 (0.68) | 3.45 (0.13) |
All values are displayed as percentage (SE) except where otherwise noted.
Average values over the five imputed data set.
Because a decedent can have multiple contributing causes of death, a decedent can be counted in more than one group.
(Source: Centers for Disease Control and Prevention, National Center for Health Statistics, National Vital Statistics System. Mortality Data. https://www.cdc.gov/nchs/nvss/deaths.htm. Updated January 2020. Accessed February 19, 2020).
Fig. 2.
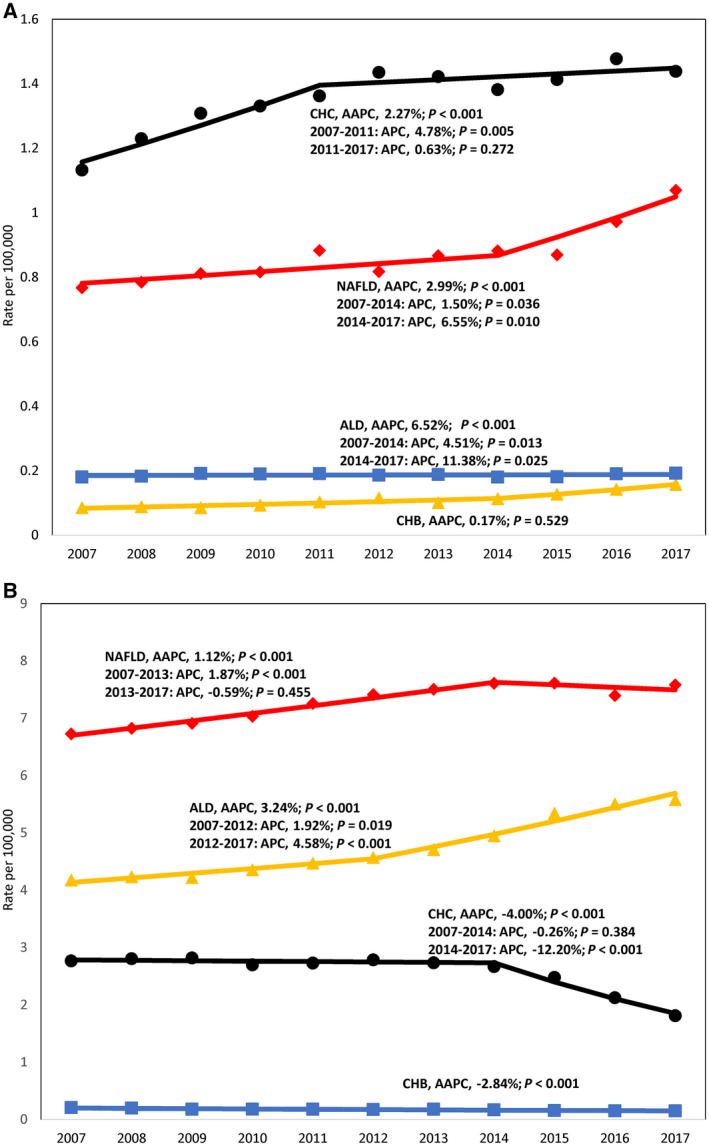
Trends in ASDR in the United States, 2007‐2017, based on multiple imputation. Trends for (A) HCC and (B) cirrhosis due to NAFLD, CHC, CHB, and ALD.
Table 4.
Trends in ASDR and ASYLLR For HCC and Cirrhosis by Etiology in the United States, 2007‐2017, by Multiple Imputation
| ASDR (95% CI) | Average APC (95% CI) | Trend 1 | Trend 2 | ||||
|---|---|---|---|---|---|---|---|
| 2007 | 2017 | Years | APC ( 95% CI) | Years | APC ( 95% CI) | ||
| ASDR for HCC | |||||||
| NAFLD | 0.77 (0.73‐0.81) | 1.07 (1.03‐1.11) | 2.99* (1.71‐4.29) | 2007‐2014 | 1.50* (0.13‐2.89) | 2014‐2017 | 6.55* (2.23‐11.05) |
| CHC | 1.13 (1.09‐1.18) | 1.44 (1.40‐1.48) | 2.27* (1.21‐3.34) | 2007‐2011 | 4.78* (2.07‐7.57) | 2011‐2017 | 0.63 (−0.64‐1.92) |
| CHB | 0.18 (0.17‐0.20) | 0.19 (0.18‐0.21) | 0.17 (−0.41‐0.75) | ||||
| ALD | 0.09 (0.08‐0.10) | 0.16 (0.15‐0.17) | 6.52* (3.63‐9.50) | 2007‐2014 | 4.51* (1.31‐7.81) | 2014‐2017 | 11.38* (1.90‐21.74) |
| ASYLLR for HCC | |||||||
| NAFLD | 11.2 (10.32‐12.08) | 14.76 (14.42‐15.10) | 2.43* (1.48‐3.38) | 2007‐2014 | 0.87 (−0.17‐1.92) | 2014‐2017 | 6.15* (2.99‐9.40) |
| CHC | 23.57 (22.76‐24.39) | 26.1 (25.62‐26.58) | 1.05* (0.34‐1.78) | 2007‐2012 | 3.20* (1.76‐4.66) | 2012‐2017 | −1.05 (−2.13‐0.04) |
| CHB | 3.61 (3.24‐3.98) | 3.71 (3.47‐3.94) | −0.65 (−1.73‐0.44) | ||||
| ALD | 1.62 (1.54‐1.70) | 2.77 (2.70‐2.84) | 5.81* (3.22‐8.47) | 2007‐2014 | 3.62* (0.52‐6.81) | 2014‐2017 | 11.12* (3.10‐19.77) |
| ASDR for cirrhosis | |||||||
| NAFLD | 6.73 (6.63‐6.82) | 7.58 (7.49‐7.68) | 1.12* (0.59‐1.66) | 2007‐2014 | 1.87* (1.33‐2.40) | 2014‐2017 | −0.59 (−2.38‐1.23) |
| CHC | 2.77 (2.71‐2.83) | 1.81 (1.77‐1.86) | −4.00* (−4.73 to −3.27) | 2007‐2014 | −0.26 (−0.94‐0.42) | 2014‐2017 | −12.20* (−14.57 to −9.76) |
| CHB | 0.21 (0.19‐0.22) | 0.15 (0.14‐0.16) | −2.84* (−3.52 to −2.15) | ||||
| ALD | 4.18 (4.11‐4.25) | 5.58 (5.50‐5.66) | 3.24* (2.44‐4.05) | 2007‐2012 | 1.92* (0.44‐3.42) | 2012‐2017 | 4.58* (3.23‐5.95) |
| ASYLLR for cirrhosis | |||||||
| NAFLD | 131.98 (130.87‐133.10) | 138.99 (137.88‐140.11) | 0.49 (−0.10‐1.07) | 2007‐2013 | 1.58* (0.71‐2.46) | 2013‐2017 | −1.13 (−2.38‐0.14) |
| CHC | 69.67 (68.59‐70.75) | 39.78 (39.12‐40.43) | −5.08* (−5.57 to −4.58) | 2007‐2014 | −1.43* (−1.98 to −0.88) | 2014‐2017 | −13.07* (−14.56 to −11.55) |
| CHB | 4.66 (4.55‐4.76) | 3.16 (3.10‐3.23) | −3.65* (−5.11 to −2.16) | 2007‐2010 | −6.14* (−11.18 to −0.82) | 2010‐2017 | −2.56* (−3.89 to −1.21) |
| ALD | 107.39 (107.03‐107.76) | 145.02 (144.61‐145.43) | 3.34* (2.54‐4.13) | 2007‐2012 | 1.99* (0.54‐3.46) | 2012‐2017 | 4.70* (3.36‐6.05) |
Significantly different from 0%.
(Source: Centers for Disease Control and Prevention, National Center for Health Statistics, National Vital Statistics System. Mortality Data. https://www.cdc.gov/nchs/nvss/deaths.htm. Updated January 2020. Accessed February 19, 2020).
Fig. 3.
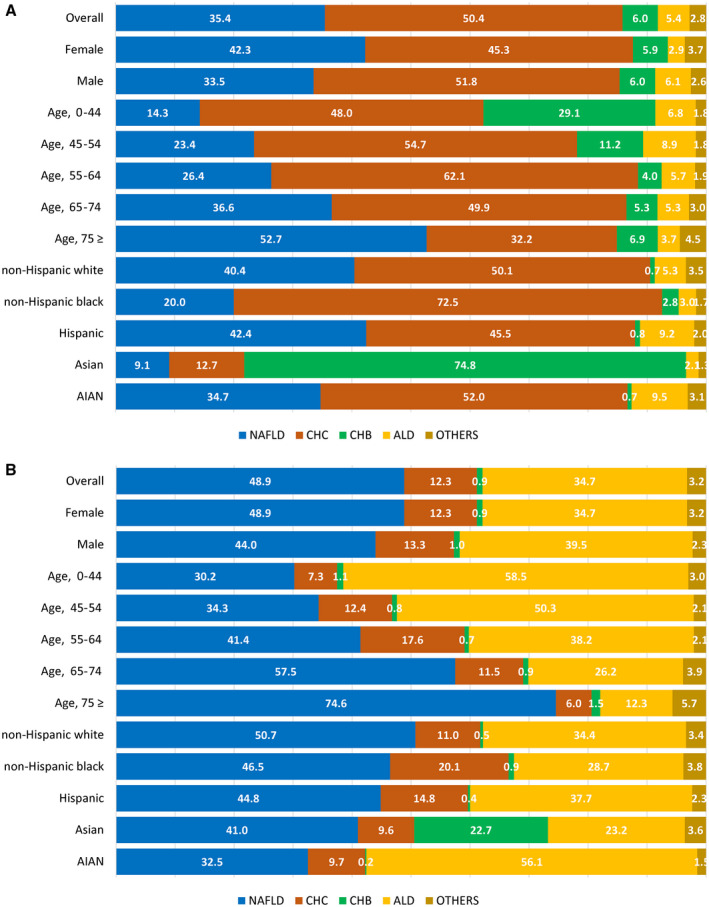
Contribution of different liver diseases on absolute deaths by sex, age, and race/ethnicity in the United States for 2017 based on multiple imputation. (A) HCC and (B) cirrhosis.
Cirrhosis Death by Etiology of Liver Disease Based on Multiple Imputation
In 2017, decedents with cirrhosis due to NAFLD were more likely to be older (66.1 years) and non‐Hispanic white (75.1%), whereas those due to ALD were likely to be younger (56.8 years), Hispanic (15.6%), and non‐Hispanic AIAN (3.6%) (Table 3). The ASDR for cirrhosis ranged from 7.58 for NAFLD to 5.58 for ALD to 1.81 for CHC, whereas the ASYLLR for cirrhosis ranged from 145.02 for ALD to 138.99 for NAFLD to 39.78 for CHC. Within the study period, the ASDR for cirrhosis due to NAFLD and ALD increased whereas these rates decreased for CHC and CHB (Fig. 2; Table 4). The highest annual increase in ASDR and ASYLLR was due to ALD (AAPC, 3.24% and 3.34%, respectively), followed by NAFLD (AAPC, 1.23% and 0.49%, respectively). We also found that a decreasing trend of ASDR and ASYLLR for cirrhosis due to CHC decreased even faster after 2014 (APC, −12.2% and −13.07%, respectively). In 2017, NAFLD was responsible for 48.9% of cirrhosis deaths; ALD, 34.7%; CHC, 12.3%; CHB, 0.9%; and others, 3.2% (Fig. 3B). NAFLD was the most common cause of cirrhosis deaths in female individuals (48.9%), aged 75 years and over (74.6%), and non‐Hispanic white (50.7%) but the least common in male individuals (44.0%), aged less than 45 years (30.2%), and non‐Hispanic AIAN (32.5%). Across race/ethnicity, the contribution of cirrhosis deaths was highest in non‐Hispanic black for CHC (20.1%); Asian‐Pacific Islanders for CHB (22.7%); and non‐Hispanic AIAN for ALD (56.1%).
As expected, estimates of ASDR and ASYLLR from multiple imputed data helped to correct the underestimation of the etiological burden possibly caused by a complete case analysis, while demographics, comorbidities, and temporal trends in liver diseases were consistent between multiple imputation analysis and complete case analysis (Supporting Tables S9‐S10).
Discussion
This population‐based study from the United States highlights changes in liver‐related deaths due to cirrhosis and HCC between 2007 and 2017. Using 11 years of nationally representative mortality data, this analysis revealed that the death rates and YLL have been increasing over the past decade. In addition, there are differences in liver‐related mortality according to the etiology of underlying liver disease and demographic variables. In this context, our study showed that both ASDR and ASYLLR for liver deaths due to either NAFLD or ALD have been on the rise, whereas the same variables due to CHC and CHB have been stable or declining.
Important findings of this study are the changes in the burden of HCC and cirrhosis among all deaths due to liver disease as well as the type of liver disease that may be responsible for these changes. From 2007 to 2017, the contribution of HCC to liver‐related mortality increased from 13.5% to 16.6% whereas the contribution of cirrhosis to liver mortality decreased from 85.0% to 81.9%. From the standpoint of the underlying etiology of liver disease, an increase was noted for NAFLD (44.4% to 46.4%) and ALD (25.3% to 30.8%), while the proportions of CHC and CHB decreased over time. Our findings are in agreement with previous studies focusing on the mortality of cirrhosis and HCC and the changing trends in the etiologies of the most common causes of chronic liver disease burden.( 21 , 22 , 23 ) In a study from the Veterans Affairs health care information system (2001‐2014), an increase in HCC cases among patients with cirrhosis was noted with the increases being more pronounced in patients with HCV‐cirrhosis and NAFLD‐cirrhosis compared to ALD‐related cirrhosis.( 22 ) Similarly, our data show that liver deaths from NAFLD have been increasing; in contrast, our data show that death rates due to CHC have declined. This difference in our finding may be explained by the more recent study period when the use of highly effective direct‐acting antiviral (DAA) agents for treatment of CHC has become more common.( 24 ) On the other hand, mortality related to CHB‐associated liver disease seems to be stable or declining. This may indicate the impact of highly effective anti‐HBV drugs and (potentially) vaccination of at‐risk populations.( 25 , 26 )
It is important to place the contribution of NAFLD to liver‐related deaths in the context of the growing global epidemic of obesity and type 2 diabetes. Globally, approximately 2 billion adults are obese or overweight and over 400 million have diabetes, both of which are risk factors for NAFLD and HCC.( 1 , 27 ) These factors as well as the aging population seem to contribute to the rise of NAFLD‐related liver deaths from both cirrhosis and HCC.( 23 , 28 , 29 , 30 ) In our study, for both HCC deaths and cirrhosis deaths, NAFLD had the second highest annual increase in ASDR, only after ALD. Given the increasing prevalence of NAFLD in the general population and lack of highly effective treatment options for this common problem, this finding is crucially important, especially for primary care providers and gastroenterologists, who should be cognizant about the long‐term outcomes and mortality of these conditions in their daily practice.
Similar to NAFLD, the contribution of ALD to the burden of HCC‐related and cirrhosis‐related morbidity and mortality has been worsening. In fact, this study demonstrated that ALD had the highest annual increase in ASDR for both HCC‐related mortality and cirrhosis‐related mortality, and this effect was more pronounced after 2014. In addition, after 2014, there was a decreasing trend of ASDR for cirrhosis due to CHC. These findings suggest a temporal trend shift in the contributions of different etiologies of chronic liver disease to total burden of liver disease in the last decade. These findings are in agreement with reports from different parts of the world, emphasizing the increasing burden of ALD in those populations.( 3 , 31 , 32 , 33 )
Another important finding of the current study is the quantification of YLL due to liver deaths. In this context, between 2007 and 2017, age‐standardized YLL for HCC and cirrhosis increased by 16% and 18%, respectively. In fact, among patients with HCC, ASYLLR increased for all etiologies of liver disease except for CHB. On the other hand, among patients with cirrhosis, ASYLLR increased for NAFLD and ALD while it decreased for CHC and CHB. Interestingly, the decrease in ASYLLR for CHC was even faster after 2014, potentially due to highly effective DAAs.( 24 ) Although our data were limited to the United States, similar data are being reported from other countries. In a study from the United Kingdom (1979‐2015), steady increases in the frequency of HCC due to ALD and NAFLD were reported.( 34 ) Furthermore, since the mid‐1990s, a gradual increase in YLL due to ALD and NAFLD was also noted.( 34 ) Similarly, another study from Italy (1986‐2014) demonstrated that HCC leads to an average of 11.5 YLL for each patient.( 35 ) That study was not able to compare patients with HCC based on the underlying etiology of liver disease but demonstrated that with the recent advances in therapeutic modalities for HCC, patients diagnosed with HCC between 2007 and 2015 had lower YLL compared to HCC patients diagnosed earlier in the study.( 35 )
In this study, we also noticed that male individuals were more likely to suffer from mortality due to cirrhosis and HCC. Male and female individuals had similar ASDR for HCC during the study years (29% and 26%, respectively), but female individuals had a higher ASDR for cirrhosis (3% vs. 17%, respectively). In fact, male predominance in the burden of those conditions is somewhat expected because male sex was shown to be a risk factor for HCC; however, increased ASDR for cirrhosis among female individuals is concerning and needs to be further studied.
Our study is not free of limitations. This study was conducted in the United States where causes of death and mortality data were obtained from death certificates. This approach may be subject to misclassification and underestimation. For this reason, among liver deaths identified by the underlying cause of death, any mention of HCC as an underlying or contributing cause of death was defined as HCC death. Similarly, any mention of cirrhosis or complications of cirrhosis (except for HCC) was defined as cirrhosis death. Nevertheless, given the possibility for these coding errors in both directions, we feel that over time the miscoding balanced out without a net gain or loss of the pertinent data. Also, our extended definition of NAFLD to include the ICD codes for cryptogenic cirrhosis may have led to an overestimation. However, NAFLD defined as the ICD‐10 codes of K76.0 and K75.81 underestimates the true prevalence of NAFLD. Our approach is also validated by the Global Burden of Disease Study 2017,( 36 ) which reported that nonalcoholic steatohepatitis was responsible for 13.2% of HCC deaths and 13.7% of cirrhosis deaths among four etiologies. We also performed sensitivity analyses that showed that trends in mortality due to NAFLD only and a cryptogenic liver disease and cirrhosis both experience a similar increasing trend. Therefore, we believe that our estimates of NAFLD in the United States reflect the true burden of this liver disease. Although the number of missing etiologies was high, we used analytical procedures that take into account missing data for the contribution of different liver diseases, assuming that missing data are missing at random. If the probability of missing still depends on each liver disease even after taking available data into imputation models (missing not at random), our results could still be biased. However, for causes with incomplete data, the provision of an estimate with an adequate measure of uncertainty (standard error) is preferable to the underestimation.
In conclusion, liver diseases remain a major public health challenge in the United States. Since 2007, mortality due to HCC and cirrhosis has been increasing in this country. Although there is a downward trend in liver‐related mortality and YLL data due to viral hepatitis, there are substantial increases related to both NAFLD and ALD. Given the increasing global trends in the epidemiology of these liver diseases, the burden of liver disease is expected to increase. In this context, it is critical that policy makers, providers, payers, and patients focus on developing national policies and multiprong strategies to deal with the burden of liver disease in the United States.
Supporting information
Fig S1
Table S1‐S10
Potential conflict of interest: Dr. Younossi is a consultant to BMS, Gilead, AbbVie, Novo Nordisk, Merck, Quest Diagnostics, Viking, Tern Pharmaceuticals, Siemens, and Intercept. Dr. Alqahtani consults for and received grants from AbbVie, Bristol‐Meyers Squibb, Gilead, Janssen, and Merck. The other authors have nothing to report.
References
- 1. Asrani SK, Devarbhavi H, Eaton J, Kamath PS. Burden of liver diseases in the world. J Hepatol 2019;70:151‐171. [DOI] [PubMed] [Google Scholar]
- 2. Udompap P, Kim D, Kim WR. Current and future burden of chronic nonmalignant liver disease. Clin Gastroenterol Hepatol 2015;13:2031‐2041. [DOI] [PMC free article] [PubMed] [Google Scholar]
- 3. Younossi Z, Henry L. Contribution of alcoholic and nonalcoholic fatty liver disease to the burden of liver‐related morbidity and mortality. Gastroenterology 2016;150:1778‐1785. [DOI] [PubMed] [Google Scholar]
- 4. Trimble G, Zheng L, Mishra A, Kalwaney S, Mir HM, Younossi ZM. Mortality associated with alcohol‐related liver disease. Aliment Pharmacol Ther 2013;38:596‐602. [DOI] [PubMed] [Google Scholar]
- 5. Sayiner M, Wymer M, Golabi P, Ford J, Srishord I, Younossi ZM. Presence of hepatitis C (HCV) infection in baby boomers with Medicare is independently associated with mortality and resource utilisation. Aliment Pharmacol Ther 2016;43:1060‐1068. [DOI] [PubMed] [Google Scholar]
- 6. Tapper EB, Parikh ND. Mortality due to cirrhosis and liver cancer in the United States, 1999‐2016: observational study. BMJ 2018;362:k2817. [DOI] [PMC free article] [PubMed] [Google Scholar]
- 7. Xu J. Trends in liver cancer mortality among adults aged 25 and over in the United States, 2000‐2016. NCHS Data Brief 2018;Jul:1‐8. [PubMed] [Google Scholar]
- 8. Centers for Disease Control and Prevention. National Center for Health Statistics . Mortality multiple cause files. https://www.cdc.gov/nchs/data_access/vitalstatsonline.htm#Mortality_Multiple. Published December 20, 2018. Accessed February 2019.
- 9. Centers for Disease Control and Prevention. National Center for Health Statistics . Datasets and related documentation: methods. https://www.cdc.gov/nchs/nvss/mortality_methods.htm. Published February 13, 2019. Accessed December 2019.
- 10. Centers for Disease Control and Prevention. National Center for Health Statistics . Vital statistics of the United States: mortality, 1999. Technical appendix. https://www.cdc.gov/nchs/data/statab/techap99.pdf. Published July 2004. Accessed December 2019. [Google Scholar]
- 11. German RR, Fink AK, Heron M, Stewart SL, Johnson CJ, Finch JL, et al.; Accuracy of Cancer Mortality Study Group . The accuracy of cancer mortality statistics based on death certificates in the United States. Cancer Epidemiol 2011;35:126‐131. [DOI] [PubMed] [Google Scholar]
- 12. Barnes JS, Bennett CE. The Asian population: 2000 Census 2000 brief. https://www.census.gov/library/publications/2002/dec/c2kbr01-16.html. Published February 2002. Accessed December 2019. [Google Scholar]
- 13. National Cancer Institute. Surveillance, Epidemiology, and End Results Program . Download U.S. population data‐1969‐2018. https://seer.cancer.gov/popdata/download.html. Published December 2019. Accessed January 2019. Accessed December 2019.
- 14. Hoeffel EM, Rastogi S, Kim MO, Shahid H. The Asian population: 2010 2010 census briefs. https://www.census.gov/library/publications/2012/dec/c2010br-11.html. Published March 2012. Accessed December 2019. [Google Scholar]
- 15. Arias E, Xu J. United States life tables, 2015. NVSS 67:1‐63. https://www.cdc.gov/nchs/data/nvsr/nvsr67/nvsr67_07-508.pdf. [PubMed] [Google Scholar]
- 16. National Cancer Institute . Joinpoint trend analysis software. https://surveillance.cancer.gov/joinpoint/. Updated January 2020. Accessed December 2019.
- 17. Zhang NR, Siegmund DO. A modified Bayes information criterion with applications to the analysis of comparative genomic hybridization data. Biometrics 2007;63:22‐32. [DOI] [PubMed] [Google Scholar]
- 18. Berglund P, Heeringa S. Multiple Imputation of Missing Data Using SAS®. Cary, NC: SAS Institute Inc.; 2014. https://support.sas.com/content/dam/SAS/support/en/books/multiple-imputation-of-missing-data-using-sas/65370_excerpt.pdf [Google Scholar]
- 19. Allison PD. Imputation of categorical variables with PROC MI In: SAS Global Forum Proceedings; April 10‐13, 2005, Philadelphia, PA; Paper 113‐130. http://www2.sas.com/proceedings/sugi30/113-30.pdf. [Google Scholar]
- 20. Rubin DB. Multiple Imputation for Nonresponse in Surveys. Hoboken, NJ: John Wiley & Sons, Inc.; 2004. https://market.android.com/details?id=book-bQBtw6rx_mUC. [Google Scholar]
- 21. Kim D, Li AA, Gadiparthi C, Khan MA, Cholankeril G, Glenn JS, et al. Changing trends in etiology‐based annual mortality from chronic liver disease, from 2007 through 2016. Gastroenterology 2018;155:1154‐1163.e3. [DOI] [PMC free article] [PubMed] [Google Scholar]
- 22. Ioannou GN, Green P, Lowy E, Mun EJ, Berry K. Differences in hepatocellular carcinoma risk, predictors and trends over time according to etiology of cirrhosis. PLoS One 2018;13:e0204412. [DOI] [PMC free article] [PubMed] [Google Scholar]
- 23. Estes C, Razavi H, Loomba R, Younossi Z, Sanyal AJ. Modeling the epidemic of nonalcoholic fatty liver disease demonstrates an exponential increase in burden of disease. Hepatology 2018;67:123‐133. [DOI] [PMC free article] [PubMed] [Google Scholar]
- 24. Parrish NF, Feurer ID, Matsuoka LK, Rega SA, Perri R, Alexopoulos SP. The changing face of liver transplantation in the United States: the effect of HCV antiviral eras on transplantation trends and outcomes. Transplant Direct 2019;5:e427. [DOI] [PMC free article] [PubMed] [Google Scholar]
- 25. Bertuccio P, Turati F, Carioli G, Rodriguez T, La Vecchia C , Malvezzi M, et al. Global trends and predictions in hepatocellular carcinoma mortality. J Hepatol 2017;67:302‐309. [DOI] [PubMed] [Google Scholar]
- 26. Trépo C, Chan HL, Lok A. Hepatitis B virus infection. Lancet 2014;384:2053‐2063. [DOI] [PubMed] [Google Scholar]
- 27. Sayiner M, Koenig A, Henry L, Younossi ZM. Epidemiology of nonalcoholic fatty liver disease and nonalcoholic steatohepatitis in the United States and the rest of the world. Clin Liver Dis 2016;20:205‐214. [DOI] [PubMed] [Google Scholar]
- 28. Younossi ZM, Stepanova M, Younossi Y, Golabi P, Mishra A, Rafiq N, et al. Epidemiology of chronic liver diseases in the USA in the past three decades. Gut 2020;69:564‐568. [DOI] [PubMed] [Google Scholar]
- 29. Sayiner M, Golabi P, Younossi ZM. Disease burden of hepatocellular carcinoma: a global perspective. Dig Dis Sci 2019;64:910‐917. [DOI] [PubMed] [Google Scholar]
- 30. Sayiner M, Younossi ZM. Identifying patients at risk from nonalcoholic fatty liver‐related hepatocellular carcinomas. Hepat Oncol 2016;3:101‐103. [DOI] [PMC free article] [PubMed] [Google Scholar]
- 31. Wang WJ, Xiao P, Xu HQ, Niu JQ, Gao YH. Growing burden of alcoholic liver disease in China: a review. World J Gastroenterol 2019;25:1445‐1456. [DOI] [PMC free article] [PubMed] [Google Scholar]
- 32. Wangchuk P. Burden of alcoholic liver disease: Bhutan scenario. Euroasian J Hepatogastroenterol 2018;8:81‐82. [DOI] [PMC free article] [PubMed] [Google Scholar]
- 33. Axley PD, Richardson CT, Singal AK. Epidemiology of alcohol consumption and societal burden of alcoholism and alcoholic liver disease. Clin Liver Dis 2019;23:39‐50. [DOI] [PubMed] [Google Scholar]
- 34. Williams R, Alexander G, Armstrong I, Baker A, Bhala N, Camps‐Walsh G, et al. Disease burden and costs from excess alcohol consumption, obesity, and viral hepatitis: fourth report of the Lancet Standing Commission on Liver Disease in the UK. Lancet 2018;391:1097‐1107. [DOI] [PubMed] [Google Scholar]
- 35. Cucchetti A, Trevisani F, Bucci L, Ravaioli M, Farinati F, Giannini EG, et al.; Italian Liver Cancer Group . Years of life that could be saved from prevention of hepatocellular carcinoma. Aliment Pharmacol Ther 2016;43:814‐824. [DOI] [PubMed] [Google Scholar]
- 36. Global Health Data Exchange . GBD results tool. http://ghdx.healthdata.org/gbd-results-tool. Accessed July 2019.
Associated Data
This section collects any data citations, data availability statements, or supplementary materials included in this article.
Supplementary Materials
Fig S1
Table S1‐S10