

Abstract
With multiple virus epicenters, COVID‐19 has been declared a pandemic by the World Health Organization. Consequently, many countries have implemented different policies to manage this crisis including curfew and lockdown. However, the efficacy of individual policies remains unclear with respect to COVID‐19 case development. We analyzed available data on COVID‐19 cases of eight majorly affected countries, including China, Italy, Iran, Germany, France, Spain, South Korea, and Japan. Growth rates and doubling time of cases were calculated for the first 6 weeks after the initial cases were declared for each respective country and put into context with implemented policies. Although the growth rate of total confirmed COVID‐19 cases in China has decreased, those for Japan have remained constant. For European countries, the growth rate of COVID‐19 cases considerably increased during the second time interval. Interestingly, the rates for Germany, Spain, and France are the highest measured in the second interval and even surpass the numbers in Italy. Although the initial data in Asian countries are encouraging with respect to case development at the initial stage, the opposite is true for European countries. Based on our data, disease management in the 2 weeks following the first reported cases is of utmost importance.
Keywords: coronavirus, COVID‐19, effective, measures, pandemic, spread
1. INTRODUCTION
The current COVID‐19 outbreak with multiple global epicenters has attracted worldwide attention. Thus, with continuously rising numbers of confirmed cases, COVID‐19 has been declared a pandemic on March 11th, 2020 by Tedros Ghebreyesus, the World Health Organization's (WHO) Director‐General. 1 Current knowledge of the biology and transmission of this virus remains limited 2 , 3 and COVID‐19's final mortality rates are subject to rough estimation. International flight traffic has been majorly affected and many countries report increased COVID‐19 numbers. Significant global COVID‐19 epicenters include Italy, France, Spain, Iran, South Korea, Japan, Germany and the initial place of the outbreak, China. So far, different developments regarding growth rates and case numbers have been observed for each respective country as they pass through the initial stages of the outbreak. Although there are different approaches to attain COVID‐19 containment, the goal of reducing interactions between unidentified infected with noninfected individuals remains unchanged.
In a recent study, Wilder‐Smith et al 4 describe these different concepts in detail, ranging from the quarantine of confirmed and possibly infected individuals as implemented in Germany to the declaration of lockdown in Italy, France, and Spain with individual variations. We know from retrospective analysis that travel restrictions can positively impact case development, as observed in past SARS or Ebola outbreaks. 5 , 6 , 7 China's approach in the COVID‐19 outbreak exceeds the classic definition of local confinement, lockdown, and isolation. With increasing implementation of curfew and lockdown measures in Europe, grave concerns in the population are mounting that previous attempts in handling the COVID‐19 spread have been insufficient. 8 , 9
The aim of this study is to evaluate and compare case development, growth rate and doubling time during the initial phase of COVID‐19 exposure for each respective country.
2. MATERIALS AND METHODS
2.1. Data sources
2.1.1. Confirmed cases of COVID‐19
The total number of confirmed COVID‐19 cases for Asia (China, South Korea, and Japan), Europe (Italy, Germany, France, and Spain), and Iran were obtained from the COVID‐19 situation reports made publicly available by the WHO. The present study included data from January 20th, 2020 to March 13th, 2020 as reported by the WHO (see Figure 1). 1
Figure 1.

Cumulative development of COVID‐19 cases in China, South Korea, Japan, Italy, Germany, France, Spain, and Iran according to WHO data. Data for the months of January, February and March and magnification of latest case developments outside of China
2.1.2. Outcome measures and statistical analysis
The first 6 weeks after initial reports of COVID‐19 cases in Italy, France, Spain, Iran, South Korea, Japan, Germany, and China were subject to analysis. This time span of 6 weeks was divided into two intervals: (a) a first 3‐week interval and (b) a second 3‐week interval. We chose an observation period of 6 weeks as most initial worldwide cases occurred within a 6‐week time span (Figure 1).
For these two intervals, we measured the doubling time (d) in days and the corresponding growth rate (g). An exponential growth curve with least squarer regression analysis was estimated for both 3‐week time intervals for each respective each using the following model:
C(x) represents the calculated COVID‐19 cases in total numbers at each time point x based on the current cases C k and the doubling time d in days. The values for x range from 1 to 21 days according to the length of each 3‐week interval. The approximated doubling time of cases is described by d for each time interval. The growth curves were approximated for each interval (see Figure 2A,B). The corresponding growth rate for the same interval was approximated by:
Figure 2.

Cumulative development of COVID‐19 cases in China, South Korea, Japan, Italy, Germany, France, and Spain within the first and second 3‐week intervals. Projections of the calculated exponential growth within both intervals for each respective country
x and x 0 describe the observed time interval and n the amount of days within the interval. Growth curves of total confirmed COVID‐19 case numbers are graphically demonstrated including their individual 95% confidence interval (CI; see Figure 3).
Figure 3.

Growth rates for China, South Korea, Japan, Italy, Germany, France, Spain, and Iran at each time interval (95% CI)
3. RESULTS
3.1. Asia
3.1.1. Growth rate of total confirmed COVID‐19 cases during the first and second 3‐week interval
In Asia, the growth rate of total confirmed COVID‐19 cases in China decreased substantially during the second time interval (0.025, 95% CI: 0.017‐0.033) vs the first‐time interval (0.16, 95% CI: 0.14‐0.18) (Figure 3). The opposite relationship was observed in South Korea. In comparison to the first 3‐week period (0.13, 95% CI: 0.11‐0.15), the growth rate of COVID‐19 cases increased remarkably during the second 3‐week period (0.25, 95% CI: 0.23‐0.27; Figure 3).
In Japan, the growth rate was similar between the first (0.10, 95% CI: 0.078‐0.13) and second 3‐week interval (0.11, 95% CI: 0.099‐0.11; Figure 3).
3.1.2. Doubling time of total confirmed COVID‐19 cases during the first and second 3‐week interval
In China, the doubling time of total confirmed COVID‐19 cases during the second 3‐week interval (27.66, 95% CI: 20.91‐40.51) was markedly higher than that in the first 3‐week interval (4.31, 95% CI: 3.89‐4.79) (Figure 4). In comparison to the first‐time interval (5.51, 95% CI: 4.69‐6.55), the growth rate of COVID‐19 cases in South Korea during the second time interval (2.78, 95% CI: 2.55‐3.04) was considerably lower (Figure 4). The doubling time of COVID‐19 cases in Japan was similar between the first (6.90, 95% CI: 5.53‐8.85) and second‐time interval (6.54, 95% CI: 6.09‐7.03) (Figure 4).
Figure 4.
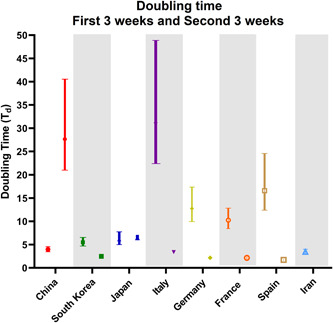
Doubling time of COVID‐19 cases for China, South Korea, Japan, Italy, Germany, France, Spain, and Iran at each time interval (95% CI)
3.2. Europe and Iran
3.2.1. Growth rate of total confirmed COVID‐19 cases during the first and second 3‐week interval
For countries in Europe, the growth rate of COVID‐19 cases increased considerably in the second time interval (Italy: 0.20, 95% CI: 0.19‐0.21; Germany: 0.32, 95% CI: 0.29‐0.34; France: 0.32, 95% CI: 0.29‐0.35; and Spain: 0.36, 95% CI: 0.34‐0.38) compared to the first time interval (Italy: 0.022, 95% CI: 0.014‐0.031; Germany: 0.054, 95% CI: 0.040‐0.070; France: 0.068, 95% CI: 0.054‐0.082; and Spain: 0.042, 95% CI: 0.028‐0.056) (Figure 3). In Iran, the growth rate for COVID‐19 cases was the highest in comparison to other countries during the first 3‐week interval (0.20, 95% CI: 0.18‐0.23) (Figure 3).
3.2.2. Doubling time of total confirmed COVID‐19 cases during the first and second 3‐week interval
In European countries, the doubling time decreased substantially during the second 3‐week interval (Italy: 3.40, 95% CI: 3.22‐3.58; Germany: 2.19, 95% CI: 2.02‐2.37; France: 2.17, 95% CI: 1.99‐2.38; and Spain: 1.95, 95% CI: 1.85‐2.06) compared to the first 3‐week interval (Italy: 30.82, 95% CI: 22.41‐48.87; Germany: 12.77, 95% CI: 9.96‐17.38; France: 10.27, 95% CI: 8.46‐12.84; and Spain: 16.60, 95% CI: 12.39‐24.58) (Figure 4). Similar to other countries, the doubling time of COVID‐19 cases in Iran remained low during the first‐time interval (3.42, 95% CI: 3.02‐3.89) (Figure 4).
4. DISCUSSION
During the initial phase, the rise of COVID‐19 cases differs significantly when comparing the analyzed epicenters. Although especially European countries (Italy, Spain, and Germany) initially detected very few cases in the first 3‐week interval of global COVID‐19 spread, there is a sharp increase in case numbers during the second 3‐week interval. In contrast, Asian countries like Japan and South Korea detected higher case numbers during the first 3‐week interval, with a slight but remarkable decrease during the second 3‐week interval. This observation is further supported when analyzing the data of case growth and doubling time.
However, the data for China and Iran is inconclusive. Although according to our data, China seems to have reached a plateau phase, the reliability of the data remains uncertain as China has changed the diagnostic criteria multiple times within a short period of time. Similarly, the data for Iran is probably biased and incomplete for analysis. 10 Our data indicate that the European countries may not have been well prepared to contain the COVID‐19 case spread. Many of the current cases in Europe can be traced back to northern Italy and Iran, the two main COVID‐19 epicenters outside of Eastern Asia. Like China, Iran displayed very low doubling times in the first 3‐week interval.
This finding may be a strong indicator that detection of COVID‐19 occurred at later stages with a more large‐scale virus spread. This underreporting and insufficient disease detection is a source of continuous concern. 11 The overall international COVID‐19 case development remains concerning and a significant trend of initial underreporting must be assumed. This is a negative development and indicates the possibility of further COVID‐19 spread, especially as most countries still report very few initial cases. As many counties are at different stages of the COVID‐19 epidemic, the question arises as to how reinfection can be avoided once curfew and lockdown measures are lifted. Our data support the effectiveness of current containment and testing efforts. 12 However, short‐time curfew might not be an alternative to long‐term containment and testing measures. The concept of wave patterns has been previously described for other pandemic outbreaks. These waves can be experienced for many months. 13 , 14 , 15
Limitations of this study include the quality of provided case numbers, as they might be subject to bias and underreporting. It remains challenging to distinguish the effect of different measures due to a lack of testing kits, insufficient detection, and varying containment policies.
The extent of overall testing seems to correlate with the awareness of serious health risks in the observed countries. As official case numbers have increased with the onset of containment measures, one can assume that testing is itself part of the containment strategy. 8 , 16
In fact, evaluation of individual strategies is not possible as only the totality of combined effects and policies of each country regarding quarantine, regional lockdowns, travel restriction, testing, and social distancing can be evaluated.
This problem has already been recognized in the evaluation of single containment measures. 12 , 17 With respect to these considerations, this study focuses on the combination of all measures taken by a country to evaluate the quality of the initial response to this outbreak.
5. CONCLUSION
Following the analysis of different European and Asian countries heavily affected by COVID‐19, our data indicate significant differences in initial growth rates and doubling time. According to our data, European countries seem to have missed effective measures to contain COVID‐19 at the beginning of the crisis compared to their counterparts in Asia. This is further substantiated by continuously, rapidly increasing COVID‐19 case numbers in European countries, which call for more draconic containment measures.
CONFLICT OF INTERESTS
The authors declare that there are no conflict of interests.
AUTHOR CONTRIBUTIONS
VK: data acquisition, data interpretation, final analysis, drafting of the manuscript, final approval for publication. HL: data acquisition, analysis, and interpretation, drafting of the manuscript, final approval for publication. TK, PK, and HI: data interpretation, drafting of the manuscript, final approval for publication. JB and AM: data interpretation, conception, and design of the work, critical revision for important intellectual content, final approval for publication.
Khosrawipour V, Lau H, Khosrawipour T, et al. Failure in initial stage containment of global COVID‐19 epicenters. J Med Virol. 2020;92:863–867. 10.1002/jmv.25883
REFERENCES
- 1. World Health Organization . Coronavirus disease 2019 (COVID‐19) situation report. https://www.who.int/emergencies/diseases/novel‐coronavirus‐2019/situation‐reports [PubMed]
- 2. Chen N, Zhou M, Dong X, et al. Epidemiological and clinical characteristics of 99 cases of 2019 novel coronavirus pneumonia in Wuhan, China: a descriptive study. Lancet. 2020;395(10223):507‐513. [DOI] [PMC free article] [PubMed] [Google Scholar]
- 3. Pan F, Ye T, Sun P, et al. Time course of lung changes on chest CT during recovery from 2019 novel coronavirus (COVID‐19) pneumonia. Radiology. 2020;13:200370. [DOI] [PMC free article] [PubMed] [Google Scholar]
- 4. Wilder‐Smith A, Freedman DO. Isolation, quarantine, social distancing and community containment: pivotal role for old‐style public health measures in the novel coronavirus (2019‐nCoV) outbreak. J Travel Med. 2020;27(2). 10.1093/jtm/taaa020 [DOI] [PMC free article] [PubMed] [Google Scholar]
- 5. Peak CM, Wesolowski A, Zu Erbach‐Schoenberg E, et al. Population mobility reductions associated with travel restrictions during the Ebola epidemic in Sierra Leone: use of mobile phone data. Int J Epidemiol. 2018;47(5):1562‐1570. [DOI] [PMC free article] [PubMed] [Google Scholar]
- 6. Bowers KW. Balancing individual and communal needs: plague and public health in early modern Seville. Bull Hist Med. 2007;81(2):335‐358. [DOI] [PubMed] [Google Scholar]
- 7. Camitz M, Liljeros F. The effect of travel restrictions on the spread of a moderately contagious disease. BMC Med. 2006;4:32. [DOI] [PMC free article] [PubMed] [Google Scholar]
- 8. Salathé M, Althaus CL, Neher R, et al. COVID‐19 epidemic in Switzerland: on the importance of testing, contact tracing and isolation. Swiss Med Wkly. 2020. 10.4414/smw.2020.20225. PMID: 32145768, [published online ahead of print March 5, 2020]. [DOI] [PubMed] [Google Scholar]
- 9. Wilder‐Smith A, Chiew CJ, Lee VJ. Can we contain the COVID‐19 outbreak with the same measures as for SARS? Lancet Infect Dis. 2020. 10.1016/S1473-3099(20)30129-8. [published online ahead of print March 9, 2020]. [DOI] [PMC free article] [PubMed] [Google Scholar]
- 10. Zhuang Z, Zhao S, Lin Q, et al. Preliminary estimation of the novel coronavirus disease (COVID‐19) cases in Iran: a modelling analysis based on overseas cases and air travel data. Int J Infect Dis. 2020;94:29‐31. 10.1016/j.ijid.2020.03.019 [DOI] [PMC free article] [PubMed] [Google Scholar]
- 11. Lau H, Khosrawipour V, Kocbach P, et al. Internationally lost COVID‐19 cases. J Microbiol Immunol. 1684–1182. 10.1016/j.jmii.2020.03.013 [DOI] [PMC free article] [PubMed] [Google Scholar]
- 12. Lau H, Khosrawipour V, Kocbach P, et al. The positive impact of lockdown in Wuhan on containing the COVID‐19 outbreak in China. J Travel Med. 2020. 10.1093/jtm/taaa037 [DOI] [PMC free article] [PubMed] [Google Scholar]
- 13. Flahault A. Has China faced only a herald wave of SARS‐CoV‐2? Lancet. 2020;395(10228):947. [DOI] [PMC free article] [PubMed] [Google Scholar]
- 14. He D, Dushoff J, Day T, Ma J, Earn JDJ. Inferring the causes of the three waves of the 1918 influenza pandemic in England and Wales. Proc Biol Sci. 2013;280(1766):20131345. [DOI] [PMC free article] [PubMed] [Google Scholar]
- 15. Simonsen L, Chowell G, Andreasen V, et al. A review of the 1918 herald pandemic wave: importance for contemporary pandemic response strategies. Ann Epidemiol. 2018;28(5):281‐288. [DOI] [PubMed] [Google Scholar]
- 16. Peto J. Covid‐19 mass testing facilities could end the epidemic rapidly. BMJ. 2020;368:m1163. [DOI] [PubMed] [Google Scholar]
- 17. Maier BF, Brockmann D. Effective containment explains subexponential growth in recent confirmed COVID‐19 cases in China. Science. 2020. 10.1126/science.abb4557 [DOI] [PMC free article] [PubMed] [Google Scholar]