

Abstract
The data presented here are related to the article entitled “Soil functions are affected by transition from conventional to organic mulch-based cropping system”[1]. Data were collected in 2016 in a processing tomato field located near Perugia, Italy. In details, data were collected in three differently managed processing tomato cropping systems: conventional integrated (INT); traditional organic with cover crops and conventional tillage (ORG); and organic coupled with conservation agriculture, with mulch-based cover crop and no-tillage (ORG+). We report data on the impact of each cropping system on crop biomass and yield, soil physicochemical properties, size and structure of soil microbial community, soil invertebrate biodiversity and habitat provision (predator-prey trophic interactions).
Keywords: Processing tomato, N balance, Organic carbon, Soil microbial community, PLFA, Soil invertebrate biodiversity, DNA barcoding, Molecular gut-content analysis
Specifications Table
| Subject | Agricultural and Biological Sciences (General) |
| Specific subject area | Effects of the cropping systems management on soil physicochemical features and invertebrate biodiversity |
| Type of data | Table Image Figure |
| How data were acquired | Soil survey, Agilent 7890-A gas-chromatograph, DNA extraction, BioRad c1000 thermocycler, SANGER sequencing, MEGA 7. |
| Data format | Raw Analyzed |
| Parameters for data collection | All soil samples were air-dried and sieved through a 2-mm mesh for: particle size distribution, pH in water (pHH2O), available P (Pav), content of total organic C (TOC), water extractable organic C (WEOC), microbial biomass C (Cmic), amount of CO2 evolved during basal respiration experiments (Res) and invertebrates collected. An aliquot of soil samples stored at 4°C was used for phospholipid fatty acids (PLFA). |
| Description of data collection | Meteorological data: meteorological station placed inside FieldLab-DSA3. Agronomical data: field samplings; suction cup lysimeters. Soil data: a soil profile was dug within each plot (2 plot x 3 treatment=6 profiles) to a depth of at least 90 cm and its morphology described. From each profile, the Ap 1 horizon was sampled and carried in a portable refrigerator to the laboratory. Invertebrate data: field/soil samplings; Tullgren funnels; Pitfall traps; Molecular gut-content analysis; DNA barcoding. |
| Data source location | FieldLab-DSA3, Papiano (Perugia), Italy (42°57’ N, 12°22’ E) |
| Data accessibility | With the article |
| Related research article | [1] Massaccesi, L., Rondoni, G., Tosti, G., Conti, E., Guiducci, M., Agnelli, A., Soil functions are affected by transition from conventional to organic mulch-based cropping system, Applied Soil Ecology, https://doi.org/10.1016/j.apsoil.2020.103639. |
Value of the Data
-
•
These data provide useful and multidisciplinary insight of the short-term (3 years) impact of three cropping systems on soil physicochemical and biological characteristics, size and structure of soil microbial community, soil invertebrate biodiversity and habitat provision.
-
•
These data can be useful for researchers, who can use and compare these results with their own.
-
•
These data can be combined with data from other experiments to reveal the impact of cropping systems on soil functions.
-
•
These data provide an in-depth description of: (i) the experimental site, (ii) the crop management, and (iii) the soil properties (taking into account the entire soil profile). These data could be used to validate future studies and to fostering national and/or international collaborations.
Data Description
These data support the research article entitled “Soil functions are affected by transition from conventional to organic mulch-based cropping system”, by Massaccesi et al. [1]. The data here reported include:
-
(1)
Cumulated rainfalls and mean air temperatures (ten-day averages) recorded at the experimental station (FieldLab-DSA3, Perugia, Italy) during the experimental period (September 2015 – August 2016) compared to the long-term means over 1950–2015 (Figure 1);
-
(2)
Overview of the durum wheat - processing tomato rotation timeline (Figure 2) and of the experimental plots (Figure 3);
-
(3)
Morphological description of the soil profiles (Table 1) and bulk densities of the Ap1 horizons (Table 2) under integrated (INT), traditional organic (ORG) and innovative organic (ORG+) cropping systems.
-
(4)
Particle size distribution, pH in water (pHH2O), available P (Pav) (Table 3), content of total organic C (TOC), water extractable organic C (WEOC), microbial biomass C (Cmic), amount of CO2 evolved during basal respiration experiments (Res) (Table 4), content of total phospholipid fatty acids (PLFA) (Table 5) and their nomenclature (Table 6) for the soil horizons under the three cropping systems;
-
(5)
Arthropods collected in May (Table 7) and August 2016 (Table 8) and separated from soil cores using Tullgren funnels and predatory invertebrates collected in August 2016 with Pitfall traps (Table 9), respectively for the three different cropping systems.
Figure 1.

Figure 2.

Figure 3.
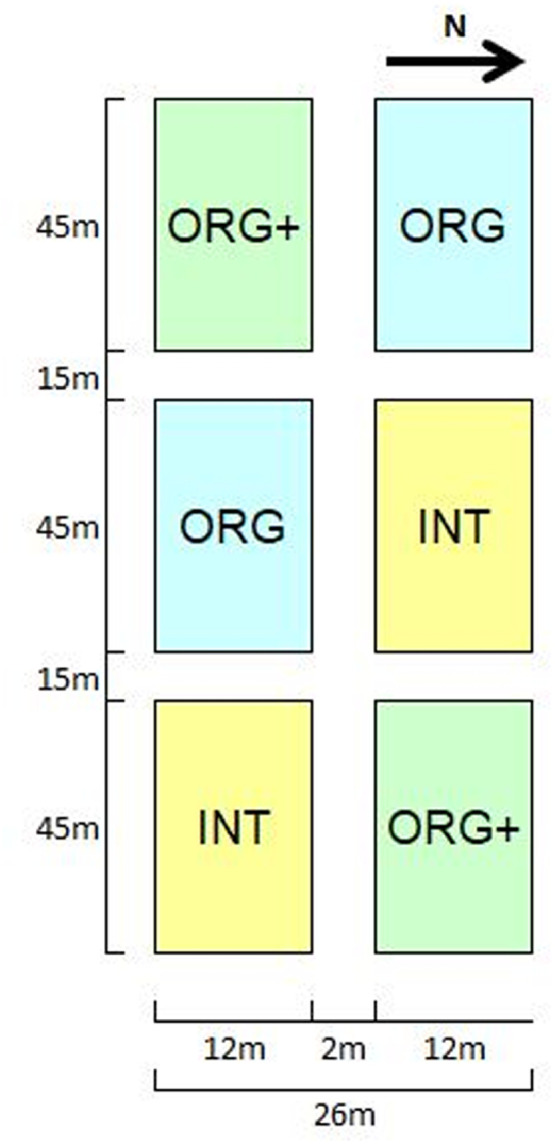
Table 1.
Main descriptive elements obtained from observation of two profiles per each cropping system: integrated (INT), traditional organic (ORG) and innovative organic (ORG+) cropping systems, FieldLab-DSA3 (Papiano, Central Italy). For symbols see legend.
| Landform: plain; Altitude: 162 m a.s.l.; Parent material: fluvial and lacustrine sediments; Soil: fine, mixed, mesic Typic Haplustept (Soil Survey Staff, 2014). | ||||||
|---|---|---|---|---|---|---|
| Depth cm | Coloura | Structureb | Rootsc | Boundaryd | Other observations | |
| Soil under integrated system (INT) | ||||||
| Ap1 | 0-14/15 | 10YR 4/4 | 2m sbk | 0 | cs | Skeleton (by volume): 5%; with a diameter of up to 10 cm |
| Ap2 | 14/15-22/27 | 10YR 4/6 | 1f-m sbk | 0 | cw | Skeleton (by volume): 2%; with a diameter < 0.5 cm |
| Bw1 | 22/27-40/43 | 10YR 4/6 | 1f sbk | 0 | cs | Skeleton (by volume): < 2% |
| Bw2 | 40/43-73/76 | 10YR 4/6 | 2f sbk | 0 | cs | Skeleton (by volume): 5% |
| BC | 73/76-106+ | 10YR 10/8 | 1f sbk | v1 | - | Skeleton (by volume): 5% |
| Soil under traditional organic system (ORG) | ||||||
| Ap1 | 0-12 | 10YR 3/6 | 3f sbk | 1vf,f | cs | Skeleton (by volume): <5%, with a diameter of up to 2 cm |
| Ap2 | 12-24 | 10YR 3/6 | 2m-c sbk | 1vf,f | cw | Skeleton (by volume): 1%; with a diameter < 0.5 cm |
| Bw1 | 24-42/44 | 10YR 4/6 | 3f-m sbk | 1vf,f | cs | Skeleton (by volume): 0% |
| Bw2 | 42/44-61/62 | 10YR 4/4 | 1m sbk | 0 | cw | Skeleton (by volume): 0% |
| BC | 61/62-101+ | 10YR 5/6 | 1m-c sbk | 0 | - | Skeleton (by volume): 0% |
| Soil under innovative organic system (ORG+) | ||||||
| Oi | 1-0 | |||||
| Ap1 | 0-6/7 | 10YR 4/4 | 3f sbk | 3 f,m | cw | Skeleton (by volume): 0%; Signs of compression evidenced by the presence of a superficial crust (0.5 cm) that breaks horizontally. |
| Ap2 | 6/7-17/16 | 10YR 4/4 | 1m sbk | 3 f,m | cw | Skeleton (by volume): < 1% |
| Ap3 | 16/17-30 | 10YR 4/6 | 1m sbk | 2 vf,f | cs | Skeleton (by volume): < 1% |
| 10YR 4/3 | ||||||
| Bw1 | 30-50/51 | 10YR 5/6 | 2f abk | 1 f | cs | Skeleton (by volume): 0% |
| 10YR 4/4 | ||||||
| Bw2 | 50/51-64/70 | 10YR 5/8 | 2f sbk | 0 | cw | Skeleton (by volume): < 1% |
| BC | 64/70-104+ | 10YR 5/6 | 2c sbk | 0 | - | Skeleton (by volume): 10%; with a diameter < 0.5 cm |
moist and crushed, according to the Munsell Soil Color Charts.
1 = weak, 2 = moderate, 3 = strong; f = fine, m = medium, c = coarse; cr = crumb, abk = angular blocky, sbk = subangular blocky.
0 = absent, v1 = very few, 1 = few, 2 = plentiful, 3 = abundant; mi = micro, vf = very fine, f = fine, m = medium, co = coarse.
a = abrupt, c = clear; w = wavy, s = smooth.
Table 2.
Bulk density values of Ap1 horizons of the soils under integrated (INT), traditional organic (ORG) and innovative organic (ORG+) cropping systems (FieldLab-DSA3, Perugia, Italy). Numbers in parentheses are the standard errors (n=2).
| Bulk density (g cm-3) | |
|---|---|
| INT | |
| Ap1 | 1.16 (0.01) |
| ORG | |
| Ap1 | 1.17 (0.05) |
| ORG+ | |
| Ap1 | 1.44 (0.00) |
Table 3.
Particle size distribution (without cement dissolution), pH in water (pHH2O) and available P (Pav) of the soils under integrated (INT), traditional organic (ORG) and innovative organic (ORG+) cropping systems (FieldLab-DSA3, Perugia, Italy). Numbers in parentheses are the standard errors (n=2).
| Sand | Silt | Clay | pHH2O | Pav | |
|---|---|---|---|---|---|
| % | mg kg-1 | ||||
| INT | |||||
| Ap1 | 24.2(2.2) | 42.8(1.7) | 33.0(0.6) | 7.9(0.1) | 40.9(0.8) |
| Ap2 | 26.1(0.9) | 41.4(1.0) | 32.6(0.0) | 7.8(0.0) | 31.9(4.1) |
| Bw1 | 23.8(2.3) | 43.6(2.0) | 32.6(0.3) | 7.8(0.1) | 26.9(3.5) |
| Bw2 | 21.8(0.6) | 45.2(0.0) | 33.0(0.6) | 7.9(0.0) | 14.7(2.1) |
| BC | 25.3(6.6) | 43.9(4.9) | 30.8(1.7) | 8.0(0.0) | 5.8(0.4) |
| ORG | |||||
| Ap1 | 23.3(1.6) | 43.3(1.3) | 33.4(1.6) | 7.8(0.1) | 34.8(16.3) |
| Ap2 | 24.4(0.2) | 42.3(2.8) | 33.4(0.2) | 7.9(0.0) | 25.9(6.1) |
| Bw1 | 21.4(1.8) | 42.8(1.2) | 35.7(0.6) | 7.9(0.1) | 17.7(1.2) |
| Bw2 | 27.6(7.3) | 46.5(3.1) | 25.9(7.3) | 7.8(0.1) | 17.0(2.5) |
| BC | 26.8(8.3) | 47.2(1.1) | 26.1(9.4) | 8.0(0.1) | 1.5(0.3) |
| ORG+ | |||||
| Ap1 | 26.5(6.3) | 44.3(2.7) | 29.2(3.6) | 7.6(0.1) | 36.3(1.8) |
| Ap2 | 24.7(6.1) | 44.4(1.4) | 30.9(4.6) | 7.9(0.0) | 21.2(2.3) |
| Ap3 | 25.3(4.9) | 44.4(0.7) | 30.4(4.1) | 8.0(0.1) | 20.8(0.6) |
| Bw1 | 23.7(6.0) | 45.2(2.0) | 31.0(4.0) | 8.0(0.0) | 17.9(3.3) |
| Bw2 | 23.0(4.6) | 47.8(2.1) | 29.2(2.6) | 8.0(0.0) | 15.1(3.0) |
| BC | 24.5(1.3) | 50.0(3.0) | 25.5(1.3) | 8.1(0.0) | 2.8(3.1) |
Table 4.
Content of total organic C (TOC), water extractable organic C (WEOC) and microbial biomass C (Cmic), and amount of CO2 evolved during basal respiration experiments (Res) for the soils under integrated (INT), traditional organic (ORG) and innovative organic (ORG+) cropping systems (FieldLab-DSA3, Perugia, Italy). Numbers in parentheses are the standard errors (n=2).
| TOC | WEOC | Cmic | Res | |
|---|---|---|---|---|
| g kg-1 | mg kg-1 | mg kg-1 | mg kg-1 | |
| INT | ||||
| Ap1 | 8.2(0.4) | 144.8(11.1) | 68.73(28.8) | 787.8(480.7) |
| Ap2 | 9.1(0.5) | 23.3(0.3) | 78.84(22.5) | 305.0(3.1) |
| Bw1 | 7.5(0.2) | 21.9(0.7) | 95.02(46.2) | 248.7(35.8) |
| Bw2 | 6.9(0.5) | 18.9(0.8) | 87.47(23.7) | 200.1(39.7) |
| BC | 4.2(0.2) | 15.3(2.1) | 59.01(16.3) | 153.6(34.4) |
| ORG | ||||
| Ap1 | 8.8(0.2) | 144.1(3.8) | 141.98(26.4) | 578.6(9.8) |
| Ap2 | 8.7(0.5) | 24.0(0.3) | 81.07(54.5) | 488.1(32.6) |
| Bw1 | 8.1(0.4) | 20.0(0.4) | 119.9(45.8) | 463.0(131.3) |
| Bw2 | 6.6(0.2) | 18.8(0.9) | 100.1(33.4) | 375.5(65.0) |
| BC | 5.2(0.6) | 16.7(2.4) | 66.63(1.5) | 252.7(14.1) |
| ORG+ | ||||
| Ap1 | 11.5(0.9) | 150.0(2.6) | 164.1(37.1) | 777.8(164.7) |
| Ap2 | 8.1(0.6) | 24.1(1.1) | 115.98(5.9) | 345.4(11.8) |
| Ap3 | 7.6(0.2) | 19.3(1.2) | 122.14(13.3) | 266.2(72.2) |
| Bw1 | 8.2(0.4) | 24.0(1.5) | 121.86(27.2) | 385.5(90.5) |
| Bw2 | 6.7(0.2) | 28.8(6.9) | 78.73(1.6) | 320.6(62.3) |
| BC | 5.1(0.3) | 22.5(2.3) | 55.78(5.5) | 273.7(66.8) |
Table 5.
Content of total phospholipid fatty acids (PLFA) and of specific PLFA used to quantify the relative abundance of the individual cell types comprising the soil microbial community under integrated (INT), traditional organic (ORG) and innovative organic (ORG+) cropping systems (FieldLab-DSA3, Perugia, Italy). Numbers in parentheses are the standard errors (n=2).
| Total PLFAs (nmol C g-1) | Bacterial PLFA (nmol C g-1) | Gram-positive bacteria PLFA (nmol C g-1) | Gram-negative bacteria PLFA (nmol C g-1) | Fungal PLFA (nmol C g-1) | AMF PLFA (nmol C g-1) | Actinomycetes PLFA (nmol C g-1) | Protozoa PLFA (nmol C g-1) | |
|---|---|---|---|---|---|---|---|---|
| INT | ||||||||
| Ap1 | 14.82(4.65) | 6.55(0.12) | 3.19(0.05) | 3.36(0.08) | 0.08(0.08) | 0.72(0.18) | 6.09(0.78) | 0.14(0.15) |
| Ap2 | 21.13(3.14) | 8.54(3.37) | 2.43(0.08) | 5.89(3.21) | 0.22(0.22) | 0.61(0.00) | 8.86(0.90) | 0.00(0.00) |
| Bw1 | 13.05(0.88) | 5.30(0.53) | 1.79(0.22) | 3.51(0.31) | 0.63(0.63) | 0.35(0.03) | 4.65(3.22) | 0.26(0.43) |
| Bw2 | 15.72(0.82) | 4.60(0.66) | 1.77(0.21) | 2.83(0.44) | 0.00(0.00) | 0.26(0.02) | 9.44(0.15) | 0.00(0.00) |
| BC | 12.49(0.47) | 3.24(0.93) | 0.52(0.21) | 2.72(0.72) | 0.00(0.00) | 0.06(0.00) | 7.97(0.05) | 0.03(0.00) |
| ORG | ||||||||
| Ap1 | 33.6(2.89) | 19.62(4.87) | 10.25(1.96) | 9.33(2.90) | 0.73(0.73) | 2.11(0.39) | 7.37(0.79) | 0.23(0.22) |
| Ap2 | 22.77(5.38) | 12.21(1.09) | 6.03(0.26) | 6.08(1.34) | 0.41(0.11) | 1.76(0.03) | 6.10(4.10) | 0.02(0.00) |
| Bw1 | 23.14(13.55) | 13.22(3.53) | 4.79(2.30) | 8.26(1.19) | 0.45(0.45) | 1.23(0.33) | 5.31(0.80) | 0.12(0.20) |
| Bw2 | 15.03(3.65) | 8.67(1.30) | 4.48(0.31) | 5.89(1.58) | 0.65(0.65) | 0.67(0.21) | 1.49(0.16) | 0.55(0.62) |
| BC | 9.31(5.67) | 4.10(0.61) | 0.85(0.40) | 3.19(0.20) | 0.17(0.17) | 0.05(0.04) | 2.74(1.07) | 0.47(0.02) |
| ORG+ | ||||||||
| Ap1 | 26.91(2.47) | 13.85(1.07) | 6.35(1.39) | 7.38(0.33) | 1.05(1.05) | 1.88(0.23) | 8.56(0.00) | 0.00(2.00) |
| Ap2 | 26.71(1.55) | 11.31(0.18) | 5.24(0.32) | 6.04(0.49) | 0.91(0.89) | 0.82(0.06) | 10.44(0.50) | 0.22(0.08) |
| Ap3 | 16.46(5.04) | 7.27(2.74) | 2.53(0.31) | 4.62(2.38) | 0.00(0.00) | 0.76(0.07) | 6.70(0.00) | 0.00(1.51) |
| Bw1 | 16.04(2.67) | 6.98(0.74) | 2.95(0.15) | 4.02(0.60) | 0.00(0.00) | 0.65(0.04) | 7.23(0.03) | 0.04(0.12) |
| Bw2 | 17.40(1.13) | 6.15(1.68) | 2.75(0.45) | 3.37(1.22) | 0.00(0.00) | 0.64(0.12) | 8.91(0.00) | 0.00(0.45) |
| BC | 7.84(4.52) | 3.15(1.15) | 0.80(0.02) | 2.27(1.14) | 0.00(0.00) | 0.11(0.01) | 3.34(0.03) | 0.06(4.06) |
Table 6.
PLFA nomenclature
| Microbial group | PLFA | References |
|---|---|---|
| Gram-positive bacteria | i15:0, a15:0, i16:0, i17:0, a17:0 | Federle, [8]; Frostegård et al., [9]; Fierer et al., [10]; Massaccesi et al., [11]. |
| Gram-negative bacteria | 16:1, cy17:0, 17:1ω9c, 18:1ω7 | Federle, [8]; Frostegård et al., [9]; Fierer et al., [10]; Massaccesi et al., [11]. |
| Saprophytic fungi | 18:2ω6 | Federle, [8]. |
| Arbuscular mycorrhizal fungi (AMF) | 16:1ω5 | De Deyn et al., [12]. |
| Actinomycetes | 10Me17:0, 10Me18:0 | Kroppenstedt, [13]; De Deyn et al., [12]. |
| Protozoa | 20:2 | Fierer et al., [10]. |
Table 7.
Arthropods collected in May 2016 with Tullgren funnels at three different soil horizons (Ap: 0-10 cm depth, Bw1: 30-40 cm and Bw2: 51-61 cm depth), respectively from integrated (INT), traditional organic (ORG) and innovative organic (ORG+) cropping systems. Shannon diversity indexes have been calculated excluding unidentified invertebrates.
| Class | Order | Family | Genus / Species | Ap |
Bw1 |
Bw2 |
||||||
|---|---|---|---|---|---|---|---|---|---|---|---|---|
| INT | ORG | ORG+ | INT | ORG | ORG+ | INT | ORG | ORG+ | ||||
| Arachnida | Oribatida | Oribatidae | - | 1 | 4 | - | - | - | - | - | - | |
| Entognatha | Diplura | Parajapygidae | - | - | - | - | 1 | 1 | - | - | - | |
| Insecta | Coleoptera | Staphylinidae | Anotylus inustus | - | - | 1 | - | - | - | - | - | - |
| Insecta | Coleoptera | Staphylinidae | Platystethus nitens | - | 2 | - | - | - | - | - | - | - |
| Insecta | Coleoptera | Elateridae | Agriotes litigiosus | - | - | 1 | - | - | - | - | - | - |
| Insecta | Coleoptera | - | 3 | 1 | - | - | - | - | - | - | ||
| Insecta | Diptera | Agromyzidae | - | - | - | - | 1 | - | - | - | - | |
| Insecta | Diptera | Cecidomyiidae | - | 1 | - | - | - | - | - | - | - | |
| Insecta | Diptera | Sciaridae | Corynoptera sp. | - | - | - | 1 | - | 1 | - | - | - |
| Insecta | Diptera | Sciaridae | Lycoriella sp. | - | 1 | - | 1 | 2 | - | - | - | - |
| Insecta | Hymenoptera | Formicidae | 1 | 1 | 2 | - | - | - | - | - | - | |
| Insecta | Hymenoptera | - | 1 | - | - | - | - | - | - | - | ||
| unidentified | - | 1 | 3 | - | - | - | 1 | 2 | 2 | |||
| Shannon Index | 1.83 | 1.43 | 0.69 | 1.04 | 0.69 | 0 | 0 | 0 | ||||
Table 8.
Arthropods collected in August 2016 with Tullgren funnels from soils (0-10 cm depth), respectively from integrated (INT), traditional organic (ORG) and innovative organic (ORG+) cropping systems. Shannon diversity indexes have been calculated excluding unidentified invertebrates.
| Class | Order | Family | Subfamily / Genus / Species | INT | ORG | ORG+ |
|---|---|---|---|---|---|---|
| Arachnida | Sarcoptiformes | Achipteriidae | Anachipteria sp. | - | - | 2 |
| Arachnida | Sarcoptiformes/Oribatida | Oribatidae | - | - | 4 | |
| Arachnida | Sarcoptiformes/Oribatida | 8 | 1 | 5 | ||
| Chilopoda | Geophilomorpha | Geophilidae | Geophilus flavus | - | - | 1 |
| Chilopoda | Geophilomorpha | Linotaeniidae | Strigamia sp. | - | - | 1 |
| Entognatha | Poduromorpha | Hypogastruridae | Ceratophysella sp. | 1 | - | 5 |
| Insecta | Homoptera | Cicadellidae | 1 | - | - | |
| Insecta | Coleoptera | Carabidae | Elaphropus sp. | - | 1 | - |
| Insecta | Coleoptera | Carabidae | Pterostichus sp. | - | 2 | - |
| Insecta | Coleoptera | Chrysomelidae | Epitrix hirtipennis | 1 | - | - |
| Insecta | Coleoptera | Scarabaeidae | Pleurophorus caesus | - | 1 | 2 |
| Insecta | Coleoptera | Scarabaeidae | 1 | - | - | |
| Insecta | Diptera | Sciaridae | Bradysia tilicola | 5 | 1 | - |
| Insecta | Diptera | Sciaridae | Corynoptera sp. | - | - | 1 |
| Hymenoptera | Cynipoidea | Figitidae | Eucoilinae | 1 | - | - |
| unidentified | - | 5 | 2 | |||
| Shannon Index | 1.52 | 1.56 | 1.88 |
Table 9.
Predatory invertebrates collected in August 2016 with Pitfall traps, respectively from integrated (INT), traditional organic (ORG) and innovative organic (ORG+) cropping systems.
| Group | Species | INT | ORG | ORG+ |
|---|---|---|---|---|
| Ground beetles | Bembidion quadrimaculatum | 1 | 7 | 1 |
| Harpalus distinguendus | 1 | 1 | 1 | |
| Harpalus (Pseudoophonus) rufipes | 7 | 6 | 50 | |
| Microlestes minutulus | - | 1 | - | |
| Poecilus cupreus | - | 2 | 4 | |
| Spiders | unidentified | 8 | 24 | 62 |
Experimental Design, Materials, and Methods
Description of the experimental site and crop management
The data were collected in the year 2015/2016 in the experimental station of the Department of Agricultural, Food and Environmental Sciences of the University of Perugia (FieldLab-DSA3; 42°57’ N, 12°22’ E), located in Papiano (Perugia, Central Italy). The climatic data of the area were calculated from 65 years (1950 - 2015 series) of consecutive records collected by a meteorological station placed inside FieldLab-DSA3 (Figure 1). The mean annual air temperature (MAAT) of the site is 13.3 °C, while the mean annual precipitation (MAP) is 833 mm (most rainfall events during autumn and winter, and a dry summer) (Figure 1).
A crop rotation of processing tomato (Solanum lycopersicum L. cultivar PS1296) and durum wheat (Triticum durum Desf. cultivar Dylan) was established during spring 2013, starting with durum wheat (Figure 2). The rotation was applied to three different cropping systems: the INT system, which consisted in an integrated management with no cover crop and conventional tillage technique; the ORG system, which consisted in a traditional organic management with cover crop and conventional tillage; the ORG+ system, which consisted in an innovative organic management with cover crop mulch-based no-tillage technique (ORG+). Two blocks, each consisting of three plots of 540 m2 each were arranged (Figure 3). The samplings were conducted in 2016.
Processing tomato was preceded by an autumn-sown mixture of barley (25% of its full sowing rate) and field pea (75% of its full sowing rate) in ORG and ORG+ and by bare soil in INT. At mid-April, in the ORG system, the cover crop was incorporated into the soil through a rotary hoe tiller, while in the ORG+ system, a roller crimper was used and the cover crop biomass was left on the soil as dead mulch.
At the end of May, processing tomato was transplanted after a rotary tiller operation at ∼20 cm depth (INT and ORG) or after a shallow strip-tillage operation (ORG+) performed (at 10-20 cm depth) using a prototype no PTO-powered strip tiller (CMA S.r.l., Italy). All plots were N fertilized by means of fertigation (details on scheduling and methods in Farneselli et al. [2] and Massaccesi et al. [1]).
Soil sampling for physical, chemical and microbial analyses
The soil sampling was conducted on May 9th, 2016, before the processing tomato transplanting operations. A soil profile was dug within each plot to a depth of at least 90 cm and its morphology described according to Schoeneberger et al. [3] (Table 1). For each profile, about 1 kg of soil from every mineral horizon was sampled and carried in a portable refrigerator to the laboratory.
For details on methodologies used for chemical and biological soil properties see [1].
Soil invertebrate biodiversity
Soil samples for evaluation of invertebrate biodiversity were taken from the differently managed plots (INT, ORG and ORG+) on May 9th, 2016 (before processing tomato transplanting) and on August 12th, 2016 (before the harvesting operation of processing tomato). In May, one core of 1 dm3 (10 cm Ø) was taken from each of the three horizons (Ap: 0-10 cm depth, Bw1: 30-40 cm and Bw2: 51-61) of each plot. The samples were put together to form one composite sample for each of the three systems [4]. Similarly, in August two soil cores were collected from the Ap horizons (0-10 cm depth) of all treatments. Each soil core was subsequently placed inside a heated Tullgren funnel and the invertebrates were isolated as specified in Massaccesi et al. [1]. Total DNA purification, PCR amplification using Foelmer's primer [5] and Sanger sequencing were conducted as specified in [1] and elsewhere [6,7]. For identification, consensus sequences were compared to sequences deposited to GenBank using BLAST. The identified individuals at the species, genus, family or order level are reported in table 7 and table 8.
Also, four pitfall traps (each filled with 150 ml of 70% EtOH) per each of the 6 plots were positioned on August 13th 2016 and left in place for 24h. Collected carabid beetles were identified using DNA barcoding as described above (Table 9) and dissected for molecular analysis of gut content [1].
Declaration of Competing Interest
The authors declare that they have no known competing financial interests or personal relationships which have, or could be perceived to have, influenced the work reported in this article.
Acknowledgments
This work was partially supported by the University of Perugia Fund for Basic Research 2015 (Soil biodiversity and ecosystem functionality: comparison between biological and conventional production method), the Italian Ministry of University and Research (MIUR) under the project “Integration and comparison of innovative technical approaches with different ‘ecological intensification’ finalized to a smart management of conservative agricultural systems.” (Project code: RBFR13L8J6) and by and by the GAL Media Valle del Tevere (PSR UMBRIA 2014–2020, m. 19.2).
Author contribution. For the agronomic part: GT and MG planned the experiments and revised the manuscript; GT collected and analyzed the data and wrote the first version of the manuscript. For the pedological part: LM and AA planned the experiments and revised the manuscript; LM collected and analyzed the data and wrote the first version of the manuscript. For the entomological part: GR and EC planned the experiments and revised the manuscript; GR collected and analyzed the data and wrote the first version of the manuscript. All authors reviewed the whole manuscript.
References
- 1.L. Massaccesi, G. Rondoni, G. Tosti, E. Conti, M. Guiducci, A. Agnelli, Soil functions are affected by transition from conventional to organic mulch-based cropping system, Appl. Soil Ecol., 10.1016/j.apsoil.2020.103639. [DOI] [PMC free article] [PubMed]
- 2.Farneselli M., Tosti G., Onofri A., Benincasa P., Guiducci M., Pannacci E., Tei F. Effects of N sources and management strategies on crop growth, yield and potential N leaching in processing tomato. Eur. J. Agron. 2018;98:46–54. doi: 10.1016/j.eja.2018.04.006. [DOI] [Google Scholar]
- 3.Schoeneberger P.J., Wysocki D.A., Benham E.C. Natural Resources Conservation Service, National Soil Survey Center; Lincoln, NE: 2012. Soil Survey Staff, Field book for describing and sampling soils, Version 3.0. [Google Scholar]
- 4.Tsiafouli M.A., Thébault E., Sgardelis S.P., Ruiter P.C., Putten W.H., Birkhofer K., Hemerik L., Vries F.T., Bardget R.D., Brady M.V., Bjornlund L., Jørgensen H.B., Christensen S., Hertefeldt T.D., Hotes S., Gera Hol W., Frouz J., Liiri M., Mortimer S.R., Setälä H., Tzanopoulos J., Uteseny K., Pižl V., Stary J., Wolters V., Hedlund K. Intensive agriculture reduces soil biodiversity across Europe. Global Change Biol. 2015;21:973–985. doi: 10.1111/gcb.12752. [DOI] [PubMed] [Google Scholar]
- 5.Folmer O., Black M., Hoeh W., Lutz R., Vrijenhoek R. R. DNA primers for amplification of mitochondrial cytochrome c oxidase subunit I from diverse metazoan invertebrates. Mol. Mar. Biol. Biotech. 1994;3:294–299. [PubMed] [Google Scholar]
- 6.Rondoni G., Athey K.J., Harwood J.D., Conti E., Ricci C., Obrycki J.J. Development and application of molecular gut-content analysis to detect aphid and coccinellid predation by Harmonia axyridis (Coleoptera: Coccinellidae) in Italy. Insect Sci. 2015;22:719–730. doi: 10.1111/1744-7917.12165. [DOI] [PubMed] [Google Scholar]
- 7.Rondoni G., Fenjan S., Bertoldi V., Ielo F., Djelouah K., Moretti C., Buonaurio R., Ricci C., Conti E. Molecular detection of field predation among larvae of two ladybird beetles is partially predicted from laboratory experiments. Sci. Rep. 2018;8:2594. doi: 10.1038/s41598-018-20830-2. [DOI] [PMC free article] [PubMed] [Google Scholar]
- 8.Federle T.W. Microbial distribution in soild new techniques. In: Megusar F., Gantar M., editors. Perspectives in Microbial Ecology. Slovene Society for Microbiology; Ljubljana: 1986. pp. 493–498. [Google Scholar]
- 9.Frostegård Å., Bååth E., Tunlid A. Shifts in the structure of soil microbial communities in limed forests as revealed by phospholipid fatty acid analysis. Soil Biol. Bioch. 1993;25:723–730. [Google Scholar]
- 10.Fierer N., Schimel J.P., Holden P.A. Variation in microbial community composition through two soil depth profiles. Soil Biol. Bioch. 2003;35:167–176. [Google Scholar]
- 11.Massaccesi L., Agnelli A., Bardgett R.D., Ostle N., Wilby A., Orwin K.H. Impact of plant species evenness, dominant species identity and spatial arrangement on the structure and functioning of soil microbial communities in a model grassland. Oecologia. 2015;177:747–759. doi: 10.1007/s00442-014-3135-z. [DOI] [PubMed] [Google Scholar]
- 12.De Deyn G., Quirk H., Bardgett R. Plant species richness, identity and productivity differentially influence key groups of microbes in grassland soils of contrasting fertility. Biol. Lett. 2011;7:75–78. doi: 10.1098/rsbl.2010.0575. [DOI] [PMC free article] [PubMed] [Google Scholar]
- 13.Kroppenstedt R.M. Fatty acid and menaquinone analysis of actinomycetes and related organisms. In: Goodfellow M., Minnikin D.E., editors. Chemical Methods in Bacterial Systematics, Society for Applied Bacteriology (Technical Series No. 20) Academic Press; London: 1985. pp. 173–199. [Google Scholar]