

Abstract
Background
The ideal proportion of energy from fat in our food and its relation to body weight is not clear. In order to prevent overweight and obesity in the general population, we need to understand the relationship between the proportion of energy from fat and resulting weight and body fatness in the general population.
Objectives
To assess the effects of proportion of energy intake from fat on measures of body fatness (including body weight, waist circumference, percentage body fat and body mass index) in people not aiming to lose weight, using all appropriate randomised controlled trials (RCTs) of at least six months duration.
Search methods
We searched CENTRAL, MEDLINE, Embase, Clinicaltrials.gov and the WHO International Clinical Trials Registry Platform (ICTRP) to October 2019. We did not limit the search by language.
Selection criteria
Trials fulfilled the following criteria: 1) randomised intervention trial, 2) included adults aged at least 18 years, 3) randomised to a lower fat versus higher fat diet, without the intention to reduce weight in any participants, 4) not multifactorial and 5) assessed a measure of weight or body fatness after at least six months. We duplicated inclusion decisions and resolved disagreement by discussion or referral to a third party.
Data collection and analysis
We extracted data on the population, intervention, control and outcome measures in duplicate. We extracted measures of body fatness (body weight, BMI, percentage body fat and waist circumference) independently in duplicate at all available time points. We performed random‐effects meta‐analyses, meta‐regression, subgrouping, sensitivity, funnel plot analyses and GRADE assessment.
Main results
We included 37 RCTs (57,079 participants). There is consistent high‐quality evidence from RCTs that reducing total fat intake results in small reductions in body fatness; this was seen in almost all included studies and was highly resistant to sensitivity analyses (GRADE high‐quality evidence, not downgraded). The effect of eating less fat (compared with higher fat intake) is a mean body weight reduction of 1.4 kg (95% confidence interval (CI) ‐1.7 to ‐1.1 kg, in 53,875 participants from 26 RCTs, I2 = 75%). The heterogeneity was explained in subgrouping and meta‐regression. These suggested that greater weight loss results from greater fat reductions in people with lower fat intake at baseline, and people with higher body mass index (BMI) at baseline. The size of the effect on weight does not alter over time and is mirrored by reductions in BMI (MD ‐0.5 kg/m2, 95% CI ‐0.6 to ‐0.3, 46,539 participants in 14 trials, I2 = 21%), waist circumference (MD ‐0.5 cm, 95% CI ‐0.7 to ‐0.2, 16,620 participants in 3 trials; I2 = 21%), and percentage body fat (MD ‐0.3% body fat, 95% CI ‐0.6 to 0.00, P = 0.05, in 2350 participants in 2 trials; I2 = 0%).
There was no suggestion of harms associated with low fat diets that might mitigate any benefits on body fatness. The reduction in body weight was reflected in small reductions in LDL (‐0.13 mmol/L, 95% CI ‐0.21 to ‐0.05), and total cholesterol (‐0.23 mmol/L, 95% CI ‐0.32 to ‐0.14), with little or no effect on HDL cholesterol (‐0.02 mmol/L, 95% CI ‐0.03 to 0.00), triglycerides (0.01 mmol/L, 95% CI ‐0.05 to 0.07), systolic (‐0.75 mmHg, 95% CI ‐1.42 to ‐0.07) or diastolic blood pressure(‐0.52 mmHg, 95% CI ‐0.95 to ‐0.09), all GRADE high‐quality evidence or quality of life (0.04, 95% CI 0.01 to 0.07, on a scale of 0 to 10, GRADE low‐quality evidence).
Authors' conclusions
Trials where participants were randomised to a lower fat intake versus a higher fat intake, but with no intention to reduce weight, showed a consistent, stable but small effect of low fat intake on body fatness: slightly lower weight, BMI, waist circumference and percentage body fat compared with higher fat arms. Greater fat reduction, lower baseline fat intake and higher baseline BMI were all associated with greater reductions in weight. There was no evidence of harm to serum lipids, blood pressure or quality of life, but rather of small benefits or no effect.
Plain language summary
Effect of cutting down the fat we eat on body weight
The ideal proportion of energy from fat in our food and its relation to body fatness is not clear. This review looked at the effect of cutting down the proportion of energy from fat in our food on body fatness in adults who are not aiming to lose weight. Body fatness was measured using body weight, body mass index, waist circumference and percent body fatness. The evidence is current to October 2019. The review found that cutting down on the proportion of fat in our food leads to a small but noticeable decrease in body weight, body mass index, percentage body fat and waist circumference. The effect did not change over time, but reducing fat intake to a greater extent results in greater weight reduction. We assessed potential harms of reducing total fat, but found no evidence of harm on serum lipids, blood pressure or quality of life.
Summary of findings
Summary of findings 1. Low dietary fat compared with usual fat for controlling body fatness.
| Low dietary fat compared with higher dietary fat for body fatness | ||||||
|
Patient or population: adults from the general population including those who were healthy, with risk factors and with long‐term conditions
Settings: any setting, including the community and institutions, for at least 6 months
Intervention: lower dietary total fat (intended that participants reduce dietary fat intake to ≤ 30% energy (≤ 30%E) from fat, and at least partially replace the energy lost with carbohydrates (simple or complex), protein or fruit and vegetables)
Comparison: higher dietary total fat (intended that participants consume > 30% energy from total fats. The higher fat arm could be 'usual dietary intake', specifying a higher total fat intake, or one aiming to modify the type of fats consumed, such as increasing monounsaturated or polyunsaturated fats) Methods: randomised controlled trials (RCTs) | ||||||
| Outcomes | Illustrative comparative risks* (95% CI) | Relative effect (95% CI) | No of participants (studies) | Quality of the evidence (GRADE) | Comments | |
| Assumed risk | Corresponding risk | |||||
| Usual fat | Low dietary fat | |||||
| Body fatness (represented by body weight, kg) Follow‐up: 6 to 96 months | Median weight change ‐0.04 kg1 | The mean body weight in the low fat groups was 1.42 kg lower (1.73 to 1.10 lower) | — | 53,875 (26 RCTs, 33 comparisons) | ⊕⊕⊕⊕ high2,3,4,5,6,7 | Reducing total fat intake causes a small reduction in body fatness (assessed with body weight and other measures of body fatness). Not downgraded |
| Body fatness (represented by BMI, kg/m2) Follow‐up: 6 to 96 months | Mean change in BMI 0.14 kg/m2 | The mean BMI in the low fat groups was 0.47 kg/m2 lower (0.64 to 0.30 lower) | 46,604 (15 RCTs) | |||
| Body fatness (represented by waist circumference, cm) Follow‐up: 6 to 96 months | Mean change in waist circumference ‐0.6 cm | Mean waist circumference in low fat participants was 0.47 cm lower (0.73 to 0.22 lower) | 16,685 (4 RCTs) | |||
| Body fatness (represented by percentage body fat) Follow‐up: 6 to 96 months | Mean change in percentage body fat 0.7% | Mean percentage of body fat in low fat participants was 0.28% lower (0.57 to 0 lower) | 2415 (3 RCTs) | |||
| Potential harms ‐ serum lipids, mmol/L | Means at baseline in usual fat groups (in mmol/L): Total cholesterol 5.5; LDL cholesterol 4.0; HDL cholesterol 1.4, TG 1.3 | Relative to control groups, total cholesterol in the low fat arm was 0.23 mmol/L lower (95% CI ‐3.2 to ‐0.14), LDL cholesterol was 0.13 mmol/L lower (95% CI ‐0.21 to ‐0.05), HDL cholesterol was 0.02 mmol/L lower (95% CI ‐0.03 to 0.00), and TG was 0.01 mmol/L higher (95% CI ‐0.05 to 0.07). | Total chol: 9812 (22 RCTs) LDL chol: 8137 (19 RCTs) HDL chol: 8268 (20 RCTs) TG: 8672 (18 RCTs) |
⊕⊕⊕⊕ high4,8,9, 10,11 | We found no evidence that reducing total fat intake harms serum lipids. It leads to small reductions in total and LDL cholesterol, with little change in HDL cholesterol or TG. | |
| Potential harms ‐ blood pressure (BP), mmHg | Mean change in usual fat groups (in mmHg): systolic BP ‐1.2; diastolic BP ‐0.9 | Relative to control groups,systolic BP in the low fat arm was 0.75 mmHg lower (95% CI ‐1.42 to ‐0.07) and diastolic BP was 0.52 mmHg lower (95% CI ‐0.95 to ‐0.09). | Systolic BP: 6078 (10 RCTs) Diastolic BP: 6078 (10 RCTs) |
⊕⊕⊕⊕ high4,8,12, 13, 14 | We found no evidence that reducing total fat intake harms BP. It leads to small reductions in systolic and diastolic BP. | |
| Potential harms ‐ quality of life (QoL) | Mean change in usual fat group was 0.03 | Relative to control groups,QoL in the low fat arm was 0.04 higher (95% CI 0.01 to 0.07) on a scale of 0 to 10, where 0 is worst and 10 best QoL. | 40,130 (1 RCT) | ⊕⊕ΟΟ low15,16, 17,18,19 | We found no evidence that reducing total fat intake harms QoL. It may lead to small rises in QoL. | |
| *The basis for the assumed risk (e.g. the median control group risk across studies) is provided in footnotes. The corresponding risk (and its 95% confidence interval) is based on the assumed risk in the comparison group and the relative effect of the intervention (and its 95% CI). CI: confidence interval; RCT: randomised controlled trial | ||||||
| GRADE Working Group grades of evidence High quality: Further research is very unlikely to change our confidence in the estimate of effect. Moderate quality: Further research is likely to have an important impact on our confidence in the estimate of effect and may change the estimate. Low quality: Further research is very likely to have an important impact on our confidence in the estimate of effect and is likely to change the estimate. Very low quality: We are very uncertain about the estimate. | ||||||
1The median weight change in the control groups over the course of each study was ‐0.04 kg, ranging from ‐1.91 kg to 2.13 kg.
2Risk of bias: While most studies were unblinded for participants and allocation concealment was often unclear (as randomisation was described poorly), RCT results in adults were remarkably consistent in their direction. Sensitivity analyses removing studies not at low summary risk of bias did not lose the statistically significant relative weight reduction in the low fat arm, and neither did running fixed‐effect (rather than random‐effects) meta‐analysis or removing studies with attention bias favouring those in the low fat arm, or those with other interventions alongside the fat reduction. Together this suggests that the risk of bias was low. Not downgraded. 3Inconsistency: The direction of effects in these RCTs was remarkably consistent ‐ in almost every study, participants eating lower total fat intakes were lower in weight (on average) at the study end than participants eating a higher percentage of total fat. The only inconsistency (where heterogeneity arose) was in the size of this effect. The heterogeneity was partly explained by the degree of reduction of fat intake, by the BMI of participants, and by the level of control group fat intake, which together explained 16% of between‐study variance (in meta‐regression). The reduction in weight in those taking on lower fat diets was seen in very different populations and from six months to several years. It was also consistent when we excluded studies that gave additional support, time or encouragement to the low fat arms, and where we excluded studies that delivered additional dietary interventions (on top of the change in dietary fats). The results were consistent in direction, and much of the heterogeneity in the size of the effect was explained by the selected factors. Effects on body weight are supported by similar effects on BMI, waist circumference and percentage of body fat. Not downgraded. 4Indirectness: All included RCTs directly compared (and randomised participants) to lower versus usual fat intake. Participants were directly relevant as they came from all parts of the world, included men and women, and people who were healthy, with risk factors or with long‐term conditions at baseline. The studies all addressed weight directly and did not use proxy measures. Not downgraded. 5Imprecision: Over 50,000 participants were included in RCTs of at least six months duration, and effect sizes were highly statistically significant in main analyses and subgroups. There was little imprecision. If the true effect on weight was at either end of the 95% CI, we would interpret the effect in the same way. Not downgraded. 6Publication bias: The funnel plot did not suggest publication bias. The consistent weight loss was despite the fact that none of the studies included intended to alter weight in either arm, so that publication bias for this outcome is unlikely. Not downgraded. 7Dose response: Subgrouping and meta‐regression supported the presence of a dose‐response gradient ‐ greater reduction in total fat intake lead to greater weight loss. Not upgraded.
8Risk of bias: While most studies were unblinded for participants and allocation concealment was often unclear (as randomisation was described poorly), RCT results in adults were remarkably consistent in their direction. Sensitivity analyses removing studies not at low summary risk of bias were not performed, but individual studies at low summary risk of bias generally supported reductions in total and LDL cholesterol and little effect on HDL, TG, systolic and diastolic BP. This suggests low risk of bias. Not downgraded.
9Inconsistency: While I2 > 0.5 for total and LDL cholesterol, the direction of effects in these RCTs was consistent ‐ in almost every study participants eating lower total fat intakes had lower total and LDL cholesterol (on average) at the study end than participants eating a higher percentage of total fat. The inconsistency (where heterogeneity arose) was in the size of this effect. The results were consistent in direction. Effects on total and LDL cholesterol support each other. Not downgraded.
10Imprecision: Effect sizes for total and LDL cholesterol were highly statistically significant. There was little imprecision. If the true effect on either total or LDL cholesterol was at either end of the 95% CI, we would interpret the effect in the same way. Not downgraded.
11Publication bias: The funnel plots were difficult to interpret, but did not suggest publication bias. Not downgraded.
12Inconsistency: I2 < 0.10 for systolic and diastolic BP. Not downgraded.
13Imprecision: Effect sizes for systolic and diastolic blood pressure were statistically significant, suggesting small non‐clinically relevant reductions in BP. If the true effect on either systolic or diastolic BP was at either end of the 95% CI we would interpret the effect in the same way. Not downgraded.
14Publication bias: The funnel plots were difficult to interpret, but suggested that studies with smaller reductions, or small rises in BP may be missing. If such studies were added in, then the effect would move closer to zero. Not downgraded.
15Indirectness: The single very large trial was in women from the USA. Downgraded once.
16Risk of bias: The single very large trial was at low summary risk of bias. Not downgraded.
17Inconsistency: Single trial only, no inconsistency but no evidence of consistency. Downgraded once.
18Imprecision: The effect was statistically significant. Not downgraded.
19Publication bias: Not possible to assess with a single study. Not downgraded.
Background
Description of the condition
Optimal intakes of total fat were debated by the Joint Food and Agriculture Organization of the United Nations (FAO)/World Health Organization (WHO) expert consultation on fats and fatty acids in human nutrition in 2008. In light of the rising levels of overweight and obesity, particularly in low‐ and middle‐income countries undergoing rapid nutrition transition, this consultation agreed that any effect of total fat intake on body weight was pivotal in making global recommendations on total fat intake. Overweight and obesity are associated with increased risk of many cancers, coronary heart disease and stroke (Manson 1990; Song 2004; WCRF/AICR 2009).
How the intervention might work
A previous systematic review that aimed to assess effects of lower fat intake on body weight did not find any eligible randomised controlled trials (RCTs) (Kelly 2006), but we were aware of RCTs that had randomised participants to lower fat versus higher fat diets, and measured weight or BMI, not as the primary outcome of intervention, but as a process measure or intermediate outcome (Hooper 2012a; Hooper 2015a). Additionally, meta‐regression within a systematic review assessing RCTs on the effects of step I and II diets (diets designed by the National Heart, Lung and Blood Institute national cholesterol education programme to reduce the risk of cardiovascular disease in the general population and those at increased cardiovascular risk, respectively), found a strong relationship between total fat intake and body weight (Yu‐Poth 1999). This review, however, included studies that were as short as three weeks in duration and studies in which weight loss was a goal of the intervention, which may have overstated any relationship because the advice was to lower both fat and energy intake. It also excluded many trials of reduction in total fat intake that did not fit the step I or II criteria.
More recent reviews that have explored the long‐term effects of low fat diets either did not explore weight or body fatness as an outcome (Schwingshackl 2013), or looked at low fat intake as part of a wider health promotion intervention (Ni 2010). Other systematic reviews have explored the relationship between fat intake and body fatness but were either limited to the effect of low fat dairy versus high fat dairy consumption (Benatar 2013), or investigated it as part of overall dietary patterns (Ambrosini 2014), or diet quality (Aljadani 2015).
Why it is important to do this review
The WHO Nutrition Guidance Expert Advisory Group (NUGAG) subgroup on diet and health (www.who.int/nutrition/topics/advisory_group/nugag_dietandhealth_topics/en/) was requested by WHO to assess the relationship between total fat intake and body weight. This was to aid the WHO's understanding of this relationship and enable updating of WHO's guidelines on total fat intake. The expert advisory group aimed to generate a recommendation on the population impact of total fat intake in the development of obesity. The NUGAG group agreed to exclude studies of populations recruited specifically for weight loss and interventions intended to result in weight loss. These studies are potentially confounded by the implicit objective of reducing calorie intake to produce weight loss and might therefore lead to an overemphasis on studies carried out in highly selected obese populations in North America and Europe, which may have limited transferability to non‐obese populations or those in developing countries or in countries in transition.
To fulfil the requirements for the new guideline, a systematic review was needed of all available evidence of the longer‐term effects of total fat intake on body fatness, in studies not intending to cause weight loss. The WHO therefore commissioned a systematic review and meta‐analysis to assess the relationship between total fat intake and indicators of body fatness (including obesity, waist circumference and body mass index) using all appropriate RCTs and cohort studies in adults and children (Hooper 2012b), which was updated in 2015 (Hooper 2015a). This update of the review focusses on RCTs in adults, and a companion review assesses effects in children (Naude 2018).
Objectives
To assess the effects of proportion of energy intake from fat on measures of weight and body fatness (including body weight, waist circumference, body mass index and percentage of body fat) in adults not aiming to lose weight, using all appropriate RCTs with a duration of at least six months.
Methods
Criteria for considering studies for this review
Types of studies
We aimed to include randomised controlled trials (RCTs) in adults aged at least 18 years. They needed to assess effects of reduced fat intake compared with higher fat intake with no intention to reduce weight (in any participants in either or both arms). Trials needed to have a minimum duration of six months, be unconfounded by non‐nutritional interventions and assess a measure of body fatness at least six months after the intervention was initiated.
Randomisation of individuals was accepted, or of larger groups where there were at least six of these groups (clusters) randomised. We excluded studies where allocation was not truly randomised (e.g. divisions based on days of the week or first letter of the family name were excluded) or where allocation was not stated as randomised (and no further information was available from the authors). We excluded cross‐over studies (as previous weight gain or weight loss is likely to affect future weight trends) unless the first half of the cross‐over could be used independently.
We included full‐text studies, those published as abstracts only, and unpublished data. We did not include cohort studies in this update.
Types of participants
We accepted studies of adults (≥ 18 years, no upper age limit) at any risk of cardiovascular disease (with or without existing cardiovascular disease). Participants could be of either sex, but we excluded those who were acutely ill (including with immunity problems such as HIV or post‐transplant), pregnant or lactating. We excluded intervention studies where participants were chosen for raised weight or body mass index (as most appeared to aim to reduce body weight within interventions, even when this was not explicitly stated in the intervention goals).
Types of interventions
We considered all randomised controlled trials (RCTs) of interventions stating an intention to reduce dietary fat, when compared with a higher (usual or modified fat) intake.
We considered a low fat intake to be one that aimed to reduce fat intake to ≤ 30% energy (≤ 30%E) from fat, and at least partially replace the energy lost with carbohydrates (simple or complex), protein or fruit and vegetables. We considered a higher fat diet to be one that aimed to include > 30% energy from total fats. The higher fat arm could be "usual dietary intake", specifying a higher total fat intake, or one aiming to modify the type of fats consumed (such as increasing mono‐unsaturated or poly‐unsaturated fats).
As we were interested in the effects of fat intake on body weight and fatness in everyday dietary intake (rather than in people aiming to reduce their body weight in weight‐reducing diets), we excluded studies aiming to reduce the weight of some or all participants, as well as those that included only participants who had recently lost weight, or recruited participants according to a raised body weight or BMI. We excluded multifactorial interventions other than diet or supplementation (unless the effects of diet or supplementation could be separated, such as in a 2 x 2 trial where the additional intervention was consistent between the intervention and control groups). We excluded Atkins‐type diets aiming to increase protein and fat intake, as well as studies where fat was reduced by means of a fat substitute (like Olestra). We excluded enteral and parenteral feeds, as well as formula weight‐reducing diets.
Examples
The following are some examples of the types of studies we would include or exclude based on their intervention and comparison groups. We included studies that reduced fats and encouraged physical activity in one arm and compared this with encouraging physical activity in the control. We excluded studies that reduced fats and encouraged physical activity in one arm and compared this with no intervention in the control. We included studies that reduced fats and encouraged fruit and vegetables in one arm and compared this with no intervention in the control.
We included all trials that intended to reduce dietary fat to ≤ 30%E in one arm compared to higher fat intake (> 30%E from fat) in another arm regardless of the degree of difference between fat intake in the two arms (dose). We explored the effects of the difference in %E from fat between control and intervention groups, as well as the effects of fat intake in the control groups and dietary fat goals in the intervention groups, in subgrouping and meta‐regression.
Types of outcome measures
Primary outcomes
The main outcome was body fatness assessed using a variety of measures. These included body weight, body mass index, waist circumference, skinfold thickness and percentage fat. Studies had to assess or report at least one of these measures, or a change in these measures, to be included in the review. Measures of body fatness needed to be assessed at least six months after the intervention was initiated, and data at trial end, or from the latest available time during the trial, were used.
Secondary outcomes
Secondary outcomes included other classic cardiovascular risk factors (systolic or diastolic blood pressure; serum total, low density lipoprotein (LDL) or high density lipoprotein (HDL) cholesterol, and triglyceride) and quality of life measures (including informal outcomes such as feelings of health and time off work). They were included in the review to assess any possible harms of reducing total fat on quality of life or cardiovascular risk factors.
Tertiary outcomes
Tertiary outcomes were process outcomes and included changes in saturated and total fat intakes, as well as other macronutrients, sugars and alcohol.
This is not a systematic review of the effects of reduced fat on these secondary or tertiary outcomes, but we collated the outcomes from included studies in order to understand whether any effects on weight might be compromised by negative effects on secondary or tertiary outcomes.
Search methods for identification of studies
Electronic searches
The searches for this review were last run in November 2014 as part of a broader review (Hooper 2015a). As the review has now been split and the previous search strategy was unsuitable, a new strategy was run on 18 October 2019, from database inception, in the following databases:
CENTRAL (Issue 10 of 12, 2019, Cochrane Library)
Epub Ahead of Print, In‐Process & Other Non‐Indexed Citations, MEDLINE Daily and MEDLINE (Ovid, 1946 to October 17, 2019)
Embase (Ovid, 1980 to 2019 week 41)
Two clinical trials registers were also searched on 18 October 2019; Clinicaltrials.gov (https://clinicaltrials.gov/) and WHO International Clinical Trials Registry Platform (ICTRP, https://apps.who.int/trialsearch/). The searches are described in Appendix 1. The RCT filter for MEDLINE is the Cochrane sensitivity and precision‐maximising RCT filter (Lefebvre 2011), and for Embase, terms as recommended in the Cochrane Handbook have been applied (Lefebvre 2011).
The results were de‐duplicated against each other. As we were updating another Cochrane review relating to dietary fat (Hooper 2015b) at the same time, results of the searches for both reviews were combined and de‐duplicated before assessment of titles and abstracts.
The search to 2014 is described in Hooper 2015a, and previous searches (to June 2010) in Hooper 2012b.
Searching other resources
We searched for recent and additional publications of all our included studies, using trials registry entries (for outcome data and publication lists), searching on trials registry numbers, and tracking key authors, to ensure the best and most complete information was available for all our included studies. We also checked reference lists of included studies and looked for retraction statements and errata.
Data collection and analysis
Selection of studies
Titles and abstracts identified by searches were loaded into Covidence software, and all authors took part in assessment of titles and abstracts. We only rejected articles on initial screen if the review author could determine from the title and abstract that the article was not a relevant RCT. We rejected articles if they were not reporting a RCT; the trial did not address a low fat intake; the trial was exclusively in children (less than 18 years old), pregnant women or the critically ill; participants were chosen for being overweight or obese; there was an intention to reduce weight in some or all participants; the trial was of less than six months duration; or the intervention was multifactorial.
When a title/abstract could not be rejected with certainty, we obtained the full text of the article for further evaluation.
Data extraction and management
We extracted data concerning participants, interventions and outcomes, and trial quality characteristics onto a form designed for the review. We extracted data on potential effect modifiers (including duration of intervention, control group fat intake, sex, year of first publication, difference in % energy from fat between the intervention and control groups, type of intervention (food or advice provided), the dietary fat goals set for each arm, baseline BMI and health at baseline). Where provided, we collected data on risk factors for cardiovascular disease (secondary and tertiary outcomes).
All trial outcomes were continuous and, where possible, we extracted change data (change in the outcome from baseline to outcome assessment) with relevant data on variance for intervention and control arms (along with numbers of participants at that time point). Where change data were not available, we extracted data at study end (or other relevant time point) along with variance and numbers of participants for each arm. LH, OFJ and AA assessed inclusion of full‐text studies independently in duplicate, and discussed disagreements until agreement was reached (including the third member of the team where needed).
Assessment of risk of bias in included studies
We carried out 'Risk of bias' assessment independently in duplicate as part of data extraction. We assessed trial risk of bias using the Cochrane 'Risk of bias' tool (Higgins 2011b). For included RCTs, in addition to the tool's domains, we assessed whether:
trials were free of differences in diet (between intervention and control arms) other than dietary fat intake;
there was any systematic difference in attention or care or time given between the intervention and control groups; and
there was evidence that the two arms achieved statistically significant differences in total fat intake (compliance).
These issues were chosen as we felt that these factors may also affect differences in weight between arms. We used the category 'other bias' to note any further issues of methodological concern. Funding was not formally a part of our assessment of bias in RCTs as it is not a core part of the Cochrane 'Risk of bias' tool, but was reported in the Characteristics of included studies.
We assessed each trial for summary risk of bias. Summary risk of bias was considered low in trials with low risk of selection bias (low risk from random sequence generation and allocation concealment) and low risk of detection bias. Summary risk of bias was considered moderate to high in all other included trials.
Measures of treatment effect
The effect measure of choice for continuous outcomes (all review outcomes were continuous outcomes) was the mean difference (MD) with its 95% confidence interval.
Unit of analysis issues
We did not include any cluster‐randomised or cross‐over trials in this review.
Where there was more than one relevant intervention arm but only one control arm we pooled the relevant intervention arms to create a single pairwise comparison (where the intervention arms were equivalently appropriate for this review) as described in Higgins 2011a. We excluded intervention arms that were not appropriate for this review, or less appropriate than another arm. When two arms were appropriate for different subgroups. then we used the control group once with each intervention arm, but we did not pool the subgroups overall.
When weight or BMI were assessed at more than one time point, we used the data from the latest time point available in general analyses, but we extracted data for all time points for use in subgrouping by study duration.
Dealing with missing data
Where included studies used methods to infer missing data (such as carrying the latest weight data forward), then we used these data in analyses. Where this was not done we used the data as presented.
Assessment of heterogeneity
We examined heterogeneity using the I2 statistic and considered heterogeneity important where the I2 was above 50% (Higgins 2003; Higgins 2011a).
Assessment of reporting biases
We drew funnel plots to examine the possibility of publication bias for measures of body fatness with at least 10 included comparisons (Egger 1997). We also compared findings of fixed‐ and random‐effects meta‐analysis since the two methods weight small trials differently, and different effect sizes suggest potential small study bias (Page 2019).
Data synthesis
All trial outcomes were continuous and, where possible, we extracted change data (change in the outcome from baseline to outcome assessment) with relevant data on variance for intervention and control arms (along with numbers of participants at that time point). Where change data were not available, we extracted data at study end (or other relevant time point) along with variance and numbers of participants for each arm. We did not use end data where the difference between the intervention and control groups at baseline was greater than the change in that measure between baseline and endpoint in both arms (instead we used change data in forest plots, but without standard deviations (SDs), so the data did not add to the meta‐analyses but provided comparative information).
We combined data by the inverse variance method in random‐effects meta‐analysis (RevMan 2014) to assess mean differences with 95% confidence intervals between lower and higher fat intake arms.
Summary of findings
We created a 'Summary of findings' table assessing the effects of low dietary fat compared with usual fat for body fatness (combining data on body weight, BMI, waist circumference and percentage body fat, which all assess body fatness) in adults using RCT data, reflecting GRADE assessment of quality of our findings.
Subgroup analysis and investigation of heterogeneity
We classified all dietary interventions as lower fat versus higher fat. Prespecified subgroups for body weight, to explore the stability of findings in different study subgroups, included:
duration of intervention (6 to < 12 months, 12 to < 24 months, 24 to < 60 months, and 60+ months);
control group total fat intake (> 35%E from fat, > 30%E to 35%E from fat, > 25%E to 30%E from fat). Control group fat intake is equivalent to baseline fat intake;
year of first publication of results (1960s, 1970s, 1980s, 1990s, 2000s, 2010s);
sex (studies of women only, of men only, of men and women mixed);
difference in %E from fat between control and reduced fat groups (up to 5%E from fat, 5%E to < 10%E from fat, 10%E to < 15%E from fat, 15+%E from fat, or unknown difference);
type of intervention (dietary advice, advice plus supplements and diet provided);
total fat goal in the intervention arm (10%E to < 15%E from fat, 15%E to < 20%E from fat, 20%E to < 25%E from fat, 25%E to < 30%E from fat, 30%E from fat, and no specific goal stated);
achieving fat goals (achieved 30%E from fat or less, did not achieve this);
mean BMI at baseline (< 25, 25 to < 30, 30+);
state of health at baseline (not recruited on the basis of risk factors or disease, recruited on the basis of risk factors such as lipids, hormonal levels etc., recruited on the basis of having or having had diseases such as diabetes, myocardial infarction, cancer, polyps);
assessed energy reduction in the intervention compared with the control group during the intervention period (E intake the same or greater in the low fat group, E intake 1 to 100 kcal/d lower in the low fat group, 101 to 200 kcal/d lower in the low fat group, > 200 Kcal/d lower in the low fat group).
For subgrouping factors that appeared to suggest significant differences in effect size between subgroups, we explored the effects using meta‐regression on weight. We performed random‐effects meta‐regression (Berkley 1995) using the STATA command metareg (Sharp 1998; Sterne 2001; Sterne 2009).
Sensitivity analysis
We carried out sensitivity analyses for primary outcomes, assessing the effect of:
running fixed‐effect meta‐analyses (rather than random‐effects) (Higgins 2011a);
excluding studies not at low summary risk of bias
excluding the largest study (WHI 2006);
excluding studies that were not free of systematic differences in care (or unclear);
excluding studies that were not free of dietary differences other than fat (or unclear)
Results
Description of studies
Results of the search
For this update, the electronic searches identified 15,314 possible titles and abstracts (including trials registry entries) for assessment for this review and the sister review being updated (Hooper 2015a). Of these, 14,784 were rejected on title and abstract screening, and 530 were collected in full text for further assessment. Seventy‐three full‐text publications were included or assessed as pending, and these were grouped into seven new included RCTs (AUSMED 2018; CORDIOPREV 2016; Ma 2016; ODMDC 2017; RISCK 2010; WHT Full‐scale; Yadav 2016 including 3584 randomised participants), three ongoing RCTs, six RCTs awaiting further assessment (as existing details were not sufficient to ensure inclusion), and 18 new publications for eight already included RCTs. One previously included trial was excluded (Sondergaard 2003) during reassessment as it was felt on reflection that it was highly unlikely either arm aimed at < 30% E from fat. Combining with the 30 RCTs already included means that this review includes 37 RCTs, three ongoing RCTs and a further six RCTs are awaiting assessment (Figure 1).
1.

Study flow diagram
We included all 37 RCTs in forest plots. Twenty‐nine RCTs provided full information on at least one body fatness outcome and so were included in meta‐analytic pooling. Eight RCTs only provided partial data so are displayed in forest plots (Analysis 1.2; Analysis 1.3; Analysis 1.4; Analysis 2.7) but not included in meta‐analysis. They are displayed to allow us to assess whether these results support or detract from meta‐analytic findings (AUSMED 2018; beFIT 1997; Black 1994; MeDiet 2006; NDHS Open 1st L&M 1968; NDHS Open 2nd L&M 1968; Rivellese 1994).
1.2. Analysis.

Comparison 1: Lower fat vs higher fat diet, Outcome 2: BMI, kg/m2
1.3. Analysis.

Comparison 1: Lower fat vs higher fat diet, Outcome 3: Waist circumference, cm
1.4. Analysis.

Comparison 1: Lower fat vs higher fat diet, Outcome 4: Body fat, %
2.7. Analysis.

Comparison 2: Lower fat vs higher fat diet on body weight, sensitivity analyses, Outcome 7: Weight, kg including partial data
Included studies
Of the 37 RCTs (including up to 57,079 participants ‐ exact numbers depending on time point in study and endpoint used), 24 were from North America, 10 from Europe, two from Australia or New Zealand, and one from China. The duration of the trials varied from six months to more than eight years. In four trials, the participants were all men, in 16 all women and in 17 both sexes (one of which reported outcomes by sex). Mean ages and states of health (low, moderate or high risk of cardiovascular disease or breast cancer, where low risk are people without specific risk factors, moderate risk people have risk factors, and those at high risk have experienced CVD or cancer) varied. See Characteristics of included studies for detailed characteristics of the RCTs.
When discussing the 37 RCTs, De Bont 1981 and DEER 1998 are referred to and counted as single studies, although individual arms appear in analyses (data were presented by body weight at baseline for De Bont 1981, and by sex and exercise prescription for DEER 1998). This is because this was how the data were presented in the original papers for these trials and the different arms occasionally appear in different subgroups (making subgrouping more effective). However, Sarkkinen Low & Mod 1993 and Sarkkinen Low Fat 1993 had four distinct dietary arms that worked as two intervention/control pairs, so are presented as separate trials.
As well as the addition of the seven new trials, new publications were located for some already included trials. These allowed updating of three already included trials and addition of new outcome data (WHEL 2007; WHI 2006; WHTFSMP 2003).
Excluded studies
During this update, we added seven new trials to the list of excluded studies (Cocinar para su salud 2016; DIRECT 2009; Drummond 1998; Eckard 2013; HIPERCOL 2018; Nutri‐EPA 2017; Troyer 2010). They were excluded for an inappropriate intervention or control (Cocinar para su salud 2016; Drummond 1998; HIPERCOL 2018; Troyer 2010; Nutri‐EPA 2017) or because the study aimed to reduce weight in some or all participants (DIRECT 2009; Eckard 2013).
Risk of bias in included studies
To understand the risk of bias in the individual included RCTs in a visual way, see Figure 2. Risk of bias is reported by included arms (so Sarkkinen Low & Mod 1993 and Sarkkinen Low Fat 1993 are reported separately), so are discussed as 38 RCT arms.
2.

'Risk of bias' summary: review authors' judgements about each methodological quality item for each included adult and child RCT comparison.
Allocation
Twenty‐nine RCT arms had low risk of bias from random sequence generation (as they provided some information on the method of randomisation, suggesting true randomisation was performed in some way); the remainder were at unclear risk. Thirteen RCT arms were at low risk of selection bias (arising from low risk from allocation concealment and randomisation), and the remaining RCTs were at unclear risk.
Blinding
There was a high risk of performance bias due to lack of blinding of participants (which is usual in dietary trials) in 36 included RCTs, and low risk in one of the National Diet and Heart Studies (NDHS Open 1st L&M 1968), which provided trial shops that blinded purchases of usual or low fat products. The risk of detection bias was low in eight trials, high in eight trials, and unclear in the remainder.
Summary risk of bias was low in five included trials (CORDIOPREV 2016; Ma 2016; NDHS Open 1st L&M 1968; ODMDC 2017; WHI 2006) ‐ trials with low risk of selection bias (low risk from random sequence generation and allocation concealment) and low risk of detection bias.
Incomplete outcome data
For RCTs, we assessed those studies that lost more than 10% of participants per year as at high risk of attrition bias; others were at low risk of attrition bias. Sixteen RCT arms were at low risk of attrition bias, 19 were at high risk of attrition bias and three were unclear.
Selective reporting
Most RCTs were at unclear risk of reporting bias (due to the paucity of accessible and prospective trial registrations and protocols, so that we could not assess reporting bias), but six RCT arms were at low risk and five at high risk of bias.
Other potential sources of bias
We considered all RCTs to be at low risk of other types of bias, except for WHT Full‐scale which was terminated early, before many participants had outcomes measured, and is poorly reported.
Thirteen RCT arms had low risk of systematic differences in level of care between the intervention and control groups, while 25 had high risk of such differences in care. Differences in attention, training, time from health professionals, number of health checks and/or group support could potentially alter feelings of self efficacy and increase contact with healthcare professionals offering various types of support, and alter participants' ability to look after themselves and maintain a healthy weight.
Some dietary interventions to reduce fat also had specific goals around fruit, vegetables, fibre, alcohol etc., which raises the possibility that any changes in weight may result from these alterations, not from change in fat intake. Eleven RCT arms were at high risk of effects from dietary differences other than fat; two were unclear and the remaining 25 RCTs were at low risk of effects from other dietary advice.
We assessed studies to be at low risk of compliance problems if there was a statistically significant difference in total fat intake during the intervention period (as late as possible during the intervention). We found that 25 trial arms were at low risk, four at high risk and 9 at unclear risk of compliance problems.
Effects of interventions
See: Table 1
The 'Summary of findings' table assessing the effects of lower dietary fat compared with higher dietary fat intake for body weight, and including the GRADE assessment, is presented (Table 1).
Effects of reducing dietary fat on weight and body fatness in adults
Body fatness
Body fatness was measured in this review with body weight, BMI, waist circumference and percentage body fatness. Effects on each of these specific measures are reported below. Combining data on all of these measures, we found that eating a lower proportion of energy as fat results in slightly lower body fatness than eating the usual proportion of fat (GRADE assessment: high‐quality evidence, not downgraded).
Weight
Eating a lower proportion of energy as fat results in lower body weight (or lower weight gain, or greater weight reduction) than eating the usual proportion of fat (MD ‐1.4 kg, 95% confidence interval (CI) ‐1.7 to ‐1.1, I2 = 75%, 53,875 participants, 33 estimable comparisons from 26 RCTs, Analysis 1.1, high‐quality evidence). The effect was small and consistent; the best estimate of effect was a reduction in weight in the lower fat arm consistently across 30 of the 33 comparisons.
1.1. Analysis.

Comparison 1: Lower fat vs higher fat diet, Outcome 1: Weight, kg
Sensitivity analyses. We ran sensitivity analyses to assess effects of lower fat intake on body weight when analyses were run using different assumptions. Effects using fixed‐effect meta‐analysis (‐0.9 kg, 95% CI ‐1.1 to ‐0.8, Analysis 2.1), including only trials at low summary risk of bias (‐0.7 kg, 95% CI ‐0.8 to ‐0.5, Analysis 2.2), excluding the largest trial, WHI 2006 (‐1.5 kg, 95% CI ‐1.9 to ‐1.2, Analysis 2.3), excluding trials with more time or attention to the intervention group (‐0.9 kg, 95% CI ‐1.2 to ‐0.6, Analysis 2.4), excluding trials with dietary differences additional to fat differences (‐1.6 kg, 95% CI ‐2.1 to ‐1.2, Analysis 2.5) or excluding studies with potential compliance problems (‐1.6 kg, ‐1.9 to ‐1.2, Analysis 2.6) all suggested lower weight in study populations eating lower fat diets.
2.1. Analysis.

Comparison 2: Lower fat vs higher fat diet on body weight, sensitivity analyses, Outcome 1: Weight, kg SA fixed effects
2.2. Analysis.

Comparison 2: Lower fat vs higher fat diet on body weight, sensitivity analyses, Outcome 2: Weight, kg SA including only RCTs at low summary RoB
2.3. Analysis.

Comparison 2: Lower fat vs higher fat diet on body weight, sensitivity analyses, Outcome 3: Weight, kg SA excluding the largest trial, WHI
2.4. Analysis.

Comparison 2: Lower fat vs higher fat diet on body weight, sensitivity analyses, Outcome 4: Weight, kg SA excluding RCTs not free of systematic differences in care
2.5. Analysis.

Comparison 2: Lower fat vs higher fat diet on body weight, sensitivity analyses, Outcome 5: Weight, kg SA excluding studies not free of dietary differences other than fat
2.6. Analysis.

Comparison 2: Lower fat vs higher fat diet on body weight, sensitivity analyses, Outcome 6: Weight, kg SA excluding studies with potential compliance problems
Small study bias and missing data. The funnel plot suggested that one or two small studies showing weight gain in the lower fat arm may be missing (Figure 3). The effect of adding any such missing studies back into the meta‐analysis would be a small reduction in amount of weight loss in lower fat arms. All of the nine comparisons without an estimable effect size, due to lack of variance data or large baseline differences, were consistent with greater weight reduction in the reduced fat arms (Analysis 2.7). As the effect in fixed‐effect analysis, which gives less weight to small studies (‐0.9 kg, 95% CI ‐1.1 to ‐0.8, Analysis 2.1), is smaller than the effect in random‐effects meta‐analysis (‐1.4 kg, 95% CI ‐1.7 to ‐1.1, Analysis 1.1), which gives more weight to smaller studies, there is a suggestion of small study bias in the overall effect size. The weight reduction with reduced fat intake is still present, but may be closer to ‐0.9 kg (Analysis 2.1) than ‐1.4 kg.
3.

Funnel plot of comparison: 1 Fat reduction versus usual fat diet, outcome: 1.1 Weight, kg.
Subgrouping. Heterogeneity was high (I2 = 75%) but only in the degree of weight loss ‐ lower weight in the lower fat arm was remarkably consistent across the included trials. Subgrouping may be able to explain why effects differ in different trials. We used prespecified subgroups to examine the influence of potential effect modifiers of fat intake on body weight. There were significant differences between effects in subgroups of different duration, suggesting that greatest effects on body weight may occur 12 to 24 months from first reducing fat intake, but without any clear progression and with weight reduction in all subgroups (Analysis 3.1). Subgrouping by baseline total fat intake suggested greatest weight reduction in study populations with lower fat intakes at baseline (25 to 30%E from fat), but again, with weight reductions in all subgroups and no clear progression (Analysis 3.2). There were no statistically significant differences between studies first published in different decades, and no suggestion of trend (Analysis 3.3), or between effects in men and women (Analysis 3.4). In trials with a greater difference in fat intake between arms, there appeared to be a greater relative weight reduction in study populations taking the lower fat diet, suggesting a dose effect, with statistically significant differences between subgroups (Analysis 3.5). Similarly, weight reduction was greater when the lower fat arm achieved total fat intake of 30%E or less (Analysis 3.6). Effects differed by intervention type, with greatest weight reduction resulting from dietary advice, less from advice plus supplementary foods, and least (MD ‐0.61 kg, 95% CI ‐0.84 to ‐0.39, Analysis 3.7) when all foods were provided. Effects also differed by subgroup of the fat goal in the lower fat arm, but did not suggest a dose response (Analysis 3.8). There was no statistically significant difference between subgroups with different mean baseline BMI, but there was a suggestion of greater weight loss with higher baseline BMI (Analysis 3.9), but people recruited for having a long‐term condition, or risk factors for such a condition appeared to lose more weight than those who were healthy at baseline (Analysis 3.10). In trials where lower fat arm participants were assessed as eating fewer calories, weight loss appeared higher, as expected (Analysis 3.11). Weight loss occurred in all subgroups, but the degree of weight loss appeared higher when study populations reduced their fat intake to a greater extent, to 30%E energy or less, with lower fat intake at baseline, in people who were heavier at baseline, and those with long‐term conditions or risk factors for such conditions.
3.1. Analysis.

Comparison 3: Lower fat vs higher fat diet on body weight, subgrouping, Outcome 1: Weight, kg Subgrouping by trial duration
3.2. Analysis.
Comparison 3: Lower fat vs higher fat diet on body weight, subgrouping, Outcome 2: Weight, kg Subgrouping by baseline fat intake
3.3. Analysis.

Comparison 3: Lower fat vs higher fat diet on body weight, subgrouping, Outcome 3: Weight, kg Subgrouping by decade of first publication
3.4. Analysis.

Comparison 3: Lower fat vs higher fat diet on body weight, subgrouping, Outcome 4: Weight, kg Subgrouping by sex
3.5. Analysis.
Comparison 3: Lower fat vs higher fat diet on body weight, subgrouping, Outcome 5: Weight, kg Subgrouping by difference in %E from fat between control & reduced fat groups
3.6. Analysis.

Comparison 3: Lower fat vs higher fat diet on body weight, subgrouping, Outcome 6: Weight, kg Subgrouping by achieving < 30%E from fat
3.7. Analysis.

Comparison 3: Lower fat vs higher fat diet on body weight, subgrouping, Outcome 7: Weight, kg Subgrouping by type of intervention
3.8. Analysis.

Comparison 3: Lower fat vs higher fat diet on body weight, subgrouping, Outcome 8: Weight, kg Subgrouping by lower fat arm fat goal
3.9. Analysis.

Comparison 3: Lower fat vs higher fat diet on body weight, subgrouping, Outcome 9: Weight, kg Subgrouping by mean BMI at baseline
3.10. Analysis.
Comparison 3: Lower fat vs higher fat diet on body weight, subgrouping, Outcome 10: Weight, kg Subgrouping by baseline health status
3.11. Analysis.

Comparison 3: Lower fat vs higher fat diet on body weight, subgrouping, Outcome 11: Weight, kg Subgrouping by assessed energy reduction
Meta‐regression. In light of the subgrouping results, we ran a multiple regression model on dose, BMI, baseline health and control group (baseline) fat intake, all at once. As we included only 33 comparisons (and as a rule of thumb it is appropriate to include an additional factor for every 10 comparisons), we then omitted the factor with the highest P value (health condition, P = 0.44) and re‐ran the meta‐regression with the final three factors. This suggested statistically significant relationships with all three factors: dose (the fat difference between intervention and control, suggesting that greater fat reduction results in greater weight reduction in the lower fat arm, coefficient ‐0.20 kg/1% energy from total fat reduction, 95% CI ‐0.34 to ‐0.06, P = 0.007); the baseline fat intake (assessed in the control arm, greater weight reduction in people with lower fat intake at baseline, coefficient 0.17 kg/1% energy from fat in the control group, 95% CI 0.04 to 0.29, P = 0.010); and BMI (greater weight reduction in those with higher BMI at baseline, coefficient ‐0.2 kg for each 1 kg/m2 rise in BMI, 95% CI ‐0.39 to ‐0.004, P = 0.046). Together these factors explained 16% of variance between studies.
GRADE: GRADE assessment suggested that the evidence that reducing total dietary fat results in a small decrease in body weight was of high quality (Table 1).
Body mass index (BMI), waist circumference and other measures of body fatness
Fewer studies reported BMI than weight, but the effect of a lower proportion of energy from fat on BMI appeared similar to that on weight (MD ‐0.5 kg/m2, 95% CI ‐0.6 to ‐0.3, I2 = 60%, 46,539 participants, 15 comparisons, Analysis 1.2). A point estimate suggesting lower BMI in the lower fat arms was consistent across 13 of the 15 comparisons, including one trial that could not be included in meta‐analysis due to a lack of data on variance (AUSMED 2018, which reported ‐0.1 kg/m2 in the intervention group compared to 0 kg/m2 in the control, in 65 participants but without any variance data). As BMI reflects very similar information to body weight, and there were fewer studies than for weight, we did not attempt sensitivity analyses and subgrouping for BMI.
Data on waist circumference suggested that waist circumference in those on low fat diets was significantly lower than in those on usual fat diets (MD ‐0.5 cm, 95% CI ‐0.7 to ‐0.2, I2 = 21%, 16,620 participants in 3 trials, Analysis 1.3), although this was not supported in the trial that did not provide variance data so could not be included in meta‐analysis (AUSMED 2018, which reported a mean reduction of 0.4 cm in the lower fat group, and a reduction of 1.1 cm in the control group). Data on percentage of body fat suggested lower percentage of body fat in those eating less dietary fat, but was only marginally significant (MD ‐0.3% body fat, 95% CI ‐0.6 to 0, P = 0.05, I2 = 0%, 2350 participants in 2 trials, Analysis 1.4), though data were more limited on this outcome, from only 3 trials, one of which did not provide variance data (AUSMED 2018, which reported a mean reduction of 0.4% in the lower fat group compared to a reduction of 0.6% in the control).
In summary, other indicators of body fatness support data suggesting lower body weight in those consuming lower fat intakes.
Secondary outcomes ‐ lipids and blood pressure
There was no suggestion of harms associated with low fat diets that might mitigate any benefits on body fatness.
Effects of lower fat compared with higher fat diets suggested that the lower fat diets were associated with lower total cholesterol (MD ‐0.23 mmol/L, 95% CI ‐0.32 to ‐0.14, I2 = 72%, 9812 participants in 22 trials, Analysis 1.5) and low‐density lipoprotein (LDL) cholesterol (MD ‐0.13 mmol/L, 95% CI ‐0.21 to ‐0.05, I2 = 57%, 8072 participants in 18 trials, Analysis 1.6), without important effects on high‐density lipoprotein (HDL, MD ‐0.02 mmol/L, 95% CI ‐0.03 to 0.00, I2 = 23%, 8268 participants in 19 RCTs, Analysis 1.7), triglycerides (MD 0.01 mmol/L, 95% CI ‐0.05 to 0.07, I2 = 50%, 8607 participants in 17 trials, Analysis 1.8) or total cholesterol/HDL ratio (MD ‐0.05, 95% CI ‐0.14 to 0.04, I2 = 44%, 3639 participants in 5 trials, Analysis 1.9).
1.5. Analysis.

Comparison 1: Lower fat vs higher fat diet, Outcome 5: Total cholesterol, mmol/L
1.6. Analysis.

Comparison 1: Lower fat vs higher fat diet, Outcome 6: LDL cholesterol, mmol/L
1.7. Analysis.

Comparison 1: Lower fat vs higher fat diet, Outcome 7: HDL cholesterol, mmol/L
1.8. Analysis.

Comparison 1: Lower fat vs higher fat diet, Outcome 8: Triglycerides, mmol/L
1.9. Analysis.

Comparison 1: Lower fat vs higher fat diet, Outcome 9: Total cholesterol/HDL
There were small clinically insignificant beneficial effects of a lower fat diet on systolic (‐0.75 mmHg, 95% CI ‐1.42 to ‐0.07, I2 = 9%, 6013 participants in nine comparisons, Analysis 1.10) and diastolic (‐0.52 mmHg, 95% CI ‐0.95 to ‐0.09, I2 = 7%, 6012 participants in nine comparisons, Analysis 1.11) blood pressure (these were reported in relatively few studies).
1.10. Analysis.

Comparison 1: Lower fat vs higher fat diet, Outcome 10: Systolic blood pressure, mmHg
1.11. Analysis.

Comparison 1: Lower fat vs higher fat diet, Outcome 11: Diastolic blood pressure, mmHg
Secondary outcomes ‐ effects of reducing fat intake on quality of life measures
Quality of life outcomes were rarely measured or reported. Quality of life was assessed in WHI 2006 and suggested very small improvements in Global Quality of Life in those in the lower fat arm compared to higher fat (MD 0.04, 95% CI 0.01 to 0.07, on a scale of 0 to 10, where 0 is worst and 10 best, in 40,130 participants at trial close, Analysis 1.12). No other relevant data were located.
1.12. Analysis.
Comparison 1: Lower fat vs higher fat diet, Outcome 12: Quality of life
Tertiary outcomes ‐ effects of reducing fat intake on intakes of energy, protein, carbohydrate, sugars and alcohol
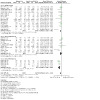
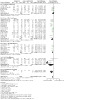
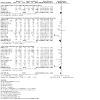
Indications were that, during the studies, energy intake was usually lower in the low fat group than in the control or usual fat groups. Sugar intake was not measured often but, where reported, sugar intake appeared higher in low fat arms (except in MeDiet 2006, see Table 2). Carbohydrate intakes appeared almost universally higher in low fat arms than in usual fat arms, and protein intakes were sometimes higher and sometimes similar. There was no consistent pattern in alcohol intake.
1. Dietary intake of energy, sugars, carbohydrate and protein during trials.
| Trial | Energy intake (SD), kcal | Sugars intake, %E | CHO intake, %E | Protein intake, %E | Alcohol intake, %E | No. of participants | ||||||
| Int. | Cont | Int. | Cont | Int. | Cont | Int. | Cont | Int. | Cont | Int. | Cont | |
| Anderson 1990, 1 yr | 1882 (521) | 2010 (528) | — | — | 53 (8.9) | 50 (7.9) | 17 (3.4) | 18 (4.3) | — | — | 47 | 51 |
| AUSMED 2018, 6 mo | 1800 (541) | 2014 (461) | 5.7 (4.1) | 5.4 (4.4) | 42.5 (7.1) | 34.8 (7.2) | 21.8 (5.8) | 19.4 (4.2) | 1.1 (2.4) | 3.0 (4.1) | 31 | 34 |
| BDIT Pilot Studies 1996, 9 yrs | 1460 (376) | 1578 (365) | — | — | 49.6 (7.5) | 46.9 (6.2) | 15.5 (2.4) | 15.3 (2.6) | 2.3 (3.3) | 1.7 (2.4) | 76 | 81 |
| beFIT 1997 | (data not reported in control groups) | |||||||||||
| Black 1994, during trial | 1995 (564) | 2196 (615) | — | — | 60.3 (6.3) | 44.6 (6.9) | 17.7 (2.2) | 15.7 (2.4) | 3.2 (3.4) | 3.2 (3.9) | 57? | 58? |
| Bloemberg 1991, Δ to 6 mo | — | — | — | — | 4.4 (6.5) | 1.2 (6.1) | 0.33 (2.9) | 0.57 (1.7) | — | — | 39 | 41 |
| Boyd 1988, 6 mo | 1491 (NR) | 1676 (NR) | — | — | 56.3 (NR) | 48.1 (NR) | 17.9 (NR) | 15.8 (NR) | 4.8 (NR) | 4.2 (NR) | 10 | 9 |
| BRIDGES 2001, Δ to 6 mo | ‐34 (79) | + 22 (79) | — | — | — | — | — | — | — | — | 48 | 46 |
| Canadian DBCP 1997, 2 yrs | 1540 (317) | 1759 (437) | — | — | 60.3 (8.3) | 48.8 (8.1) | 18.0 (3.2) | 16.9 (2.8) | — | — | 104 | 100 |
| CORDIOPREV 2016, 5 yrs | 1716 (363) | 2024 (381) | ‐ | ‐ | 45.6 (6.0) | 38.5 (6.3) | 18.9 (2.0) | 17.3 (2.1) | ‐ | ‐ | 406 | 447 |
| De Bont 1981, Δ to 6 mo | ‐98 (369) | ‐120 (485) | — | — | 7.9 (9.5) | ‐0.1 (10.9) | 2.4 (7.0) | 1.7 (5.9) | ‐0.2 (1.6) | ‐0.4 (2.6) | 71 | 65 |
| DEER 1998 (diet alone), Δ to 1 yr | Women: ‐220 (356) Men: ‐285 (541) |
Women: ‐19 (367) Men: ‐25 (482) |
— | — | Women: +5.5 (8.0) Men: +8.0 (9.3) |
Women: ‐0.2 (7.3) Men: +1.1 (6.6) |
— | — | — | — | 46, 49 | 45, 46 |
| DEER 1998 (diet and ex), Δ to 1 yr | Women: ‐191 (343) Men: ‐167 (516) |
Women: ‐54 (410) Men: +141 (437) |
— | — | Women: +7.8 (6.2) Men: +9.3 (8.3) |
Women: ‐0.3 (7.9) Men: +1.4 (6.3) |
— | — | — | — | 43, 48 | 43, 47 |
| Diet and Hormone Study 2003, 1 yr | 1921 (386) | 2063 (610) | — | — | 64.3 (9.0) | 54.6 (9.2) | 14.5 (2.9) | 14.1 (3.8) | est: 1 (2) | est: 1 (2) | 81 | 96 |
| Ma 2016, 6 mo | ‐ | ‐ | ‐ | ‐ | ‐ | ‐ | ‐ | ‐ | ‐ | ‐ | 46 | 44 |
| MeDiet 2006, 6 mo | 1676 (639) | 1654 (498) | 18.7 (6.9) | 21.9 (9.2) | 27.2 (17.0) | 25.8 (11.0) | 14.9 (4.7) | 16.2 (5.1) | 5.6 (11.1) | 1.6 (2.2) | 51? | 55? |
| Moy 2001, 2 yrs | 1825 (NR) | 2092 (NR) | — | — | — | — | — | — | — | — | 117 | 118 |
| MSFAT 1995, 6 mo | 2460 (NR) | 2699 (NR) | — | — | 47 (NR) | 41 (NR) | 16 (NR) | 14 (NR) | 3 (NR) | 3 (NR) | 117 | 103 |
|
NDHS Open 1st L&M 1968 6 mo |
2154 (432) | 2228 (456) | — | — | 48.7 (12.3) | 44.7 (11.7) | 18.6 (3.4) | 17.4 (3.1) | 3.7 (3.7) | 3.8 (4.0) | 339 | 346 |
|
NDHS Open 2nd L&M 1968 6 mo |
2249 (492) | 2196 (427) | — | — | 45.7 (12.7) | 44.1 (11.1) | 17.3 (3.5) | 7.3 (3.0) | 3.5 (4.2) | 4.2 (4.0) | 491 | 214 |
| Nordevang 1990, Δ to 2 yrs | ‐215 (P < 0.01) | ‐143 (P < 0.01) | +4.8 (P < 0.01) | +1.4 (P < 0.01) | +11.0 (P < 0.01) | +2.7 (P < 0.01) | +1.7 (P < 0.01) | +0.3 (P > 0.05) | +0.2 (P > 0.05) | +0.4 (P > 0.05) | 63 | 106 |
| Nutrition & Breast Health, 1 yr | 1780 and 1960 | 1571 and 1687 | — | — | — | — | — | — | — | — | 23 and 25 | 24 and 23 |
| ODMDC 2017, during trial (by menu analysis) | Male: 2094 (NR) Female: 1697 (NR) |
HF male: 2103 (NR) HF female: 1704 (NR) |
‐ | ‐ | 66 (NR) | HF 46 (NR) MF 56 (NR) |
14 (NR) | HF 14 (NR) MF 14 (NR) |
‐ | ‐ | 101 | HF 101, MF 105 |
| Pilkington 1960, 1 yr | NR | NR | — | — | — | — | — | — | — | — | 12 | 23 |
| Polyp Prevention 1996, yr 4 | 1978 (471) | 2030 (518) | — | — | 58.3 (7.4) | 47.1 (7.2) | 17.3 (2.5) | 16.5 (2.4) | — | — | 605 | 581 |
|
RISCK 2010 Δ to 6 mo (LF/HGI vs HM/HGI (95% CI) |
‐198.4 (‐310.7,88.4) | ‐129.1 (‐239, ‐19.1) | 3.8 (2.4, 5.3) | 0.5 (‐0.9, 1.9) | 8.1 (6.3, 9.9) | 1.9 (0.1, 3.7) | ‐0.3 (‐5.7, 5.1) | ‐2.2 (‐7.5, 3.1) | 95 | 93 | ||
|
RISCK 2010 Δ to 6 mo (LF/LGI vs HM/LGI (95% CI) |
‐313.1 (‐418.3, 210.3) |
‐74.1 (‐181.6, 35.9) |
3.5 (2.1, 4.8) | ‐0.5 (‐1.9, 0.8) | 8.5 (6.8,10.2) | 1.6 (‐0.2, 3.4) | ‐2.8 (‐7.8, 2.2) | ‐3.4 (‐1.9, 8.6) | 110 | 101 | ||
| Rivellese 1994, 6 mo | NR | NR | 14 | 10 | 55 | 48 | 18 | 16 | — | — | 27 | 17 |
| Sarkkinen Low Fat 1993; Sarkkinen Low & Mod 1993, wks 14 to 28 | AHA 1791 (382) Mono 1887 (478) Low fat 1648 (430) |
1982 (406) | — | — | AHA 48 (5) Mono 47 (6) Low fat 51 (5) |
46 (6) | AHA 17 (2) Mono 17 (20) Low fat 19 (3) |
16 (2) | — | — | AHA 41 Mono 41 Low fat 40 |
37 |
| Simon 1997, 1 yr | 1570 (NR) | 1594 (NR) | — | — | — | — | — | — | — | — | 65 | 68 |
| Strychar 2009, 6 mo | NR | NR | — | — | — | — | — | — | — | — | 15 | 15 |
| Swinburn 2001, 1 yr | 1887 (672) | 2269 (750) | — | — | 54.2 (10.5) | 45.8 (10.9) | 18.4 (3.5) | 16.6 (3.9) | 3.6 (7.0) | 5.7 (7.0) | 49 | 61 |
| WHEL 2007, 1 yr | 1664 (345) | 1635 (384) | — | — | 65.3 (8.5) | 57.1 (9.3) | — | — | — | — | 197 | 196 |
| WHI 2006, 7.5 yrs | 1446 (510) | 1564 (595) | — | — | 52.7 (9.8) | 44.7 (8.5) | — | — | — | — | 14246 | 22083 |
| WHT Full‐scale, data only available after trial end | ‐ | ‐ | ‐ | ‐ | ‐ | ‐ | ‐ | ‐ | ‐ | ‐ | 448 | 457 |
| WHT Vanguard 1991, 2 yrs | 1356 (358) | 1617 (391) | — | — | 59.0 (8.8) | 46.9 (8.9) | 19.2 (3.9) | 16.8 (3.8) | — | — | 163 | 101 |
| WHTFSMP 2003, Δ to 18 mo | ‐488 (NR) | ‐255 (NR) | — | — | — | — | — | — | — | — | 285 | 194 |
| WINS 1993, 5 yrs | ‐167 (P < 0.0001 vs cont) | 0 | — | — | — | — | — | — | — | — | 380 | 648 |
| Yadav 2016 | ‐ | ‐ | ‐ | ‐ | ‐ | ‐ | ‐ | ‐ | ‐ | ‐ | 26 | 27 |
‐ Signifies that no data have been presented on this intake in this trial arm AHA: American Heart Association CHO: carbohydrate CI: confidence interval Cont: control arm HF: high fat HGI: high glycaemic index HM: high monounsaturated fat diet Int: intervention arm LF: low fat LGI: low glycaemic index MF: moderate fat Mono: monounsaturates NR: not reported SD: standard deviation
Discussion
Summary of main results
Randomised controlled trials (RCTs) of the effects on body fatness of reducing total fat intake (without any intention to reduce body weight) show a small but highly consistent reduction in weight in the lower fat arm compared with the higher fat arm. There is some heterogeneity between studies in the size of this effect, but not in its presence, and the effect was highly resistant to sensitivity analyses. The heterogeneity was partially explained in subgrouping and meta‐regression. The degree of weight loss appeared higher when study populations reduced their fat intake to a greater extent, to 30%E energy or less, in those who were heavier at baseline, and in those with lower fat intake at baseline.
The small reduction in body weight with lower dietary fat intake (MD ‐1.4 kg, 95% CI ‐1.7 to ‐1.1, I2 = 75%, over 53,875 participants in 33 estimable comparisons from 26 RCTs) was also reflected in a reduction in BMI (MD ‐0.5 kg/m2, 95% CI ‐0.6 to ‐0.3, I2 = 60%, 46,604 participants, 15 comparisons), waist circumference (MD ‐0.5 cm, 95% CI ‐0.7 to ‐0.2, I2 = 21%) and percentage body fat (MD ‐0.3% body fat, 95% CI ‐0.6 to 0, I2 = 0%, P = 0.05, in 2415 participants) in the studies that reported these data. There were no suggestions of harm that might mitigate any benefits on weight, and there was a suggestion of small benefits to serum lipids resulting from lower fat diets.
Overall completeness and applicability of evidence
We have searched very carefully and used a set of comprehensive search strategies to find the full set of RCTs assessing the effect of reducing total fat intake on measures of body fatness. We did this by searching for trials that reduced total fat in one arm and not in the other, regardless of the primary aims or outcomes mentioned in the title or abstracts. Indeed, the included RCTs rarely had weight as a key outcome. There was some evidence of small study bias, with small studies suggesting that smaller weight loss in the low fat arms was missing, so that if such studies were added back the weight reduction in the lower fat arms would be slightly smaller, but still reflect reduced weight in the lower fat arms.
The studies are highly applicable to the question, allowing us to draw conclusions on the effect of altering the percentage of energy from total fat on body fatness.
Quality of the evidence
Summary risk of bias was low in five of the 37 included trials; these were trials with low risk of selection bias (low risk from random sequence generation and allocation concealment) and low risk of detection bias. However, limiting analyses to trials at low summary risk of bias also resulted in lower weight in the lower fat arms. Similarly, excluding trials with more time or attention to the intervention group (attention bias), excluding trials with dietary differences additional to fat differences (in case effects were being driven by other dietary interventions) and excluding studies with potential compliance problems all suggested lower weight in participants eating lower fat diets. This resilience suggests that effects are not simply due to bias; the higher validity trials reflect the main message, that eating a lower proportion of energy from fat results in slightly lower body fatness.
The funnel plot suggests that one or two small studies showing weight gain in the lower fat arm may be missing. Additionally, the effect in fixed‐effect analysis, which gives less weight to small studies (‐0.9 kg, 95% CI ‐1.1 to ‐0.8, Analysis 2.1), is smaller than the effect in random‐effects meta‐analysis (‐1.4 kg, 95% CI ‐1.7 to ‐1.1, Analysis 1.1), which gives more weight to smaller studies. Both suggest the presence of small study bias when assessing effects of lower total fat intake on body weight. The effect of adding any such missing studies back into the meta‐analysis would be a small reduction in amount of weight loss in lower fat arms. The weight reduction with reduced fat intake is still present, but may be closer to ‐0.9 kg (Analysis 2.1) than ‐1.4 kg.
Almost all studies included in this review suffer from performance bias; it is very difficult to blind participants to how much fat they are eating (the exception was one 'shop‐based' trial where participants bought potentially fatty foods from a trial shop, and these foods were modified according to intervention group (NDHS Open 1st L&M 1968). Potential problems with participants knowing whether they are in the intervention or control group is that, if they know they are reducing their dietary fat, they may bother less with other healthy lifestyle practices (such as smoking cessation or physical activity), which could in turn impact on body fatness (in opposite ways).
Potential biases in the review process
When compiling the included studies, we tried to locate RCTs that investigated the effects of reducing total dietary fat for at least six months. There was a high degree of heterogeneity among trials from different sources, including the type and number of participants, the duration and nature of interventions, control methods and follow‐up. However, our sensitivity analyses and subgrouping to examine the effect of many potential effect modifiers did not affect the statistical significance of the suggested effect; the lower weight in those eating lower fat is remarkably robust to subgroup and sensitivity analyses.
Our review included only published studies (we did not seek unpublished data), which could bias the results due to the lack of publication of negative or inconclusive studies. However, we did include and assess studies that measured body fatness but without sufficient detail to include in meta‐analysis, and almost all these trials also suggested lower weight or body fatness in the lower fat arms.
Our decision to exclude trials that explicitly or implicitly aimed to reduce weight may have led to missing some trials or restricting the number of included studies, especially excluding studies where there was no energy restriction, no explicit aim of weight loss, or encouraging of weight loss for some and not all participants. However, this decision makes the effect we found on weight and other measures of body fatness more reliable in people eating normal diets and avoids the potential confounding effects of dieting and unconscious energy restriction or other diet changes.
The restriction of inclusion to RCTs with a minimum of six months duration led to missing some potentially relevant shorter trials. However, it is essential to draw the line at some point, and longer trials and follow‐up ensure that the data are relevant to long‐term fatness, which affects long‐term health.
A limitation of the review was that we did not assess the causal pathway between restriction of energy from fat and weight and so the mechanism of the effect is not clear. It is likely that restricting energy from fat also reduces energy intake slightly (see Table 2 and Analysis 3.11), which leads to lower body weight. Further evidence that energy intake is important in mediating the effect of lowering fat intake on body weight is suggested by a higher relative weight loss in the low fat arms with greater energy reduction.
Most (23 of 37) included RCTs were published before the year 2000 ‐ this is primarily because most recent studies have focused on weight reduction so were ineligible for this review. However, there was no suggestion when subgrouping by decade of publication that effects have altered over time.
We assessed effects of reducing total fat on quality of life and cardiovascular risk factors (lipids and blood pressure) at the request of WHO to check that, if we found positive effects on body fatness, they were not counteracted by harms to other outcomes. This was not a formal systematic review of effects of total fat on lipids, blood pressure or quality of life (as studies were only included if they assessed at least one measure of body fatness), but our results did not suggest any harms from reducing total fat. However, other potential harms (such as reductions in fat‐soluble vitamin status, or gastric symptoms) were not assessed ‐ though we are not aware of any harms such as these reported in our included trials.
Agreements and disagreements with other studies or reviews
The conclusions of this updated review have not altered in overall import from earlier versions of this review (Hooper 2012b; Hooper 2015a). Yu‐Poth 1999 found that dietary trials (excluding trials that also assessed exercise interventions) of the National Cholesterol Education Program's Step I and Step II dietary intervention programmes resulted in weight reductions (compared with control groups) of just under 3 kg, and that this was related to the degree of total fat reduction. Their regression suggested that for every 1% decrease in energy as total fat, there was a 0.28 kg decrease in body weight, while our meta‐regression found that for every 1% decrease in energy as total fat there was a slightly smaller 0.20 kg decrease in weight (95% CI ‐0.34 to ‐0.06, P = 0.007). The slightly smaller effect size in this review may be due to our excluding shorter duration studies and studies that aimed to reduce weight in the intervention arm.
The single trial that set out to assess the effect of reducing total fat intake on body weight, by feeding participants carefully controlled levels of dietary fat and carbohydrate over 6 months (ODMDC 2017), found that body weight in participants eating 20% of energy from fat was 0.6 kg lower than participants eating 30% or 40% of energy from fat. This high‐quality trial confirmed our findings of lower weight with lower fat intake, but the effect size was smaller than our suggested effect size. This may have been because the intervention was only for six months; weight effects may have been greater if the feeding had continued over a longer time period.
Authors' conclusions
Implications for practice.
Attempts should be made to reduce total fat intake in populations where mean total fat intake is 30% or more of energy, in order to support maintenance of healthy weights. For populations where the mean total fat intake is below 30% of energy, then interventions to restrict increases in total fat intake to over 30% of energy may help to avoid obesity.
Implications for research.
High‐quality trials are needed to investigate the effect on body weight of reducing fat intake in developing or transitional countries with total fat intakes greater than 30% of energy, and of preventing total fat intake rising above 30% of energy in countries with total fat intakes of 25% to 30% of energy. None of the ongoing trials found are being carried out in developing or transitional countries.
Feedback
Tobias 2016, July 2016
Summary
In their systematic review and meta‐analysis of 32 randomized controlled trials, representing 54,000 participants, Hooper et al. reported that a lower proportion of energy intake from total fat was associated with a small reduction in body weight (difference = 1.5 kg).1 The authors’ conclusion, however, was contradicted by findings from their parallel meta‐analysis of 25 observational cohort studies. The erroneous conclusion from the review of trials is a consequence of biased study selection criteria, inclusion of short‐term follow‐up (<12 months), and other methodologic flaws.
First, their criteria explicitly included only trials in which weight loss was not an objective of the intervention. This led to the exclusion of several long‐term, rigorously conducted RCTs designed specifically to test the hypothesis that the fat composition of the diet affects weight change. The criteria used by Hooper et al. resulted in a heterogeneous subset of the of low‐fat dietary intervention RCTs, which included trials conducted to test the effects of low‐fat diets on endpoints such as cancer incidence or lipids in higher risk study populations. In fact, only three trials in their meta‐analysis were among healthy participants, not recruited on the basis of risk factors or disease. The authors’ contend that including only studies not intending to alter weight would reduce potential publication bias. On the contrary, we believe this would increase the likelihood of publication bias, since investigators of diet trials not explicitly conducted for weight loss would not be motivated to publish null or contrary results. Since the point of this work is to advise generally healthy individuals as to how to maintain or lose weight, it is bizarre to specifically exclude trials designed to answer that question.
Second, the authors’ included short‐term trials (of as little as 6 months duration). Six months is typically when the effect of dietary interventions on body weight wane and weight regain commences; thus short‐term results do not reflect sustained effects at 1 year or longer, which is of primary interest.2
Third, most of the studies included by Hooper et al. were seriously confounded by factors other than the fat content of the diet. Some of the trials coupled a low‐fat intervention with other advice, such as eating more fruits and vegetables, which obscures the interpretation of the findings. The other key characteristic is the differences in intensity or attention between intervention groups (e.g., fewer or no in‐person visits, dietary counseling meetings, etc), because the control group was often simply assigned to maintain their usual diet. Aspects related to the intensity of a dietary intervention, such as behavioral support, are modest predictors of weight loss success;3 thus, most RCT’s designed to assess the effects of diet composition on weight intentionally balanced the intensity of interventions, but these were the studies explicitly excluded by Hooper it al. In our previous meta‐analysis of RCTs comparing low‐fat vs. higher fat dietary interventions, we conducted stratified analyses by these key trial characteristics.4 We observed that significant long‐term weight loss favoring low‐fat interventions was observed only for trials in which the comparator group was “usual diet” or received less attention during the intervention from study investigators. This was true regardless of whether the RCTs had a weight loss focus or not. Comparisons between low‐fat and higher fat interventions of similar intensity demonstrated no benefit of low‐fat over higher fat diets, regardless of weight loss goal. Indeed, the overall results of these trials favored a small but statistically significant greater weight loss with higher fat diets. Our findings clearly demonstrated the biased impact of differential attention across treatment groups.
Only 4 RCTs in Hooper’s meta‐analysis (419 total participants) remained after exclusion of trials in which control groups were asked simply to maintain usual diet or received differentially less attention than the low‐fat intervention arms. Three were 6 month trials, and the fourth was published in 1960 among men with recent myocardial infarction to examine lipid changes after a 1 year intervention with either a low‐fat or a “unsaturated‐fat” diet.5 These 4 RCTs also were judged by Hooper et al. to have relatively high “risk of bias” according to authors’ methodological quality criteria.
In summary, the results from the most recent Hooper et al. meta‐analysis provide no convincing evidence for recommending a low‐fat diet for the prevention of weight gain and obesity in the general population. In fact, their strict exclusion criteria restricting the analysis only to trials in which weight‐loss was not intended led to biased results. Although the authors’ felt that limiting their analysis to non‐weight loss trials would enhance validity, this selectively excluded trials designed to avoid confounding by intensity of intervention and other factors. Analysis of trials that include those specifically testing interventions for weight control, that exclude short‐term trials, and account for key trial characteristics yield consistent results that are consonant with observational studies. Would we derive recommendations for statin use in the primary prevention of coronary heart disease solely from trials with a completely different disease endpoint? Promoting low fat diets for weight control can lead to increased consumption of refined carbohydrates, causing increased weight gain,4 an array of adverse metabolic effects,6 and premature death.7 The overall body of scientific evidence clearly demonstrates that dietary recommendations should focus not on lowering the total fat content of the diet but rather on specific types of fats and carbohydrates and, more importantly, on specific foods and overall dietary patterns.8
References
Hooper L, Abdelhamid A, Bunn D, Brown T, Summerbell CD, Skeaff CM. Effects of total fat intake on body weight. The Cochrane database of systematic reviews. 2015(8):CD011834.
Willett WC. Dietary fat plays a major role in obesity: no. Obesity reviews: an official journal of the International Association for the Study of Obesity. May 2002;3(2):59‐68.
Johnston BC, Kanters S, Bandayrel K, et al. Comparison of weight loss among named diet programs in overweight and obese adults: a meta‐analysis. Jama. Sep 3 2014;312(9):923‐933.
Tobias DK, Chen M, Manson JE, Ludwig DS, Willett W, Hu FB. Effect of low‐fat diet interventions versus other diet interventions on long‐term weight change in adults: a systematic review and meta‐analysis. The lancet. Diabetes & endocrinology. Dec 2015;3(12):968‐979.
Pilkington TR, Stafford JL, Hankin VS, Simmonds FM, Koerselman HB. Practical Diets for Lowering Serum Lipids. British medical journal. Jan 2 1960;1(5165):23‐25.
Appel LJ, Sacks FM, Carey VJ, et al. Effects of protein, monounsaturated fat, and carbohydrate intake on blood pressure and serum lipids: results of the OmniHeart randomized trial. Jama. Nov 16 2005;294(19):2455‐2464.
Wang DD, Li Y, Chiuve SE, et al. Association of Specific Dietary Fats With Total and Cause‐Specific Mortality. JAMA internal medicine. Jul 5 2016.
U.S. Department of Health and Human Services and U.S. Department of Agriculture. 2015 – 2020 Dietary Guidelines for Americans. 8th Edition. December 2015. Available at http://health.gov/dietaryguidelines/2015/guidelines/
I do not have any affiliation with or involvement in any organisation with a financial interest in the subject matter of my comment
Reply
Thank you for your interest in our systematic review (1). You are incorrect; we did not state anywhere in the review that “a lower proportion of energy intake from total fat was associated with a small reduction in body weight (difference = 1.5 kg)”. We were not interested in associations, we were interested in causality, so we included RCTs that reduced total fat in one randomised arm and not in the other. In the abstract, we stated “There is consistent evidence from RCTs in adults of a small weight‐reducing effect of eating a smaller proportion of energy from fat; this was seen in almost all included studies and was highly resistant to sensitivity analyses. The effect of eating less fat (compared with usual diet) is a mean weight reduction of 1.5 kg (95% confidence interval (CI) ‐2.0 to ‐1.1 kg), but greater weight loss results from greater fat reductions.”
Yes, we only included studies where weight loss was NOT a goal (where fat reduction was assessed for its effect on cardiovascular disease, cancer risk or other health issues). The reason for this was that we were interested not in weight‐reducing diets for overweight people, but in usual diets eaten day to day by generally healthy people all over the world. This issue was discussed in great detail by the World Health Organization NUGAG committee before the review was commissioned and the committee was very clear that their instructions were in setting goals for generally healthy populations and not therapeutic diets for those who were already overweight or obese. Therapeutic weight‐reducing diets are very different and, whatever their macronutrient or food composition, cannot be disentangled from the overriding and conscious requirement to eat less food (i.e. reduce energy intake). Indeed, and importantly, the participants in the studies we reviewed were not recruited to studies that aimed to promote weight loss in participants, or where participants were aware that one of the aims of the study was to promote a loss in their weight to achieve a healthy weight. This also meant that we did not include studies where low fat diets were compared to other therapeutic diets (such as very low carbohydrate diets).
Our review assesses the effects on weight of encouraging normal populations to reduce their total fat intake over the long term. The studies included durations of 6 months up to over 8 years. The effect in studies of between 6 and 12 months duration was a reduction of 1.74 kg in the low fat group compared to control (95% CI ‐2.34 to ‐1.13), similar to that at 12 to 24 months (‐2.00 kg, 95% CI ‐2.51 to ‐1.48) and at 24 to 60 months (‐1.18 kg, 95% CI ‐1.65 to ‐0.70). The effect over more than 5 years was smaller (‐0.68 kg, 95% CI ‐1.66 to 0.29) but two of the four large RCTs still showed statistically significantly lower weight in the intervention groups (perhaps reflecting differences in the intensity of the intervention delivery and support this far into the trials), and meta‐regression did not suggest a significant effect of duration on the extent of weight reduction in the low fat group compared to control. Dr Tobias’ own systematic review also clearly shows, in studies where there was no intention to reduce weight “that low‐fat interventions led to greater weight loss” compared to usual diets (abstract of (2)).
Strategies to help obese adults and children to lose weight are also clearly very important – but how to lose weight is a different question from how populations should eat day to day, year to year (there are a set of specific systematic reviews about weight reduction strategies in different populations on the Cochrane Library).
We used sensitivity analysis to assess the effect of “attention bias” (see Analysis 3.1). We removed studies where there appeared to have been more attention and/or time spent on the intervention group than the control group. Five studies provided data for this meta‐analysis, finding that there was still a statistically significantly reduced weight in the low fat group (‐1.25 kg, 95% CI ‐2.09 to ‐0.41). Three further trials did not provide variance data so could not be included in the meta‐analysis, but they all clearly showed greater weight reduction in the low fat compared to usual fat arms, on average (though their statistical significance could not be assessed). This is a very consistent effect, is not dependent on short duration, and does not rely on increased attention or behavioural strategies in the low fat arms.
We reiterate, “Trials where participants were randomised to a lower fat intake versus usual or moderate fat intake, but with no intention to reduce weight, showed a consistent, stable but small effect of low fat intake on body fatness: slightly lower weight, BMI and waist circumference compared with controls. Greater fat reduction and lower baseline fat intake were both associated with greater reductions in weight.”
References
Hooper L, Abdelhamid A, Bunn DK, Brown T, Summerbell CD, Skeaff CM. Effects of total fat intake on body weight. Cochrane Database of Systematic Reviews 2015;8:Art. No.: CD011834.doi: 10.1002/14651858.CD011834.
Tobias DK, Chen M, Manson JE, Ludwig DS, Willett W, Hu FB. Effect of low‐fat diet interventions versus other diet interventions on long‐term weight change in adults: a systematic review and meta‐analysis. Lancet Diabetes & Endocrinology 2015;3:968‐79.
Contributors
Julia Lowe, feedback editor for Cochrane Heart
What's new
| Date | Event | Description |
|---|---|---|
| 2 June 2020 | Amended | MInor correction to wording in abstract. |
History
Review first published: Issue 6, 2020
| Date | Event | Description |
|---|---|---|
| 22 December 2019 | New search has been performed | Searches for RCTs updated to October 2019, omitted CINAHL search, included searches of ClinicalTrials.gov and WHO ICTRP trials registries. |
| 22 December 2019 | New citation required but conclusions have not changed | Cohort data omitted. Summary risk of bias assessed for all included trials, 'Risk of bias' assessment updated across all included studies. Comparison of fixed‐ and random‐effects meta‐analysis used in addition to funnel plots and displaying missing data to understand small study bias. Seven new RCTs included in the review and meta‐analyses (plus three ongoing studies and six trials awaiting assessment). Data updated for three of the 30 previously included trials. All analyses and results updated, summary of findings updated. No important changes in the bottom line of the review. We have removed data on children from this review as effects of total fat on body weight in children have now been assessed in a separate review (Naude 2018). |
| 19 August 2016 | Feedback has been incorporated | Comment and authors' response added. |
| 2 March 2016 | Amended | The description of data included in the main analysis for the WHI study was incorrect, so the entry for the "Characteristics of Included Studies" table now reflects that the weight, BMI and waist circumference data used in the main analyses were 7.5 year follow up data (as is appropriate). The data in the forest plots were already correct. Additionally the main reference for WHI is now indicated as the paper that provides this 7.5 year follow up data. The first paragraph of the text on "Associations between total dietary fat in youth and measures of body fatness in children, young people and adults (as seen in cohorts)" was unclear, so we have tried to clarify these results. Table 2 is helpful to read in understanding this section. |
| 21 July 2015 | New search has been performed | The searches were run on 12 November 2014. |
| 11 July 2015 | New citation required and conclusions have changed | We split a previously published review (Reduced and modified dietary fat for preventing cardiovascular disease, DOI: 10.1002/14651858.CD002137.pub3) into six smaller review updates. The conclusions are therefore now focused on the effects of total fat intake on body weight instead of the effects of reducing or modifying fat intake overall on cardiovascular disease risk. At the request of the World Health Organization (WHO) Nutrition Guidance Expert Advisory Group (NUGAG) group we extended this review to include cohort studies, and studies in children and young people. This split review update includes 32 randomised controlled trials and also 30 sets of analyses of 25 cohorts. |
| 11 June 2010 | New citation required and conclusions have changed | — |
| 9 September 2008 | Amended | — |
| 1 February 2000 | New citation required and conclusions have changed | Substantive amendment. |
Acknowledgements
We thank the members of the WHO NUGAG subgroup on diet and health for their work in setting up the question and the protocol for this review (agreed in outline at its first meeting in February 2010, but not published), offering further studies for examination and assessment for inclusion during the initial version of this review, and in ensuring robust analysis. We thank the WHO for funding the update of this review and agreeing with publication of this systematic review as a scientific paper. We also thank Tracey Brown and Carolyn Summerbell who were authors of the previous version of this review, as this update builds on their work. We are very grateful to Charlene Bridges (Information Specialist) who carried out the searches for the review, and Nicole Martin (Managing Editor at the Cochrane Heart Group), Sarah Hodgkinson (Associate Editor), Audrey Tan (Network Support Fellow), Karen Rees (Contact Editor) and Lena Al‐Khudairy who provided helpful peer review.
Appendices
Appendix 1. Searches run October 2019
The searches for this review were last run in November 2014 as part of a broader review (Hooper 2015a). As the review has now been split and the previous search strategy was unsuitable, a new strategy has been run in October 2019, from database inception.
The RCT filter for MEDLINE is the Cochrane sensitivity and precision‐maximising RCT filter (Lefebvre 2011), and for Embase, terms as recommended in the Cochrane Handbook have been applied (Lefebvre 2011).
CENTRAL
#1 MeSH descriptor: [Weight Gain] explode all trees
#2 MeSH descriptor: [Weight Loss] explode all trees
#3 (obesity):ti,ab,kw
#4 (obese):ti,ab,kw
#5 (adipos*):ti,ab,kw
#6 ("weight gain"):ti,ab,kw
#7 ("weight loss"):ti,ab,kw
#8 (overweight):ti,ab,kw
#9 ("over weight"):ti,ab,kw
#10 (overeat*):ti,ab,kw
#11 (over NEXT eat*):ti,ab,kw
#12 (weight NEXT change*):ti,ab,kw
#13 (((bmi or "body mass index") NEAR/2 (gain or loss or change))):ti,ab,kw
#14 ("body fat"):ti,ab,kw
#15 ("body composition"):ti,ab,kw
#16 ("body constitution"):ti,ab,kw
#17 #1 or #2 or #3 or #4 or #5 or #6 or #7 or #8 or #9 or #10 or #11 or #12 or #13 or #14 or #15 or #16
#18 MeSH descriptor: [Dietary Fats] explode all trees
#19 MeSH descriptor: [Diet, Fat‐Restricted] explode all trees
#20 ((fat* NEAR/2 (total or intake or consum* or ate or eat or reduce* or restrict* or low* or diet*))):ti,ab,kw
#21 #18 or #19 or #20
#22 #17 and #21
MEDLINE OVID
1 exp Weight Gain/
2 exp Weight Loss/
3 obesity.ab,ti.
4 obese.ab,ti.
5 adipos$.ab,ti.
6 weight gain.ab,ti.
7 weight loss.ab,ti.
8 overweight.ab,ti.
9 over weight.ab,ti.
10 overeat$.ab,ti.
11 over eat$.ab,ti.
12 weight change$.ab,ti.
13 ((bmi or body mass index) adj2 (gain or loss or change)).ab,ti.
14 body fat$.ab,ti.
15 body composition.ab,ti.
16 body constitution.ab,ti.
17 1 or 2 or 3 or 4 or 5 or 6 or 7 or 8 or 9 or 10 or 11 or 12 or 13 or 14 or 15 or 16
18 exp Dietary Fats/
19 exp Diet, Fat‐Restricted/
20 (fat$ adj2 (total or intake or consum$ or ate or eat or reduce$ or restrict$ or low$ or diet$)).ab,ti.
21 18 or 19 or 20
22 17 and 21
23 randomized controlled trial.pt.
24 controlled clinical trial.pt.
25 randomized.ab.
26 placebo.ab.
27 clinical trials as topic.sh.
28 randomly.ab.
29 trial.ti.
30 23 or 24 or 25 or 26 or 27 or 28 or 29
31 exp animals/ not humans.sh.
32 30 not 31
33 22 and 32
Embase OVID
1 exp body weight gain/
2 exp body weight loss/
3 obesity.ab,ti.
4 obese.ab,ti.
5 adipos$.ab,ti.
6 weight gain.ab,ti.
7 weight loss.ab,ti.
8 overweight.ab,ti.
9 over weight.ab,ti.
10 overeat$.ab,ti.
11 over eat$.ab,ti.
12 weight change$.ab,ti.
13 ((bmi or body mass index) adj2 (gain or loss or change)).ab,ti.
14 body fat$.ab,ti.
15 body composition.ab,ti.
16 body constitution.ab,ti.
17 1 or 2 or 3 or 4 or 5 or 6 or 7 or 8 or 9 or 10 or 11 or 12 or 13 or 14 or 15 or 16
18 exp fat intake/
19 exp low fat diet/
20 (fat$ adj2 (total or intake or consum$ or ate or eat or reduce$ or restrict$ or low$ or diet$)).ab,ti.
21 18 or 19 or 20
22 17 and 21
23 random$.tw.
24 factorial$.tw.
25 crossover$.tw.
26 cross over$.tw.
27 cross‐over$.tw.
28 placebo$.tw.
29 (doubl$ adj blind$).tw.
30 (singl$ adj blind$).tw.
31 assign$.tw.
32 allocat$.tw.
33 volunteer$.tw.
34 crossover procedure/
35 double blind procedure/
36 randomized controlled trial/
37 single blind procedure/
38 23 or 24 or 25 or 26 or 27 or 28 or 29 or 30 or 31 or 32 or 33 or 34 or 35 or 36 or 37
39 (animal/ or nonhuman/) not human/
40 38 not 39
41 22 and 40
42 limit 41 to embase
Clinicaltrials.gov
Condition or disease: weight loss OR weight gain OR body weight OR weight change OR obesity OR obese OR overweight
Intervention/treatment: Fat, Dietary OR fat
Study type: Interventional Studies (Clinical Trials)
ICTRP
Condition: weight loss OR weight gain OR body weight OR weight change OR obesity OR obese OR overweight
Intervention: Fat, Dietary OR fat
Appendix 2. Searches run in 2014
MEDLINE search run to collect adult and child RCTs and cohort studies 15 November 2014
Search adapted from that run in 2010, to search for both adult and child RCTs and cohort studies, but omitting dietary exposures other than dietary fat.
Run 15 November 2014.
Database: Ovid MEDLINE(R) In‐Process & Other Non‐Indexed Citations and Ovid MEDLINE(R) <1946 to Present> Search Strategy: ‐‐‐‐‐‐‐‐‐‐‐‐‐‐‐‐‐‐‐‐‐‐‐‐‐‐‐‐‐‐‐‐‐‐‐‐‐‐‐‐‐‐‐‐‐‐‐‐‐‐‐‐‐‐‐‐‐‐‐‐‐‐‐‐‐‐‐‐‐‐‐‐‐‐‐‐‐‐‐‐ 1 exp Weight Gain/ (24259) 2 exp Weight Loss/ (30933) 3 obesity.ab,ti. (152189) 4 obese.ab,ti. (86464) 5 adipos$.ab,ti. (71315) 6 weight gain.ab,ti. (44371) 7 weight loss.ab,ti. (59414) 8 overweight.ab,ti. (42626) 9 over weight.ab,ti. (349) 10 overeat$.ab,ti. (1934) 11 over eat$.ab,ti. (275) 12 weight change$.ab,ti. (8042) 13 ((bmi or body mass index) adj2 (gain or loss or change)).ab,ti. (2786) 14 body fat$.ab,ti. (24784) 15 body composition.ab,ti. (23804) 16 body constitution.ab,ti. (257) 17 exp Dietary Fats/ (73523) 18 exp Diet, Fat‐Restricted/ (3040) 19 (fat$ adj2 (total or intake or consum$ or ate or eat or reduce$ or restrict$ or low$ or diet$)).ab,ti. (63037) 20 1 or 2 or 3 or 4 or 5 or 6 or 7 or 8 or 9 or 10 or 11 or 12 or 13 or 14 or 15 or 16 (366287) 21 17 or 18 or 19 (114331) 22 20 and 21 (28779) 23 randomized controlled trial.pt. (399992) 24 controlled clinical trial.pt. (90666) 25 Randomized controlled trials/ (99585) 26 random allocation.sh. (84070) 27 double blind method.sh. (132423) 28 single‐blind method.sh. (20589) 29 23 or 24 or 25 or 26 or 27 or 28 (658672) 30 (animals not (human and animals)).sh. (5551801) 31 29 not 30 (590901) 32 clinical trial.pt. (501242) 33 exp Clinical trial/ (816129) 34 (clin$ adj25 trial$).ti,ab. (291641) 35 ((singl$ or doubl$ or trebl$ or tripl$) adj (blind$ or mask$)).ti,ab. (137043) 36 placebos.sh. (34004) 37 placebo$.ti,ab. (169148) 38 random$.ti,ab. (764596) 39 research design.sh. (82260) 40 comparative study.sh. (1730651) 41 exp Evaluation studies/ (206135) 42 follow up studies.sh. (520109) 43 prospective studies.sh. (390949) 44 (control$ or prospectiv$ or volunteer$).ti,ab. (3243146) 45 32 or 33 or 34 or 35 or 36 or 37 or 38 or 39 or 40 or 41 or 42 or 43 or 44 (5767873) 46 45 not 30 (4293785) 47 31 or 46 (4323589) 48 exp Cohort Studies/ (1438154) 49 (cohort$ or quintile$ or quartile$ or quantile$ or tertile$).mp. (411555) 50 (follow‐up$ or followup$).mp,tw. (970994) 51 longitud$.mp. [mp=title, abstract, original title, name of substance word, subject heading word, keyword heading word, protocol supplementary concept word, rare disease supplementary concept word, unique identifier] (208935) 52 ((prospectiv$ or observation$) adj5 (research$ or data$ or stud$)).mp. (587538) 53 48 or 49 or 50 or 51 or 52 (2092058) 54 53 not 30 (1996509) 55 47 or 54 (4973664) 56 22 and 55 (9237) 57 limit 56 to (english language and yr="2010 ‐ 2015") (3294) 58 exp Case‐Control Studies/ (710182) 59 (case adj3 control$).tw. (93452) 60 (case adj3 series).tw. (42174) 61 case study/ (1736496) 62 letter.pt. (885169) 63 exp Drug Therapy/ (1125358) 64 exp Surgery/ (35422) 65 exp Biochemical Phenomena/ (3179065) 66 exp OBESITY/dt, ec, ra, ri, rt, su, ve [Drug Therapy, Economics, Radiography, Radionuclide Imaging, Radiotherapy, Surgery, Veterinary] (21417) 67 exp HIV/ (89024) 68 exp HIV infections/ (246055) 69 cancer.ti. (653428) 70 (tumour or tumor).ti. (242371) 71 lung.ti. (197074) 72 asthma.ti. (66394) 73 58 or 59 or 60 or 61 or 62 or 63 or 64 or 65 or 66 or 67 or 68 or 69 or 70 or 71 or 72 (8021499) 74 57 not 73 (1961)
EMBASE search run to collect adult and child RCTs and cohort studies on 14th November 2014
Search adapted from that run in 2010, to search for both adult and child RCTs and cohort studies, but omitting dietary exposures other than dietary fat.
Run 14 November 2014.
Database: EMBASE <1974 to 2014 November 14> Search Strategy: ‐‐‐‐‐‐‐‐‐‐‐‐‐‐‐‐‐‐‐‐‐‐‐‐‐‐‐‐‐‐‐‐‐‐‐‐‐‐‐‐‐‐‐‐‐‐‐‐‐‐‐‐‐‐‐‐‐‐‐‐‐‐‐‐‐‐‐‐‐‐‐‐‐‐‐‐‐‐‐‐ 1 exp Weight Gain/ (67847) 2 exp weight reduction/ (104267) 3 obesity.ab,ti. (197751) 4 obese.ab,ti. (114407) 5 overweight.ab,ti. (55916) 6 over weight.ab,ti. (671) 7 ((weight or bmi or body mass index) adj2 (gain or loss or change or reduc$)).ab,ti. (154396) 8 exp fat intake/ (42075) 9 exp low fat diet/ (6962) 10 (fat$ adj2 (total or intake or consum$ or ate or eat or reduce$ or restrict$ or low$ or diet$)).ab,ti. (76246) 11 1 or 2 or 3 or 4 or 5 or 6 or 7 (440097) 12 8 or 9 or 10 (102724) 13 11 and 12 (27385) 14 controlled study/ (4458191) 15 randomized controlled trial/ (355956) 16 clinical trial/ (839688) 17 major clinical study/ (2275896) 18 (trial$ or control$).tw. (3805000) 19 (blind$ or placebo).tw. (383515) 20 placebo/ (260940) 21 14 or 15 or 16 or 17 or 18 or 19 or 20 (8434269) 22 exp human/ (15270878) 23 nonhuman/ (4404779) 24 23 not 22 (3499956) 25 21 not 24 (6542287) 26 exp Longitudinal Study/ (70712) 27 exp Prospective Study/ (266457) 28 (cohort$ or quintile$ or quartile$ or tertile$ or quantile$).mp. (498531) 29 (follow‐up$ or followup$).mp,tw. (1184342) 30 longitud$.mp. (214152) 31 ((prospectiv$ or observation$) adj5 (research$ or data$ or stud$)).mp. (615851) 32 26 or 27 or 28 or 29 or 30 or 31 (2100044) 33 32 not 24 (2060027) 34 33 or 25 (7492226) 35 13 and 34 (12448) 36 limit 35 to (english language and yr="2010 ‐ 2015") (6329) 37 exp Case‐Control Studies/ (90210) 38 (case adj3 control$).tw. (107292) 39 (case adj3 series).tw. (51300) 40 case study/ (28823) 41 letter.pt. (860483) 42 exp Drug Therapy/ (1859698) 43 exp Surgery/ (3481521) 44 exp Biochemical Phenomena/ (81777) 45 exp obesity/cn, di, dr, dt, rt, su [Congenital Disorder, Diagnosis, Drug Resistance, Drug Therapy, Radiotherapy, Surgery] (33545) 46 exp HIV/ (138030) 47 exp HIV infections/ (303673) 48 cancer.ti. (812504) 49 (tumour or tumor).ti. (277200) 50 lung.ti. (240253) 51 asthma.ti. (82529) 52 37 or 38 or 39 or 40 or 41 or 42 or 43 or 44 or 45 or 46 or 47 or 48 or 49 or 50 or 51 (6915750) 53 36 not 52 (5003)
CINAHL search run to collect adult and child RCTs and cohort studies on 1st December 2014
Interface EBSCO host research databases, Advanced search, CINAHL Complete
| # | Query | Limiters/Expanders | Results |
| S1 | (MH "weight gain+") | Search modes ‐ Boolean/Phrase | 62,681 |
| S2 | (MH "weight loss+") | Search modes ‐ Boolean/Phrase | 14,411 |
| S3 | TI obesity OR AB obesity | Search modes ‐ Boolean/Phrase | 32,659 |
| S4 | TI obese OR AB obese | Search modes ‐ Boolean/Phrase | 15,905 |
| S5 | TI adipos* OR AB adipos* | Search modes ‐ Boolean/Phrase | 6,462 |
| S6 | TI weight gain OR AB weight gain | Search modes ‐ Boolean/Phrase | 6,645 |
| S7 | TI weight loss OR AB weight loss | Search modes ‐ Boolean/Phrase | 11,452 |
| S8 | TI overweight OR AB overweight | Search modes ‐ Boolean/Phrase | 12,405 |
| S9 | TI over weight OR AB over weight | Search modes ‐ Boolean/Phrase | 1,157 |
| S10 | TI overeat* OR AB overeat* | Search modes ‐ Boolean/Phrase | 418 |
| S11 | TI over eat* OR AB over eat* | Search modes ‐ Boolean/Phrase | 321 |
| S12 | TI weight change* OR AB weight change* | Search modes ‐ Boolean/Phrase | 3,689 |
| S13 | (TI ((bmi or body mass index) N2 (gain or loss or change))) OR (AB ((bmi or body mass index) N2 (gain or loss or change))) | Search modes ‐ Boolean/Phrase | 862 |
| S14 | TI body fat* OR AB body fat* | Search modes ‐ Boolean/Phrase | 5,932 |
| S15 | TI body composition OR AB body composition | Search modes ‐ Boolean/Phrase | 5,353 |
| S16 | TI body constitution OR AB body constitution | Search modes ‐ Boolean/Phrase | 26 |
| S17 | (MH "Dietary Fats+") | Search modes ‐ Boolean/Phrase | 17,455 |
| S18 | (MM "Diet, Fat‐Restricted") | Search modes ‐ Boolean/Phrase | 901 |
| S19 | (TI (fat* N2 (total or intake or consum* or ate or eat or reduc* or restrict* or low* or diet*))) OR (AB (fat* N2 (total or intake or consum* or ate or eat or reduc* or restrict* or low* or diet*))) | Search modes ‐ Boolean/Phrase | 11,074 |
| S20 | (S1 OR S2 OR S3 OR S4 OR S5 OR S6 OR S7 OR S8 OR S9 OR S10 OR S11 OR S12 OR S13 OR S14 OR S15 OR S16) | Search modes ‐ Boolean/Phrase | 99,408 |
| S21 | (S17 OR S18 OR S19) | Search modes ‐ Boolean/Phrase | 25,122 |
| S22 | (S20 AND S21) | Search modes ‐ Boolean/Phrase | 6,404 |
| S23 | PT randomized controlled trial | Search modes ‐ Boolean/Phrase | 45,326 |
| S24 | TX "controlled clinical trial" | Search modes ‐ Boolean/Phrase | 7,628 |
| S25 | MM "Randomized Controlled Trials" | Search modes ‐ Boolean/Phrase | 668 |
| S26 | MM "Random Assignment" | Search modes ‐ Boolean/Phrase | 147 |
| S27 | MM "Double‐Blind Studies" | Search modes ‐ Boolean/Phrase | 76 |
| S28 | MM "Single‐Blind Studies" | Search modes ‐ Boolean/Phrase | 26 |
| S29 | S23 OR S24 OR S25 OR S26 OR S27 OR S28 | Search modes ‐ Boolean/Phrase | 52,650 |
| S30 | SU (animals not (human and animals)) | Search modes ‐ Boolean/Phrase | 53,619 |
| S31 | S29 NOT S30 | Search modes ‐ Boolean/Phrase | 52,575 |
| S32 | PT clinical trial | Search modes ‐ Boolean/Phrase | 77,533 |
| S33 | MH "Clinical Trials+" | Search modes ‐ Boolean/Phrase | 184,793 |
| S34 | TI (clin* N25 trial*) OR AB (clin* N25 trial*) | Search modes ‐ Boolean/Phrase | 53,327 |
| S35 | TI ((singl* or doubl* or trebl* or tripl* or quad*) N (blind* or mask*)) OR AB ((singl* or doubl* or trebl* or tripl* or quad*) N (blind* or mask*)) | Search modes ‐ Boolean/Phrase | 300 |
| S36 | MM "Placebos" | Search modes ‐ Boolean/Phrase | 828 |
| S37 | TI placebo* OR AB placebo* | Search modes ‐ Boolean/Phrase | 27,852 |
| S38 | TI random* OR AB random* | Search modes ‐ Boolean/Phrase | 144,733 |
| S39 | MM "study design" | Search modes ‐ Boolean/Phrase | 5,275 |
| S40 | MM "comparative studies" | Search modes ‐ Boolean/Phrase | 283 |
| S41 | MH "Evaluation Research+" | Search modes ‐ Boolean/Phrase | 20,984 |
| S42 | MM "prospective studies" | Search modes ‐ Boolean/Phrase | 800 |
| S43 | TI (control* or prospectiv* or volunteer*) OR AB (control* or prospectiv* or volunteer*) | Search modes ‐ Boolean/Phrase | 357,450 |
| S44 | S32 OR S33 OR S34 OR S35 OR S36 OR S37 OR S38 OR S39 OR S40 OR S41 OR S42 OR S43 | Search modes ‐ Boolean/Phrase | 542,974 |
| S45 | S44 NOT S30 | Search modes ‐ Boolean/Phrase | 535,502 |
| S46 | S31 OR S45 | Search modes ‐ Boolean/Phrase | 541,731 |
| S47 | MH "prospective studies+" | Search modes ‐ Boolean/Phrase | 254,176 |
| S48 | TX cohort* or quintile* or quartile* or quantile* or tertile* | Search modes ‐ Boolean/Phrase | 152,914 |
| S49 | TX follow‐up* or followup* | Search modes ‐ Boolean/Phrase | 249,854 |
| S50 | TX longitud* | Search modes ‐ Boolean/Phrase | 103,954 |
| S51 | TX ((prospectiv* or observation*) N5 (research* or data* or stud*)) | Search modes ‐ Boolean/Phrase | 382,309 |
| S52 | S47 OR S48 OR S49 OR S50 OR S51 | Search modes ‐ Boolean/Phrase | 613,040 |
| S53 | S52 NOT S30 | Search modes ‐ Boolean/Phrase | 610,840 |
| S54 | S46 OR S53 | Search modes ‐ Boolean/Phrase | 963,714 |
| S55 | S22 AND S54 | Search modes ‐ Boolean/Phrase | 3,017 |
| S56 | S22 AND S54 | Limiters ‐ Published Date: 20100101‐20151231; English Language Search modes ‐ Boolean/Phrase | 1,236 |
| S57 | MH "Case Control Studies+" | Limiters ‐ Published Date: 20100101‐20151231; English Language Search modes ‐ Boolean/Phrase | 23,820 |
| S58 | TX case N3 control* | Limiters ‐ Published Date: 20100101‐20151231; English Language Search modes ‐ Boolean/Phrase | 35,592 |
| S59 | TX case N3 series | Limiters ‐ Published Date: 20100101‐20151231; English Language Search modes ‐ Boolean/Phrase | 10,407 |
| S60 | MM "Case Studies" | Search modes ‐ Boolean/Phrase | 623 |
| S61 | PT letter | Search modes ‐ Boolean/Phrase | 198,888 |
| S62 | MH "Drug Therapy+" | Search modes ‐ Boolean/Phrase | 109,541 |
| S63 | MH "Surgery, Operative+" | Search modes ‐ Boolean/Phrase | 385,583 |
| S64 | MH "Biochemical Phenomena+" | Search modes ‐ Boolean/Phrase | 29,949 |
| S65 | MH "Obesity+/DT/EC/RA/RT/SU" | Search modes ‐ Boolean/Phrase | 5,470 |
| S66 | MH "Human Immunodeficiency Virus+" | Search modes ‐ Boolean/Phrase | 5,947 |
| S67 | MH "HIV Infections+" | Search modes ‐ Boolean/Phrase | 62,282 |
| S68 | TI cancer | Search modes ‐ Boolean/Phrase | 137,532 |
| S69 | TI tumor OR tumour | Search modes ‐ Boolean/Phrase | 21,392 |
| S70 | TI lung | Search modes ‐ Boolean/Phrase | 24,925 |
| S71 | TI asthma | Search modes ‐ Boolean/Phrase | 15,732 |
| S72 | S57 OR S58 OR S59 OR S60 OR S61 OR S62 OR S63 OR S64 OR S65 OR S66 OR S67 OR S68 OR S69 OR S70 OR S71 | Search modes ‐ Boolean/Phrase | 913,702 |
| S73 | S56 NOT S72 | Search modes ‐ Boolean/Phrase | 765 |
CENTRAL search run as part of the update in March 2014
#1 lipid near (low* or reduc* or modifi*)
#2 cholesterol* near (low* or modifi* or reduc*)
#3 (#1 or #2)
#4 MeSH descriptor: [Nutrition Therapy] explode all trees
#5 diet* or food* or nutrition*
#6 (#4 or #5)
#7 (#3 and #6)
#8 fat* near (low* or reduc* or modifi* or animal* or saturat* or unsaturat*)
#9 MeSH descriptor: [Diet, Atherogenic] explode all trees
#10 MeSH descriptor: [Diet Therapy] explode all trees
#11 (#7 or #8 or #9 or #10)
#12 MeSH descriptor: [Cardiovascular Diseases] this term only
#13 MeSH descriptor: [Heart Diseases] explode all trees
#14 MeSH descriptor: [Vascular Diseases] explode all trees
#15 MeSH descriptor: [Cerebrovascular Disorders] this term only
#16 MeSH descriptor: [Brain Ischemia] explode all trees
#17 MeSH descriptor: [Carotid Artery Diseases] explode all trees
#18 MeSH descriptor: [Dementia, Vascular] explode all trees
#19 MeSH descriptor: [Intracranial Arterial Diseases] explode all trees
#20 MeSH descriptor: [Intracranial Embolism and Thrombosis] explode all trees
#21 MeSH descriptor: [Intracranial Hemorrhages] explode all trees
#22 MeSH descriptor: [Stroke] explode all trees
#23 coronar* near (bypas* or graft* or disease* or event*)
#24 cerebrovasc* or cardiovasc* or mortal* or angina* or stroke or strokes or tia or ischaem* or ischem*
#25 myocardi* near (infarct* or revascular* or ischaem* or ischem*)
#26 morbid* near (heart* or coronar* or ischaem* or ischem* or myocard*)
#27 vascular* near (peripheral* or disease* or complication*)
#28 heart* near (disease* or attack* or bypas*)
#29 (#12 or #13 or #14 or #15 or #16 or #17 or #18 or #19 or #20 or #21 or #22 or #23 or #24 or #25 or #26 or #27 or #28)
#30 (#11 and #29)
Data and analyses
Comparison 1. Lower fat vs higher fat diet.
| Outcome or subgroup title | No. of studies | No. of participants | Statistical method | Effect size |
|---|---|---|---|---|
| 1.1 Weight, kg | 26 | 53875 | Mean Difference (IV, Random, 95% CI) | ‐1.42 [‐1.73, ‐1.10] |
| 1.2 BMI, kg/m2 | 14 | 46539 | Mean Difference (IV, Random, 95% CI) | ‐0.47 [‐0.64, ‐0.30] |
| 1.3 Waist circumference, cm | 3 | 16620 | Mean Difference (IV, Random, 95% CI) | ‐0.47 [‐0.73, ‐0.22] |
| 1.4 Body fat, % | 2 | 2350 | Mean Difference (IV, Random, 95% CI) | ‐0.28 [‐0.57, 0.00] |
| 1.5 Total cholesterol, mmol/L | 22 | 9812 | Mean Difference (IV, Random, 95% CI) | ‐0.23 [‐0.32, ‐0.14] |
| 1.6 LDL cholesterol, mmol/L | 19 | 8137 | Mean Difference (IV, Random, 95% CI) | ‐0.13 [‐0.21, ‐0.05] |
| 1.7 HDL cholesterol, mmol/L | 20 | 8268 | Mean Difference (IV, Random, 95% CI) | ‐0.02 [‐0.03, 0.00] |
| 1.8 Triglycerides, mmol/L | 18 | 8672 | Mean Difference (IV, Random, 95% CI) | 0.01 [‐0.05, 0.07] |
| 1.9 Total cholesterol/HDL | 5 | 3639 | Mean Difference (IV, Random, 95% CI) | ‐0.05 [‐0.14, 0.04] |
| 1.10 Systolic blood pressure, mmHg | 10 | 6078 | Mean Difference (IV, Random, 95% CI) | ‐0.75 [‐1.42, ‐0.07] |
| 1.11 Diastolic blood pressure, mmHg | 10 | 6077 | Mean Difference (IV, Random, 95% CI) | ‐0.52 [‐0.95, ‐0.09] |
| 1.12 Quality of life | 1 | 40130 | Mean Difference (IV, Random, 95% CI) | 0.04 [0.01, 0.07] |
Comparison 2. Lower fat vs higher fat diet on body weight, sensitivity analyses.
| Outcome or subgroup title | No. of studies | No. of participants | Statistical method | Effect size |
|---|---|---|---|---|
| 2.1 Weight, kg SA fixed effects | 26 | 53875 | Mean Difference (IV, Fixed, 95% CI) | ‐0.94 [‐1.05, ‐0.82] |
| 2.2 Weight, kg SA including only RCTs at low summary RoB | 26 | 53875 | Mean Difference (IV, Random, 95% CI) | ‐1.42 [‐1.73, ‐1.10] |
| 2.2.1 Low summary RoB | 4 | 42212 | Mean Difference (IV, Random, 95% CI) | ‐0.67 [‐0.82, ‐0.52] |
| 2.2.2 Moderate /High RoB | 22 | 11663 | Mean Difference (IV, Random, 95% CI) | ‐1.60 [‐2.00, ‐1.20] |
| 2.3 Weight, kg SA excluding the largest trial, WHI | 25 | 12522 | Mean Difference (IV, Random, 95% CI) | ‐1.51 [‐1.86, ‐1.15] |
| 2.4 Weight, kg SA excluding RCTs not free of systematic differences in care | 7 | 1641 | Mean Difference (IV, Random, 95% CI) | ‐0.89 [‐1.17, ‐0.60] |
| 2.5 Weight, kg SA excluding studies not free of dietary differences other than fat | 18 | 5112 | Mean Difference (IV, Random, 95% CI) | ‐1.63 [‐2.07, ‐1.19] |
| 2.6 Weight, kg SA excluding studies with potential compliance problems | 20 | 50907 | Mean Difference (IV, Random, 95% CI) | ‐1.56 [‐1.88, ‐1.23] |
| 2.7 Weight, kg including partial data | 35 | 59013 | Mean Difference (IV, Random, 95% CI) | ‐1.42 [‐1.73, ‐1.10] |
Comparison 3. Lower fat vs higher fat diet on body weight, subgrouping.
| Outcome or subgroup title | No. of studies | No. of participants | Statistical method | Effect size |
|---|---|---|---|---|
| 3.1 Weight, kg Subgrouping by trial duration | 26 | Mean Difference (IV, Random, 95% CI) | Subtotals only | |
| 3.1.1 duration 6 to < 12 months | 12 | 4298 | Mean Difference (IV, Random, 95% CI) | ‐1.35 [‐1.78, ‐0.92] |
| 3.1.2 duration 12 to < 24 months | 16 | 51665 | Mean Difference (IV, Random, 95% CI) | ‐2.07 [‐2.57, ‐1.56] |
| 3.1.3 duration 24 to < 60 months | 9 | 49171 | Mean Difference (IV, Random, 95% CI) | ‐1.18 [‐1.65, ‐0.70] |
| 3.1.4 duration 60+ months | 5 | 41300 | Mean Difference (IV, Random, 95% CI) | ‐1.00 [‐1.79, ‐0.21] |
| 3.2 Weight, kg Subgrouping by baseline fat intake | 26 | 53875 | Mean Difference (IV, Random, 95% CI) | ‐1.42 [‐1.73, ‐1.10] |
| 3.2.1 > 35%E from fat | 13 | 45802 | Mean Difference (IV, Random, 95% CI) | ‐1.25 [‐1.59, ‐0.91] |
| 3.2.2 > 30 to 35%E from fat | 11 | 6322 | Mean Difference (IV, Random, 95% CI) | ‐0.81 [‐1.40, ‐0.22] |
| 3.2.3 > 25 to 30%E from fat | 2 | 1751 | Mean Difference (IV, Random, 95% CI) | ‐3.17 [‐3.82, ‐2.52] |
| 3.3 Weight, kg Subgrouping by decade of first publication | 26 | 53875 | Mean Difference (IV, Random, 95% CI) | ‐1.42 [‐1.73, ‐1.10] |
| 3.3.1 1960s | 1 | 35 | Mean Difference (IV, Random, 95% CI) | ‐4.10 [‐8.06, ‐0.14] |
| 3.3.2 1970s | 0 | 0 | Mean Difference (IV, Random, 95% CI) | Not estimable |
| 3.3.3 1980s | 2 | 288 | Mean Difference (IV, Random, 95% CI) | ‐0.91 [‐1.80, ‐0.01] |
| 3.3.4 1990s | 11 | 5689 | Mean Difference (IV, Random, 95% CI) | ‐1.86 [‐2.49, ‐1.22] |
| 3.3.5 2000s | 7 | 46502 | Mean Difference (IV, Random, 95% CI) | ‐1.15 [‐1.85, ‐0.46] |
| 3.3.6 2010s | 5 | 1361 | Mean Difference (IV, Random, 95% CI) | ‐1.04 [‐1.58, ‐0.51] |
| 3.4 Weight, kg Subgrouping by sex | 26 | 53875 | Mean Difference (IV, Random, 95% CI) | ‐1.42 [‐1.73, ‐1.10] |
| 3.4.1 Studies of women only | 14 | 49877 | Mean Difference (IV, Random, 95% CI) | ‐1.49 [‐1.98, ‐1.00] |
| 3.4.2 Studies of men only | 3 | 304 | Mean Difference (IV, Random, 95% CI) | ‐2.74 [‐4.32, ‐1.17] |
| 3.4.3 Studies of men & women | 10 | 3694 | Mean Difference (IV, Random, 95% CI) | ‐1.02 [‐1.45, ‐0.59] |
| 3.5 Weight, kg Subgrouping by difference in %E from fat between control & reduced fat groups | 26 | 53875 | Mean Difference (IV, Random, 95% CI) | ‐1.36 [‐1.67, ‐1.06] |
| 3.5.1 Up to 5%E fat difference | 6 | 3136 | Mean Difference (IV, Random, 95% CI) | ‐0.15 [‐0.77, 0.47] |
| 3.5.2 5% to < 10% E fat difference | 9 | 44641 | Mean Difference (IV, Random, 95% CI) | ‐1.76 [‐2.25, ‐1.28] |
| 3.5.3 10% to < 15%E fat difference | 6 | 5664 | Mean Difference (IV, Random, 95% CI) | ‐1.23 [‐1.72, ‐0.74] |
| 3.5.4 15+%E fat difference | 5 | 404 | Mean Difference (IV, Random, 95% CI) | ‐3.91 [‐7.61, ‐0.22] |
| 3.5.5 %E fat difference not stated | 1 | 30 | Mean Difference (IV, Random, 95% CI) | ‐2.43 [‐4.20, ‐0.66] |
| 3.6 Weight, kg Subgrouping by achieving < 30%E from fat | 26 | 53875 | Mean Difference (IV, Random, 95% CI) | ‐1.42 [‐1.73, ‐1.10] |
| 3.6.1 Intervention did not achieve < 30%E from fat or less | 6 | 1139 | Mean Difference (IV, Random, 95% CI) | ‐0.90 [‐1.32, ‐0.47] |
| 3.6.2 Intervention achieved < 30%E from fat or less | 20 | 52736 | Mean Difference (IV, Random, 95% CI) | ‐1.55 [‐1.93, ‐1.18] |
| 3.7 Weight, kg Subgrouping by type of intervention | 26 | 53875 | Mean Difference (IV, Random, 95% CI) | ‐1.42 [‐1.73, ‐1.10] |
| 3.7.1 Dietary advice | 22 | 52433 | Mean Difference (IV, Random, 95% CI) | ‐1.65 [‐2.09, ‐1.21] |
| 3.7.2 Dietary advice plus supplements | 2 | 915 | Mean Difference (IV, Random, 95% CI) | ‐0.97 [‐1.29, ‐0.65] |
| 3.7.3 Diet provided | 2 | 527 | Mean Difference (IV, Random, 95% CI) | ‐0.61 [‐0.84, ‐0.39] |
| 3.8 Weight, kg Subgrouping by lower fat arm fat goal | 26 | 53875 | Mean Difference (IV, Random, 95% CI) | ‐1.42 [‐1.73, ‐1.10] |
| 3.8.1 Goal 30%E from fat | 2 | 213 | Mean Difference (IV, Random, 95% CI) | ‐0.96 [‐1.66, ‐0.26] |
| 3.8.2 Goal 25 to < 30%E from fat | 5 | 1470 | Mean Difference (IV, Random, 95% CI) | ‐1.77 [‐2.56, ‐0.99] |
| 3.8.3 Goal 20 to < 25%E from fat | 4 | 2456 | Mean Difference (IV, Random, 95% CI) | ‐0.71 [‐0.96, ‐0.46] |
| 3.8.4 Goal 15 to < 20%E from fat | 13 | 49481 | Mean Difference (IV, Random, 95% CI) | ‐1.73 [‐2.35, ‐1.10] |
| 3.8.5 Goal 10 to < 15%E from fat | 0 | 0 | Mean Difference (IV, Random, 95% CI) | Not estimable |
| 3.8.6 Goal unclear | 2 | 255 | Mean Difference (IV, Random, 95% CI) | ‐1.82 [‐4.93, 1.28] |
| 3.9 Weight, kg Subgrouping by mean BMI at baseline | 26 | 53875 | Mean Difference (IV, Random, 95% CI) | ‐1.42 [‐1.73, ‐1.10] |
| 3.9.1 BMI at baseline < 25 | 9 | 1936 | Mean Difference (IV, Random, 95% CI) | ‐0.86 [‐1.34, ‐0.37] |
| 3.9.2 BMI at baseline ≥ 25 to 29.9 | 15 | 51113 | Mean Difference (IV, Random, 95% CI) | ‐1.66 [‐2.11, ‐1.21] |
| 3.9.3 BMI at baseline ≥ 30 | 1 | 462 | Mean Difference (IV, Random, 95% CI) | ‐1.99 [‐3.40, ‐0.59] |
| 3.9.4 BMI at baseline unclear | 1 | 364 | Mean Difference (IV, Random, 95% CI) | ‐1.70 [‐2.52, ‐0.88] |
| 3.10 Weight, kg Subgrouping by baseline health status | 26 | 53875 | Mean Difference (IV, Random, 95% CI) | ‐1.42 [‐1.73, ‐1.10] |
| 3.10.1 Healthy people, not recruited on the basis of risk factors or illness | 4 | 44088 | Mean Difference (IV, Random, 95% CI) | ‐0.88 [‐1.26, ‐0.49] |
| 3.10.2 People recruited on the basis of risk factors such as lipids, BMI, hormone levels, risk scores | 11 | 2833 | Mean Difference (IV, Random, 95% CI) | ‐1.85 [‐2.49, ‐1.21] |
| 3.10.3 People with disease such as DM, MI, cancer, polypsp | 11 | 6954 | Mean Difference (IV, Random, 95% CI) | ‐1.48 [‐2.16, ‐0.80] |
| 3.11 Weight, kg Subgrouping by assessed energy reduction | 26 | 53875 | Mean Difference (IV, Random, 95% CI) | ‐1.42 [‐1.73, ‐1.10] |
| 3.11.1 E intake the same or greater in low fat group | 4 | 3159 | Mean Difference (IV, Random, 95% CI) | ‐0.59 [‐0.85, ‐0.32] |
| 3.11.2 E intake 1 to 100kcal/d less in low fat group | 5 | 2442 | Mean Difference (IV, Random, 95% CI) | ‐1.04 [‐1.68, ‐0.41] |
| 3.11.3 E intake 101 to 200 kcal/d less in low fat group | 5 | 43221 | Mean Difference (IV, Random, 95% CI) | ‐0.74 [‐1.38, ‐0.10] |
| 3.11.4 E intake > 201 kcal/d less in low fat group | 7 | 4406 | Mean Difference (IV, Random, 95% CI) | ‐2.22 [‐2.83, ‐1.61] |
| 3.11.5 E intake unclear | 6 | 647 | Mean Difference (IV, Random, 95% CI) | ‐2.07 [‐3.33, ‐0.80] |
Characteristics of studies
Characteristics of included studies [ordered by study ID]
Anderson 1990.
| Study characteristics | ||
| Methods | RCT Summary risk of bias: moderate to high |
|
| Participants | Moderately hypercholesterolaemic, non‐obese Caucasian men and women aged 30 to 50 (USA)
CVD risk: moderate
Control: randomised 62, analysed 51
Intervention: randomised 56, analysed 47
Mean years in trial: control 0.91, intervention 0.92
% male: control 61, intervention 66
Age: mean control 40.3 (SD 5.4), intervention 40.7 (SD 5.2) (all 30 to 50) Baseline BMI: not reported |
|
| Interventions | Reduced fat diet vs usual diet Control aims: no diet intervention Intervention aims: 25%E from fats, 20%E from protein, 55%E from CHO, < 200 mg cholesterol/day (also an intervention arm with similar aims plus increased fibre intake) Control methods: no intervention Intervention methods: seminars and individual eating patterns taught, 10 weeks teaching and 40 weeks maintenance Weight goals: participants were directed to maintain initial body weight throughout the study. Total fat intake (at 1 year): low fat 30 (SD 7.5), control 31 (SD 5.7) %E Saturated fat intake (at 1 year): low fat 9 (SD 2.7), control 10 (SD 2.9) %E Style: diet advice Setting: community |
|
| Outcomes | Stated trial outcomes: diet composition, lipids Available outcomes: weight, total, LDL and HDL cholesterol |
|
| Notes | AHA phase II diet (low fat) compared to control group here; a further arm was not used, the low fat plus high fibre arm. This trial was called "Kentucky Low Fat" in previous versions of this review. |
|
| Risk of bias | ||
| Bias | Authors' judgement | Support for judgement |
| Random sequence generation (selection bias) | Low risk | "matched on age, gender & cholesterol level, randomly assigned to intervention group using systematic random procedure" |
| Allocation concealment (selection bias) | Unclear risk | Randomisation method not clearly described |
| Blinding of participants and personnel (performance bias) All outcomes | High risk | Participants knew allocation. |
| Blinding of outcome assessment (detection bias) | High risk | Researchers knew allocation. |
| Incomplete outcome data (attrition bias) All outcomes | High risk | 20 of 118 (17%) lost over 1 year (> 10% per year) |
| Selective reporting (reporting bias) | Unclear risk | Protocol not seen |
| Other bias | Low risk | None noted |
| Free of systematic difference in care? | High risk | See 'Control methods' and 'Intervention methods' in the 'Interventions' section above |
| Free of dietary differences other than fat? | Low risk | (The high fibre arm has not been used in the data set). See 'Control aims' and 'Intervention aims' in the 'Interventions' section above |
| Compliance problems | High risk | No significant difference in total fat intake |
AUSMED 2018.
| Study characteristics | ||
| Methods | RCT AUStralian MEDiterranean diet trial for secondary prevention of heart disease (AusMed) Summary risk of bias: moderate to high |
|
| Participants | Adults within one year of acute MI (Australia)
CVD risk: high Control (Med diet): 37 randomised, 27 analysed at 1 year Intervention (low fat): 36 randomised, 21 analysed Mean years in trial: control 1.0, intervention 1.0 % male: control 79%, intervention 87% Age, years: mean control 61.8 (SD 9.2), intervention 61.8 (SD 9.5) Baseline BMI: mean control 30.8 (SE 0.9), intervention 29.0 (SE 0.9) |
|
| Interventions | Low fat vs Med diet Control (Med diet): 35‐40%E total fat (of which ≥ 50% MUFA), 15‐20%E protein, 40‐45%E CHO Intervention (Low fat diet): < 30%E total fat, < 7%E SFA, 45‐65% CHO, 15‐25% protein, ≤ 5%E alcohol Control methods: Client‐centred counselling and goal‐setting with dietitian. Received 2‐week model meal plan, MedDiet resource kit, recipe book, shopping list, weekly food intake checklist, label info. Hamper of foods provided at baseline and 3 months including olive oil, nuts, tinned fish and legumes, Greek yogurt. Consultation frequency and data time points were consistent across both arms. Intervention methods: Client‐centred counselling and goal‐setting with dietitian. Received resources on low fat cooking, label reading, Supermarket vouchers provided at the 3 face‐to‐face appointments. Weight goals: both diets provided ad libitum with no specific recommendations on energy restriction Total fat intake (at 6 mo): low fat 30.3 (SD 7.2), control 38.7 (SD 7.9) %E Saturated fat intake(at 6 mo): low fat 10.3 (SD 3.5), control 9.5 (SD 2.4) %E Style: diet advice with supplementary foods Setting: community |
|
| Outcomes | Stated trial outcomes: primary cardiac endpoints at 12 months, secondary lipids, inflammatory markers, coagulation factors, dietary adherence, body composition and anthropometry, BP, activity, QoL (SF36), adipokine markers, adhesion molecule markers Available outcomes: weight, BMI, waist circumference, percentage body fat, lipids, BP (however weight, BMI, waist circumference, body fat, LDL, TG & BP data were too different at baseline to use these data in meta‐analysis). |
|
| Notes | Funding: La Trobe University. | |
| Risk of bias | ||
| Bias | Authors' judgement | Support for judgement |
| Random sequence generation (selection bias) | Low risk | Randomised using a computer‐generated stratification (by age and sex) |
| Allocation concealment (selection bias) | Unclear risk | Unclear, randomisation performed by statistician |
| Blinding of participants and personnel (performance bias) All outcomes | High risk | Participants were aware of their dietary allocation. |
| Blinding of outcome assessment (detection bias) | Unclear risk | Unclear who assessed anthropometry or whether they were blinded |
| Incomplete outcome data (attrition bias) All outcomes | High risk | 21 of 36 (58%) in low fat intervention, and 27 of 37 (73%) in Med diet were assessed at 12 months (> 10% dropouts per year) |
| Selective reporting (reporting bias) | High risk | Trials registry entry in 2016, recruitment started in 2014, recruitment ended in 2018. Some data, such as QoL do not appear to be published yet. |
| Other bias | Low risk | None noted |
| Free of systematic difference in care? | Low risk | Consultation frequency and data time points were consistent across both arms. |
| Free of dietary differences other than fat? | High risk | No, variety of other differences, including advice on fruit and vegetables, fish, legumes etc. |
| Compliance problems | Low risk | Statistically significant difference in fat intake at 6 months |
BDIT Pilot Studies 1996.
| Study characteristics | ||
| Methods | RCT Breast Dysplasia Intervention Trial (BDIT) Summary risk of bias: moderate to high |
|
| Participants | Women with mammographic dysplasia (Canada)
CVD risk: low
Control: 147 randomised, 78 analysed
Intervention: 148 randomised, 76 analysed
Mean years in trial: control 7.5, intervention 6.8
% male: 0
Age: mean control 45, intervention 44 (all > 30) Baseline BMI: mean intervention 24.3 (SD 3.8), control 24.3 (SD 3.6) |
|
| Interventions | Reduced fat intake vs usual diet Control aims: healthy diet advice, no alteration in dietary fat advised, aim to maintain weight Intervention aims: total fat 15%E, replace fat by complex CHO, aim to maintain weight Control methods: seen for advice once every 4 months for 12 months Intervention methods: seen for advice once a month for 12 months Weight goal: low fat group ‐ "isocaloric exchange of complex carbohydrate for fat. We tried to maintain an isocaloric diet to avoid weight loss...". Not discussed for control group Total fat intake (at 9.2 years): low fat 31.7 (SD 7.3) %E, control 35.3 (SD 5.6) %E Saturated fat intake (at 9.2 years): low fat 10.6 (SD 4.6) %E, control 12.3 (SD 4.6) %E Style: diet advice Setting: community |
|
| Outcomes | Stated trial outcomes: dietary fat, serum cholesterol Available outcomes: weight, BMI, total and HDL cholesterol |
|
| Notes | Weight data available for 1 year, 2 years and 9 years. Unclear whether participants were still in the trial by 9 years, so 2‐year data used in main analysis | |
| Risk of bias | ||
| Bias | Authors' judgement | Support for judgement |
| Random sequence generation (selection bias) | Unclear risk | "randomly allocated" |
| Allocation concealment (selection bias) | Unclear risk | Randomisation not described, though randomisation occurred after baseline assessment |
| Blinding of participants and personnel (performance bias) All outcomes | High risk | Participants not blinded |
| Blinding of outcome assessment (detection bias) | Low risk | Outcome assessors blinded to intervention |
| Incomplete outcome data (attrition bias) All outcomes | Low risk | 141 of 295 (48%) lost over 8 years (< 10% per year) |
| Selective reporting (reporting bias) | Unclear risk | Protocol not seen |
| Other bias | Low risk | None noted |
| Free of systematic difference in care? | High risk | Women in intervention group seen more frequently. See 'Control methods' and 'Intervention methods' in the 'Interventions' section above |
| Free of dietary differences other than fat? | Low risk | See 'Control aims' and 'Intervention aims' in the 'Interventions' section above |
| Compliance problems | Low risk | Significant difference in total fat intake |
beFIT 1997.
| Study characteristics | ||
| Methods | RCT Summary risk of bias: moderate to high |
|
| Participants | Women and men with mild hypercholesterolaemia (USA)
CVD risk: moderate
Control: unclear how many randomised, 192 analysed
Intervention: unclear how many randomised, 217 analysed
Mean years in trial: unclear (max duration 0.5 years)
% male: 52 (not divided by intervention group)
Age: mean 43.2 (not divided by intervention group) (all > 30) Baseline BMI (not reported by intervention): women with hypercholesterolaemia (n = 84) mean 25.9 (SD 4.9), women with combined hyperlipidaemia (n = 94) mean 29.2 (SD 6.1), men with hypercholesterolaemia (n = 123) mean 26.6 (SD 3.3), men with combined hyperlipidaemia (n = 108) mean 27.5 (SD 3.2) |
|
| Interventions | Reduced and modified fat vs usual diet Control aims: asked to delay dietary changes (provided intervention after the randomised trial) Intervention aims: total fat < 30%E, SFA < 7%E, dietary cholesterol < 200 mg/d Control methods: usual intake Intervention methods: 8 weekly classes with nutrition info and behaviour modification with spouses, plus individual appointments at 3 and 6 months Weight goals: intervention group "assigned food group pattern for their calorie needs", no information for control group Total fat intake (at 6 months): intervention 25.2 (SD unclear) %E, control unclear ‐ no significant difference from baseline 34 (SD unclear) %E Saturated fat intake (at 6 months): intervention 7.6% (SD unclear) %E, control unclear ‐ no significant difference from baseline 12 (SD unclear) %E Style: diet advice Setting: community |
|
| Outcomes | Stated trial outcomes: lipids Available outcomes: weight, total, LDL and HDL cholesterol, TG (but variance data only provided for the randomised comparison for LDL cholesterol) |
|
| Notes | Weight: control 'no change', intervention ‐2.7 kg at 6 months | |
| Risk of bias | ||
| Bias | Authors' judgement | Support for judgement |
| Random sequence generation (selection bias) | Low risk | Stratified random sampling scheme |
| Allocation concealment (selection bias) | Unclear risk | Allocation method not clearly described |
| Blinding of participants and personnel (performance bias) All outcomes | High risk | Participants knew their allocation. |
| Blinding of outcome assessment (detection bias) | Unclear risk | Unclear whether outcome assessors were blinded |
| Incomplete outcome data (attrition bias) All outcomes | Unclear risk | Unclear what proportion lost over trial as unclear how many recruited |
| Selective reporting (reporting bias) | High risk | Protocol not seen |
| Other bias | Low risk | None noted |
| Free of systematic difference in care? | High risk | Intensive intervention for intervention group, but no intervention during the 6 months of the randomised part of the study for the control group. See 'Control methods' and 'Intervention methods' in the 'Interventions' section above |
| Free of dietary differences other than fat? | Low risk | See 'Control aims' and 'Intervention aims' in the 'Interventions' section above |
| Compliance problems | Unclear risk | Unclear (as data not provided for control group), though there appears to be a big difference in total fat intake at 6 months |
Black 1994.
| Study characteristics | ||
| Methods | RCT Summary risk of bias: moderate to high |
|
| Participants | People with non‐melanoma skin cancer (USA)
CVD risk: low
Control: randomised 67, analysed 58
Intervention: randomised 66, analysed 38
Mean years in trial: 1.9
% male: control 67%, intervention 54%
Age: mean control 52.3 (SD 13.2), intervention 50.6 (SD 9.7) Baseline BMI: data not provided |
|
| Interventions | Reduced fat vs usual diet Control aims: no dietary advice Intervention aims: total fat 20%E, protein 15%E, CHO 65%E Control methods: no dietary change, 4 monthly clinic visits Intervention methods: 8 weekly classes, with behavioural techniques, plus 4 monthly clinic visits Weight goals: "to maintain body weight .... patients were instructed to increase their intake of carbohydrate, particularly complex carbohydrate" Total fat intake ("during study" months 4 to 24): low fat 20.7 (SD 5.5), control 37.8 (SD 4.1) %E Saturated fat intake ("during study" months 4 to 24): low fat 6.6 (SD 1.8), control 12.8 (SD 2.0) %E Style: diet advice Setting: community |
|
| Outcomes | Stated trial outcomes: incidence of actinic keratosis and non‐melanoma skin cancer Available outcomes: none (weight data provided, but no variance info) |
|
| Notes | At 2 years: control ‐1.5 kg, n = 50?, intervention: ‐1 kg, n = 51? This trial was named "Veterans Dermatology" in previous versions of this review. |
|
| Risk of bias | ||
| Bias | Authors' judgement | Support for judgement |
| Random sequence generation (selection bias) | Low risk | "list of randomly generated numbers" |
| Allocation concealment (selection bias) | Unclear risk | Allocation method not clearly described |
| Blinding of participants and personnel (performance bias) All outcomes | High risk | Participants were aware of assignment. |
| Blinding of outcome assessment (detection bias) | Low risk | Physician blinding: adequate |
| Incomplete outcome data (attrition bias) All outcomes | High risk | 37 of 133 (28%) lost over 2 years (> 10% per year) |
| Selective reporting (reporting bias) | Unclear risk | Protocol not seen |
| Other bias | Low risk | None noted |
| Free of systematic difference in care? | High risk | All had 4 monthly clinic visits; the intervention group had 8 behavioural technique classes that the control group did not have. |
| Free of dietary differences other than fat? | Low risk | See 'Control aims' and 'Intervention aims' in the 'Interventions' section above |
| Compliance problems | Low risk | Big and statistically significant difference in total fat intake between arms |
Bloemberg 1991.
| Study characteristics | ||
| Methods | RCT Summary risk of bias: moderate to high |
|
| Participants | Men with untreated raised total cholesterol (the Netherlands)
CVD risk: moderate
Control: randomised 41, analysed 40
Intervention: randomised 39, analysed 39
Mean years in trial: control 0.5, randomised 0.5
% male: 100%
Age: mean control 47.5 (SD 8.0), intervention 47.2 (SD 8.3) Baseline BMI: mean control 26.3 (SD 2.3), intervention 26.0 (SD 2.6) |
|
| Interventions | Reduced and modified fat vs usual diet Control aims: usual diet Intervention aims: 30%E from fat, PUFA/SFA 1.0, dietary cholesterol 20 mg Control methods: no advice provided Intervention methods: individual advice provided face‐to‐face, followed by 2 phone calls and 5 mailings of information on healthy foods Weight goals: weight and calories not mentioned Total fat intake (change to 6 months): intervention ‐5.0 (SD 6.5) (33.5 overall), control ‐1.5 (SD 5.9) (36.8 overall) %E Saturated fat intake (change to 6 months): intervention ‐4.3 (SD 3.9), control ‐0.7 (SD 2.9) %E Style: diet advice Setting: community |
|
| Outcomes | Stated trial outcomes: lipids Available outcomes: weight, total and HDL cholesterol |
|
| Notes | — | |
| Risk of bias | ||
| Bias | Authors' judgement | Support for judgement |
| Random sequence generation (selection bias) | Low risk | "randomised" and stratified by age and BMI (each dichotomised) |
| Allocation concealment (selection bias) | Unclear risk | No method stated (as above) |
| Blinding of participants and personnel (performance bias) All outcomes | High risk | Participants not blinded |
| Blinding of outcome assessment (detection bias) | Unclear risk | Laboratory staff blinded, but unclear re weight |
| Incomplete outcome data (attrition bias) All outcomes | Low risk | 1 of 80 (< 1%) lost over 0.5 years (< 10% per year) |
| Selective reporting (reporting bias) | Unclear risk | No protocol or trials registration found |
| Other bias | Low risk | None noted |
| Free of systematic difference in care? | High risk | Much more time spent on those in the intervention group |
| Free of dietary differences other than fat? | Low risk | Dietary focus on fats alone |
| Compliance problems | Low risk | Significant difference in total fat intake, supported by borderline total cholesterol difference |
Boyd 1988.
| Study characteristics | ||
| Methods | RCT Summary risk of bias: moderate to high |
|
| Participants | Women with severe cyclical mastopathy for at least 5 years (Canada)
CVD risk: low
Control: randomised 10, analysed 9
Intervention: randomised 11, analysed 10
Mean years in trial: control 0.45, intervention 0.45
% male: 0%
Age: mean control 36, intervention 38 (variances unclear) Baseline BMI: no data provided |
|
| Interventions | Reduced fat vs usual diet Control aims: given principles of healthy diet, not counselled to alter fat content Intervention aims: total fat 15%E, CHO 65%E Control methods: seen every 2 months to monitor symptoms, nutrition and biochemistry Intervention methods: seen monthly to monitor symptoms, nutrition and biochemistry, teaching materials included food guide, recipes, product information and advice on eating out Weight goals: the intervention goals included the isocaloric replacement of complex carbohydrate for fat (no mention for control group) Total fat intake (at 6 months): low fat 22.8 (SD unclear), control 33.4 (SD unclear) %E Saturated fat intake (at 6 months): low fat 8.8 (SD unclear), control 12.3 (SD unclear) %E Style: diet advice Setting: community |
|
| Outcomes | Stated trial outcomes: mastopathy symptoms, plasma hormone and lipids Available outcomes: weight, total cholesterol (but variance data not provided) |
|
| Notes | Total cholesterol rose by 0.09 mmol/L in control group (from 4.5 to 4.59) and fell by 0.15 mmol/L in intervention group (4.84 to 4.69). Weight changed in the intervention group (mean fall of 2.1 kg over 6 months, no variance provided), but change, or otherwise, in control group not mentioned. This trial was called "Mastopathy Diet" in previous versions of this review. |
|
| Risk of bias | ||
| Bias | Authors' judgement | Support for judgement |
| Random sequence generation (selection bias) | Unclear risk | "randomly allocated" |
| Allocation concealment (selection bias) | Unclear risk | Allocation method not clearly described |
| Blinding of participants and personnel (performance bias) All outcomes | High risk | Participants were not blinded. |
| Blinding of outcome assessment (detection bias) | Low risk | Those assessing physical outcomes were blinded; those assessing symptoms were not. |
| Incomplete outcome data (attrition bias) All outcomes | High risk | 2 of 21 (10%) lost over 0.5 years (> 10% per year) |
| Selective reporting (reporting bias) | Unclear risk | Protocol not seen |
| Other bias | Low risk | None noted |
| Free of systematic difference in care? | High risk | Minor differences in follow‐up frequency. See 'Control methods' and 'Intervention methods' in the 'Interventions' section above |
| Free of dietary differences other than fat? | Low risk | See 'Control aims' and 'Intervention aims' in the 'Interventions' section above |
| Compliance problems | Low risk | While variance not provided there was a very big difference in total fat intake. |
BRIDGES 2001.
| Study characteristics | ||
| Methods | RCT Breast Research Initiative for Determining Effective Strategies for Coping with Breast Cancer (BRIDGES) Summary risk of bias: moderate to high |
|
| Participants | Women diagnosed with stage I or II breast cancer over the past 2 years (USA)
CVD risk: low
Control: randomised unclear (at least 56), analysed 46
Intervention: randomised unclear (at least 50), analysed 48
Mean years in trial: unclear (1 year max follow‐up)
% male: 0
Age: mean control unclear (71% postmenopausal), intervention unclear (56% postmenopausal) (all 20 to 65) Baseline BMI: not reported |
|
| Interventions | Reduced fat vs usual diet Control aims: no formal intervention Intervention diet aims: total fat 20%E, high fibre, plant‐based micronutrients Intervention stress: separate parallel arm, stress reduction programme (data not used here) Control methods: no formal intervention Intervention methods: nutrition intervention programme, 15 sessions (42 hours) over 15 weeks, group‐based, dietitian‐led, 2 individual sessions using social cognitive theory and patient centred counselling to increase self efficacy and confidence Weight goals: "reduction in body mass was not a primary goal of NEP. (NEP was neither designed nor presented to participants as a weight loss or weight control program)." The control group was presented as "individual choice". Total fat intake (at 12 months): low fat 29.9 (SD unclear), control 33.6 (SD unclear) %E Saturated fat intake: unclear Style: diet advice Setting: community |
|
| Outcomes | Stated trial outcomes: diet and BMI Available outcomes: weight |
|
| Notes | — | |
| Risk of bias | ||
| Bias | Authors' judgement | Support for judgement |
| Random sequence generation (selection bias) | Low risk | "randomised", stratified by medical centre, cancer stage and age; randomised number/envelope method by project coordinator |
| Allocation concealment (selection bias) | Low risk | The project coordinator had contact with those from the University of Massachusetts, but not those from the other 3 centres, and allocation could not be altered later. |
| Blinding of participants and personnel (performance bias) All outcomes | High risk | Participants not blinded |
| Blinding of outcome assessment (detection bias) | Unclear risk | Unclear whether researchers were blinded |
| Incomplete outcome data (attrition bias) All outcomes | High risk | Unclear how many recruited, so unclear how many were lost to follow‐up (at least 12 of 106 (11%) over 1 year, so > 10%/year |
| Selective reporting (reporting bias) | Unclear risk | Protocol not seen |
| Other bias | Low risk | None noted |
| Free of systematic difference in care? | High risk | High‐intensity programme for intervention group, nothing for control group. See 'Control methods' and 'Intervention methods' in the 'Interventions' section above |
| Free of dietary differences other than fat? | High risk | Intervention also focused on fibre and plant‐based micronutrients. See 'Control aims' and 'Intervention aims' in the 'Interventions' section above |
| Compliance problems | Unclear risk | Unclear if difference in total fat intake between arms was statistically significant as no variance provided |
Canadian DBCP 1997.
| Study characteristics | ||
| Methods | RCT Canadian Diet and Breast Cancer Prevention (Canadian DBCP) Summary risk of bias: moderate to high |
|
| Participants | Women with mammographic densities > 50% breast area (Canada)
CVD risk: low
Control: randomised 448+, analysed 401
Intervention: randomised 448+, analysed 388
Mean years in trial: control 2.0, randomised 2.0 (note, papers suggested a 10‐year follow‐up overall)
% male: 0%
Age: mean control 45.9 (SD unclear), intervention 46.5 (SD unclear) Baseline BMI: mean control 23.6, intervention 23.4, no variance reported |
|
| Interventions | Reduced fat vs usual diet Control aims: usual diet Intervention aims: total fat 15%E, protein 20%E, CHO 65%E, isocaloric diet Control methods: encouraged to continue usual diet, interviewed by dietitian every 4 months during first year, then every 3 months in the second year Intervention methods: dietary prescription using food exchange (fat calories replaced by CHO), met with dietitian monthly during first year, then every 3 months. Scales, recipes, shopping guide provided Weight goals: "calories derived from fat were replaced by isocaloric exchange with carbohydrate" Total fat intake (at 2 years): intervention 21.3 (SD 6.2), control 31.8 (SD 6.7) %E Saturated fat intake (at 2 years): intervention 7.1 (SD 2.5), control 11.5 (SD 3.3) %E Style: diet advice Setting: community |
|
| Outcomes | Stated trial outcomes: incidence of breast cancer Available outcomes: weight |
|
| Notes | Weight data available for 1 and 2 years, 2‐year data used in main analysis | |
| Risk of bias | ||
| Bias | Authors' judgement | Support for judgement |
| Random sequence generation (selection bias) | Low risk | Randomly allocated by telephone to Dept. of Biostatistics at Ontario Cancer Institute, stratified by centre |
| Allocation concealment (selection bias) | Low risk | As above |
| Blinding of participants and personnel (performance bias) All outcomes | High risk | Participants knew what arm they were in. |
| Blinding of outcome assessment (detection bias) | Unclear risk | Unclear who measured or whether blinded |
| Incomplete outcome data (attrition bias) All outcomes | Low risk | At least 107 of at least 896 (12%) lost over 2 years (< 10% per year) |
| Selective reporting (reporting bias) | Unclear risk | No protocol found |
| Other bias | Low risk | None reported |
| Free of systematic difference in care? | High risk | Minor difference in attention for participants in intervention and control in first year |
| Free of dietary differences other than fat? | Low risk | Focus on dietary fat |
| Compliance problems | Low risk | Significant difference in self‐reported total fat intake at 2 years, no reported lipids to confirm |
CORDIOPREV 2016.
| Study characteristics | ||
| Methods | RCT CORonary Diet Intervention with Olive oil and cardiovascular PREVention study (CORDIOPREV study) Summary risk of bias: low |
|
| Participants | People with CHD and with high CVD risk (Spain)
CVD risk: high Control (Mediterranean diet): 502 randomised, no. analysed varied between publications Intervention: 500 randomised, no. analysed varied between publications Mean years in trial: aim 7.5 years follow‐up published for some outcomes % male: control 84%, intervention 83% Age, years: mean control 59.7 (SE 0.4), intervention 59.5 (SE 0.4) Baseline BMI: mean control 31.0 (SE 0.1), intervention 31.2 (SE 0.2) |
|
| Interventions | Low fat vs Mediterranean diet Control: Mediterranean diet, 35+%E fat (< 10%E SFA, 22%E MUFA, 6%E PUFA), 15%E protein, up to 50%E CHO, cholesterol < 300mg/d Intervention: Low fat, < 30%E fat (< 10%E SFA, 12‐14%E MUFA, 6‐8%E PUFA), 15%E protein, up to 55+%E CHO, cholesterol < 300mg/d Med diet methods: personalised dietetic interviews and support at start and 6‐monthly, quarterly group education including talks, meal plans, recipes, shopping lists etc, some baskets of appropriate foods provided occasionally. Olive oil provided free for whole family. Low fat methods: personalised dietetic interviews and support at start and 6‐monthly, quarterly group education including talks, meal plans, recipes, shopping lists etc, some baskets of appropriate foods provided occasionally. Weight goals: no energy restriction (in either arm) Total fat intake (at 5 years): low fat 31.7 (SD 6.0), control 41.0 (SD 6.3) %E Saturated fat intake (at 5 years): low fat 7.1 (SD 2.0), control 8.0 (SD 2.1) %E Style: diet advice plus supplementary foods Setting: community |
|
| Outcomes | Stated trial outcomes: primary cardiovascular events, secondary intermittent claudication, LDL, lipid ratios, metabolic responses to CHO (glucose and insulin), BP, malignancy, cognition, CVD progression all at 7 years Available outcomes: weight, BMI, waist circumference, dietary intake, lipids (LDL and some HDL data too different at baseline to use in meta‐analysis) |
|
| Notes | Note: 7‐year completion is due in 2020, current published data are from 2 or 5‐year follow‐up. Also, caution, total cholesterol data in Gomez‐Delgado 2015 is surprising as the change in total cholesterol was not mirrored in changes in LDL, HDL or TGs. Funding: CORDIOPREV was supported by Fundacion Patrimonio Comunal Olivarero. Additional funding was received from CITOLIVA, CEAS, Junta de Andalucia (Consejeria de Salud, Consejeria de Agricultura y Pesca, Consejeria de Innovacion, Ciencia y Empresa), Diputaciones de Jaen y Cordoba, Centro de Excelencia en Investigacion sobre Aceite de Oliva y Salud and Ministerio de Medio Ambiente, Medio Rural y Marino, and the Spanish Government. |
|
| Risk of bias | ||
| Bias | Authors' judgement | Support for judgement |
| Random sequence generation (selection bias) | Low risk | Randomisation was stratified by sex, age and previous MI. |
| Allocation concealment (selection bias) | Low risk | Randomisation was carried out by a third party (Andalusian School of Public Health). |
| Blinding of participants and personnel (performance bias) All outcomes | High risk | Participants were aware of their dietary allocation. |
| Blinding of outcome assessment (detection bias) | Low risk | Dietitians were the only members of the intervention team who knew dietary assignments. |
| Incomplete outcome data (attrition bias) All outcomes | Low risk | Dropout levels appeared acceptable, for example, of non‐diabetics, 21 of 246 (9%) Med diet and 41 of 216 (19%) Low fat dropped out by 5 years, < 10%/year. |
| Selective reporting (reporting bias) | Unclear risk | Unclear, trials registry (registered 2009, trial due to complete in 2020) outcomes are all 7‐year assessments, and trial has not reached 7 years yet. |
| Other bias | Low risk | None noted |
| Free of systematic difference in care? | Low risk | Yes, time and intervention type appear similar between the two groups with the possible exception that olive oil was provided to control group participants. |
| Free of dietary differences other than fat? | Unclear risk | Unclear, stated they were assessing dietary patterns, but differences other than fat and CHO levels were not clarified |
| Compliance problems | Low risk | 5‐year difference in self‐reported total fat was statistically significant. |
De Bont 1981.
| Study characteristics | ||
| Methods | RCT Summary risk of bias: moderate to high |
|
| Participants | Women with type 2 diabetes (UK)
CVD risk: moderate
Control: randomised unclear (total in control and intervention 148), analysed 65 (for obese and non‐obese)
Intervention: randomised unclear, analysed 71 (for obese and non‐obese)
Mean years in trial: control 0.5, randomised 0.5
% male: 0%
Age: mean control 54 (SD 8), intervention 56 (SD 7), (all 35 to 64) (for obese and non‐obese) Baseline BMI: non‐obese chosen for BMI < 28, obese mean not reported |
|
| Interventions | Reduced and modified fat vs usual diet Control aims: usual diet but with CHO ≤ 40%E Intervention aims: 30%E from fat, focus on reducing meat fat, dairy foods and substituting margarines to improve the SFA/PUFA ratio; CHO increased to maintain energy intake Control methods: 3 home visits from a nutritionist over the 6 months of the trial Intervention methods: 3 home visits from a nutritionist over the 6 months of the trial Weight goals: to maintain the required total energy intake, the proportion of carbohydrates in these diets was increased. Total fat intake (change to 6 months): intervention ‐10.1 (SD 10.8) (overall 31.1), control ‐1.0 (SD 10.5) (overall 41.8) %E (for obese and non‐obese) Saturated fat intake (change to 6 months): intervention ‐8.1 (SD 5.8), control ‐1.1 (SD 5.7) %E (for obese and non‐obese) Style: diet advice Setting: community |
|
| Outcomes | Stated trial outcomes: diet, weight, lipids Available outcomes: weight, total and HDL cholesterol, triglycerides |
|
| Notes | Outcome data separated by those obese (BMI ≥ 28) or not obese at baseline | |
| Risk of bias | ||
| Bias | Authors' judgement | Support for judgement |
| Random sequence generation (selection bias) | Unclear risk | "randomly allocated" |
| Allocation concealment (selection bias) | Unclear risk | No information provided |
| Blinding of participants and personnel (performance bias) All outcomes | High risk | Participants not blinded |
| Blinding of outcome assessment (detection bias) | Unclear risk | Unclear whether outcome assessors blinded |
| Incomplete outcome data (attrition bias) All outcomes | High risk | 12 of 148 (8%) lost over 0.5 years (> 10% per year) |
| Selective reporting (reporting bias) | Unclear risk | No protocol found |
| Other bias | Low risk | None noted |
| Free of systematic difference in care? | Low risk | Follow‐up similar |
| Free of dietary differences other than fat? | Low risk | Diet focused on fat |
| Compliance problems | Low risk | Statistically significant difference in total cholesterol and in fat intake between arms |
DEER 1998.
| Study characteristics | ||
| Methods | RCT Diet and Exercise for Elevated Risk (DEER) Summary risk of bias: moderate to high |
|
| Participants | Men and postmenopausal women with raised LDL and low HDL cholesterol (USA)
CVD risk: moderate
Control:
Intervention:
Mean years in trial: control 1.0, intervention 1.0 % male: 100% in male arms, 0% in female arms Age: mean 47.8 (SD 8.9) for all men (exercise and non‐exercise arms) Age: mean 56.9 (SD 5.1) for all women (exercise and non‐exercise arms) Baseline BMI:
|
|
| Interventions | Reduced fat vs usual diet Control aims: usual diet (and exercise intervention) Intervention aims: NCEP step 2 diet: < 30%E from fat, < 7%E from SFA, < 200 mg/d cholesterol (and exercise intervention) Control methods: no advice provided Intervention methods: individual advice provided face‐to‐face, followed by 8 1‐hour group sessions during first 12 weeks, then monthly contact with dietitians by mail, phone, individual or group appointment Weight goals: "weight loss was not emphasised" Total fat intake (change to 12 months):
Saturated fat intake (change to 12 months):
Style: diet advice Setting: community |
|
| Outcomes | Stated trial outcomes: dietary intake and lipids Available outcomes: weight, total, LDL and HDL cholesterol, triglycerides, systolic and diastolic BP |
|
| Notes | Factorial trial with regards to exercise and reported by sex | |
| Risk of bias | ||
| Bias | Authors' judgement | Support for judgement |
| Random sequence generation (selection bias) | Low risk | Assignments by computer, modified Efron procedure, balanced by HDL and LDL |
| Allocation concealment (selection bias) | Unclear risk | Not described |
| Blinding of participants and personnel (performance bias) All outcomes | High risk | Participants aware of randomisation group |
| Blinding of outcome assessment (detection bias) | Unclear risk | Unclear |
| Incomplete outcome data (attrition bias) All outcomes | Low risk | 10 of 377 (3%) lost over 1 year (< 10% per year) |
| Selective reporting (reporting bias) | Unclear risk | Trials registry entry dated 1999, study completed in 1996 |
| Other bias | Low risk | None noted |
| Free of systematic difference in care? | High risk | Very different levels of attention and review |
| Free of dietary differences other than fat? | Low risk | Dietary focus on fat |
| Compliance problems | Low risk | Reported a statistically significant reduction in total fat in low fat compared to control arms, supported by the statistically significant reduction in LDL in low fat compared to control arms |
Diet and Hormone Study 2003.
| Study characteristics | ||
| Methods | RCT Summary risk of bias: moderate to high |
|
| Participants | Healthy premenopausal women aged 20 to 40 years (USA)
CVD risk: low Control: randomised 107, analysed 96 Intervention: randomised 106, analysed 81 Mean years in trial: control 0.95, intervention 0.88 % male: 0% Age: control mean 33.3, intervention 33.5 (SDs not given) Baseline BMI: mean control 23.8 (SD 3.5), intervention 23.7 (SD 4.2) |
|
| Interventions | Reduced fat vs usual diet Control aims: usual diet Intervention aims: < 20%E from fat, 25 to 30 g/d fibre, > 8 servings/d fruit and vegetables, CHO 60% to 65%E, protein 15% to 20%E Control methods: received a pamphlet on healthy eating (minimal intervention) Intervention methods: classroom nutrition education (18 group classes) plus 2 individual counselling sessions over 12 months covering knowledge and behavioural skills; appropriate foods served at intervention sessions Weight goals: "not encouraged to reduce total caloric intake and weight was monitored to maintain within 2 kg of baseline weight" Total fat intake (at 12 cycles/months): intervention 22.2 (SD 7.2), control 30.7 (SD 7.5) %E Saturated fat intake (at 12 cycles/months): intervention 14.9 (SD 6.7), control 23.9 (SD 13.2) g/d Style: diet advice Setting: community |
|
| Outcomes | Stated trial outcomes: hormonal responses Available outcomes: weight, BMI, dietary intake, hormones, menstrual cycle length |
|
| Notes | No answer to requests for data on deaths or health events. Weight and BMI data provided at 4 and 12 cycles | |
| Risk of bias | ||
| Bias | Authors' judgement | Support for judgement |
| Random sequence generation (selection bias) | Low risk | "randomly assigned by reference to a random number table" |
| Allocation concealment (selection bias) | Unclear risk | Not described |
| Blinding of participants and personnel (performance bias) All outcomes | High risk | Participants knew allocation. |
| Blinding of outcome assessment (detection bias) | High risk | Researchers knew allocation. |
| Incomplete outcome data (attrition bias) All outcomes | High risk | 36 of 213 (17%) lost over 1 year (> 10% per year). Reasons not stated, greater losses in intervention group |
| Selective reporting (reporting bias) | Unclear risk | No protocol found |
| Other bias | Low risk | None noted |
| Free of systematic difference in care? | High risk | Very different levels of attention and review |
| Free of dietary differences other than fat? | High risk | Intervention group also asked to increase fibre, fruit and vegetables substantially |
| Compliance problems | Low risk | Statistically significant difference between arms in total fat intake |
Ma 2016.
| Study characteristics | ||
| Methods | RCT Summary risk of bias: low |
|
| Participants | Adults with uncontrolled persistent asthma (USA)
CVD risk: low Control (usual diet): 44 randomised, 44 analysed (ITT analysis, 5 dropouts) Intervention (DASH diet): 46 randomised, 46 analysed (ITT analysis, 3 dropouts) Mean years in trial: control 0.5, intervention 0.5 % male: control 39%, intervention 28% Age, years: mean control 51.4 (SD 12.9), intervention 52.2 (SD 11.9) Baseline BMI: mean overall 27.9 (SD 4.8) |
|
| Interventions | Low fat (DASH) vs usual diet Control: usual diet Intervention: DASH diet, 27%E from fat, 9‐12 servings/d fruit & vegetables, 2‐3 servings/d low fat dairy products, reducing SFA, limiting sodium, increase whole grains, nuts, seeds, legumes plus decreased sugar intake, moderate alcohol intake Control methods: standard care Intervention methods: intensive intervention over first 3 months (8 group and 3 individual sessions each 45‐60 min), then counselling phone calls monthly for 20‐30 min over next 3 months Weight goals: fat intake estimated from caloric needs for weight maintenance Total fat intake (change to 6 months): low fat ‐5.3 (SE 4.8), control ‐4.7 (SE 4.7) g/d Saturated fat intake: unclear Style: diet advice Setting: community |
|
| Outcomes | Stated trial outcomes: primary Juniper asthma control questionnaire, secondary lung function, asthma specific QoL, asthma symptom‐free days, asthma‐related healthcare utilisation, diet adherence, psychosocial predictors of dietary change, comorbidities, generic health‐related QoL Available outcomes: weight, BMI, BP, lipids (waist circumference measured but not reported by intervention arm) |
|
| Notes | Funding: National Heart Lung and Blood Institute, and Palo Alto Medical Foundation Research Institute | |
| Risk of bias | ||
| Bias | Authors' judgement | Support for judgement |
| Random sequence generation (selection bias) | Low risk | Web‐based random allocation system |
| Allocation concealment (selection bias) | Low risk | Randomisation performed by designated personnel without the ability to influence its execution |
| Blinding of participants and personnel (performance bias) All outcomes | High risk | Participants knew their assignments as they needed to follow the dietary advice. |
| Blinding of outcome assessment (detection bias) | Low risk | "blinding of outcome assessment and adjudication, data and safety monitoring, and data analysis will be enforced". |
| Incomplete outcome data (attrition bias) All outcomes | Low risk | ITT analysis (although 8 of 90 dropped out over 6 months, > 10% per year, all were analysed) |
| Selective reporting (reporting bias) | High risk | Trials registration 2012, start date 2013, trial end 2014. Most prespecified outcomes appeared to be reported, though not QoL. |
| Other bias | Low risk | None noted |
| Free of systematic difference in care? | High risk | Very different level of support and time with investigators in the two arms |
| Free of dietary differences other than fat? | High risk | DASH included fruit and vegetable, sodium, alcohol etc. advice as well as fat intake |
| Compliance problems | High risk | No significant difference in fat intake between arms |
MeDiet 2006.
| Study characteristics | ||
| Methods | RCT MeDiet Project Summary risk of bias: moderate to high |
|
| Participants | Healthy postmenopausal women with above median serum testosterone (Italy)
CVD risk: low
Control: randomised 57, analysed at 6 months 55
Intervention: randomised 58, analysed at 6 months 51
Mean years in trial: control 4.38, intervention 4.28
% male: 0
Age: mean unclear (age range 48 to 69) Baseline BMI: not reported |
|
| Interventions | Reduced and modified fat vs usual diet Control aims: advised to increase fruit and vegetable intake Intervention aims: taught Sicilian diet including reduced total, saturated and omega‐6 fats, increased blue fish (high in omega 3), increased whole cereals, legumes, seeds, fruit and vegetables Control methods: advice Intervention methods: taught Sicilian diet and cooking by professional chefs, with a weekly cooking course including social dinners Weight goals: not mentioned Total fat intake (at 6 months): low and mod fat 30.9 (SD 11.4), control 34.0 (SD 11.8) %E Saturated fat intake (at 6 months): low and mod fat 8.4 (SD 3.0), control 11.2 (SD 5.0) %E Style: diet advice Setting: community |
|
| Outcomes | Stated trial outcomes: breast cancer, weight, lipids, well‐being Available outcomes: weight |
|
| Notes | Weight data provided at 6 months (fall of 0.6 kg in control group, fall of 1.3 kg in intervention group), but without variance information | |
| Risk of bias | ||
| Bias | Authors' judgement | Support for judgement |
| Random sequence generation (selection bias) | Unclear risk | "individually randomised" |
| Allocation concealment (selection bias) | Unclear risk | Allocation method not clearly described |
| Blinding of participants and personnel (performance bias) All outcomes | High risk | Participants were aware of assignment |
| Blinding of outcome assessment (detection bias) | Unclear risk | Unclear |
| Incomplete outcome data (attrition bias) All outcomes | Low risk | 9 of 115 (8%) lost over 4 years (< 10% per year) |
| Selective reporting (reporting bias) | Unclear risk | Protocol not seen |
| Other bias | Low risk | None noted |
| Free of systematic difference in care? | High risk | Intensive cookery course with social element compared with brief advice. See 'Control methods' and 'Intervention methods' in the 'Interventions' section above |
| Free of dietary differences other than fat? | High risk | Both groups encouraged to increase fruit and vegetables, but intervention group also encouraged to increase fish, pulses, seeds and whole grains |
| Compliance problems | High risk | No significant difference in total fat between arms |
Moy 2001.
| Study characteristics | ||
| Methods | RCT Summary risk of bias: moderate to high |
|
| Participants | Middle‐aged siblings of people with early CHD, with at least one CVD risk factor (USA)
CVD risk: moderate
Control: randomised 132, analysed 118
Intervention: randomised 135, analysed 117
Mean years in trial: 1.9
% male: control 49%, intervention 55%
Age: control mean 45.7 (SD 7), intervention 46.2 (SD 7) Baseline BMI: control mean 29.5 (SD 7), intervention 28.5 (SD 5) |
|
| Interventions | Reduced fat intake vs usual diet Control: physician management (physicians informed on risk factor management) Intervention: nurse management, aim total fat 40 g/d or less Control methods: physician management with risk factor management at 0, 1 and 2 years Intervention methods: nurse management, appointments 6‐ to 8‐weekly for 2 years Weight goals: not mentioned Total fat intake (at 2 years): low fat 34.1 (SD unclear), control 38.0 (SD unclear) %E Saturated fat intake (at 2 years): low fat 11.5 (SD unclear), control 14.4 (SD unclear) %E Style: diet advice Setting: community |
|
| Outcomes | Stated trial outcomes: dietary intake Available outcomes: BMI, HDL and LDL cholesterol, TG |
|
| Notes | — | |
| Risk of bias | ||
| Bias | Authors' judgement | Support for judgement |
| Random sequence generation (selection bias) | Low risk | Randomly assigned via computerised schema after all eligible siblings from a family had been screened |
| Allocation concealment (selection bias) | Unclear risk | Allocation method not clearly described |
| Blinding of participants and personnel (performance bias) All outcomes | High risk | Participants knew their allocation |
| Blinding of outcome assessment (detection bias) | Unclear risk | Trialists clear about allocation, though unclear whether outcome assessors knew allocation |
| Incomplete outcome data (attrition bias) All outcomes | Low risk | 32 of 267 (12%) lost over 2 years (< 10% per year) |
| Selective reporting (reporting bias) | Unclear risk | Protocol not seen |
| Other bias | Low risk | None noted |
| Free of systematic difference in care? | High risk | Differences in frequency of follow‐up, but unclear what differences in care occurred between the physician and nurse‐led care. See 'Control methods' and 'Intervention methods' in the 'Interventions' section above |
| Free of dietary differences other than fat? | Unclear risk | See 'Control aims' and 'Intervention aims' in the 'Interventions' section above |
| Compliance problems | Low risk | Total fat intake not clearly statistically significantly different, though lower in intervention arm, however LDL was statistically significantly lower in intervention. |
MSFAT 1995.
| Study characteristics | ||
| Methods | RCT Summary risk of bias: moderate to high |
|
| Participants | Healthy people aged 20 to 55 (Netherlands)
CVD risk: low
Control: randomised unclear (120?), analysed 103
Intervention: randomised unclear (120?), analysed 117
Mean years in trial: control 0.46, intervention 0.49
% male: control 50%, intervention 50%
Age: mean control men 35.6 (SD 10), control women 36.0 (SD 11), intervention men 35.5 (SD 11), intervention women 36.0 (SD 12) (all 19 to 55) Baseline BMI: mean control men 24.9 (SD 2.2), control women 25 (SD 2), intervention men 24.9 (SD 2.3), intervention women 24.7 (SD 2) |
|
| Interventions | Reduced fat vs usual diet Control aims: advised to use products from trial shop ad lib. (usual fat products provided) Intervention aims: advised to use products from trial shop ad lib. (low fat products provided) Control methods: participants obtained foods in a study shop at least once a week Intervention methods: participants obtained foods in a study shop at least once a week Weight goals: ad libitum diet Total fat intake (at 6 months): low fat 34.7 (SD unclear), control 42.7 (SD unclear) %E Saturated fat intake (at 6 months): low fat 14.2 (SD unclear), control 18.2 (SD unclear) %E Style: food provided Setting: community |
|
| Outcomes | Stated trial outcomes: weight, vitamin and fatty acid intake, anti‐oxidative capacity Available outcomes: weight (for subgroup), weight and lipids provided for larger group, but without variance data |
|
| Notes | Change from baseline to 6 months for whole group (control 103, intervention 117): Weight, kg: 1.1, 0.4 Total cholesterol, mmol/L: 0.07, ‐0.09 HDL cholesterol, mmol/L: ‐0.03, ‐0.06 LDL cholesterol, mmol/L: 0.15, 0.16 TG, mmol/L: 0.04, ‐0.04 |
|
| Risk of bias | ||
| Bias | Authors' judgement | Support for judgement |
| Random sequence generation (selection bias) | Low risk | "stratified randomisation (according to sex, age, QI index and eating behaviour) by coordinating centre", a statistician at Unilever Research, SAS software, and allocation could not be altered later |
| Allocation concealment (selection bias) | Low risk | "stratified randomisation (according to sex, age, QI index and eating behaviour) by coordinating centre", a statistician at Unilever Research, SAS software, and allocation could not be altered later |
| Blinding of participants and personnel (performance bias) All outcomes | High risk | Participants aware of allocation. |
| Blinding of outcome assessment (detection bias) | Unclear risk | Unclear for weight; staff analysing biochemistry were not blinded |
| Incomplete outcome data (attrition bias) All outcomes | High risk | 20 of 240 (8%) lost over 0.5 years (> 10% per year) |
| Selective reporting (reporting bias) | Unclear risk | Protocol not seen |
| Other bias | Low risk | Not noted |
| Free of systematic difference in care? | Low risk | Both groups used study shop. See 'Control methods' and 'Intervention methods' in the 'Interventions' section above |
| Free of dietary differences other than fat? | Low risk | See 'Control aims' and 'Intervention aims' in the 'Interventions' section above |
| Compliance problems | Low risk | Big difference between total fat in the two arms, though no variance provided |
NDHS Open 1st L&M 1968.
| Study characteristics | ||
| Methods | RCT National Diet‐Heart Study (NDHS) Summary risk of bias: low |
|
| Participants | Free‐living men (USA)
CVD risk: low
Control: randomised 382, analysed 348
Intervention B: randomised 385, analysed 332 Intervention X: randomised 54, analysed 46 Mean years in trial: control 1.0, B 0.9, X 0.9 % male: 100 Age: unclear (all 45 to 54) Baseline BMI: not reported |
|
| Interventions | Reduced and modified fat diet vs usual diet Control aims: total fat 40%E, SFA 16%E to 18%E, dietary cholesterol 650 to 750 mg/d, P/S 0.4 Intervention B: total fat 30%E, SFA < 9%E, dietary cholesterol 350 to 450 mg/d, PUFA 15%E, P/S 1.5 Intervention X: total fat 30%E, SFA < 9%E, dietary cholesterol 350 to 450 mg/d, PUFA 15%E, P/S 1.5 Control methods: dietary advice to reduce saturated fat and cholesterol (plus 10 follow‐up visits with nutritionist), purchase of 'usual fat' items from a trial shop Intervention B methods: dietary advice to reduce saturated fat and cholesterol (plus 10 follow‐up visits with nutritionist), plus purchase of appropriately reduced and modified fat items from a trial shop Intervention X methods: dietary advice but no trial shop Weight goals: weight and calories not mentioned Total fat intake (through study): B 29.7 (SD unclear) %E, X 31.7 (SD unclear), control 34.9 (SD unclear) %E Saturated fat intake (through study): B 7.1 (SD unclear) %E, X 8.9 (SD unclear), control 11.6 (SD unclear) %E Style: B diet provided, X ‐ diet advice Setting: community |
|
| Outcomes | Stated trial outcomes: lipid levels and dietary assessment Available outcomes: total cholesterol (some weight and BP data presented but no variance info) |
|
| Notes | At 52 weeks, weight change in the control was not presented, weight change in B was ‐2.4 kg. Average weight change over the first year (mean of weights at weeks 6, 12, 20, 28, 36 and 44 weeks) was ‐2.45 kg (‐5.4lb) for the low fat group (B) and ‐1.95 kg (‐4.3lb) for the control group (D) At 52 weeks, diastolic BP change from baseline was ‐2.2 kg in control, ‐1.9 in B and ‐5.8 in X |
|
| Risk of bias | ||
| Bias | Authors' judgement | Support for judgement |
| Random sequence generation (selection bias) | Low risk | Stratified randomisation by the statistical centre |
| Allocation concealment (selection bias) | Low risk | Stratified randomisation by the statistical centre |
| Blinding of participants and personnel (performance bias) All outcomes | Low risk | Intervention B: all reduced saturated fat and purchased blinded foods from a trial shop, double‐blind Intervention X: no trial shop, so participants not blinded, though those analysing blood samples etc. were |
| Blinding of outcome assessment (detection bias) | Low risk | Outcome assessors blinded for all outcomes for intervention B, and for lipids etc for intervention X |
| Incomplete outcome data (attrition bias) All outcomes | High risk | 87 of 821 (11%) lost over 1 year (> 10% per year) |
| Selective reporting (reporting bias) | Unclear risk | Protocol not seen |
| Other bias | Low risk | None noted |
| Free of systematic difference in care? | Low risk | Yes for intervention B (as both intervention and control received dietary advice and purchased food from trial shop). No for intervention X (as it did not include a trial shop as in the control group). See 'Control methods' and 'Intervention methods' in the 'Interventions' section above |
| Free of dietary differences other than fat? | Low risk | See 'Control aims' and 'Intervention aims' in the 'Interventions' section above |
| Compliance problems | Unclear risk | Differences in total fat intake, but no variance provided |
NDHS Open 2nd L&M 1968.
| Study characteristics | ||
| Methods | RCT National Diet‐Heart Study (NDHS) Summary risk of bias: moderate to high |
|
| Participants | Free‐living men who had participated in NDHS 1st studies (USA)
CVD risk: low
Control: randomised 304, analysed 215
Intervention BC (this study had a range of interventions, we were interested in BC for the systematic review): randomised 194, analysed 179
Mean years in trial: control 0.6, intervention BC 0.6
% male: 100
Age: unclear (all 45 to 54) Baseline BMI: not reported |
|
| Interventions | Reduced and modified fat vs usual diet Control aims: total fat 40%E, SFA 16%E to 18%E, dietary cholesterol 650 to 750 mg/d, P/S 0.4, X ‐ advice to continue usual diet Intervention aims: BC total fat 30%E to 40%E, SFA reduced, dietary cholesterol 350 to 450 mg/d, increased PUFA, P/S 1.5 to 2.0 Control methods: dietary advice to reduce saturated fat and cholesterol (plus 10 follow‐up visits with nutritionist), purchase of 'usual fat' items from a trial shop Intervention BC methods: dietary advice to reduce saturated fat and cholesterol (plus 10 follow‐up visits with nutritionist), plus purchase of appropriately reduced and modified fat items from a trial shop Weight goals: weight and calories not mentioned Total fat intake (through study): BC 32.5 (SD unclear) %E, control 35.5 (SD unclear) %E Saturated fat intake (through study): BC 7.4 (SD unclear) %E, control 12.0 (SD unclear) %E Style: food provided Setting: community |
|
| Outcomes | Stated trial outcomes: lipid levels and dietary assessment Available outcomes: weight |
|
| Notes | Weight data provided for the BC intervention group ‐1.8 kg (‐4 lb over 6 months), and ‐0.9 kg (‐2 lb). No info provided for the control group (D) | |
| Risk of bias | ||
| Bias | Authors' judgement | Support for judgement |
| Random sequence generation (selection bias) | Low risk | Stratified randomisation by the statistical centre |
| Allocation concealment (selection bias) | Low risk | Stratified randomisation by the statistical centre |
| Blinding of participants and personnel (performance bias) All outcomes | High risk | Some participants continued with advice to reduce saturated fat and purchased blinded foods from a trial shop, but half of the participants were instructed in their own purchase of appropriate foods from normal shops to compile their own dietary regimen. |
| Blinding of outcome assessment (detection bias) | Unclear risk | Unclear |
| Incomplete outcome data (attrition bias) All outcomes | High risk | 104 of 498 (21%) lost over 0.6 years (> 10% per year) |
| Selective reporting (reporting bias) | Unclear risk | Protocol not seen |
| Other bias | Low risk | None noted |
| Free of systematic difference in care? | Low risk | Trial shop used by both groups, plus dietary advice. See 'Control methods' and 'Intervention methods' in the 'Interventions' section above |
| Free of dietary differences other than fat? | Low risk | See 'Control aims' and 'Intervention aims' in the 'Interventions' section above |
| Compliance problems | Unclear risk | Unclear as no variance provided for total fat intakes |
Nordevang 1990.
| Study characteristics | ||
| Methods | RCT Summary risk of bias: moderate to high |
|
| Participants | Women who had had surgery for breast cancer (Sweden)
CVD risk: low
Control: randomised 121, analysed 63
Intervention: randomised 119, analysed 106
Mean years in trial: control 1.9, randomised 1.5
% male: 0%
Age: mean 58 (not described by randomisation group) Baseline BMI: intervention 6 BMI < 20, 81 BMI 20 to 24.9, 34 BMI ≥ 25; control 9 BMI < 20, 74 BMI 20 to 24.9, 36 BMI ≥ 25 |
|
| Interventions | Reduced fat vs usual diet Control aims: usual diet Intervention aims: 20%E to 25%E from fat, increase energy from CHO to replace lost energy Control methods: no advice provided, only seen at baseline and 2 years Intervention methods: 4 to 6 sessions during the first 2 months, group meetings every 6 to 8 weeks, evening classes in low fat cooking, 3 monthly counselling during the first year, then at 18 months Weight goals: "The total energy and/or protein intake was to be held constant". Total fat intake (at 2 years): intervention ‐12.9 (SD unclear) (24 overall), control ‐3.1 (SD unclear) (34.1 overall) %E Saturated fat intake (change to 2 years): intervention ‐6.8 (SD unclear), control ‐1.9 (SD unclear) %E Style: diet advice Setting: community |
|
| Outcomes | Stated trial outcomes: dietary intake Available outcomes: weight, BMI |
|
| Notes | No exact variance or P values reported for weight and BMI outcomes, so have estimated variance from P < 0.05 for the difference between the 2 arms for weight. As P > 0.05 for BMI no variance could be estimated This trial was named "Swedish Breast Cancer" in previous versions of this review. |
|
| Risk of bias | ||
| Bias | Authors' judgement | Support for judgement |
| Random sequence generation (selection bias) | Unclear risk | "randomly assigned" |
| Allocation concealment (selection bias) | Unclear risk | No details provided |
| Blinding of participants and personnel (performance bias) All outcomes | High risk | Participants not blinded |
| Blinding of outcome assessment (detection bias) | Unclear risk | Unclear for those assessing outcomes |
| Incomplete outcome data (attrition bias) All outcomes | High risk | Outcome data ignored for those who dropped out (48% of the intervention group), > 10%/year |
| Selective reporting (reporting bias) | Unclear risk | No protocol found |
| Other bias | Low risk | None noted |
| Free of systematic difference in care? | High risk | Different levels of time and follow‐up in the 2 groups |
| Free of dietary differences other than fat? | Low risk | Focus on fat |
| Compliance problems | Low risk | Very big difference between groups, though no variance reported |
Nutrition & Breast Health.
| Study characteristics | ||
| Methods | RCT Summary risk of bias: moderate to high |
|
| Participants | Premenopausal women at increased risk of breast cancer (USA)
CVD risk: low
Control: randomised 53, analysed 50
Intervention: randomised 69, analysed 47
Mean years in trial: control 1.0, intervention 0.8
% male: control 0%, intervention 0%
Age: mean 38 (SD 7) ‐ not provided by study arm (all 21 to 50) Baseline BMI: not reported |
|
| Interventions | Reduced fat vs usual diet Control aims: followed usual diet, given daily food guide pyramid (half of this group randomised to 9 portions/d of fruit and vegetables advice) Intervention aims: total fat 15%E (half of this group randomised to 9 portions/d of fruit and vegetables advice) Control methods: no dietary counselling (offered this at the end of study), but those given fruit and vegetables advice had support as below Intervention methods: met dietitian every 2 weeks until compliant, monthly group meetings, counselling on home diets, restaurants, parties, social support, eating at work, exchange booklets, cookbook Weight goals: "goals were derived such that baseline energy intake would be maintained while meeting study goals". Total fat intake (at 12 months): low fat 15.7 (SD 5.1) %E, control 32.7 (SD 6.1) %E Saturated fat intake (at 12 months): low fat 7.2 (SD unclear) %E, control 11.6 (SD unclear) %E Style: diet advice Setting: community |
|
| Outcomes | Stated trial outcomes: body weight, dietary compliance Available outcomes: weight, total, LDL and HDL cholesterol, TG, BMI (but variance data not provided for any but weight) |
|
| Notes | Change from baseline to 12 months for the control (n = 23), control plus fruit and vegetables (n = 25), low fat (n = 24), low fat plus fruit and vegetables (n = 23):
For weight, end data only are provided (no change data) although the intervention group was considerably heavier at baseline (149 lb and 154 lb) than control groups (both 143 lb) |
|
| Risk of bias | ||
| Bias | Authors' judgement | Support for judgement |
| Random sequence generation (selection bias) | Low risk | The statistician made envelopes ahead of time; dietitians handed out envelopes at first visit. |
| Allocation concealment (selection bias) | Low risk | Allocation could not be altered once made. |
| Blinding of participants and personnel (performance bias) All outcomes | High risk | Participants were aware of allocation. |
| Blinding of outcome assessment (detection bias) | High risk | Researchers were not blinded. |
| Incomplete outcome data (attrition bias) All outcomes | High risk | 15 of 122 (12%) lost over 1 year (> 10% per year) |
| Selective reporting (reporting bias) | Unclear risk | Protocol not seen |
| Other bias | Low risk | None noted |
| Free of systematic difference in care? | High risk | High levels of intervention for those on low fat or high fruit and vegetable diets. See 'Control methods' and 'Intervention methods' in the 'Interventions' section above |
| Free of dietary differences other than fat? | Low risk | Randomisation to fruit and vegetable intervention was independent of low fat allocation |
| Compliance problems | Low risk | Significant difference in total fat between arms |
ODMDC 2017.
| Study characteristics | ||
| Methods | RCT with 3 arms Optimal Dietary Macronutrient Distribution in China (ODMDC) Summary risk of bias: low |
|
| Participants | Healthy young adults (China)
CVD risk: low Control:
Intervention:
Mean years in trial: control 0.5, intervention 0.5 % male: control high fat: 52%, control mod fat: 48%, intervention low fat 50% Age, mean (SD), years: control high fat 23.7 (4.3), control mod fat 23.2 (3.9), intervention low fat 23.4 (3.6), range 18‐35 Baseline BMI, mean (SD): control high fat 21.9 (25), control mod fat 21.8 (2.6), intervention low fat 21.7 (2.5) |
|
| Interventions | Low fat vs moderate fat vs high fat Control:
Intervention:
Control & intervention methods: all food provided, encouraged to maintain usual fruit intake and usual levels of physical activity. Diets composed by replacing white rice and wheat flour with soybean oil. Weight goals: "isocaloric" Total fat intake (during intervention):
Saturated fat intake: unclear Style: all food provided |
|
| Outcomes | Stated trial outcomes: primary weight change, secondary waist circumference, blood pressure, lipids, glucose, insulin, glycated protein, adiponectin, leptin Available outcomes: weight change, waist circumference, blood pressure, lipids, glucose, insulin, glycated protein, adiponectin, leptin |
|
| Notes | We used both the high fat (40%E) and moderate fat (30%E) arms as higher fat arms, and the low fat (20%E) arm as the lower fat arm. Funding: National Basic Research Program of China (2015CB553604) |
|
| Risk of bias | ||
| Bias | Authors' judgement | Support for judgement |
| Random sequence generation (selection bias) | Low risk | Computer‐generated random number list, stratified by centre, age, sex and BMI |
| Allocation concealment (selection bias) | Low risk | Randomised by data manager and after run‐in period |
| Blinding of participants and personnel (performance bias) All outcomes | High risk | Participants not informed of allocations, but would have been aware of these from foods provided |
| Blinding of outcome assessment (detection bias) | Low risk | Clinical staff and lab personnel who carried out measurements were masked to allocation. |
| Incomplete outcome data (attrition bias) All outcomes | Low risk | All participants were included in the ITT analysis (however 28 of 101 (high fat), 22 of 105 (mod fat), and 16 of 101 (low fat) dropped out during the 6 months of the trial). |
| Selective reporting (reporting bias) | Low risk | Trials register posted Feb 2015, trial completed in Oct 2015. All primary and secondary outcomes fully reported |
| Other bias | Low risk | None noted |
| Free of systematic difference in care? | Low risk | Yes, same process and contact schedule in all arms |
| Free of dietary differences other than fat? | Low risk | Yes, fat/CHO swaps |
| Compliance problems | Low risk | All food provided and diet diaries used to assess compliance |
Pilkington 1960.
| Study characteristics | ||
| Methods | RCT Summary risk of bias: moderate to high |
|
| Participants | Men with angina or who have had a MI (UK)
CVD risk: high
Reduced fat: randomised unclear, analysed 12
Modified fat: randomised unclear, analysed 23
Mean years in trial:reduced fat 1.1, modified fat 1.1
% male: reduced fat 100%, modified fat 100%
Age: not stated Baseline BMI: not reported |
|
| Interventions | Reduced fat vs modified fat diet Reduced fat aims: total fat 20 g/d, advice to avoid dairy fats except skimmed milk plus 1 egg or 21 g cheese/d. Lean meat and fish each allowed once/d, other non‐fatty foods allowed in unlimited quantities Modified fat aims: fat aims not stated, dairy produce avoided except skimmed milk, 90 mL/d soya oil provided, lean meat originally prohibited but allowed after 6 months along with 113 g/wk of 'relatively unsaturated margarine'. Fish and vegetables allowed freely Reduced fat methods: unclear; "dietary histories taken before and during treatment" Modified fat methods: unclear; "dietary histories taken before and during treatment" Weight goals: non‐fatty foods not restricted, no weight goals mentioned Total fat intake (during treatment): low fat 15.8 (SD unclear) %E, mod fat 36 (SD unclear) %E Saturated fat intake: unclear Style: diet advice Setting: community |
|
| Outcomes | Stated trial outcomes: lipids Available outcomes: weight, total and LDL cholesterol |
|
| Notes | — | |
| Risk of bias | ||
| Bias | Authors' judgement | Support for judgement |
| Random sequence generation (selection bias) | Unclear risk | "randomised" |
| Allocation concealment (selection bias) | Unclear risk | No details provided |
| Blinding of participants and personnel (performance bias) All outcomes | High risk | Participants not blinded |
| Blinding of outcome assessment (detection bias) | Unclear risk | Unclear whether outcome assessors blinded |
| Incomplete outcome data (attrition bias) All outcomes | Unclear risk | Unclear exactly how many were randomised, but paper suggested that all randomised participants were analysed |
| Selective reporting (reporting bias) | Unclear risk | No protocol or trials registry found |
| Other bias | Low risk | None noted |
| Free of systematic difference in care? | Low risk | Appeared to be similar levels of assessment and support in both arms |
| Free of dietary differences other than fat? | Low risk | Dietary focus entirely on fat |
| Compliance problems | Unclear risk | A large difference in self‐reported fat intake per day was reported, which is almost certainly statistically significant, though no measure of variance was reported, however, the lower fat diet resulted in higher total and LDL cholesterol, so unclear |
Polyp Prevention 1996.
| Study characteristics | ||
| Methods | RCT Polyp Prevention Trial Summary risk of bias: moderate to high |
|
| Participants | People with at least one adenomatous polyp of the large bowel removed (USA)
CVD risk: low Control: 1042 randomised, 943 analysed Intervention: 1037 randomised, 943 analysed Mean years in trial: control 3.05, intervention 3.05 % male: control 64%, intervention 66% Age: mean control 61.5, intervention 61.4 (all at least 35) Baseline BMI: mean control 27.5 (SE 0.12), intervention 27.6 (SE 0.13) |
|
| Interventions | Low fat vs usual diet Control: general dietary guidelines Intervention: total fat 20%E, 18 g fibre/1000 kcal, 5 to 8 servings fruit and vegetables daily Control methods: leaflet, no additional information or behaviour modification Intervention methods: > 50 hours of counselling over 4 years, included skill building, behaviour modification, self‐monitoring and nutritional materials Weight goals: "weight loss is permitted but not encouraged....counselled to replace fat intake with increased intake of fruit, vegetable and grain products rather than reduce total calorie intake." Total fat intake (at 4 years): low fat 23.8 (SD 6.0), control 33.9 (SD 5.9) %E Saturated fat intake: unclear Style: diet advice Setting: community |
|
| Outcomes | Stated trial outcomes: recurrence of polyps, prostate cancer Available outcomes: weight, total cholesterol |
|
| Notes | Weight data reported at 1, 2, 3 and 4 years. 3‐year data used in main analysis | |
| Risk of bias | ||
| Bias | Authors' judgement | Support for judgement |
| Random sequence generation (selection bias) | Low risk | "randomly assigned" by computer randomisation centre, stratified according to centre |
| Allocation concealment (selection bias) | Low risk | Phone call to computer randomisation centre, stratified according to centre |
| Blinding of participants and personnel (performance bias) All outcomes | High risk | Participants not blinded |
| Blinding of outcome assessment (detection bias) | Unclear risk | Outcome assessors blinded for main trial outcomes, but not clear for body weight |
| Incomplete outcome data (attrition bias) All outcomes | Low risk | 193 of 2079 (9%) lost over 3 years (< 10% per year) |
| Selective reporting (reporting bias) | Unclear risk | Protocol not seen, clinical trial register set up 10 years after publication of baseline data |
| Other bias | Low risk | None noted |
| Free of systematic difference in care? | High risk | 50 hours behaviour modification in intervention group, not in control. See 'Control methods' and 'Intervention methods' in the 'Interventions' section above |
| Free of dietary differences other than fat? | High risk | Fibre, fruit and vegetable goals in intervention group |
| Compliance problems | Low risk | Significant difference in total fat intake at 4 years; not backed up by different total cholesterol |
RISCK 2010.
| Study characteristics | ||
| Methods | 2 × 2 parallel RCT (5 arms) Reading, Imperial, Surrey, Cambridge, and Kings (RISCK) study Summary risk of bias: moderate to high |
|
| Participants | People at increased risk of developing metabolic syndrome ≥ 4 (UK) CVD risk: low Control: HM/HGI 145 randomised, 111 analysed; HM/LGI 144 randomised, 116 analysed Intervention: LF/HGI 145 randomised, 116 analysed; LF/LGI 149 randomised, 121 analysed Mean years in trial: control 0.5 (SD x), intervention 0.5 (SD x) % male: 42% overall Age: mean age given overall by gender: Male = 52 ± 10; Female = 51 ± 9 Baseline BMI: overall mean BMI given as male or female: Male = 28.3 ± 3.8; Female = 28.6 ± 5.3 |
|
| Interventions | Low fat vs usual diet (low fat and high GI, low fat and low GI vs high MUFA and high GI, high MUFA and high GI) ‐ additional arm not used (high sat fatty acid and high GI). Low fat (intervention arm): 28% fat, either 45% or 55% CHO, 12% MUFA, 10% SFA Higher fat (control arm): 38% fat, 45% or 55% CHO, 20% MUFA, 10% SFA Control methods: Provision of key sources of fat (including spreads, cooking oils and margarine) and carbohydrates (including bread, pasta, rice and cereals) in the diet with additional dietary information, tailored to the study group, given in writing and reinforced at individual study visits. Higher fat (38% fat, 20% MUFA, 10% SFA) Intervention methods: Provision of key sources of fat (including spreads, cooking oils and margarine) and carbohydrates (including bread, pasta, rice and cereals) in the diet with additional dietary information, tailored to the study group, given in writing and reinforced at individual study visits. Lower fat (28% fat, 12% MUFA, 10% SFA) Weight goals: Participants were advised that dietary advice was for weight maintenance. Total fat intake (at 6 months); change % of energy; mean (95% CI):
Saturated fat intake (at 6 months); change % of energy; mean (95%CI):
Style: dietary advice and supplement Setting: community |
|
| Outcomes | Stated trial outcomes: Primary: Change in insulin sensitivity from measures of glucose and insulin during an intravenous glucose tolerance test Secondary: Fasting lipid profile, vascular reactivity and endothelial function, haemostatic factors, markers of the inflammatory response, leptin and adiponectin, urinary microalbumin to creatinine ratio, plasma fatty acid composition, DNA for nutrient‐gene interactions. Available outcomes: weight, total cholesterol, triglyceride, LDL and HDL cholesterol, BP, total energy, total fat % energy, SFA % energy, PUFA % energy, MUFA % energy, CHO % energy, sugars % energy, protein g/d |
|
| Notes | Funding: UK Food Standards Agency (project NO2031). Foods were supplied by Unilever Food and Health Research Institute (Unilever R&D, Vlaardingen, Netherlands), Cereal Partners UK (Welwyn Garden City, Hertfordshire, United Kingdom), Grampian (Banff, United Kingdom), Weetabix Ltd (Kettering, United Kingdom), and Sainsbury’s Supermarkets Ltd (London, United Kingdom). | |
| Risk of bias | ||
| Bias | Authors' judgement | Support for judgement |
| Random sequence generation (selection bias) | Low risk | Computer‐based minimisation procedure to balance assignment by age, sex, waist, and HDL cholesterol |
| Allocation concealment (selection bias) | Unclear risk | No details |
| Blinding of participants and personnel (performance bias) All outcomes | High risk | Participants and the nutritionist advising on the dietary changes were not blinded to the treatment. |
| Blinding of outcome assessment (detection bias) | Unclear risk | Unclear whether those who measured adiposity were blinded to intervention |
| Incomplete outcome data (attrition bias) All outcomes | High risk | Flow of participants through the study was shown with the CONSORT diagram, 171 out of 720 lost to follow‐up over 6 months (reason given ‐ discontinued), > 10%/year |
| Selective reporting (reporting bias) | High risk | Study was registered retrospectively in 2005, but weight not mentioned as an outcome, though reported. |
| Other bias | Low risk | None noted |
| Free of systematic difference in care? | Low risk | Appeared to be similar levels of assessment and support in both arms |
| Free of dietary differences other than fat? | Low risk | Focus on fat |
| Compliance problems | Low risk | Significant difference in total fat intake between arms |
Rivellese 1994.
| Study characteristics | ||
| Methods | RCT Summary risk of bias: moderate to high |
|
| Participants | Adults with primary hyperlipoproteinaemia (Italy)
CVD risk: moderate
Intervention reduced fat: 33 randomised, 27 analysed
Intervention modified fat: 30 randomised, 17 analysed
Mean years in trial: reduced fat 0.4, modified fat 0.4
% male: reduced fat 82%, modified fat 63%
Age, years: reduced fat 47.4 mean (SD 10.3), modified fat 48.6 (SD 8.1) Baseline BMI: reduced fat 24.4 mean (SD 2.9), modified fat 25.2 (SD 2.7) |
|
| Interventions | Reduced fat vs modified fat diet Reduced fat aims: total fat 25%E, SFA 8%E, MUFA 15%, PUFA 2%, dietary cholesterol < 300 mg/d, CHO 58%, protein 17%E, soluble fibre 41 g/d Modified fat aims: total fat 38%E, SFA < 10%E, MUFA 20%E, PUFA 10%E, dietary cholesterol < 300 mg/d, CHO 47%E, protein 15%E, soluble fibre 19 g/d Reduced fat methods: seen monthly by dietitian and doctor; feedback based on 7‐day food diary each time Modified fat methods: seen monthly by dietitian and doctor; feedback based on 7‐day food diary each time Weight goals: neither weight or energy intake goals mentioned for either group Total fat intake (at 5 to 6 months): low fat 27 (SD unclear), mod fat 36 (SD unclear) %E Saturated fat intake (at 5 to 6 months): low fat 6 (SD unclear) %E, mod fat 7 (SD unclear) %E Style: diet advice Setting: community |
|
| Outcomes | Stated trial outcomes: metabolic effects Available outcomes: weight, total, LDL and HDL cholesterol, TG |
|
| Notes | Weight data were presented without variance info. Participants in the low fat arm lost 1.8 kg over the 6 months; the modified fat diet arm lost 1.6 kg. | |
| Risk of bias | ||
| Bias | Authors' judgement | Support for judgement |
| Random sequence generation (selection bias) | Low risk | Following 3 or 6 weeks compliance with control diet run‐in, stratified block randomisation with tables of random numbers |
| Allocation concealment (selection bias) | Unclear risk | Allocation method not clearly described |
| Blinding of participants and personnel (performance bias) All outcomes | High risk | No blinding |
| Blinding of outcome assessment (detection bias) | High risk | No blinding |
| Incomplete outcome data (attrition bias) All outcomes | High risk | 19 of 63 (30%) lost over 0.4 years (> 10% per year) |
| Selective reporting (reporting bias) | Unclear risk | Protocol not seen |
| Other bias | Low risk | None noted |
| Free of systematic difference in care? | Low risk | Identical follow‐up. See 'Control methods' and 'Intervention methods' in the 'Interventions' section above |
| Free of dietary differences other than fat? | High risk | Some differences in soluble fibre intake |
| Compliance problems | Unclear risk | Big difference in total fat intake, but no variance to verify |
Sarkkinen Low & Mod 1993.
| Study characteristics | ||
| Methods | RCT (4 arms have been used here as 2 RCTs) Summary risk of bias: moderate to high |
|
| Participants | Free‐living people aged 30 to 60 with serum total cholesterol levels 6.5 to 8.0 mmol/L (Finland)
CVD risk: moderate
Control (monoene‐enriched): randomised 41, analysed 41
Intervention AHA: randomised 41, analysed 41 Mean years in trial: for all 4 groups 0.5 % male: control 46, AHA 46 Age: mean control 46.4, AHA 47.3 (all 30 to 60) Baseline BMI: mean control 26.6 (SD 3.8), intervention 26.2 (SD 4.0) |
|
| Interventions | Reduced and modified fat vs modified fat diet
Control aims mono: total fat 38%E, SFA < 14%E, MUFA 18%E, PUFA < 6%E, rapeseed oil, rapeseed spread and skimmed milk provided
Intervention aims AHA: total fat 30%E, SFA < 10%E, MUFA 10%E, PUFA 10%E, sunflower oil, sunflower spread and skimmed milk provided Control and intervention methods: given written dietary instructions and a diet plan with checking and reinforcement for 3 visits, then at 2, 6, 12, 18 and 26 weeks Weight goals: dietary written instructions were designed for 5 energy levels (1800, 2000, 2400, 2800 and 3200) based on individual diet and activity assessment Total fat intake (weeks 14 to 28): low and mod fat 34 (SD 4), control 35 (SD 5) %E Saturated fat intake (weeks 14 to 28): low and mod fat 11 (SD 2), control 11 (SD 2) %E Style: dietary advice and supplement (food) Setting: community |
|
| Outcomes | Stated trial outcomes: lipids and blood pressure Available outcomes: BMI, total, LDL and HDL cholesterol, TG, BP |
|
| Notes | This trial was named "Kuopio Low and Modified fat" in previous versions of this review. | |
| Risk of bias | ||
| Bias | Authors' judgement | Support for judgement |
| Random sequence generation (selection bias) | Low risk | "randomisation stratified for men and women, singles and couples, random number tables". |
| Allocation concealment (selection bias) | Unclear risk | Allocation method not clearly described |
| Blinding of participants and personnel (performance bias) All outcomes | High risk | Participants knew allocation. |
| Blinding of outcome assessment (detection bias) | High risk | Researchers knew allocation. |
| Incomplete outcome data (attrition bias) All outcomes | Low risk | 0 of 82 (0%) lost over 0.5 years (< 10% per year) |
| Selective reporting (reporting bias) | Unclear risk | Protocol not seen |
| Other bias | Low risk | None noted |
| Free of systematic difference in care? | Low risk | Similar intensity and duration in both groups. See 'Control methods' and 'Intervention methods' in the 'Interventions' section above |
| Free of dietary differences other than fat? | Low risk | See 'Control aims' and 'Intervention aims' in the 'Interventions' section above |
| Compliance problems | High risk | Appeared very little difference in total fat intake between arms |
Sarkkinen Low Fat 1993.
| Study characteristics | ||
| Methods | RCT (4 arms have been used here as 2 RCTs) Summary risk of bias: moderate to high |
|
| Participants | Free‐living people aged 30 to 60 with serum total cholesterol levels 6.5 to 8.0 mmol/L (Finland)
CVD risk: moderate
Control (high saturated fat): randomised 37, analysed 12
Intervention low fat: randomised 40, analysed 40
Mean years in trial: for both groups 0.5
% male: control 46, low fat 48
Age: mean control 43.2, low fat 45.8 (all 30 to 60) Baseline BMI: mean control 25.6 (SD 4.2), intervention 26.5 (SD 3.4) |
|
| Interventions | Reduced fat vs usual diet (low fat vs control)
Control aims: advised total fat 38%E, SFA < 18%E, MUFA 15%E, PUFA < 5%E, rapeseed oil, butter and semi‐skimmed milk provided
Intervention aims low fat: total fat 28‐30%E, SFA < 14%E, MUFA 10%E, PUFA 4%E, butter and rapeseed spread and skimmed milk provided Control and intervention methods: given written dietary instructions and a diet plan with checking and reinforcement for 3 visits, then at 2, 6, 12, 18 and 26 weeks Weight goals: dietary written instructions were designed for 5 energy levels (1800, 2000, 2400, 2800 and 3200) based on individual diet and activity assessment Total fat intake (weeks 14 to 28): low fat 31 (SD 5), control 36 (SD 5) %E Saturated fat intake (weeks 14 to 28): low fat 12 (SD 2), control 15 (SD 2) %E Style: dietary advice and supplement (food) Setting: community |
|
| Outcomes | Stated trial outcomes: lipids and blood pressure Available outcomes: BMI, total, LDL and HDL cholesterol, TG, BP |
|
| Notes | This trial was named "Kuopio Low Fat" in previous versions of this review. | |
| Risk of bias | ||
| Bias | Authors' judgement | Support for judgement |
| Random sequence generation (selection bias) | Low risk | "randomisation stratified for men and women, singles and couples, random number tables". |
| Allocation concealment (selection bias) | Unclear risk | Allocation method not clearly described |
| Blinding of participants and personnel (performance bias) All outcomes | High risk | Participants knew allocation. |
| Blinding of outcome assessment (detection bias) | High risk | Researchers knew allocation. |
| Incomplete outcome data (attrition bias) All outcomes | High risk | 25 of 77 (32%) lost over 0.5 years (> 10% per year) |
| Selective reporting (reporting bias) | Unclear risk | Protocol not seen |
| Other bias | Low risk | None noted |
| Free of systematic difference in care? | Low risk | Similar intensity and duration in both groups. See 'Control methods' and 'Intervention methods' in the 'Interventions' section above |
| Free of dietary differences other than fat? | Low risk | See 'Control aims' and 'Intervention aims' in the 'Interventions' section above |
| Compliance problems | Low risk | Statistically significant difference in total fat intake between arms |
Simon 1997.
| Study characteristics | ||
| Methods | RCT Summary risk of bias: moderate to high |
|
| Participants | Women with a high risk of breast cancer (USA)
CVD risk: low
Control: randomised 96, analysed 38
Intervention: randomised 98, analysed 34
Mean years in trial: control 1.8, intervention 1.7
% male: 0
Age: mean control 46, intervention 46 Baseline BMI: mean intervention 25.2 (SE 0.8), control 28.1 (SE 0.8) |
|
| Interventions | Reduced fat vs usual diet Control aims: usual diet Intervention aims: total fat 15%E Control methods: continued usual diet Intervention methods: biweekly individual dietetic appointments over 3 months followed by monthly individual or group appointments, including education, goal‐setting, evaluation, feedback and self‐monitoring Weight goals: weight and calorie goals not discussed Total fat intake (at 12 months): low fat 18.0 (SD 5.6), control 33.8 (SD 7.4) %E Saturated fat intake (at 12 months): low fat 6.0 (SD unclear), control 11.3 (SD unclear) %E Style: diet advice Setting: community |
|
| Outcomes | Stated trial outcomes: intervention feasibility Available outcomes: weight, total, LDL and HDL cholesterol, TG |
|
| Notes | — | |
| Risk of bias | ||
| Bias | Authors' judgement | Support for judgement |
| Random sequence generation (selection bias) | Low risk | Stratified by age and randomised (block size 2) |
| Allocation concealment (selection bias) | Unclear risk | Allocation method not clearly described |
| Blinding of participants and personnel (performance bias) All outcomes | High risk | Participants knew their allocation. |
| Blinding of outcome assessment (detection bias) | Unclear risk | Unclear whether physicians knew allocations |
| Incomplete outcome data (attrition bias) All outcomes | High risk | 122 of 194 (63%) lost over 2 years (> 10% per year) |
| Selective reporting (reporting bias) | Unclear risk | Protocol not seen |
| Other bias | Low risk | None noted |
| Free of systematic difference in care? | High risk | Very different contact time with dietitian, but medical appointments same in both groups. See 'Control methods' and 'Intervention methods' in the 'Interventions' section above |
| Free of dietary differences other than fat? | Low risk | See 'Control aims' and 'Intervention aims' in the 'Interventions' section above |
| Compliance problems | Low risk | Big and statistically significant difference between arms in total fat intake |
Strychar 2009.
| Study characteristics | ||
| Methods | RCT Summary risk of bias: moderate to high |
|
| Participants | People with well controlled type I diabetes mellitus (Canada)
CVD risk: moderate
Intervention reduced fat: 18 randomised, 15 analysed
Intervention modified fat: 17 randomised, 15 analysed
Mean years in trial: reduced fat 0.46, modified fat 0.47
% male: reduced fat unclear, modified fat unclear
Age, years: 37.9 (8.1 SD) (not specified by study arm) Baseline BMI: mean reduced fat 24.3 (SD 2.6), modified fat 24.3 (SD 2.7) |
|
| Interventions | Reduced fat vs modified fat diet Reduced fat aims: total fat 27%E to 30%E, SFA ≤ 10%E, MUFA 10%, CHO 54% to 57% Modified fat aims: total fat 37%E to 40%E, SFA ≤ 10%E, MUFA 20%E, CHO 43%E to 46%E Reduced fat methods: after initial dietary advice, monitored weekly by phone by a dietitian (24‐hour food recall). Glycaemia, insulin doses, CHO at meals, hypoglycaemic attacks all self‐monitored daily and reported weekly. Modified fat methods: after initial dietary advice, monitored weekly by phone by a dietitian (24‐hour food recall). Glycaemia, insulin doses, CHO at meals, hypoglycaemic attacks all self‐monitored daily and reported weekly. Total fat intake (at 6 months): not stated Saturated fat intake (at 6 months): not stated Style: diet advice Setting: community |
|
| Outcomes | Stated trial outcomes: triglycerides and other CVD risk factors Available outcomes: weight; BMI; total, LDL and HDL cholesterol; TG; systolic and diastolic blood pressure | |
| Notes | — | |
| Risk of bias | ||
| Bias | Authors' judgement | Support for judgement |
| Random sequence generation (selection bias) | Unclear risk | "randomly assigned" |
| Allocation concealment (selection bias) | Unclear risk | No details provided |
| Blinding of participants and personnel (performance bias) All outcomes | High risk | No details provided, but participants had to make decisions about what they ate. |
| Blinding of outcome assessment (detection bias) | Unclear risk | Unclear |
| Incomplete outcome data (attrition bias) All outcomes | High risk | 5 of 35 (14%) lost over 0.5 years (> 10% per year) |
| Selective reporting (reporting bias) | Unclear risk | Protocol not seen |
| Other bias | Low risk | None noted |
| Free of systematic difference in care? | Low risk | Similar intervention in both groups |
| Free of dietary differences other than fat? | Low risk | Focus on fat and CHO intake |
| Compliance problems | Unclear risk | Unclear total fat intake |
Swinburn 2001.
| Study characteristics | ||
| Methods | RCT Summary risk of bias: moderate to high |
|
| Participants | People with impaired glucose intolerance or high normal blood glucose (New Zealand)
CVD risk: moderate
Control: unclear how many randomised (176 between both groups), 51 analysed
Intervention: unclear how many randomised (176 between both groups), 48 analysed
Mean years in trial: 4.1 over whole trial
% male: control 80%, intervention 68%
Age: mean control 52.0 (SE 0.8), intervention 52.5 (SE 0.8) Baseline BMI: mean control 29.1 (SE 0.6), intervention 29.3 (SE 0.6) |
|
| Interventions | Reduced fat vs usual diet Control aims: usual diet Intervention aims: reduced fat diet (no specific goal stated) Control methods: usual intake Intervention methods: monthly meetings to follow a 1‐year structured programme aimed at reducing fat in the diet; included education, personal goal‐setting, self‐monitoring Weight goals: weight and calories not mentioned; diet was "aimed solely at reducing the total amount of fat in their diet". Total fat intake (at 1 year): low fat 26.1 (SD 7.7), cont 33.6 (SD 7.8) %E Saturated fat intake (at 1 year): low fat 10.0 (SD 4.2), cont 13.4 (SD 4.7) %E Style: diet advice Setting: community |
|
| Outcomes | Stated trial outcomes: lipids, glucose, blood pressure Available outcomes: weight, total, LDL and HDL cholesterol, TG, BP |
|
| Notes | This trial was named "Auckland Low Fat" in previous versions of this review. | |
| Risk of bias | ||
| Bias | Authors' judgement | Support for judgement |
| Random sequence generation (selection bias) | Low risk | Paper states "individually assigned by simple randomization using an unmarked envelope system" |
| Allocation concealment (selection bias) | Low risk | Unmarked opaque envelopes were opened by the person recruiting; unable to alter allocation later. |
| Blinding of participants and personnel (performance bias) All outcomes | High risk | Participants were not blinded. |
| Blinding of outcome assessment (detection bias) | Unclear risk | Outcome assessors were blinded. |
| Incomplete outcome data (attrition bias) All outcomes | High risk | 77 of 176 recruited lost to follow‐up, 44% over 5 years (> 10% per year) |
| Selective reporting (reporting bias) | Unclear risk | Protocol not seen |
| Other bias | Low risk | None noted |
| Free of systematic difference in care? | High risk | See 'Control methods' and 'Intervention methods' in the 'Interventions' section above |
| Free of dietary differences other than fat? | Low risk | See 'Control aims' and 'Intervention aims' in the 'Interventions' section above |
| Compliance problems | Low risk | Statistically significant difference in total fat intake between arms |
WHEL 2007.
| Study characteristics | ||
| Methods | RCT Women's Healthy Eating and Living (WHEL) study Summary risk of bias: moderate to high |
|
| Participants | Women with previously treated early breast cancer (USA)
CVD risk: low
Control: randomised 1561, analysed 1313
Intervention: randomised 1546, analysed 1308
Mean years in trial: unclear, 11 years max, around 11 years mean?
% male: 0
Age: control mean 53.0 (SD 9.0), intervention mean 53.3 (SD 8.9) Baseline BMI: control mean 27.2 (SD 6.1), intervention mean 27.2 (SD 6.1) |
|
| Interventions | Reduced fat intake vs usual diet Control: aim 30%E from fat Intervention: aim 15%E to 20%E from fat, 5 vegetables/d, 3 fruit/d, 16 oz vegetable juice and 30 g/d fibre Control methods: given print materials only Intervention methods: telephone counselling programme (31 calls by study end), cooking classes (12 offered in first year, 4 attended on average) and monthly newsletters (48 by study end), all focused on self‐efficacy, self‐monitoring and barriers, retaining motivation Weight goal: intervention goal was to achieve the change in dietary pattern without weight reduction; weight and calories not mentioned in the control group Total fat intake (at 72 months): low fat 28.9 (SD 9.0), control 32.4 (SD 8.0) %E Saturated fat intake (at 72 months): low fat 7.2 (SD unclear), control 8.9 (SD unclear) %E Style: diet advice Setting: community |
|
| Outcomes | Stated trial outcomes: mortality, invasive breast cancer Available outcomes: weight, total, LDL and HDL cholesterol, TG |
|
| Notes | Weight measured and reported at 1, 2, 3, 4 and 6 years, and 3‐year data used in main analysis | |
| Risk of bias | ||
| Bias | Authors' judgement | Support for judgement |
| Random sequence generation (selection bias) | Low risk | Randomisation via computer program |
| Allocation concealment (selection bias) | Unclear risk | Unclear |
| Blinding of participants and personnel (performance bias) All outcomes | High risk | Participants aware of allocation |
| Blinding of outcome assessment (detection bias) | Unclear risk | Unclear whether those assessing weight were blinded to allocation |
| Incomplete outcome data (attrition bias) All outcomes | Low risk | 486 of 3107 (16%) lost over 11 years (< 10% per year) |
| Selective reporting (reporting bias) | Low risk | NCT entry 2005, study completion date 2007. Breast cancer recurrence and mortality noted as outcomes and published |
| Other bias | Low risk | None noted |
| Free of systematic difference in care? | High risk | High‐intensity intervention compared with leaflets. See 'Control methods' and 'Intervention methods' in the 'Interventions' section above |
| Free of dietary differences other than fat? | High risk | Fruit and vegetable intervention in low fat arm, not in control |
| Compliance problems | Unclear risk | Total fat intake lower in intervention group than control; not statistically significant and not backed by significant differences in total or LDL cholesterol |
WHI 2006.
| Study characteristics | ||
| Methods | RCT Women's Health Initiative (WHI) Summary risk of bias: low |
|
| Participants | Postmenopausal women aged 50 to 79 (USA)
CVD risk: mixed, mostly low but some participants had CVD at baseline
Control: randomised 29,294, analysed 25,056
Intervention: randomised 19,541, analysed 16,297
Mean years in trial: control 8.1, intervention 8.1
% male: 0
Age: mean intervention 62.3 (SD 6.9), control 62.3 (SD 6.9) Baseline BMI: mean intervention 29.1 (SD 5.9), control 29.1 (SD 5.9) |
|
| Interventions | Reduced fat vs usual diet Control: diet‐related education materials Intervention: low fat diet (20%E from fat) with increased fruit and vegetables Control methods: given copy of 'Dietary Guidelines for Americans' Intervention methods: 18 group sessions with trained and certified nutritionists in the first year, quarterly maintenance sessions thereafter, focusing on diet and behaviour modification Weight goals: "the intervention did not include total energy reduction or weight‐loss goals". Total fat intake (at 6 years): intervention 28.8 (SD 8.4) %E, control 37.0 (SD 7.3) %E Saturated fat intake (at 6 years): intervention 9.5 (SD 3.2) %E, control 12.4 (SD 3.1) %E Style: dietary advice Setting: community |
|
| Outcomes | Stated trial outcomes: breast cancer, mortality, other cancers, cardiovascular events, diabetes Available outcomes: weight, BMI, waist circumference, body fat %, total, LDL and HDL cholesterol, TG, systolic and diastolic BP, quality of life |
|
| Notes | Weight data available at 1 year, 3 years, 6 years and 7.5 years. Latest (7.5 year) data used for main analysis for weight, BMI and waist circumference | |
| Risk of bias | ||
| Bias | Authors' judgement | Support for judgement |
| Random sequence generation (selection bias) | Low risk | Computer‐generated permuted block algorithm stratified by clinical centre and age |
| Allocation concealment (selection bias) | Low risk | Allocations developed by the WHI Clinical Coordinating Center |
| Blinding of participants and personnel (performance bias) All outcomes | High risk | Participants aware of allocation |
| Blinding of outcome assessment (detection bias) | Low risk | Trained clinic staff, who were responsible for anthropometric assessments and administration of FFQs, were blinded to treatment assignments to the extent practical. The dietary intervention staff did not conduct clinical assessments, and clinic staff were not permitted to participate in any intervention activities; participants were instructed not to discuss nutrition activities with clinic staff. |
| Incomplete outcome data (attrition bias) All outcomes | Low risk | 7482 of 48,835 (15%) lost over 8 years (< 10% per year) |
| Selective reporting (reporting bias) | Low risk | Weight and secondary outcomes reported as in protocol |
| Other bias | Low risk | None noted |
| Free of systematic difference in care? | High risk | Intervention participants received 18 group sessions with behavioural modification plus quarterly maintenance sessions thereafter. See 'Control methods' and 'Intervention methods' in the 'Interventions' section above |
| Free of dietary differences other than fat? | High risk | Also fruit and vegetable intervention. See 'Control aims' and 'Intervention aims' in the 'Interventions' section above |
| Compliance problems | Low risk | Statistically significant difference in total fat intake |
WHT Full‐scale.
| Study characteristics | ||
| Methods | RCT, 2 parallel arms Women's Health Trial (WHT) ‐ full‐scale trial Summary risk of bias: moderate to high |
|
| Participants | Women at increased risk of breast cancer (USA)
CVD risk: low
Control: randomised unclear, analysed 318 (1761 recruited overall in the full‐scale phase between control & intervention arms, 40% randomised to intervention)
Intervention: randomised unclear, analysed 324
Mean years in trial: control 1, randomised 1
% male: 0%
Age: mean not stated, but all aged 45 to 69 (27% 45‐49, 43% 50‐59, 30% 60‐69 years) Baseline BMI: Not stated, but weight ~69kg |
|
| Interventions | Reduced fat vs usual diet Control aims: maintain usual diet Intervention aims: 20%E from fat Control methods: no advice provided; encouraged to eat usual diet Intervention methods: multiple group intervention sessions over 18 months, emphasising nutrition education and behavioural skills (including fat‐counting); participants had to have been offered 8 group sessions at least to be included in outcome assessment over 5‐37 months. Weight goals: "there was no emphasis on weight change". Total fat intake (at 1 year): intervention 26.8 (SD unclear), control 38.4 (SD unclear) %E Saturated fat intake: intervention not stated, control not stated %E Style: diet advice Setting: community |
|
| Outcomes | Stated trial outcomes: breast cancer diagnosis Available outcomes: weight |
|
| Notes | Weight data provided at study end (on average 1 year after randomisation) Recruitment was 1986‐1988; trial terminated early in 1988. |
|
| Risk of bias | ||
| Bias | Authors' judgement | Support for judgement |
| Random sequence generation (selection bias) | Unclear risk | "randomised" |
| Allocation concealment (selection bias) | Unclear risk | Not described |
| Blinding of participants and personnel (performance bias) All outcomes | High risk | Participants were not blinded. |
| Blinding of outcome assessment (detection bias) | High risk | Not blinded; measured by the nurse who went through dietary records. |
| Incomplete outcome data (attrition bias) All outcomes | Unclear risk | Unclear due to early termination of study |
| Selective reporting (reporting bias) | Low risk | Design paper published, weight and serum total cholesterol reported |
| Other bias | High risk | Data are partial as the trial was terminated early, in 1988. Risk of contamination with data on the WHT Vanguard part of the study |
| Free of systematic difference in care? | High risk | Different levels of attention and time |
| Free of dietary differences other than fat? | Low risk | Focus on fat only |
| Compliance problems | Low risk | Statistically significant difference in total fat intake between arms at 1 year |
WHT Vanguard 1991.
| Study characteristics | ||
| Methods | RCT Women's Health Trial Vanguard Study (WHT Vanguard) Summary risk of bias: moderate to high |
|
| Participants | Women at increased risk of breast cancer (USA)
CVD risk: low
Control: randomised 184, analysed 159
Intervention: randomised 119, analysed 102
Mean years in trial: control 1.9, randomised 1.9
% male: 0%
Age: mean control 55.6 (SD 6.3), intervention 55.6 (SD 6.2) Baseline BMI: mean intervention 26 (SD 4), control 25 (SD 4) |
|
| Interventions | Reduced fat vs usual diet Control aims: maintain usual diet Intervention aims: 20%E from fat Control methods: no advice provided, only seen at baseline, then 6, 12 and 24 months for assessment Intervention methods: women were given flexible diet plans and responsible for their own monitoring; they had individual appointments with a nutritionist at 2 and 12 weeks, plus small group meetings (weekly for 8 weeks, then biweekly for 8 weeks, then monthly to 2 years). Weight goals: "there was no emphasis on weight change". Total fat intake (at 2 years): intervention 22.6 (SD 7.1), control 36.8 (SD 8.0) %E Saturated fat intake (at 2 years): intervention 7.2 (SD 2.7), control 12.3 (SD 3.6) %E Style: diet advice Setting: community |
|
| Outcomes | Stated trial outcomes: dietary intake/feasibility Available outcomes: weight, total cholesterol |
|
| Notes | Weight data provided at 6, 12 and 24 months. 2‐year data used in main analysis Recruitment was in 1985. This trial has several names, but we called it "WHT Feasibility" in previous versions of this review. |
|
| Risk of bias | ||
| Bias | Authors' judgement | Support for judgement |
| Random sequence generation (selection bias) | Unclear risk | "randomised" |
| Allocation concealment (selection bias) | Unclear risk | Not described |
| Blinding of participants and personnel (performance bias) All outcomes | High risk | Participants were not blinded. |
| Blinding of outcome assessment (detection bias) | High risk | Not blinded; measured by the nurse who went through dietary records. |
| Incomplete outcome data (attrition bias) All outcomes | Low risk | 42 of 303 (14%) lost over 2 years (< 10% per year) |
| Selective reporting (reporting bias) | Low risk | Design paper published; weight and serum total cholesterol reported |
| Other bias | Low risk | None noted |
| Free of systematic difference in care? | High risk | Different levels of attention and time |
| Free of dietary differences other than fat? | Low risk | Focus on fat only |
| Compliance problems | Low risk | Statistically significant difference in total fat intake between arms at 2 years; there was no lipid data to back this up. |
WHTFSMP 2003.
| Study characteristics | ||
| Methods | RCT Women's Health Trial: Feasibility Study in Minority Populations (WHTFSMP) Summary risk of bias: moderate to high |
|
| Participants | Postmenopausal women from diverse ethnic and socioeconomic backgrounds (USA)
CVD risk: low
Control: randomised 883, analysed 649 at 6 mo, 443 at 12 mo, 194 at 18 mo
Intervention: randomised 1325, analysed 1071 at 6 mo, 698 at 12 mo, 285 at 18 mo
Mean years in trial: unclear, follow‐up from 6 to 18 months
% male: 0%
Age: mean control 59.8 (SD 6.6), intervention 60.1 (SD 6.6) Baseline BMI: 28.8 (SD 4.7) for all |
|
| Interventions | Reduced fat vs usual diet Control aims: maintain usual diet Intervention aims: up to 20%E from fat, reduced saturated fat and dietary cholesterol, increased fruit, vegetables and whole grains Control methods: pamphlet on general dietary guidelines provided, no other follow‐up, seen at baseline, then 6, 12 and 18 months for assessment Intervention methods: women allocated to groups of 8 to 15 women with a nutritionist leader, meeting weekly for 6 weeks, bi‐weekly for 9 months then quarterly. Women provided with personal fat gram goals Weight goals: weight and calories not mentioned Total fat intake (at 1 year): intervention 25.4 (SD unclear), control 36.0 (SD unclear) %E Saturated fat intake (at 1 year): intervention 8.7 (SD unclear), control 12.1 (SD unclear) %E Style: diet advice Setting: community |
|
| Outcomes | Stated trial outcomes: dietary intake/feasibility Available outcomes: weight, BMI, blood pressure (lipids and estradiol appear to have been measured, but data not found) |
|
| Notes | Weight and BMI data only found for 6 months of intervention | |
| Risk of bias | ||
| Bias | Authors' judgement | Support for judgement |
| Random sequence generation (selection bias) | Low risk | Randomised using randomly permuted blocks after collection of baseline data |
| Allocation concealment (selection bias) | Unclear risk | Not discussed |
| Blinding of participants and personnel (performance bias) All outcomes | High risk | Participants not blinded |
| Blinding of outcome assessment (detection bias) | Unclear risk | Weight measured by trained and certified clinical staff, but unclear whether they were blinded to allocation |
| Incomplete outcome data (attrition bias) All outcomes | Low risk | All those randomised were analysed for weight. |
| Selective reporting (reporting bias) | High risk | Unclear; outcome measures not stated in trials register. Study conducted 1991 to 1995; design paper published in 1996. Lipids and estradiol appear to have been measured but no data found. |
| Other bias | Low risk | None noted |
| Free of systematic difference in care? | High risk | Greater time and support provided to intervention group |
| Free of dietary differences other than fat? | High risk | Suggestion to intervention group to increase fruit, vegetable and whole grain intakes |
| Compliance problems | Low risk | No reported serum lipids, but saturated fat intake statistically significantly different in intervention and control groups at 6, 12 and 18 months |
WINS 1993.
| Study characteristics | ||
| Methods | RCT Women's Intervention Nutrition Study (WINS) Summary risk of bias: moderate to high |
|
| Participants | Women with localised resected breast cancer (USA)
CVD risk: low Control: 1462 randomised, 998 analysed Intervention: 975 randomised, 386 analysed Mean years in trial: overall 5.0 % men: 0 Age: control mean 58.5 (95% CI 43.6 to 73.4), intervention mean 58.6 (95% CI 44.4 to 72.8) (all postmenopausal) Baseline BMI: mean intervention 27.6 (95% CI 27.2 to 28.0), control 27.5 (95% CI 27.2 to 27.8) |
|
| Interventions | Reduced fat intake vs usual diet Control aims: minimal nutritional counselling focused on nutritional adequacy Intervention aims: total fat 15%E to 20%E Control methods: 1 baseline dietetic session plus 3‐monthly sessions Intervention methods: 8 biweekly individual dietetic sessions, then optional monthly group sessions, incorporating individual fat gram goals, social cognitive theory, self‐monitoring, goal‐setting, modelling, social support and relapse prevention and management Weight goals: "fat gram goals were based on energy needed to maintain weight, and no counselling on weight reduction was provided"; not mentioned for control Total fat intake (at 1 year): low fat 20.3 (SD 8.1), control 29.2 (SD 7.4) %E Saturated fat intake (at 1 year): low fat 10.4 (SD 6.7), control 16.6 (SD 9.3) %E Style: dietary advice Setting: community |
|
| Outcomes | Stated trial outcomes: dietary fat intake, total cholesterol, weight and waist Available outcomes: weight, BMI |
|
| Notes | Weight data reported at 1, 3 and 5 years. 3‐year data used in main analysis | |
| Risk of bias | ||
| Bias | Authors' judgement | Support for judgement |
| Random sequence generation (selection bias) | Low risk | Random stratified permuted block design, carried out at the statistical coordinating centre of WINS |
| Allocation concealment (selection bias) | Low risk | Statistical coordinating centre as above |
| Blinding of participants and personnel (performance bias) All outcomes | High risk | Participants not blinded |
| Blinding of outcome assessment (detection bias) | Unclear risk | Unclear |
| Incomplete outcome data (attrition bias) All outcomes | Low risk | 1053 of 2437 (43%) lost over 5 years (< 10% per year) |
| Selective reporting (reporting bias) | Unclear risk | Protocol not seen |
| Other bias | Low risk | None noted |
| Free of systematic difference in care? | High risk | Differences in attention ‐ more time for those in intervention group. See 'Control methods' and 'Intervention methods' in the 'Interventions' section above |
| Free of dietary differences other than fat? | Low risk | See 'Control aims' and 'Intervention aims' in the 'Interventions' section above |
| Compliance problems | Low risk | Significant difference in total fat intake between arms at 1 year |
Yadav 2016.
| Study characteristics | ||
| Methods | RCT Summary risk of bias: moderate to high |
|
| Participants | People with relapsing‐remitting multiple sclerosis (MS) (USA)
CVD risk: low Control: 29 randomised, 27 analysed Intervention: 32 randomised, 26 analysed Mean years in trial: control 12 mo, intervention 12 mo % male: control 3%, intervention 10% Age: mean control 40.9 (SD 8.5), intervention 40.8 (SD 8.9) Baseline BMI: mean control 28.4 (SD 6.76), intervention 29.3 (SD 7.42) |
|
| Interventions | Low fat vs usual diet Control: usual diet Intervention: total fat 10%E, protein 14%E, carbohydrate 76%, focus on starchy plant foods while meat, fish, eggs, dairy foods, vegetable oil are prohibited Control methods: no dietary training; told to follow their usual diet; offered dietary training at end of study period (waiting‐list control) Intervention methods: 10 days residential diet training initially, then monthly FFQ and phone contact, plus additional counselling by dietitians in clinic or by phone. Secure online discussion board and personal meetings between participants to discuss diet Weight goals: none mentioned Total fat intake (at 1 year): low fat 14.4 (SD 6.1), control 39 (SD 6) %E Saturated fat intake: unclear Style: diet advice Setting: community |
|
| Outcomes | Stated trial outcomes: MS lesion formation (primary), clinical outcomes such as relapse rate, disability progression, fatigue, depression, quality of life, inflammation, safety, tolerability (secondary) Available outcomes: BMI and weight change, lipids (reported) |
|
| Notes | Weight and BMI change data reported but without SDs Funding: McDouglal Research and Education Foundation |
|
| Risk of bias | ||
| Bias | Authors' judgement | Support for judgement |
| Random sequence generation (selection bias) | Low risk | Randomisation stratified by medication use with random blocks of 2 and 4, generated using the Excel random number generator function |
| Allocation concealment (selection bias) | Unclear risk | Unclear; not reported |
| Blinding of participants and personnel (performance bias) All outcomes | High risk | Study participants, neurologists, study coordinators and the dietitian knew the group assignments. |
| Blinding of outcome assessment (detection bias) | Unclear risk | Unclear for weight as, although assessing neurologists were blinded, it was not clear whether they took weight measurements. |
| Incomplete outcome data (attrition bias) All outcomes | High risk | > 10% lost over 12 months, though reasons provided for half |
| Selective reporting (reporting bias) | Low risk | No, all represented |
| Other bias | Low risk | None noted |
| Free of systematic difference in care? | High risk | A residential programme, plus lots of support and counselling provided to intervention participants, not to control participants |
| Free of dietary differences other than fat? | High risk | The focus was on plant‐based carbohydrates and participants in intervention group told to omit meat, fish, dairy foods, and vegetable oils so protein and fibre will have been changed. |
| Compliance problems | Low risk | Dietary fat intake was significantly different between arms. |
%E: percentage of total energy intake AHA: American Heart Association AusMed: AUStralian MEDiterranean diet trial for secondary prevention of heart disease BDIT: Breast Dysplasia Intervention Trial BMI: body mass index BP: blood pressure BRIDGES: Breast Research Initiative for Determining Effective Strategies for Coping with Breast Cancer CHD: coronary heart disease CHO: carbohydrates CI: confidence interval CORDIOPREV: CORonary Diet Intervention with Olive oil and cardiovascular PREVention study CVD: cardiovascular disease DASH: Dietary Approaches to Stop Hypertension DBCP: Diet and Breast Cancer Prevention DEER: Diet and Exercise for Elevated Risk FFQ: food frequency questionnaire GI: glycaemic index HDL: high‐density lipoprotein HGI: High glycaemic index HM: high monounsaturated fat IHD: ischaemic heart disease ITT: intention to treat LDL: low‐density lipoprotein LF: low fat LGI: low glycaemic index MeDiet: Mediterranean Diet MI: myocardial infarction MS: multiple sclerosis MUFA: monounsaturated fatty acid NCEP: National Cholesterol Education Program NDHS: National Diet Health Study NEP: Nutrition Education Program NDHS: National Diet‐Heart Study ODMDC: Optimal Dietary Macronutrient Distribution in China P/S: polyunsaturated/saturated fat ratio PUFA: polyunsaturated fatty acid QoL: quality of life RCT: randomised controlled trial RISCK: Reading, Imperial, Surrey, Cambridge, and Kings Study SD: standard deviation SE: standard error SF36: 36‐item Short Form Survey (a quality of life assessment)
SFA: saturated fatty acid TG: triglycerides vs: versus WHEL: Women's Healthy Eating and Living WHI: Women's Health Initiative
WHT: Women's Health Trial WHTFSMP: Woment's Health Trial, Feasibility Study in Minority Populations WINS: Women's Intervention Nutrition Study
Characteristics of excluded studies [ordered by study ID]
| Study | Reason for exclusion |
|---|---|
| Agewall 2001 | Multifactorial intervention |
| Ammerman 2003 | No appropriate control group (and not low fat vs modified fat) |
| Aquilani 2000 | No appropriate control group (and not low fat vs modified fat) |
| Arne 2014 | Intervention aimed at weight management |
| Arntzenius 1985 | No appropriate control group (and not low fat vs modified fat) |
| ASSIST 2001 | Intervention was not dietary fat modification or low fat diet |
| Bakx 1997 | Multifactorial intervention |
| Ball 1965 | Those who were overweight were encouraged to reduce their weight |
| Barnard 2009 | Weight reduction encouraged in the conventional diet, but not in the vegan diet arm |
| Barndt 1977 | No appropriate control group (and not low fat vs modified fat) |
| Baron 1990 | Multifactorial intervention |
| Bazzano 2012 | Participants selected on basis of BMI (30 to 45) |
| Beckmann 1995 | Intervention was not dietary fat modification or low fat diet |
| Bierenbaum 1963 | No appropriate control group (and not low fat vs modified fat) |
| Bloomgarden 1987 | Multifactorial intervention |
| Bonnema 1995 | No appropriate control group (and not low fat vs modified fat) |
| Brehm 2009 | Participants recruited on basis of being overweight or obese |
| Brensike 1982 | No appropriate control group (and not low fat vs modified fat) |
| Broekmans 2003 | Intervention was not dietary fat modification or low fat diet |
| Brown 1984 | No appropriate control group (and not low fat vs modified fat) |
| Bruce 1994 | No appropriate control group (and not low fat vs modified fat) |
| Bruno 1983 | Multifactorial intervention |
| Byers 1995 | No appropriate control group (and not low fat vs modified fat) |
| Caggiula 1996 | No appropriate control group (and not low fat vs modified fat) |
| CARMEN 2000 | Participants recruited on basis of BMI (26 to 34) |
| CCD 2008 | Dietary advice to support weight loss provided to all those wanting to lose weight. |
| Clark 1997 | Multifactorial intervention |
| Cocinar para su salud 2016 | Total fat goals unclear, but total fat was < 30%E at baseline and decreased further in both groups |
| Cohen 1991 | Intervention was not dietary fat modification or low fat diet |
| Coppell 2010 | Weight loss recommended |
| Cox 1996 | Multifactorial intervention |
| Croft 1986 | Intervention was not dietary fat modification or low fat diet |
| Da Qing IGT 1997 | Intervention was not dietary fat modification or low fat diet |
| Dalgard 2001 | No appropriate control group (and not low fat vs modified fat) |
| DAS 1989 | No appropriate control group (and not low fat vs modified fat) |
| Davey Smith 2005 | Multifactorial intervention |
| DeBusk 1994 | Multifactorial intervention |
| Delahanty 2001 | No appropriate control group (and not low fat vs modified fat) |
| Delius 1969 | Intervention was not dietary fat modification or low fat diet |
| Dengel 1995 | No appropriate control group (and not low fat vs modified fat) |
| Diabetes CCT 1995 | Intervention was not dietary fat modification or low fat diet |
| DIET 1998 | Multifactorial intervention |
| DIRECT 2009 | Weight reduction aim |
| DO IT 2006 | "Overweight subjects were encouraged to adopt a calorie‐restricted diet" |
| Dobs 1991 | No appropriate control group (and not low fat vs modified fat) |
| Drummond 1998 | Both groups taught to reduce fat |
| Duffield 1982 | Multifactorial intervention |
| Eckard 2013 | Energy restricted diet |
| Elder 2000 | No appropriate control group (and not low fat vs modified fat) |
| Entwistle 2018 | Post‐transplant patients |
| Esposito 2003 | No appropriate control group (and not low fat vs modified fat) |
| Esposito 2004 | No appropriate control group (both groups aimed at < 30%E from fat) |
| Esposito 2014 | Energy restricted diet |
| EUROACTION 2008 | Multifactorial intervention |
| FARIS 1997 | Multifactorial intervention |
| Fasting HGS 1997 | No appropriate control group (and not low fat vs modified fat) |
| Ferrara 2000 | No appropriate control group (and not low fat vs modified fat) |
| Finnish Diabetes 2000 | Multifactorial intervention |
| Fleming 2002 | No appropriate control group (and not low fat vs modified fat) |
| Fortmann 1988 | Intervention was not dietary fat modification or low fat diet |
| Foster 2003 | Weight reduction in one arm but not the other |
| Friedman 2012 | Weight loss diets |
| Gaullier 2007 | No appropriate control group (and not low fat vs modified fat) |
| German Fat Reduced | Participants recruited on basis of their BMI (24 to 29) |
| Glatzel 1966 | No appropriate control group (and not low fat vs modified fat) |
| Goodpaster 1999 | No appropriate control group (and not low fat vs modified fat) |
| Gower 2012 | Participants recruited on basis of high BMI |
| Greenlee 2016 | Both groups had < 30% E from fat at baseline |
| Gregg 2013 | Participants recruited on basis of high BMI |
| Gudlaugsson 2013 | Multifactorial intervention |
| Guelinckx 2010 | Participants recruited on basis of high BMI |
| Guldbrand 2012 | Weight loss intended |
| Hardcastle 2008 | Multifactorial intervention |
| Hartman 1993 | No appropriate control group (and not low fat vs modified fat) |
| Hartwell 1986 | No appropriate control group (and not low fat vs modified fat) |
| Haynes 1984 | Intervention was not dietary fat modification or low fat diet |
| Hellenius 1993 | The study aimed for weight loss in one arm and not in the comparison arm |
| Hildreth 1951 | No appropriate control group (and not low fat vs modified fat) |
| HIPERCOL 2018 | No appropriate intervention (classic guidelines plus added educational support vs classic guidelines) |
| Hutchison 1983 | No appropriate control group (and not low fat vs modified fat) |
| Hyman 1998 | Neither mortality nor cardiovascular morbidity data available (only decided after contact with at least one author) |
| IMPACT 1995A | Multifactorial intervention |
| Iso 1991 | No appropriate control group (and not low fat vs modified fat) |
| Ives 1993 | Multifactorial intervention |
| Jalkanen 1991 | Multifactorial intervention |
| Janus 2012 | Weight loss intended |
| Jonasson 2014 | Energy restricted diet |
| Juanola‐Falgarona 2014 | Energy restricted diet |
| Jula 1990 | Multifactorial intervention |
| Karvetti 1992 | Multifactorial intervention |
| Kastarinen 2002 | Multifactorial intervention |
| Kattelmann 2010 | Weight loss intended |
| Katzel 1995 | Intervention was not dietary fat modification or low fat diet |
| Kempner 1948 | No appropriate control group (and not low fat vs modified fat) |
| Klemsdal 2010 | Participants recruited on basis of high BMI |
| Korhonen 2003 | Multifactorial intervention |
| Kristal 1997 | Multifactorial intervention |
| Kromhout 1987 | No appropriate control group (and not low fat vs modified fat) |
| Kummel 2008 | Intervention was not dietary fat modification or low fat diet |
| Laitinen 1993 | Multifactorial intervention |
| Laitinen 1994 | Multifactorial intervention |
| Larsen 2011 | Energy restricted diet |
| Leduc 1994 | Multifactorial intervention |
| Leibbrandt 2010 | Participants recruited on basis of high BMI |
| Lewis 1985 | Multifactorial intervention |
| LIILAC 2015 | Both arms had > 30% E from fat |
| Lipid Res Clinic 1984 | No appropriate control group (and not low fat vs modified fat) |
| Luoto 2012 | No assessment of total fat intake |
| Luszczynska 2007 | No appropriate control group (and not low fat vs modified fat) |
| Lyon Diet Heart 1994 | Intervention was not dietary fat modification or low fat diet |
| Mansel 1990 | Intervention was not dietary fat modification or low fat diet |
| MARGARIN | No appropriate control group (and not low fat vs modified fat) |
| Martin 2011 | Participants recruited on basis of high BMI |
| Maruthur 2014 | No relevant outcomes available |
| Mayneris‐Perxachs 2014 | No assessment of total fat intake |
| McCarron 2001 | Intervention was not dietary fat modification or low fat diet |
| McManus 2001 | Aimed at weight loss |
| Medi‐RIVAGE 2004 | Weight reduction for some low fat diet participants (those with BMI > 25) but not in Mediterranean group |
| Merrill 2011 | Multifactorial intervention |
| Michalsen 2006 | Diet plus stress management vs no intervention |
| Millar 1973 | No appropriate control group (and not low fat vs modified fat) |
| Milne 1994 | No appropriate control group (and not low fat vs modified fat) ‐ the high CHO diet was neither 'usual' or 'low fat' to compare with the modified fat diet |
| Minnesota HHP 1990 | No appropriate control group (and not low fat vs modified fat) |
| MUFObes low fat 2007 | Trial aimed to assess weight maintenance following major weight loss |
| MUFObes low vs mod 2007 | Trial aimed to assess weight maintenance following major weight loss |
| Mujeres Felices 2003 | Diet and breast self examination vs no intervention |
| Munsters 2010 | Weight loss intended |
| Murillo‐Ortiz 2017 | Both groups aimed at low fat intake |
| Naglak 2000 | Dietary fat intervention unclear |
| NCT02353416 | Intervention aim > 30% fat, control aim close to 30% fat (as per Italian guidelines) |
| NCT02368405 | Fat goals unclear |
| NCT02396264 | Calories adjusted to maintain weight |
| Neil 1995 | No appropriate control group (and not low fat vs modified fat) |
| Neverov 1997 | Multifactorial intervention |
| Next Step 1995 | Neither mortality nor cardiovascular morbidity data available (only decided after contact with at least one author) |
| Norway Veg Oil 1968 | No appropriate control group (and not low fat vs modified fat) |
| Novotny 2012 | Weight loss intended |
| Nutri‐EPA 2017 | Intervention aim > 30% fat, control aim close to 30% fat (as per Italian guidelines) |
| Nutrition Ed Study 1980 | Those who were overweight were provided with a weight reduction booklet |
| ODES 2006 | The study aimed for weight loss in some participants |
| Oldroyd 2001 | Multifactorial intervention |
| Orazio 2011 | Weight loss intended |
| ORIGIN 2008 | Intervention was not dietary fat modification or low fat diet |
| Ornish 1990 | Multifactorial intervention (diet, smoking, stress and exercise) compared to no intervention |
| Oslo Study 1980 | Multifactorial intervention |
| Otago Weight Loss 2005 | Although intake was ad libitum, the aim was for weight loss to occur ‐ participants presumably joined the study on the basis that it was assessing effects on weight loss, so were keen to lose weight |
| Pascale 1995 | Multifactorial intervention |
| Paz‐Tal 2013 | No relevant outcomes available |
| PEP 2001 | Multifactorial intervention |
| PHYLLIS 1993 | No appropriate control group (and not low fat vs modified fat) |
| Portfolio 5 | No dietary fat aims in the low‐fat arm (aimed for < 7%E SFA and < 200mg/d cholesterol), nor in the portfolio arms (aimed for < 7%E SFA and < 200mg/d cholesterol and also introduced portfolio foods such as sterol margarine, soy, nuts, and viscous fibre) |
| PREDIMED 2006 | Modified fat group was clearly defined, but no fat goals were set for the low fat group. We were unable to verify whether the fat aim was ≤ 30%E |
| PREMIER 2003 | Overweight participants were encouraged to lose weight |
| Pritchard 2002 | The study aimed for weight loss in one arm and not in the comparison arm |
| Reid 2002 | No appropriate control group (and not low fat vs modified fat) |
| Roderick 1997 | Weight reducing advice provided |
| Roman CHD prev 1986 | Multifactorial intervention |
| Rose 1987 | No appropriate control group (and not low fat vs modified fat) |
| Rusu 2013 | Energy restricted diet |
| Sacks 2009 | All arms aimed at a 750 kcal/day deficit to ensure weight loss |
| Salas‐Salvado 2014 | No assessment of total fat intake |
| Schectman 1996 | Multifactorial intervention |
| Schlierf 1995 | Multifactorial intervention |
| Singh 1991 | Multifactorial intervention |
| Singh 1992 | No appropriate control group (and not low fat vs modified fat) |
| Siqueira‐Catania 2010 | Weight loss intended |
| SLIM 2008 | Multifactorial intervention |
| Sondergaard 2003 | Unlikely that either arm was aiming at less than 30%E from fat (Mediterranean vs usual diet) |
| Sopotsinskaia 1992 | The study aimed for weight loss in one arm and not in the comparison arm |
| Stanford Weight | The study aimed for weight loss in one arm and not in the comparison arm |
| Steinbach 1996 | Multifactorial intervention |
| Steptoe 2001 | No appropriate control group (and not low fat vs modified fat) |
| Stevens 2002 | Diet plus breast self examination vs no intervention |
| Stevenson 1988 | No appropriate control group (and not low fat vs modified fat) |
| Sweeney 2004 | Intervention was not dietary fat modification or low fat diet |
| TAIM 1989 | Intervention was not dietary fat modification or low fat diet |
| THIS DIET 2008 | Study stated "although this was not a weight loss intervention, participants who were overweight or obese were encouraged to reduce calories to facilitate weight loss". |
| TOHP I 1992 | Multifactorial intervention |
| TONE 1997 | Intervention was not dietary fat modification or low fat diet |
| Toobert 2003 | Multifactorial intervention |
| Toronto Polyp Prev 1994 | No weight or BMI data presented |
| Tromso Heart 1989 | Multifactorial intervention |
| Troyer 2010 | Diet advice the same in both aims for intervention and control |
| Turku Weight | Both intervention groups aimed to lose weight, while the control group did not |
| UK PDS 1996 | No appropriate control group (and not low fat vs modified fat) |
| Urbach 1952 | No appropriate control group (and not low fat vs modified fat) |
| Uusitupa 1993 | Multifactorial intervention |
| Wassertheil 1985 | Intervention was not dietary fat modification or low fat diet |
| Weintraub 1992 | No appropriate control group (and not low fat vs modified fat) |
| Westman 2006 | Intervention was not dietary fat modification or low fat diet |
| WHO primary prev 1979 | Multifactorial intervention |
| Williams 1990 | Intervention was not dietary fat modification or low fat diet |
| Williams 1992 | Intervention was not dietary fat modification or low fat diet |
| Williams 1994 | Intervention was not dietary fat modification or low fat diet |
| Wilmot 1952 | No appropriate control group (and not low fat vs modified fat) |
| Wing 1998 | No appropriate control group (and not low fat vs modified fat) |
| Wolever 2008 | Weight loss intended in some participants |
| WOMAN 2007 | Lifestyle intervention included exercise and weight as well as diet |
| Wood 1988 | Intervention was not dietary fat modification or low fat diet |
| Woollard 2003 | Multifactorial intervention including smoking, weight, exercise and alcohol components |
| Working Well 1996 | Multifactorial intervention |
| Young 2010 | Weight loss intended |
BMI: body mass index RCT: randomised controlled trial vs: versus
Characteristics of studies awaiting classification [ordered by study ID]
Casas‐Agustench 2013.
| Methods | RCT |
| Participants | Volunteers aged 25 to 65 years (Spain)
CVD risk: moderate (presumed to be at moderate risk for developing CVD based on medical history, physical examination and assessing risk of CVD by interview) Control: NR Intervention: NR Mean years in trial: 1.0 % male: 135 men and 26 women (total 161) Age: between 25 and 65 years Baseline BMI: not reported |
| Interventions | Skimmed (S; 0.3% fat) vs semi‐skimmed (SS; 1.9% fat ) milk Control aims: 500 mL semi‐skimmed milk/d Intervention aims: 500 mL skimmed milk/d Control methods: 500 mL/d of semi‐skimmed (SS) (1.9% fat), [232.5 kcal energy, 9.5 g fat, 6.69 g SFAs, 2.58 g MUFAs, 0.21 PUFAs, 15.5 g protein, 23.5 g carbohydrates] in addition to their usual diet. Intervention methods: 500 mL/d of skimmed (S) milk (0.3% fat), [175 kcal energy, 1.5 g fat, 1.05 g SFAs, 0.40 g MUFAs, 0.03 PUFAs, 16.00 g protein, 24 g carbohydrates] in addition to their usual diet. Weight goals: NR Total fat intake (at 1 year): NR Saturated fat intake (at 1 year): NR Style: NR Setting: community |
| Outcomes | Stated trial outcomes: CVD risk biomarker Available outcomes: BMI, total, LDL and HDL cholesterol, total cholesterol, triglyceride, SBP, DBP |
| Date trial is due to complete | Not reported; no trials registry entry located |
| Notes | Awaiting assessment because: the aims in reducing total fat intake (to < 30%E or not) were unclear |
DIPI.
| Methods | RCT |
| Participants | Adult Danish population with a minimum of one self‐reported risk factor for Ischaemic heart disease (IHD) (Denmark), CVD risk: medium Control: NR Intervention: NR Mean years in trial: 1.0 % male: overall 41% male Age: overall median age of 51 years Baseline BMI: 73% were overweight or obese |
| Interventions | Unclear Targeted substitution dietary guidelines or the Danish official dietary guidelines vs habitual diet Control aims: habitual diet Intervention aims: either targeted substitution dietary guidelines or the Danish official dietary guidelines Control methods: NR Intervention methods: NR Weight goals: NR Total fat intake (at one year): NR Saturated fat intake (at one year): NR Style: dietary advice Setting: community |
| Outcomes | Stated trial outcomes: dietary intake, blood lipids, glycaemic biomarkers, blood pressure, heart rate, anthropometric measurements Available outcomes: None |
| Date trial is due to complete | |
| Notes | Awating assessment as exact fat goals were unclear. Control group advised to follow their habitual diet with one of two intervention groups receiving either targeted substitution dietary guidelines or the Danish official dietary guidelines |
ICFAMED.
| Methods | A Mediterranean diet for preventing heart failure and atrial fibrillation in hypertensive patients (ICFAMED) RCT, 24 months |
| Participants | People with hypertension aged 55 to 75 years at high cardiovascular risk, but without existing CVD |
| Interventions | MedDiet: Mediterranean‐style diet, dietary advice (individual and group) every three months LFD: Low‐fat diet according to American Heart Association guidelines, dietary advice (individual and group) every three months |
| Outcomes | Primary: heart failure and/or atrial fibrillation Secondary: echocardiographic variables & BP variables Actual outcomes from abstracts: MedDiet: 5 CVD events (atrial fibrillation (AF) 2; ischaemic heart disease (IHD) 2; stroke 1), LFD: 11 CVD events (AF 6, IHD 2, stroke 3). The crude rate for the occurrence of events per 1000 patient‐months of follow‐up was 197 (95% CI: 06 to 46) for MedDiet, 451 (95% CI: 3 to 8.1) for LFD. The HR for patients with MedDiet compared to LFD was 0.44 (95% CI: 0,15 to 1,26, P > 005). |
| Date trial is due to complete | Enrollment began in 2012; appeared to have completed in 2017; abstract and poster publications only to date |
| Notes | Trials registration: ISRCTN27497769 Awaiting assessment because: Unclear whether one arm was higher in saturated fat than the other; awaiting fuller publication to assess |
MEDINA.
| Methods | RCT |
| Participants | Ninety‐four eligible patients who have non‐alcoholic fatty liver disease and who are insulin resistant (Australia) Control: 47 to be randomised to control group Intervention: 47 to be randomised to intervention Mean years in trial: 2.0 % male: NR Age: 18 years and older eligible Baseline BMI: between 20 and 39.9 kg/m2 eligible |
| Interventions | Mediterranean diet versus a Low Fat Diet (LFD) Control aims: MedDiet Intervention aims: Low fat diet (LFD) Control methods: diet rich in plant based foods including vegetables, whole grains and fruit with the main added fat being extra virgin olive oil. It emphasises increased legumes and raw unsalted nut intake and oily fish. Moderate amounts of fermented dairy and poultry with small amounts of red meat and homemade sweets. Comprised of 44% fat (> 50% monounsaturated), 36% carbohydrate and 17–20% protein and up to 5% alcohol Intervention methods: the Australian Guide to Healthy Eating with an emphasis on portions, low fat options and cooking methods The LFD group will follow the same structure as the MedDiet arm with three face‐to‐face consultations at baseline, 6 weeks (mid‐intervention) and 12 weeks (end of intervention). There will also be the same number of phone call follow‐ups at weeks 2, 4 and 9. Participants will be given a supermarket gift voucher to purchase some of the suggested food items. Breakfast is also provided on the day of all face‐to‐face appointments (Jalna © and Carmen’s ©). Weight goals: NR Total fat intake (6 months): NR Saturated fat intake (6 months): NR Style: dietary advice and supermarket gift voucher (for low fat diet group) Setting: community |
| Outcomes | Stated trial outcomes: Weight, height, waist circumference, hip circumference, neck girth and blood pressure, dietary intake, intrahepatic lipid, plasma fatty acids and urinary metabolites |
| Date trial is due to complete | Trial started March 2015, final enrolment expected Apr 2017, completion expected Apr 2018 |
| Notes | Awaiting assessment because: Meddiet is 44% fat (> 50 % monounsaturated), 36% carbohydrate and 17–20% protein and up to 5% alcohol; composition of LFD unclear No results publications located |
Mottalib 2018.
| Methods | RCT |
| Participants | 72 participants with uncontrolled T2D (USA) CVD risk: NR Control: NR Intervention: NR Mean years in trial: 0.5 % male: 44% overall Age: mean age overall 59 ± 8 years Baseline BMI: NR |
| Interventions | Low fat dairy vs full fat dairy or non‐fat dairy Control aims: ≥ 3 daily servings of full fat dairy or ≥ 3 daily servings of non‐fat dairy Intervention aims: ≥ 3 daily servings of low fat dairy Control methods: dietary advice Intervention methods: dietary advice Weight goals: maintain daily caloric intake and body weight Total fat intake (6 months): NR Saturated fat intake (6 months): sat fat % calories increased by 3.7 ± 0.8% in full fat group (control) and decreased by 4.4 ± 1.7% in group low fat group (intervention) Style: dietary advice Setting: community |
| Outcomes | Stated trial outcomes: HbA1c, lipid profile and blood pressure Available outcomes: None yet |
| Date trial is due to complete | |
| Notes | Awaiting assessment as: fat goals of the two arms are unclear (full fat and low/non‐fat dairy). Characteristics taken from a conference poster |
Soul Food Light.
| Methods | RCT |
| Participants | African‐American adults with Type 2 diabetes, 18 years and above (USA) CVD risk: low Control: 48 randomised, 27 retained Intervention: 49 randomised, 38 retained Mean years in trial: 0.5 % male: control 25%, intervention 22% (total 97) Age: mean control 55.7 (12.1), range 32‐86, intervention 58.9 (10.1), range 40‐77 Baseline BMI: mean control 34 (8.3), range 18‐57; intervention 35.39 (8.1), range 23‐55 |
| Interventions | Educational classes (including peer professional groups & supportive family relationships) vs control (diabetes class) Low fat diet vs usual care Control aims: usual care Intervention aims: low fat diet Control methods: referral to a local 8‐hour traditional diabetes class Intervention methods: educational classes in low fat dietary strategies, peer professional group discussions, and follow‐up by a nurse case manager Weight goals: NR Total fat intake (at 6 months): NR Saturated fat intake (at 6 months): NR Style: diet advice Setting: community |
| Outcomes | Stated trial outcomes: (HbA1C, lipids, BMI) and dietary behaviours Available outcomes: change in weight, BMI, dietary behaviours, cholesterol and HbA1C |
| Date trial is due to complete | NR |
| Notes | Awaiting assessment because: fat goals in both arms are unclear |
AF: atrial fibrillation BMI: body mass index BP: blood pressure CVD: cardiovascular disease DBP: diastolic blood pressure HbA1c: Haemoglobin A1C HDL: high density lipoprotein ICFAMED:A Mediterranean diet for preventing heart failure and atrial fibrillation in hypertensive patients IHD: ischaemic heart disease LDL: low density lipoprotein LFD: low fat diet MedDiet: Mediterranean‐style diet MUFA: monounsaturated fatty acids NR: not reported PUFA: polyunsaturated fatty acid RCT: randomised controlled trial S: skimmed SBP: systolic blood pressure SFA: saturated fatty acid SS: semi‐skimmed T2D: type 2 diabetes
Characteristics of ongoing studies [ordered by study ID]
NCT02481466 due 2020.
| Study name | PortfolioEx |
| Methods | RCT |
| Participants | 200 participants estimated, 21 years and older, BMI less or equal to 40 kg/m2, measurable arterial thickening (>/= 1.2 mm) at screening, with at least one of (type 2 diabetes, non‐diabetic on statin, hypercholesterolaemic and treated with statins or have been prescribed statins but are not taking it because they are either unable (intolerant) or unwilling to take statin drugs, raised blood pressure, > 140/90 (untreated) (Canada) CVD risk: high Control: NR Intervention: NR Mean years in trial: 3.0 % male: NR Age: 21 years and older eligible Baseline BMI: BMI less or equal to 40 kg/m2 |
| Interventions | Portfolio diet and structured exercise vs DASH‐like diet and structured exercise Control aims: DASH‐like diet and structured exercise Intervention aims: Portfolio diet and structured exercise Control methods: advice to follow a DASH‐like diet of whole grains, and low fat dairy products with fruits and vegetables and be instructed on the Laval exercise programme—a standardised physical activity/exercise component supervised by trained kinesiologists (exercise physiologists). Intervention methods: participants will receive advice on a therapeutic diet appropriate for hypercholesterolaemia (i.e. < 7% of energy from saturated fat, < 200 mg/d cholesterol) PLUS the combination of viscous fibres, soy protein, plant sterols and nuts, 5% extra monounsaturated fat, and selection of low glycaemic index foods and be instructed on a standardised physical activity/exercise component supervised by kinesiologists Weight goals: NR Total fat intake (1 and 3 years): NR Saturated fat intake (1 and 3 years): NR Style: dietary advice Setting: community |
| Outcomes | Stated trial outcomes: maximum vessel wall volume of the carotid arteries, coronary atheroma in the large vessels, lipid rich necrotic core, intra‐plaque haemorrhage, blood pressure and pulse rate, serum lipids, blood pressure, diet history, quality of life, etc. Available outcomes: none yet |
| Starting date | Nov 2016, estimated primary completion date Dec 2020, estimated study completion date Dec 2022 |
| Contact information | |
| Notes | Information based on trial register |
NCT02938832 due 2023.
| Study name | Cardiodiet |
| Methods | RCT |
| Participants | Patients treated for ischaemic heart disease who are followed up at the cardiac rehabilitation units (Sweden) CVD risk: high Control: NR Intervention: NR Mean years in trial: 3.0 % male: NR Age: 18 years and older eligible Baseline BMI: NR |
| Interventions | Traditional low fat diet vs Mediterranean diet Control aims: Mediterranean diet with an energy content (E%) from carbohydrates between 25‐30% Intervention aims: traditional low fat diet with 45‐60E% from carbohydrates Control methods: Advice on a Mediterranean dietary regimen with reduced carbohydrates Intervention methods: Advice on traditional low fat diet by dietitian Weight goals: NR Total fat intake (3 years): NR Saturated fat intake (3 years): NR Style: dietary advice Setting: community |
| Outcomes | Stated trial outcomes: Hba1c > 48 mmol/mol, CVD incidence, blood lipid levels and quality of life Available outcomes: None yet |
| Starting date | Oct 2016, estimated primary completion date Oct 2021, estimated study completion date Oct 2023 |
| Contact information | |
| Notes | Information obtained from trial register |
NCT03068078 due 2020.
| Study name | ReDuCtion |
| Methods | RCT |
| Participants | Adult Danish population with established type 2 diabetes for more than six months and less than five years and HbA1c in compliance with T2D (above 48 mmol/mol), but without need for adjustment of antidiabetic treatment (Denmark) CVD risk: medium Control: 45 to be randomised to control group Intervention: 90 to be randomised to intervention Mean years in trial: 0.5 % male: NR Age: 18 years and older eligible Baseline BMI: NR |
| Interventions | Low carbohydrate diet, high in monounsaturated fats (LCD) vs regular diabetes diet (RDD) Control aims: regular diabetes diet (RDD) Intervention aims: Low carbohydrate diet, high in monounsaturated fats (LCD) Control methods: NR Intervention methods: NR Weight goals: NR Total fat intake (6 months): NR Saturated fat intake (6 months): NR Style: NR Setting: community |
| Outcomes | Stated trial outcomes: Measured by HbA1c, serum cholesterol, blood glucose and metabolic markers, NAFLD activity score, quality of life, gut dysbiosis and diet compliance Available outcomes: None yet |
| Starting date | Nov 2016, due to complete Dec 2019 |
| Contact information | |
| Notes | Information based on trial register |
BMI: body mass index CVD: cardiovascular disease DASH:Dietary Approaches to Stop Hypertension HbA1c: Haemoglobin A1C LCD: Low carbohydrate diet NAFLD: non‐alcoholic fatty liver disease NR: not reported RCT: randomised controlled trial RDD: regular diabetic diet T2D: type 2 diabetes
Differences between protocol and review
This review was originally a section of a larger review (Hooper 2012a), which was split off and extended to include RCT and cohort data, and cover evidence of children and adults (Hooper 2015a). Data on children has now been split into a separate review (Naude 2018). This update includes only information on adults and is limited to RCTs only.
Contributions of authors
The WHO NUGAG subgroup on diet and health (which included LH and CMS) discussed and developed the question for this review. The protocol was drafted by LH and approved by the NUGAG subgroup on diet and health. Charlene Bridges of the Cochrane Heart Group carried out the searches for this update. LH, AA, OFJ, DB and CSE assessed the eligibility of studies for inclusion for the update, AA, OFJ and LH carried out data extraction and entered data into RevMan. LH carried out the GRADE assessment for this update and wrote the first drafts of this update. All authors contributed to the analysis, and agreed on the final draft of this review. LH is the guarantor.
Sources of support
Internal sources
-
University of East Anglia, UK
For the original version of this systematic review: help with acquiring papers for the review, time for Lee Hooper to work on the review.
External sources
-
The World Health Organization (WHO) provided funding to Durham University towards the cost of carrying out the original version of this systematic review, Switzerland
No funding was received for the searching, analysis, or writing up of the data from randomised controlled trials in adults for the first version of the review. The funders did not have any vested interests in the findings of this research
WHO provided funding to the University of East Anglia (PI Lee Hooper) for the update of this systematic review and translation into a Cochrane review, Switzerland
Declarations of interest
AA: the World Health Organization (WHO) provided funding to the University of East Anglia towards the cost of carrying out the update of this systematic review, which partly covered the salary of AA. AA received funding from WHO to cover expenses associated with attendance at meetings of the NUGAG subgroup on diet and health.
OFJ: the World Health Organization (WHO) provided funding to the University of East Anglia towards the cost of carrying out the update of this systematic review, which partly covered the salary of OFJ.
DB: none known.
LH: the World Health Organization (WHO) provided funding to the University of East Anglia towards the cost of carrying out the update of this systematic review, which partly covered the salary of LH. LH is a member of the WHO NUGAG subgroup on diet and health and received funding from WHO to cover expenses associated with attendance at meetings of the NUGAG subgroup on diet and health.
CMS: none known.
Edited (no change to conclusions)
References
References to studies included in this review
Anderson 1990 {published and unpublished data}
- Anderson JW, Garrity TF, Smith BM, Whitis SE. Follow-up on a clinical trial comparing the effects of two lipid lowering diets. Arteriosclerosis 1990;10(5):882a. [Google Scholar]
- Anderson JW, Garrity TF, Wood CL, Whitis SE, Smith BM, Oeltgen PR. Prospective, randomized, controlled comparison of the effects of low-fat and low-fat plus high-fiber diets on serum lipid concentrations. American Journal of Clinical Nutrition 1992;56(5):887-94. [DOI] [PubMed] [Google Scholar]
AUSMED 2018 {published data only}
- ACTRN12616000156482. The AUSMED heart trial: the Australian Mediterranean diet trial for secondary prevention of heart disease [The effects of a Mediterranean dietary intervention in modifying cardiovascular risk factors in high-risk individuals who have experienced a cardiac event.]. anzctr.org.au/Trial/Registration/TrialReview.aspx?id=369896 (received 12 January 2016).
- Itsiopoulos C, Kucianski T, Mayr HL, Van Gaal WJ, Martinez-Gonzalez MA, Vally H, et al. The AUStralian MEDiterranean diet Heart Trial (AUSMED Heart Trial): a randomized clinical trial in secondary prevention of coronary heart disease in a multiethnic Australian population: study protocol. American Heart Journal 2018;203:4-11. [DOI] [PubMed] [Google Scholar]
- Mayr H, Bendall C, Tierney A, Kingsley M, Radcliffe J, Itsiopoulos C, et al. A multi-ethnic Australian cohort with coronary heart disease adhere well to a Mediterranean diet intervention and improve plasma adiponectin levels. Annals of Nutrition & Metabolism 2017;71:906-7. [Google Scholar]
- Mayr H, Itsiopoulos C, Thomas C, Tierney A. The AUSMED heart trial implementing an Australian Mediterranean diet for secondary prevention of coronary heart disease. Revista Espanola de Nutricion Humana y Dietetica 2016;20:445. [Google Scholar]
- Mayr HL, Itsiopoulos C, Tierney AC, Kucianski T, Radcliffe J, Garg M, et al. Ad libitum Mediterranean diet reduces subcutaneous but not visceral fat in patients with coronary heart disease: a randomised controlled pilot study. Clinical Nutrition ESPEN 2019;32:61-9. [DOI] [PubMed] [Google Scholar]
- Mayr HL, Itsiopoulos C, Tierney AC, Ruiz-Canela M, Hebert JR, Shivappa N, et al. Improvement in dietary inflammatory index score after 6-month dietary intervention is associated with reduction in interleukin-6 in patients with coronary heart disease: the AUSMED heart trial. Nutrition Research 2018;55:108-21. [DOI] [PubMed] [Google Scholar]
- Mayr HL, Thomas CJ, Tierney AC, Kucianski T, George ES, Ruiz-Canela M, et al. Randomization to 6-month Mediterranean diet compared with a low-fat diet leads to improvement in Dietary Inflammatory Index scores in patients with coronary heart disease: the AUSMED Heart Trial. Nutrition Research 2018;55:94-107. [DOI] [PubMed] [Google Scholar]
- Mayr HL, Tierney AC, Kucianski T, Thomas CJ, Itsiopoulos C. Australian patients with coronary heart disease achieve high adherence to 6-month Mediterranean diet intervention: preliminary results of the AUSMED Heart Trial. Nutrition 2019;61:21-31. [DOI] [PubMed] [Google Scholar]
BDIT Pilot Studies 1996 {published and unpublished data}
- Boyd NF, Cousins M, Beaton M, Fishell E, Wright B, Fish E, et al. Clinical trial of low-fat, high-carbohydrate diet in subjects with mammographic dysplasia: report of early outcomes. Journal of the National Cancer Institute 1988;80:1244-8. [DOI] [PubMed] [Google Scholar]
- Boyd NF, Cousins M, Beaton M, Han L, McGuire V. Methodological issues in clinical trials of dietary fat reduction in patients with breast dysplasia. Progress in Clinical and Biological Research 1986;222:117-24. [PubMed] [Google Scholar]
- Boyd NF, Cousins M, Beaton M, Kriukov V, Lockwood G, Tritchler D. Quantitative changes in dietary fat intake and serum cholesterol in women: results from a randomized, controlled trial. American Journal of Clinical Nutrition 1990;52(3):470-6. [DOI] [PubMed] [Google Scholar]
- Boyd NF, Cousins M, Kriukov V. A randomised controlled trial of dietary fat reduction: the retention of subjects and characteristics of drop outs. Journal of Clinical Epidemiology 1992;45(1):31-8. [DOI] [PubMed] [Google Scholar]
- Boyd NF, Cousins M, Lockwood G, Tritchler D. Dietary fat and breast cancer risk: the feasibility of a clinical trial of breast cancer prevention. Lipids 1992;27(10):821-6. [DOI] [PubMed] [Google Scholar]
- Boyd NF, Cousins M, Lockwood G, Tritchler D. The feasibility of testing experimentally the dietary fat-breast cancer hypothesis. Progress in Clinical and Biological Research 1990;346:231-41. [PubMed] [Google Scholar]
- Boyd NF, Martin LJ, Beaton M, Cousins M, Kriukov V. Long-term effects of participation in a randomized trial of a low-fat, high-carbohydrate diet. Cancer Epidemiology, Biomarkers and Prevention 1996;5(3):217-22. [PubMed] [Google Scholar]
- Lee-Han H, Cousins M, Beaton M, McGuire V, Kriukov V, Chipman M, et al. Compliance in a randomized clinical trial of dietary fat reduction in patients with breast dysplasia. American Journal of Clinical Nutrition 1988;48(3):575-86. [DOI] [PubMed] [Google Scholar]
beFIT 1997 {published and unpublished data}
- Retzlaff BM, Walden CE, McNeney WB, Buck BL, McCann BS, Knopp RH. Nutritional intake of women and men on the NCEP Step I and Step II diets. Journal of the American College of Nutrition 1997;16(1):52-61. [DOI] [PubMed] [Google Scholar]
- Walden CE, Retzlaff BM, Buck BL, McCann BS, Knopp RH. Lipoprotein lipid response to the National Cholesterol Education Program Step II diet by hypercholesterolemic and combined hyperlipidemic women and men. Arteriosclerosis, Thrombosis and Vascular Biology 1997;17:375-82. [DOI] [PubMed] [Google Scholar]
- Walden CE, Retzlaff BM, Buck BL, Wallick S, McCann BS, Knopp RH. Differential effect of National Cholesterol Education Program (NCEP) Step II Diet on HDL cholesterol, its subfractions, and apoprotein A-1 levels in hypercholesterolemic women and men after 1 year: the beFIT study. Arteriosclerosis, Thrombosis and Vascular Biology 2000;20(6):1580-7. [DOI] [PubMed] [Google Scholar]
Black 1994 {published and unpublished data}
- Black HS, Herd JA, Goldberg LH, Wolf-JE J, Thornby JI, Rosen T, et al. Effect of a low-fat diet on the incidence of actinic keratosis. New England Journal of Medicine 1994;330(18):1272-5. [DOI] [PubMed] [Google Scholar]
- Black HS, Thornby JI, Wolf-JE J, Goldberg LH, Herd JA, Rosen T, et al. Evidence that a low-fat diet reduces the occurrence of non-melanoma skin cancer. International Journal of Cancer 1995;62(2):165-9. [DOI] [PubMed] [Google Scholar]
- Jaax S, Scott LW, Wolf-JE J, Thornby JI, Black HS. General guidelines for a low-fat diet effective in the management and prevention of nonmelanoma skin cancer. Nutrition and Cancer 1997;27(2):150-6. [DOI] [PubMed] [Google Scholar]
Bloemberg 1991 {published and unpublished data}
- Bloemberg BPM, Kromhout D, Goddijn HE, Jansen A, Obermann de Boer GL. The impact for the guidelines for a healthy diet of the Netherlands Nutrition Council on total and high density lipoprotein cholesterol in hypercholesterolemic free living men. American Journal of Epidemiology 1991;134:39-48. [DOI] [PubMed] [Google Scholar]
Boyd 1988 {published and unpublished data}
- Boyd NF, McGuire V, Shannon P, Cousins M, Kriukov V, Mahoney L, et al. Effect of a low-fat high-carbohydrate diet on symptoms of cyclical mastopathy. Lancet 1988;2(8603):128-32. [DOI] [PubMed] [Google Scholar]
BRIDGES 2001 {published and unpublished data}
- Hebert JR, Ebbeling CB, Olendzki BC, Hurley TG, Ma Y, Saal N, et al. Change in women's diet and body mass following intensive intervention for early-stage breast cancer. Journal of the American Dietetic Association 2001;101(4):421-31. [DOI] [PubMed] [Google Scholar]
Canadian DBCP 1997 {published data only (unpublished sought but not used)}
- Boyd NF, Greenberg C, Lockwood G, Little L, Martin L, Byng J, et al, Canadian Diet and Breast Cancer Prevention Study Group. Effects at two years of a low-fat, high-carbohydrate diet on radiologic features of the breast: results from a randomized trial. Journal of the National Cancer Institute 1997;89(7):488-96. [DOI] [PubMed] [Google Scholar]
- Boyd NF, Greenberg C, Martin L, Stone J, Hammond G, Minkin S, et al. Lack of effect of a low-fat high-carbohydrate diet on ovarian hormones in premenopausal women: results from a randomized trial. IARC Scientific Publications 2002;156:445-50. [PubMed] [Google Scholar]
- Boyd NF, Lockwood GA, Greenberg CV, Martin LJ, Tritchler DL, Boyd NF, et al, Canadian Diet and Breast Cancer Prevention Study Group. Effects of a low-fat high-carbohydrate diet on plasma sex hormones in premenopausal women: results from a randomized controlled trial. British Journal of Cancer 1997;76(1):127-35. [DOI] [PMC free article] [PubMed] [Google Scholar]
- Knight JA, Martin LJ, Greenberg CV, Lockwood GA, Byng JW, Yaffe MJ, et al. Macronutrient intake and change in mammographic density at menopause: results from a randomized trial. Cancer Epidemiology, Biomarkers & Prevention 1999;8(2):123-8. [PubMed] [Google Scholar]
- Leyenaar J, Sutherland HJ, Lockwood GA, Martin LJ, Kriukov V, Greenberg CV, et al. Self-reported physical and emotional health of women in a low-fat, high-carbohydrate dietary trial (Canada). Cancer Causes & Control 1998;9(6):601-10. [DOI] [PubMed] [Google Scholar]
- Martin LJ, Greenberg CV, Kriukov V, Minkin S, Jenkins DJ, Boyd NF, et al. Intervention with a low-fat, high-carbohydrate diet does not influence the timing of menopause. American Journal of Clinical Nutrition 2006;84(4):920-8. [DOI] [PubMed] [Google Scholar]
- Martin LJ, Greenberg CV, Kriukov V, Minkin S, Jenkins DJ, Yaffe M, et al. Effect of a low-fat, high-carbohydrate dietary intervention on change in mammographic density over menopause. Breast Cancer Research & Treatment 2009;113(1):163-72. [DOI] [PubMed] [Google Scholar]
- Martin LJ, Lockwood GA, Kristal AR, Kriukov V, Greenberg C, Shatuck AL, et al. Assessment of a food frequency questionnaire as a screening tool for low fat intakes. Controlled Clinical Trials 1997;18(3):241-50. [DOI] [PubMed] [Google Scholar]
- Sutherland HJ, Carlin K, Harper W, Martin LJ, Greenberg CV, Till JE, et al. A study of diet and breast cancer prevention in Canada: why healthy women participate in controlled trials. Cancer Causes & Control 1993;4(6):521-8. [DOI] [PubMed] [Google Scholar]
CORDIOPREV 2016 {published data only}
- Blanco-Rojo R, Alcala-Diaz JF, Wopereis S, Perez-Martinez P, Quintana-Navarro GM, Marin C, et al. The insulin resistance phenotype (muscle or liver) interacts with the type of diet to determine changes in disposition index after 2 years of intervention: the CORDIOPREV-DIAB randomised clinical trial. Diabetologia 2016;59(1):67-76. [DOI: ] [DOI] [PubMed] [Google Scholar]
- Carty CL, Kooperberg C, Neuhouser ML, Tinker L, Howard B, Wactawski-Wende J, et al. Low-fat dietary pattern and change in body-composition traits in the Women's Health Initiative Dietary Modification Trial. American Journal of Clinical Nutrition 2011;93(3):516-24. [DOI] [PMC free article] [PubMed] [Google Scholar]
- Delgado-Lista J, Perez-Martinez P, Garcia-Rios A, Alcala-Diaz JF, Perez-Caballero AI, Gomez-Delgado F, et al. CORonary Diet Intervention with Olive oil and cardiovascular PREVention study (the CORDIOPREV study): rationale, methods, and baseline characteristics: a clinical trial comparing the efficacy of a Mediterranean diet rich in olive oil versus a low-fat diet on cardiovascular disease in coronary patients. American Heart Journal 2016;177:42-50. [DOI] [PMC free article] [PubMed] [Google Scholar]
- Garcia-Rios A, Alcala-Diaz JF, Gomez-Delgado F, Delgado-Lista J, Marin C, Leon-Acuna A, et al. Beneficial effect of CETP gene polymorphism in combination with a Mediterranean diet influencing lipid metabolism in metabolic syndrome patients: CORDIOPREV study. Clinical Nutrition 2018;37(1):229-34. [DOI] [PubMed] [Google Scholar]
- Gomez-Delgado F, Garcia-Rios A, Alcala-Diaz JF, Rangel-Zuñiga O, Delgado-Lista J, Yubero-Serrano EM, et al. Chronic consumption of a low-fat diet improves cardiometabolic risk factors according to the CLOCK gene in patients with coronary heart disease. Molecular Nutrition & Food Research 2015;59(12):2556-64. [DOI] [PubMed] [Google Scholar]
- Gomez-Delgado F, Torres-Pena JD, Perez-Corral I, Yubero-Serrano E, Camargo A, Corina A, et al. Apolipoprotein E (APOE) gene polymorphisms modulate postprandial lipemia in response to a Mediterranean dietary intervention: CORDIOPREV study. Circulation 2018;138(supp 1):A16129. [Google Scholar]
- Gomez-Marin B, Gomez-Delgado F, Lopez-Moreno J, Alcala-Diaz JF, Jimenez-Lucena R, Torres-Peña JD, et al. Long-term consumption of a Mediterranean diet improves postprandial lipemia in patients with type 2 diabetes: the CORDIOPREV randomized trial. American Journal of Clinical Nutrition 2018;108(5):963-70. [DOI: ] [DOI] [PubMed] [Google Scholar]
- Haro C, Garcia-Carpintero S, Alcala-Diaz JF, Gomez-Delgado F, Delgado-Lista J, Perez-Martinez P, et al. The gut microbial community in metabolic syndrome patients is modified by diet. Journal of Nutritional Biochemistry 2016;27:27-31. [DOI] [PubMed] [Google Scholar]
- Haro C, Garcia-Carpintero S, Rangel-Zuniga OA, Alcala-Diaz JF, Landa BB, Clemente JC, et al. Consumption of two healthy dietary patterns restored microbiota dysbiosis in obese patients with metabolic dysfunction. Molecular Nutrition & Food Research 2017;61(12):1700300. [DOI: 10.1002/mnfr.201700300] [DOI] [PubMed] [Google Scholar]
- Jimenez R, Camargo A, Delgado N, Fuentes F, Garcia-Rios A, Lopez-Miranda J, et al. The expression of miRNAs is modulated by the Mediterranean diet in patients with cardiovascular disease. Atherosclerosis. 2014;235(2):e129‐e130. [Google Scholar]
- Leon-Acuña A, Torres-Peña JD, Alcala-Diaz JF, Vals-Delgado C, Roncero-Ramos I, Yubero-Serrano E, et al. Lifestyle factors modulate postprandial hypertriglyceridemia: from the CORDIOPREV study. Atherosclerosis 2019;290:118-24. [DOI] [PubMed] [Google Scholar]
- NCT00924937. CORonary Diet Intervention with Olive oil and cardiovascular PREVention (CORDIOPREV). clinicaltrials.gov/ct2/show/NCT00924937 (received 19 June 2009).
- Perez-Martinez P, Alcala-Diaz JF, Delgado-Lista J, Garcia-Rios A, Gomez-Delgado F, Marin-Hinojosa C, et al. Metabolic phenotypes of obesity influence triglyceride and inflammation homoeostasis. European Journal of Clinical Investigation 2014;44(11):1053-64. [DOI] [PubMed] [Google Scholar]
- Quintana-Navarro GM, Alcala-Diaz JF, Lopez-Moreno J, Perez-Corral I, Leon-Acuña A, Torres-Peña JD, et al. Long-term dietary adherence and changes in dietary intake in coronary patients after intervention with a Mediterranean diet or a low-fat diet: the CORDIOPREV randomized trial. European Journal of Nutrition 2019;online only:see doi. [DOI: ] [DOI] [PubMed] [Google Scholar]
- Roncero-Ramos I, Alcala-Diaz JF, Rangel-Zuñiga OA, Gomez-Delgado F, Jimenez-Lucena R, García-Rios A, et al. Prediabetes diagnosis criteria, type 2 diabetes risk and dietary modulation: the CORDIOPREV study. Clinical Nutrition 2019;39(2):492-500. [DOI: ] [DOI] [PubMed] [Google Scholar]
- Roncero-Ramos I, Rangel-Zuniga OA, Lopez-Moreno J, Alcala-Diaz JF, Perez-Martinez P, Jimenez-Lucena R, et al. Mediterranean diet, glucose homeostasis, and inflammasome genetic variants: the CORDIOPREV study. Molecular Nutrition & Food Research 2018;62(9):e1700960. [DOI] [PubMed] [Google Scholar]
- Torres-Peña JD, Garcia-Rios A, Delgado-Casado N, Gomez-Luna P, Alcala-Diaz JF, Yubero-Serrano EM, et al. Mediterranean diet improves endothelial function in patients with diabetes and prediabetes: a report from the CORDIOPREV study. Atherosclerosis 2018;269:50-6. [DOI] [PubMed] [Google Scholar]
De Bont 1981 {published and unpublished data}
- De Bont AJ, Baker IA, St Leger AS, Sweetnam PM, Wragg KG, Stephens SM, et al. A randomised controlled trial of the effect of low fat diet advice on dietary response in insulin independent diabetic women. Diabetologia 1981;21(6):529-33. [DOI] [PubMed] [Google Scholar]
DEER 1998 {published data only}
- Camhi SM, Stefanick ML, Katzmarzyk PT, Young DR. Metabolic syndrome and changes in body fat from a low-fat diet and/or exercise randomized controlled trial. Obesity 2010;18(3):548-54. [DOI: 10.1038/oby.2009.304] [DOI] [PMC free article] [PubMed] [Google Scholar]
- Camhi SM, Stefanick ML, Ridker PM, Young DR. Changes in C-reactive protein from low-fat diet and/or physical activity in men and women with and without metabolic syndrome. Metabolism 2010;59(1):54-61. [DOI: 10.1016/j.metabol.2009.07.008] [DOI] [PMC free article] [PubMed] [Google Scholar]
- NCT00000598. Diet and Exercise for Elevated Risk (DEER). clinicaltrials.gov/ct2/show/NCT00000598 (received 28 Oct 1999).
- Stefanick ML, Mackey S, Sheehan RD, Ellsworth N, Haskell WL, Wood PD. Effects of diet and exercise in men and postmenopausal women with low levels of HDL cholesterol and high levels of LDL cholesterol. New England Journal of Medicine 1998;339(1):12-20. [DOI] [PubMed] [Google Scholar]
- Young D, Camhi S, Wu T, Hagberg J, Stefanick M. Relationships among changes in C-reactive protein and cardiovascular disease risk factors with lifestyle interventions. Nutrition, Metabolism and Cardiovascular Diseases 2013;23(9):857-63. [DOI] [PMC free article] [PubMed] [Google Scholar]
Diet and Hormone Study 2003 {published data only (unpublished sought but not used)}
- Gann PH, Chatterton RT, Gapstur SM, Liu K, Garside D, Giovannazzi S, et al. The effects of a low-fat/high-fiber diet on sex hormone levels and menstrual cycling in premenopausal women: a 12-month randomized trial (the Diet and Hormone Study). Cancer 2003;98:1870-9. [DOI] [PubMed] [Google Scholar]
Ma 2016 {published data only}
- Blonstein AC, Camargo CA, Wilson SR, Buist S, Lavori PW, Strub P, et al. Process evaluation of the "DASH for Asthma" intervention in a randomized controlled trial pilot study. Asthma Epidemiology 2015;A45:A1715. [DOI] [PMC free article] [PubMed] [Google Scholar]
- Blonstein AC, Lv N, Camargo CA, Wilson SR, Buist AS, Rosas LG, et al. Acceptability and feasibility of the ‘DASH for Asthma’ intervention in a randomized controlled trial pilot study. Public Health Nutrition 2015;19(11):2049-59. [DOI] [PMC free article] [PubMed] [Google Scholar]
- Jun M, Strub P, Lv N, Xiao L, Camargo CA, Buist AS, et al. Pilot randomised trial of a healthy eating behavioural intervention in uncontrolled asthma. European Respiratory Journal 2016;47(1):122-32. [DOI] [PMC free article] [PubMed] [Google Scholar]
- Lv N, Xiao L, Carlos AC Jr, Wilson SR, Buist AS, Strub P, et al. Abdominal and general adiposity and level of asthma control in adults with uncontrolled asthma. Annals of the American Thoracic Society 2014;11(8):1218-24. [DOI] [PMC free article] [PubMed] [Google Scholar]
- Ma J, Strub P, Lavori PW, Buist AS, Camargo CA Jr, Nadeau KC, et al. DASH for asthma: a pilot study of the DASH diet in not-well-controlled adult asthma. Contemporary Clinical Trials 2013;35(2):55-67. [DOI] [PMC free article] [PubMed] [Google Scholar]
- NCT01725945. The DASH diet for adults With uncontrolled asthma. clinicaltrials.gov/ct2/show/NCT01725945 (received 14 Nov 2012).
MeDiet 2006 {published and unpublished data}
- Carruba G, Granata OM, Pala V, Campisi I, Agostara B, Cusimano R, et al. A traditional Mediterranean diet decreases endogenous estrogens in healthy postmenopausal women. Nutrition and Cancer 2006;56(2):253-9. [DOI] [PubMed] [Google Scholar]
- Castagnetta L, Granata OM, Cusimano R, Ravazzolo B, Liquori M, Polito L, et al. The Mediet Project. Annals of the New York Academy of Science 2002;963:282-9. [DOI] [PubMed] [Google Scholar]
- Granata OM, Traina A, Ramirez S, Campisi I, Zarcone M, Amodio R, et al. Dietary enterolactone affects androgen and estrogen levels in healthy postmenopausal women. Annals of the New York Academy of Science 2009;1155:232-6. [DOI] [PubMed] [Google Scholar]
Moy 2001 {published and unpublished data}
- Moy TF, Yanek LR, Raqueno JV, Bezirdjian PJ, Blumenthal RS, Wilder LB, et al. Dietary counseling for high blood cholesterol in families at risk of coronary disease. Preventive Cardiology 2001;4(4):158-64. [DOI] [PubMed] [Google Scholar]
MSFAT 1995 {published and unpublished data}
- Van het Hof KH, Weststrate JA, Van den Berg H, Velthuis-te Wierik EJ, De Graaf C, Zimmermanns NJ, et al. A long-term study on the effect of spontaneous consumption of reduced fat products as part of a normal diet on indicators of health. International Journal of Food Sciences and Nutrition 1997;48(1):19-29. [DOI] [PubMed] [Google Scholar]
- Velthuis-te WE, Van Leeuwen REW, Hendriks HF, Verhagen H, Loft S, Poulsen HE, et al. Short-term moderate energy restriction does not affect indicators of oxidative stress and genotoxicity in humans. Journal of Nutrition 1995;125:2631-9. [DOI] [PubMed] [Google Scholar]
- Velthuis-te Wierik EJ, Van den Berg H, Weststrate JA, Van het Hof KH, De Graaf C. Consumption of reduced-fat products: effects on parameters of anti-oxidative capacity. European Journal of Clinical Nutrition 1996;50(4):214-9. [PubMed] [Google Scholar]
- Weststrate JA, Van het Hof KH, Van den Berg H, Velthuis-te WE, De Graaf C, Zimmermanns NJ, et al. A comparison of the effect of free access to reduced fat products or their full fat equivalents on food intake, body weight, blood lipids and fat-soluble antioxidants levels and haemostasis variables. European Journal of Clinical Nutrition 1998;52:389-95. [DOI] [PubMed] [Google Scholar]
NDHS Open 1st L&M 1968 {published data only}
- Anon. The National Diet-Heart Study. Nutrition Reviews 1968;26(5):133-6. [DOI] [PubMed] [Google Scholar]
- Baker BM, Frantz ID Jr, Keys A, Kinsell LW, Page IH, Stamler J, et al. The National Diet-Heart Study: an initial report. JAMA 1963;185:105-6. [DOI] [PubMed] [Google Scholar]
- Brown HB. The National Diet Heart Study - implications for dietitians and nutritionists. Journal of the American Dietetic Association 1968;52:279-87. [PubMed] [Google Scholar]
- NDHS. The National Diet-Heart study final report. Circulation 1968;37(II):1-428. [PubMed] [Google Scholar]
- Page IH, Brown HB. Some observations on the National Diet-Heart Study. Circulation 1968;37:313-5. [DOI] [PubMed] [Google Scholar]
NDHS Open 2nd L&M 1968 {published data only}
- Anon. The National Diet-Heart Study. Nutrition Reviews 1968;26(5):133-6. [DOI] [PubMed] [Google Scholar]
- Baker BM, Frantz ID Jr, Keys A, Kinsell LW, Page IH, Stamler J, et al. The National Diet-Heart Study: an initial report. JAMA 1963;185:105-6. [DOI] [PubMed] [Google Scholar]
- Brown HB. The National Diet Heart Study - implications for dietitians and nutritionists. Journal of the American Dietetic Association 1968;52:279-87. [PubMed] [Google Scholar]
- NDHS. The national diet-heart study final report. Circulation 1968;37(II):1-428. [PubMed] [Google Scholar]
- Page IH, Brown HB. Some observations on the National Diet-Heart Study. Circulation 1968;37:313-5. [DOI] [PubMed] [Google Scholar]
Nordevang 1990 {published data only (unpublished sought but not used)}
- Holm LE, Nordevang E, Ikkala E, Hallstrom L, Callmer E. Dietary intervention as adjuvant therapy in breast cancer patients - a feasibility study. Breast Cancer Research and Treatment 1990;16(2):103-9. [DOI] [PubMed] [Google Scholar]
- Nordevang E, Callmer E, Marmur A, Holm LE. Dietary intervention in breast cancer patients: effects on food choice. European Journal of Clinical Nutrition 1992;46(6):387-96. [PubMed] [Google Scholar]
- Nordevang E, Ikkala E, Callmer E, Hallstrom L, Holm LE. Dietary intervention in breast cancer patients: effects on dietary habits and nutrient intake. European Journal of Clinical Nutrition 1990;44(9):681-7. [PubMed] [Google Scholar]
Nutrition & Breast Health {published and unpublished data}
- Djuric Z, Poore KM, Depper JB, Uhley VE, Lababidi S, Covington C, et al. Methods to increase fruit and vegetable intake with and without a decrease in fat intake: compliance and effects on body weight in the Nutrition and Breast Health Study. Nutrition and Cancer 2002;43(2):141-51. [DOI] [PubMed] [Google Scholar]
ODMDC 2017 {published data only}
- NCT02355795. Diets with a spectrum of fat intake for preventing obesity: a randomized controlled-feeding trial. clinicaltrials.gov/ct2/show/NCT02355795 (received 4 Feb 2015).
- Wan Y, Wang F, Yuan J, Li D. Optimal dietary macronutrient distribution in China (ODMDC): a randomised controlled-feeding trial protocol. Asia Pacific Journal of Clinical Nutrition 2017;26(5):972‐80. [DOI] [PubMed] [Google Scholar]
- Wan Y, Wang F, Yuan J, Li J, Jiang D, Zhang J, et al. Effects of dietary fat on gut microbiota and faecal metabolites, and their relationship with cardiometabolic risk factors: a 6-month randomised controlled-feeding trial. Gut 2019;68(8):1417‐29. [DOI] [PubMed] [Google Scholar]
- Wan Y, Wang F, Yuan J, Li J, Jiang D, Zhang J, et al. Effects of macronutrient distribution on weight and related cardiometabolic profile in healthy non-obese Chinese: a 6-month, randomized controlled-feeding trial. EBioMedicine 2017;22:200-7. [DOI] [PMC free article] [PubMed] [Google Scholar]
Pilkington 1960 {published and unpublished data}
- Pilkington TRE, Stafford JL, Hankin VS, Simmonds FM, Koerselman HB. Practical diets for lowering serum lipids. British Medical Journal 1960;2:23-5. [DOI] [PMC free article] [PubMed] [Google Scholar]
Polyp Prevention 1996 {published and unpublished data}
- Lanza E, Schatzkin A, Ballard BR, Clifford DC, Paskett E, Hayes D, et al. The Polyp Prevention trial II: dietary intervention program and participant baseline dietary characteristics. Cancer Epidemiology, Biomarkers and Prevention 1996;5(5):385-92. [PubMed] [Google Scholar]
- Lanza E, Yu B, Murphy G, Albert PS, Caan B, Marshall JR, et al. The Polyp Prevention trial continued follow-up study: no effect of a low-fat, high-fiber, high-fruit, and -vegetable diet on adenoma recurrence eight years after randomization. Cancer Epidemiology Biomarkers & Prevention 2007;16(9):1745. [DOI] [PubMed] [Google Scholar]
- Murphy G, Cross AJ, Sansbury LS, Bergen A, Laiyemo AO, Albert PS, et al. Dopamine D2 receptor polymorphisms and adenoma recurrence in the Polyp Prevention trial. International Journal of Cancer 2009;124(9):2148-51. [DOI] [PMC free article] [PubMed] [Google Scholar]
- NCT00339625. Polyp Prevention trial. clinicaltrials.gov/ct2/show/NCT00339625 (received 21 June 2006).
- Sass DA, Schoen RE, Weissfeld JL, Weissfeld L, Thaete FL, Kuller LH, et al. Relationship of visceral adipose tissue to recurrence of adenomatous polyps. American Journal of Gastroenterology 2004;99(4):687-93. [DOI] [PubMed] [Google Scholar]
- Schatzkin A, Lanza E, Corle D, Lance P, Iber F, Caan B, et al. Lack of effect of a low-fat, high-fiber diet on the recurrence of colorectal adenomas. New England Journal of Medicine 2000;342(16):1149-55. [DOI] [PubMed] [Google Scholar]
- Schatzkin A, Lanza E, Freedman LS, Tangrea J, Cooper MR, Marshall JR, et al. The Polyp Prevention trial I: rationale, design, recruitment, and baseline participant characteristics. Cancer Epidemiology, Biomarkers and Prevention 1996;5(5):375-83. [PubMed] [Google Scholar]
RISCK 2010 {published data only}
- Alsaleh A, O'Dell SD, Frost GS, Griffin BA, Lovegrove JA, Jebb SA, et al. Interaction of PPARG Pro12Ala with dietary fat influences plasma lipids in subjects at cardiometabolic risk. Journal of Lipid Research 2011;52(12):2298-303. [DOI] [PMC free article] [PubMed] [Google Scholar]
- Alsaleh A, Sanders TA, O'Dell SD. Effect of interaction between PPARG, PPARA and ADIPOQ gene variants and dietary fatty acids on plasma lipid profile and adiponectin concentration in a large intervention study. Proceedings of the Nutrition Society 2012;71(1):141-53. [DOI] [PubMed] [Google Scholar]
- Fava F, Gitau R, Griffin BA, Gibson GR, Tuohy KM, Lovegrove JA. The type and quantity of dietary fat and carbohydrate alter faecal microbiome and short-chain fatty acid excretion in a metabolic syndrome 'at-risk' population. International Journal of Obesity (London) 2013;37(2):216-23. [DOI] [PubMed] [Google Scholar]
- Griffin BA, Walker CG, Jebb SA, Moore C, Frost GS, Goff L, et al. APOE4 genotype exerts greater benefit in lowering plasma cholesterol and apolipoprotein B than wild type (E3/E3), after replacement of dietary saturated fats with low glycaemic index carbohydrates. Nutrients 2018;10(10):E1524. [DOI: 10.3390/nu10101524] [DOI] [PMC free article] [PubMed] [Google Scholar]
- ISRCTN29111298. Impact of the amount and composition of dietary fat and carbohydrate on metabolic syndrome and cardiovascular disease risk. doi.org/10.1186/ISRCTN29111298 (received 16 Aug 2005).
- Jebb SA, Frost G, Griffin B, Lovegrove J, Moore C, Sanders T, et al. The RISCK study: testing the impact of the amount and type of dietary fat and carbohydrate on metabolic risk. Nutrition Bulletin 2007;32(2):154-6. [Google Scholar]
- Jebb SA, Lovegrove JA, Griffin BA, Frost GS, Moore CS, Chatfield MD, et al. Effect of changing the amount and type of fat and carbohydrate on insulin sensitivity and cardiovascular risk: the RISCK (Reading, Imperial, Surrey, Cambridge, and Kings) trial. American Journal of Clinical Nutrition 2010;92(4):748-58. [DOI] [PMC free article] [PubMed] [Google Scholar]
- Sanders TA, Lewis FJ, Goff LM, Chowienczyk PJ. SFAs do not impair endothelial function and arterial stiffness. American Journal of Clinical Nutrition 2013;98(3):677-83. [DOI] [PMC free article] [PubMed] [Google Scholar]
Rivellese 1994 {published and unpublished data}
- Rivellese AA, Auletta P, Marotta G, Saldalamacchia G, Giacoo A, Mastrilli V, et al. Long term metabolic effects of two dietary methods of treating hyperlipidaemia. BMJ 1994;308:227-31. [DOI] [PMC free article] [PubMed] [Google Scholar]
Sarkkinen Low & Mod 1993 {published and unpublished data}
- Makinen E, Uusitupa MI, Pietinen P, Aro A, Penttila I. Long term effects of three fat modified diets on serum lipids in free living hypercholesterolaemic subjects (abstract). European Heart Journal 1991;12:162. [Google Scholar]
- Sarkkinen E. Long-Term Feasibility and Effects of Three Different Fat-Modified Diets in Free-Living Hypercholesterolemic Subjects [PhD Thesis]. Department of Clinical Nutrition, Faculty of Medicine, University of Kuopio, 1995. [Google Scholar]
- Sarkkinen ES, Agren JJ, Ahola I, Ovaskainen ML, Uusitupa MI. Fatty acid composition of serum cholesterol esters, and erythrocyte and platelet membranes as indicators of long-term adherence to fat-modified diets. American Journal of Clinical Nutrition 1994;59(2):364-70. [DOI] [PubMed] [Google Scholar]
- Sarkkinen ES, Uusitupa MI, Nyyssonen K, Parviainen M, Penttila I, Salonen JT. Effects of two low-fat diets, high and low in polyunsaturated fatty acids, on plasma lipid peroxides and serum vitamin E levels in free-living hypercholesterolaemic men. European Journal of Clinical Nutrition 1993;47(9):623-30. [PubMed] [Google Scholar]
- Sarkkinen ES, Uusitupa MI, Pietinen P, Aro A, Ahola I, Penttila I, et al. Long-term effects of three fat-modified diets in hypercholesterolemic subjects. Atherosclerosis 1994;105(1):9-23. [DOI] [PubMed] [Google Scholar]
- Uusitupa MI, Sarkkinen ES, Torpstrom J, Pietinen P, Aro A. Long-term effects of four fat-modified diets on blood pressure. Journal of Human Hypertension 1994;8(3):209-18. [PubMed] [Google Scholar]
Sarkkinen Low Fat 1993 {published and unpublished data}
- Makinen E, Uusitupa MI, Pietinen P, Aro A, Penttila I. Long term effects of three fat modified diets on serum lipids in free living hypercholesterolaemic subjects (abstract). European Heart Journal 1991;12:162. [Google Scholar]
- Sarkkinen E. Long-Term Feasibility and Effects of Three Different Fat-Modified Diets in Free-Living Hypercholesterolemic Subjects [PhD Thesis]. Department of Clinical Nutrition, Faculty of Medicine, University of Kuopio, 1995. [Google Scholar]
- Sarkkinen ES, Agren JJ, Ahola I, Ovaskainen ML, Uusitupa MI. Fatty acid composition of serum cholesterol esters, and erythrocyte and platelet membranes as indicators of long-term adherence to fat-modified diets. American Journal of Clinical Nutrition 1994;59(2):364-70. [DOI] [PubMed] [Google Scholar]
- Sarkkinen ES, Uusitupa MI, Nyyssonen K, Parviainen M, Penttila I, Salonen JT. Effects of two low-fat diets, high and low in polyunsaturated fatty acids, on plasma lipid peroxides and serum vitamin E levels in free-living hypercholesterolaemic men. European Journal of Clinical Nutrition 1993;47(9):623-30. [PubMed] [Google Scholar]
- Sarkkinen ES, Uusitupa MI, Pietinen P, Aro A, Ahola I, Penttila I, et al. Long-term effects of three fat-modified diets in hypercholesterolemic subjects. Atherosclerosis 1994;105(1):9-23. [DOI] [PubMed] [Google Scholar]
- Uusitupa MI, Sarkkinen ES, Torpstrom J, Pietinen P, Aro A. Long-term effects of four fat-modified diets on blood pressure. Journal of Human Hypertension 1994;8(3):209-18. [PubMed] [Google Scholar]
Simon 1997 {published and unpublished data}
- Djuric Z, Heilbrun LK, Reading BA, Boomer A, Valeriote FA, Martino S. Effects of a low fat diet on levels of oxidative damage to DNA in human peripheral nucleated blood cells. Journal of the National Cancer Institute 1991;83(11):766-9. [DOI] [PubMed] [Google Scholar]
- Djuric Z, Martino S, Heilbrun LK, Hart RW. Dietary modulation of oxidative DNA damage. Advances In Experimental Medicine and Biology 1994;354:71-83. [DOI] [PubMed] [Google Scholar]
- Kasim SE, Martino S, Kim P-N, Khilnani S, Boomer A, Depper J, et al. Dietary and anthropometric determinants of plasma lipoproteins during a long-term low-fat diet in healthy women. American Journal of Clinical Nutrition 1993;57:146-53. [DOI] [PubMed] [Google Scholar]
- Simon MS, Heilbrun LK, Boomer A, Kresge C, Depper J, Kim PN, et al. A randomised trial of a low-fat dietary intervention in women at high risk for breast cancer. Nutrition and Cancer 1997;27(2):136-42. [DOI] [PubMed] [Google Scholar]
Strychar 2009 {published and unpublished data}
- Strychar I, Cohn JS, Renier G, Rivard M, Aris-Jilwan N, Beauregard H, et al. Effects of a diet higher in carbohydrate/lower in fat versus lower in carbohydrate/higher in monounsaturated fat on postmeal triglyceride concentrations and other cardiovascular risk factors in type 1 diabetes. Diabetes Care 2009;32(9):1597-9. [DOI] [PMC free article] [PubMed] [Google Scholar]
Swinburn 2001 {published and unpublished data}
- Ley SJ, Metcalf PA, Scragg RKR, Swinburn BA. Long-term effects of a reduced fat diet intervention on cardiovascular disease risk factors in individuals with glucose intolerance. Diabetes Research and Clinical Practice 2004;63:103-12. [DOI] [PubMed] [Google Scholar]
- Swinburn BA, Metcalf PA, Ley SJ. Long-term (5-year) effects of a reduced-fat diet intervention in individuals with glucose intolerance. Diabetes Care 2001;24(4):619-24. [DOI] [PubMed] [Google Scholar]
- Swinburn BA, Woollard GA, Chang EC, Wilson MR. Effects of reduced-fat diets consumed ad libitum on intake of nutrients particularly antioxidant vitamins. Journal of the American Dietetic Association 1999;99(11):1400-5. [DOI] [PubMed] [Google Scholar]
WHEL 2007 {published data only}
- Bardwell WA, Profant J, Casden DR, Dimsdale JE, Ancoli-Israel S, Natarajan L, et al. The relative importance of specific risk factors for insomnia in women treated for early-stage breast cancer. Psycho-Oncology 2008;17(1):9-18. [DOI] [PMC free article] [PubMed] [Google Scholar]
- Bertram LAC, Stefanick ML, Saquib N, Natarajan L, Patterson RE, Bardwell W, et al. Physical activity, additional breast cancer events, and mortality among early-stage breast cancer survivors: findings from the WHEL Study. Cancer Causes & Control 2011;22(3):427-35. [DOI] [PMC free article] [PubMed] [Google Scholar]
- Caan BJ, Flatt SW, Rock CL, Ritenbaugh C, Newman V, Pierce JP, et al, Women's Healthy Eating and Living Group. Low-energy reporting in women at risk for breast cancer recurrence. Cancer Epidemiology, Biomarkers & Prevention 2000;9(10):1091-7. [PubMed] [Google Scholar]
- Gold EB, Flatt SW, Pierce JP, Bardwell WA, Hajek RA, Newman VA, et al. Dietary factors and vasomotor symptoms in breast cancer survivors: the WHEL Study. Menopause 2006;13(3):423-33. [DOI] [PubMed] [Google Scholar]
- Gold EB, Pierce JP, Natarajan L, Stefanick ML, Laughlin GA, Caan BJ, et al. Dietary pattern influences breast cancer prognosis in women without hot flashes: the Women's Healthy Eating and Living trial. Journal of Clinical Oncology 2009;27(3):352-9. [DOI] [PMC free article] [PubMed] [Google Scholar]
- Hernandez-Valero MA, Thomson CA, Hernandez M, Tran T, Detry MA, Theriault RL, et al. Comparison of baseline dietary intake of Hispanic and matched non-Hispanic white breast cancer survivors enrolled in the Women's Healthy Eating and Living study. Journal of the American Dietetic Association 2008;108(8):1323-9. [DOI] [PMC free article] [PubMed] [Google Scholar]
- Hong S, Bardwell WA, Natarajan L, Flatt SW, Rock CL, Newman VA, et al. Correlates of physical activity level in breast cancer survivors participating in the Women's Healthy Eating and Living (WHEL) Study. Breast Cancer Research & Treatment 2007;101(2):225-32. [DOI] [PubMed] [Google Scholar]
- Hyder JA, Thomson CA, Natarajan L, Madlensky L, Pu M, Emond J, et al. Adopting a plant-based diet minimally increased food costs in WHEL Study. American Journal of Health Behavior 2009;33(5):530-9. [DOI] [PMC free article] [PubMed] [Google Scholar]
- Madlensky L, Natarajan L, Flatt SW, Faerber S, Newman VA, Pierce JP, et al. Timing of dietary change in response to a telephone counseling intervention: evidence from the WHEL study. Health Psychology 2008;27(5):539-47. [DOI] [PMC free article] [PubMed] [Google Scholar]
- Mortimer JE, Flatt SW, Parker BA, Gold EB, Wasserman L, Natarajan L, et al. Tamoxifen, hot flashes and recurrence in breast cancer. Breast Cancer Research & Treatment 2008;108(3):421-6. [DOI] [PMC free article] [PubMed] [Google Scholar]
- NCT00003787. Women's Healthy Eating and Living study. clinicaltrials.gov/ct2/show/NCT00003787 (received 3 June 2004).
- Newman VA, Thomson CA, Rock CL, Flatt SW, Kealey S, Bardwell WA, et al. Achieving substantial changes in eating behavior among women previously treated for breast cancer - an overview of the intervention. Journal of the American Dietetic Association 2005;105(3):382-91. [DOI] [PubMed] [Google Scholar]
- Pierce JP, Faerber S, Wright FA, Rock CL, Newman V, Flatt SW, et al. A randomized trial of the effect of a plant-based dietary pattern on additional breast cancer events and survival: the Women's Healthy Eating and Living (WHEL) study. Controlled Clinical Trials 2002;23(6):728-56. [DOI] [PubMed] [Google Scholar]
- Pierce JP, Natarajan L, Caan BJ, Flatt SW, Kealey S, Gold EB, et al. Dietary change and reduced breast cancer events among women without hot flashes after treatment of early-stage breast cancer: subgroup analysis of the Women's Healthy Eating and Living study. American Journal of Clinical Nutrition 2009;89(5):1565S-71S. [DOI] [PMC free article] [PubMed] [Google Scholar]
- Pierce JP, Natarajan L, Caan BJ, Parker BA, Greenberg ER, Flatt SW, et al. Influence of a diet very high in vegetables, fruit, and fiber and low in fat on prognosis following treatment for breast cancer: the Women's Healthy Eating and Living (WHEL) randomized trial. JAMA 2007;298(3):289-98. [DOI] [PMC free article] [PubMed] [Google Scholar]
- Pierce JP, Natarajan L, Sun S, Al-Delaimy W, Flatt SW, Kealey S, et al. Increases in plasma carotenoid concentrations in response to a major dietary change in the Women's Healthy Eating and Living study. Cancer Epidemiology, Biomarkers & Prevention 2006;15(10):1886-92. [DOI] [PubMed] [Google Scholar]
- Pierce JP, Newman VA, Flatt SW, Faerber S, Rock CL, Natarajan L, et al. Telephone counseling intervention increases intakes of micronutrient- and phytochemical-rich vegetables, fruit and fiber in breast cancer survivors. Journal of Nutrition 2004;134(2):452-8. [DOI] [PubMed] [Google Scholar]
- Pierce JP, Pierce John P. Diet and breast cancer prognosis: making sense of the Women's Healthy Eating and Living and Women's Intervention Nutrition Study trials. Current Opinion in Obstetrics & Gynecology 2009;21(1):86-91. [DOI] [PMC free article] [PubMed] [Google Scholar]
- Pierce JPF. A randomized trial of the effect of a plant-based dietary pattern on additional breast cancer events and survival: the Women's Healthy Eating and Living (WHEL) study. Controlled Clinical Trials 2002;23(6):728-56. [DOI] [PubMed] [Google Scholar]
- Rock CL, Flatt SW, Laughlin GA, Gold EB, Thomson CA, Natarajan L, et al. Reproductive steroid hormones and recurrence-free survival in women with a history of breast cancer. Cancer Epidemiology, Biomarkers & Prevention 2008;17(3):614-20. [DOI] [PMC free article] [PubMed] [Google Scholar]
- Rock CL, Flatt SW, Newman V, Caan BJ, Haan MN, Stefanick ML, et al. Factors associated with weight gain in women after diagnosis of breast cancer. Women's Healthy Eating and Living Study Group. Journal of the American Dietetic Association 1999;99(10):1212-21. [DOI] [PubMed] [Google Scholar]
- Rock CL, Flatt SW, Thomson CA, Stefanick ML, Newman VA, Jones L, et al. Plasma triacylglycerol and HDL cholesterol concentrations confirm self-reported changes in carbohydrate and fat intakes in women in a diet intervention trial. Journal of Nutrition 2004;134(2):342-7. [DOI] [PubMed] [Google Scholar]
- Rock CL, Flatt SW, Thomson CA, Stefanick ML, Newman VA, Jones LA, et al. Effects of a high-fiber, low-fat diet intervention on serum concentrations of reproductive steroid hormones in women with a history of breast cancer. Journal of Clinical Oncology 2004;22(12):2379-87. [DOI] [PubMed] [Google Scholar]
- Rock CL, Natarajan L, Pu M, Thomson CA, Flatt SW, Caan BJ, et al. Longitudinal biological exposure to carotenoids is associated with breast cancer-free survival in the Women's Healthy Eating and Living study. Cancer Epidemiology, Biomarkers & Prevention 2009;18(2):486-94. [DOI] [PMC free article] [PubMed] [Google Scholar]
- Rock CL, Thomson C, Caan BJ, Flatt SW, Newman V, Ritenbaugh C, et al. Reduction in fat intake is not associated with weight loss in most women after breast cancer diagnosis. Cancer 2001;91(1):25-34. [PubMed] [Google Scholar]
- Saquib N, Flatt SW, Natarajan L, Thomson CA, Bardwell WA, Caan B, et al. Weight gain and recovery of pre-cancer weight after breast cancer treatments: evidence from the Women's Healthy Eating and Living (WHEL) study. Breast Cancer Research & Treatment 2007;105(2):177-86. [DOI] [PubMed] [Google Scholar]
- Saquib N, Natarajan L, Rock CL, Flatt SW, Madlensky L, Kealey S, et al. The impact of a long-term reduction in dietary energy density on body weight within a randomized diet trial. Nutrition and Cancer 2008;60(1):31-8. [DOI] [PMC free article] [PubMed] [Google Scholar]
- Saxe GA, Madlensky L, Kealey S, Wu DP, Freeman KL, Pierce JP, et al. Disclosure to physicians of CAM use by breast cancer patients: findings from the Women's Healthy Eating and Living study. Integrative Cancer Therapies 2008;7(3):122-9. [DOI] [PMC free article] [PubMed] [Google Scholar]
- Thomson CA, Rock CL, Giuliano AR, Newton TR, Cui H, Reid PM, et al. Longitudinal changes in body weight and body composition among women previously treated for breast cancer consuming a high-vegetable, fruit and fiber, low-fat diet. European Journal of Nutrition 2005;44(1):18-25. [DOI] [PubMed] [Google Scholar]
WHI 2006 {published data only}
- Anderson G, Cummings S, Freedman LS, Furberg C, Henderson M, Johnson SR, et al. Design of the Women's Health Initiative clinical trial and observational study. Controlled Clinical Trials 1998;19(1):61-109. [DOI] [PubMed] [Google Scholar]
- Anderson GL, Manson J, Wallace R, Lund B, Hall D, Davis S, et al. Implementation of the Women's Health Initiative study design. Annals of Epidemiology 2003;13(9 Suppl):S5-17. [DOI] [PubMed] [Google Scholar]
- Assaf AR, Beresford SAA, Risica PM, Aragaki A, Brunner RL, Bowen DJ, et al. Low-fat dietary pattern intervention and health-related quality of life: the Women’s Health Initiative randomized controlled Dietary Modification trial. Journal of the Academy of Nutrition and Dietetics 2016;116(2):259-71. [DOI] [PMC free article] [PubMed] [Google Scholar]
- Beresford SA, Johnson KC, Ritenbaugh C, Lasser NL, Snetselaar LG, Black HR, et al. Low-fat dietary pattern and risk of colorectal cancer: the Women's Health Initiative randomized controlled Dietary Modification trial. JAMA 2006;295(6):643-54. [DOI] [PubMed] [Google Scholar]
- Bowen D, Ehret C, Pedersen M, Snetselaar L, Johnson M, Tinker L, et al. Results of an adjunct dietary intervention program in the Women's Health Initiative. Journal of the American Dietetic Association 2002;102(11):1631-7. [DOI] [PubMed] [Google Scholar]
- Carty CL, Kooperberg C, Neuhouser ML, Tinker L, Howard B, Wactawski-Wende J, et al. Low-fat dietary pattern and change in body-composition traits in the Women's Health Initiative Dietary Modification trial. The American Journal of Clinical Nutrition 2011;93(3):516-24. [DOI] [PMC free article] [PubMed] [Google Scholar]
- Curb JD, McTiernan A, Heckbert SR, Kooperberg C, Stanford J, Nevitt M, et al. Outcomes ascertainment and adjudication methods in the Women's Health Initiative. Annals of Epidemiology 2003;13(9 Suppl):S122-8. [DOI] [PubMed] [Google Scholar]
- Hays J, Hunt JR, Hubbell FA, Anderson GL, Limacher M, Allen C, et al. The Women's Health Initiative recruitment methods and results. Annals of Epidemiology 2003;13(9 Suppl):S18-77. [DOI] [PubMed] [Google Scholar]
- Hebert JR, Patterson RE, Gorfine M, Ebbeling CB, St Jeor ST, Chlebowski RT, et al. Differences between estimated caloric requirements and self-reported caloric intake in the Women's Health Initiative. Annals of Epidemiology 2003;13(9):629-37. [DOI] [PubMed] [Google Scholar]
- Howard BV, Curb JD, Eaton CB, Kooperberg C, Ockene J, Kostis JB, et al. Low-fat dietary pattern and lipoprotein risk factors: the Women's Health Initiative Dietary Modification trial. American Journal of Clinical Nutrition 2010;91:860-74. [DOI] [PMC free article] [PubMed] [Google Scholar]
- Howard BV, Manson JE, Stefanick ML, Beresford SA, Frank G, Jones B, et al. Low-fat dietary pattern and weight change over 7 years: the Women's Health Initiative Dietary Modification trial. JAMA 2006;295(1):39-49. [DOI] [PubMed] [Google Scholar]
- Howard BV, Van Horn L, Hsia J, Manson JE, Stefanick ML, Wassertheil-Smoller S, et al. Low-fat dietary pattern and risk of cardiovascular disease: the Women's Health Initiative randomized controlled Dietary Modification trial. JAMA 2006;295(6):655-66. [DOI] [PubMed] [Google Scholar]
- Howard BV. Dietary fat and cardiovascular disease: putting the Women's Health Initiative in perspective. Nutrition Metabolism & Cardiovascular Diseases 2007;17(3):171-4. [DOI] [PubMed] [Google Scholar]
- NCT00000611. Women's Health Initiative (WHI). clinicaltrials.gov/ct2/show/NCT00000611 (received 28 Oct 1999).
- Neuhouser ML, Tinker L, Shaw PA, Schoeller D, Bingham SA, Horn LV, et al. Use of recovery biomarkers to calibrate nutrient consumption self-reports in the Women's Health Initiative. American Journal of Epidemiology 2008;167(10):1247-59. [DOI] [PubMed] [Google Scholar]
- Patterson RE, Kristal A, Rodabough R, Caan B, Lillington L, Mossavar-Rahmani Y, et al. Changes in food sources of dietary fat in response to an intensive low-fat dietary intervention: early results from the Women's Health Initiative. Journal of the American Dietetic Association 2003;103(4):454-60. [DOI] [PubMed] [Google Scholar]
- Patterson RE, Kristal AR, Tinker LF, Carter RA, Bolton MP, Agurs-Collins T, et al. Measurement characteristics of the Women's Health Initiative food frequency questionnaire. Annals of Epidemiology 1999;9(3):178-87. [DOI] [PubMed] [Google Scholar]
- Prentice RL, Caan B, Chlebowski RT, Patterson R, Kuller LH, Ockene JK, et al. Low-fat dietary pattern and risk of invasive breast cancer: the Women's Health Initiative randomized controlled Dietary Modification trial. JAMA 2006;295(6):629-42. [DOI] [PubMed] [Google Scholar]
- Prentice RL, Thomson CA, Caan B, Hubbell FA, Anderson GL, Beresford SA, et al. Low-fat dietary pattern and cancer incidence in the Women's Health Initiative Dietary Modification randomized controlled trial. Journal of the National Cancer Institute 2007;99(20):1534-43. [DOI] [PMC free article] [PubMed] [Google Scholar]
- Ritenbaugh C, Patterson RE, Chlebowski RT, Caan B, Fels-Tinker L, Howard B, et al. The Women's Health Initiative Dietary Modification trial: overview and baseline characteristics of participants. Annals of Epidemiology 2003;13(9 Suppl):S87-97. [DOI] [PubMed] [Google Scholar]
- Rossouw JE, Finnegan LP, Harlan WR, Pinn VW, Clifford C, McGowan JA. The evolution of the Women's Health Initiative: perspectives from the NIH. Journal of the American Medical Women's Association 1995;50(2):50-5. [PubMed] [Google Scholar]
- Tinker LF, Bonds DE, Margolis KL, Manson JE, Howard BV, Larson J, et al. Low-fat dietary pattern and risk of treated diabetes mellitus in postmenopausal women: the Women's Health Initiative randomized controlled Dietary Modification trial. Archives of Internal Medicine 2008;168(14):1500-11. [DOI] [PubMed] [Google Scholar]
- Tinker LF, Perri MG, Patterson RE, Bowen DJ, McIntosh M, Parker LM, et al. The effects of physical and emotional status on adherence to a low-fat dietary pattern in the Women's Health Initiative. Journal of the American Dietetic Association 2002;102(6):789-800. [DOI] [PubMed] [Google Scholar]
- Tinker LF, Rosal MC, Young AF, Perri MG, Patterson RE, Van Horn L, et al. Predictors of dietary change and maintenance in the Women's Health Initiative Dietary Modification trial. Journal of the American Dietetic Association 2007;107(7):1155-66. [DOI] [PubMed] [Google Scholar]
- Women's Health Initiative Study Group. Dietary adherence in the Women's Health Initiative Dietary Modification trial. Journal of the American Dietetic Association 2004;104(4):654-8. [DOI] [PubMed] [Google Scholar]
WHTFSMP 2003 {published and unpublished data}
- Bhargava A, Guthrie J F. Unhealthy eating habits, physical exercise and macronutrient intakes are predictors of anthropometric indicators in the Women's Health trial: feasibility study in minority populations. British Journal of Nutrition 2002;88(6):719-28. [DOI] [PubMed] [Google Scholar]
- Bhargava A. Dietary modifications and lipid accumulation product are associated with systolic and diastolic blood pressures in the Women's Health trial: feasibility study in minority populations. Current Hypertension Reports 2018;20(6):50. [DOI] [PubMed] [Google Scholar]
- Bowen D, Clifford CK, Coates R, Evans M, Feng Z, Fouad M, et al. The Women's Health trial feasibility study in minority populations: design and baseline descriptions. Annals of Epidemiology 1996;6(6):507-19. [DOI] [PubMed] [Google Scholar]
- Coates RJ, Bowen DJ, Kristal AR, Feng Z, Oberman A, Hall WD, et al. The Women's Health trial feasibility study in minority populations: changes in dietary intakes. American Journal of Epidemiology 1999;149(12):1104-12. [DOI] [PubMed] [Google Scholar]
- Hall WD, Feng Z, George VA, Lewis CE, Oberman A, Huber M, et al, WHT:FSMP. Low-fat diet: effect on anthropometrics, blood pressure, glucose and insulin in older women. Ethnicity and Disease 2003;13:337-43. [PubMed] [Google Scholar]
- Kristal AR, Shattuck AL, Patterson RE. Differences in fat-related dietary patterns between black, Hispanic and white women: results from the Women's Health Trial Feasibility study in minority populations. Public Health Nutrition 2007;2(3):253-62. [DOI] [PubMed] [Google Scholar]
- Lewis CE, George V, Fouad M, Porter V, Bowen D, Urban N. Recruitment strategies in the Women’s Health trial: feasibility study in minority populations. Controlled Clinical Trials 1998;19(5):461-76. [DOI] [PubMed] [Google Scholar]
- NCT00000481. Women's Health Trial: feasibility study in minority populations. clinicaltrials.gov/ct2/show/NCT00000481 (received 28 Oct 1999).
WHT Full‐scale {published and unpublished data}
- Kristal AR, White E, Shattuck AL, Curry S, Anderson GL, Fowler A, et al. Long-term maintenance of a low-fat diet: durability of fat-related dietary habits in the Women's Health trial. Journal of the American Dietetic Association 1992;92(5):553-9. [PubMed] [Google Scholar]
- Self S, Prentice R, Iverson D, Henderson M, Thompson D, Byar D, et al. Statistical design of the Women's Health trial. Controlled Clinical Trials 1988;9(2):119-36. [DOI] [PubMed] [Google Scholar]
- White E, Shattuck AL, Kristal AR, Urban N, Prentice RL, Henderson MM, et al. Maintenance of a low-fat diet: follow-up of the Women's Health trial. Cancer Epidemiology, Biomarkers and Prevention 1992;1(4):315-23. [PubMed] [Google Scholar]
WHT Vanguard 1991 {published and unpublished data}
- Gorbach SL, Morrill-LaBrode A, Woods MN, Dwyer JT, Selles WD, Henderson M, et al. Changes in food patterns during a low-fat dietary intervention in women. Journal of the American Dietetic Association 1990;90(6):802-9. [PubMed] [Google Scholar]
- Henderson MM, Kushi LH, Thompson DJ, Gorbach SL, Clifford CK, Insull W, et al. Feasibility of a randomized trial of a low-fat diet for the prevention of breast cancer: dietary compliance in the Women's Health trial Vanguard study. Preventive Medicine 1990;19(2):115-33. [DOI] [PubMed] [Google Scholar]
- Insull W Jr, Henderson MM, Prentice RL, Thompson DJ, Clifford C, Goldman S, et al. Results of a randomized feasibility study of a low-fat diet. Archives of Internal Medicine 1990;150(2):421-7. [PubMed] [Google Scholar]
- Prentice RL, Kakar F, Hursting S, Sheppard L, Klein R, Kushi LH. Aspects of the rationale for the Women's Health trial2. Journal of the National Cancer Institute 1988;80(11):802-14. [DOI] [PubMed] [Google Scholar]
- Self S, Prentice R, Iverson D, Henderson M, Thompson D, Byar D, et al. Statistical design of the Women's Health trial. Controlled Clinical Trials 1988;9(2):119-36. [DOI] [PubMed] [Google Scholar]
- Sheppard L, Kristal AR, Kushi LH. Weight loss in women participating in a randomized trial of low-fat diets. American Journal of Clinical Nutrition 1991;54(5):821-8. [DOI] [PubMed] [Google Scholar]
- White E, Shattuck AL, Kristal AR, Urban N, Prentice RL, Henderson MM, et al. Maintenance of a low-fat diet: follow-up of the Women's Health trial. Cancer Epidemiology, Biomarkers and Prevention 1992;1(4):315-23. [PubMed] [Google Scholar]
WINS 1993 {published and unpublished data}
- Chlebowski RT, Blackburn GL, Buzzard IM, Rose DP, Martino S, Khandekar JD, et al. Adherence to a dietary fat intake reduction program in postmenopausal women receiving therapy for early breast cancer. The Women's Intervention Nutrition study. Journal of Clinical Oncology 1993;11(11):2072-80. [DOI] [PubMed] [Google Scholar]
- Chlebowski RT, Blackburn GL, Thomson CA, Nixon DW, Shapiro A, Hoy MK, et al. Dietary fat reduction and breast cancer outcome: interim efficacy results from the Women's Intervention Nutrition study. Journal of the National Cancer Institute 2006;98(24):1767-76. [DOI] [PubMed] [Google Scholar]
- Chlebowski RT, Blackburn GL. Abstract S5-08: Final survival analysis from the randomized Womens Intervention Nutrition Study (WINS) evaluating dietary intervention as adjuvant breast cancer therapy. Cancer Research 2015;75(9 Suppl):S5-08. [Google Scholar]
- Chlebowski RT, Rose D, Blackburn G, Buzzard M, Khandekar J, York R, et al. Feasibility of using dietary fat intake reduction in adjuvant breast cancer management. Proceedings of American Society of Clinical Oncology 1991;86:86. [Google Scholar]
- Hoy MK, Winters BL, Chlebowski RT, Papoutsakis C, Shapiro A, Lubin MP, et al. Implementing a low-fat eating plan in the Women's Intervention Nutrition study. Journal of the American Dietetic Association 2009;109(4):688-96. [DOI] [PMC free article] [PubMed] [Google Scholar]
- Rose DP, Chlebowski RT, Connolly JM, Jones LA, Wynder EL. Effects of tamoxifen adjuvant therapy and a low-fat diet on serum binding proteins and estradiol bioavailability in postmenopausal breast cancer patients. Cancer Research 1992;52:5386-90. [PubMed] [Google Scholar]
- Rose DP, Connolly JM, Chlebowski RT, Buzzard IM, Wynder EL. The effects of a low-fat dietary intervention and tamoxifen adjuvant therapy on the serum estrogen and sex hormone-binding globulin concentrations of postmenopausal breast cancer patients. Breast Cancer Research & Treatment 1993;27(3):253-62. [DOI] [PubMed] [Google Scholar]
- Wynder EL, Cohen LA, Winters BL. The challenges of assessing fat intake in cancer research investigations. Journal of the American Dietetic Association 1997;97(7 Suppl):S5-S8. [DOI] [PubMed] [Google Scholar]
Yadav 2016 {published data only}
- NCT00852722. Low fat diet and Multiple Sclerosis (MS). clinicaltrials.gov/ct2/show/NCT00852722 (received 27 FEb 2009).
- Yadav V, Marracci G, Kim E, Spain R, Cameron M, Overs S, et al. Effects of a low fat plant based diet in multiple sclerosis (MS): results of a 1-year long randomized controlled (RC) study. Neurology 2014;82(10):P6.152. [Google Scholar]
- Yadav V, Marracci G, Kim E, Spain R, Cameron M, Overs S, et al. Low-fat, plant-based diet in multiple sclerosis: a randomized controlled trial. Multiple Sclerosis and Related Disorders 2016;9:80-90. [DOI] [PubMed] [Google Scholar]
References to studies excluded from this review
Agewall 2001 {published data only}
- Agewall S. Multiple risk intervention trial in high risk hypertensive men: comparison of ultrasound intima-media thickness and clinical outcome during 6 years of follow-up. Journal of Internal Medicine 2001;249(4):305-14. [DOI] [PubMed] [Google Scholar]
Ammerman 2003 {published data only}
- Ammerman AS, Keyserling TC, Atwood JR, Hosking JD, Zayed H, Krasny C. A randomized controlled trial of a public health nurse directed treatment program for rural patients with high blood cholesterol. Preventive Medicine 2003;36(3):340-51. [DOI] [PubMed] [Google Scholar]
Aquilani 2000 {published data only}
- Aquilani R, Tramarin R, Pedretti RFE, Bertolotti G, Sommaruga M, Mariani P, et al. Can a very-low-fat diet achieve cholesterol goals in CAD? Cardiology Review 2000;17(10):36-40. [Google Scholar]
Arne 2014 {published data only}
- Arne A. Diet in the role of prevention and management of obesity: from caloric restriction to optimized diet composition. Obesity Reviews 2014;15(Suppl S2):PL01. [Google Scholar]
Arntzenius 1985 {published data only}
- Arntzenius AC, Kromhout D, Bartn JE, Reiber JHC, Bruschke AVG, Buis Van Gent CM. Diet, lipoprotiens and progression of coronary atherosclerosis: the Leiden intervention trial. New England Journal of Medicine 1985;312:805-8. [DOI] [PubMed] [Google Scholar]
ASSIST 2001 {published data only}
- Moher M, Yudkin P, Wright L, Turner R, Fuller A, Schofield T, et al. Cluster randomised controlled trial to compare three methods of promoting secondary prevention of coronary heart disease in primary care. BMJ 2001;322(7298):1338. [DOI] [PMC free article] [PubMed] [Google Scholar]
Bakx 1997 {published data only}
- Bakx JC, Stafleu A, Van SW, Van den HH, Van WC. Long-term effect of nutritional counseling: a study in family medicine. American Journal of Clinical Nutrition 1997;65(6 Suppl):1946S-50S. [DOI] [PubMed] [Google Scholar]
Ball 1965 {published data only}
- Committee A Research. Low-fat diet in myocardial infarction: a controlled trial. Lancet 1965;286(7411):501-4. [PubMed] [Google Scholar]
Barnard 2009 {published data only}
- Barnard ND, Cohen J, Jenkins DJ, Turner-McGrievy G, Gloede L, Green A, et al. A low-fat vegan diet and a conventional diabetes diet in the treatment of type 2 diabetes: a randomized, controlled, 74-wk clinical trial. American Journal of Clinical Nutrition 2009;89(5):1588S-96S. [DOI] [PMC free article] [PubMed] [Google Scholar]
Barndt 1977 {published data only}
- Barndt R, Blankenhorn CH, Crawford DW. Regression and progression of early femoral atherosclerosis in treated hyperlipidaemic patients. Annals of Internal Medicine 1977;86:139-46. [DOI] [PubMed] [Google Scholar]
Baron 1990 {published data only}
- Baron JA, Gleason R, Crowe B, Mann JI. Preliminary trial of the effect of general practice based nutritional advice. British Journal of General Practice 1990;40(333):137-41. [PMC free article] [PubMed] [Google Scholar]
Bazzano 2012 {published data only}
- Bazzano LA, Hu T, Reynolds K, Yao L, Bunol C, Liu Y, et al. Effects of low-carbohydrate and low-fat diets: a randomized trial. Annals of Internal Medicine 2014;161(5):309-18. [DOI: 10.7326/P14-9029; PMID: 25178581]] [DOI] [PMC free article] [PubMed] [Google Scholar]
- Bazzano LAR. Effect of a low-carbohydrate diet on weight and cardiovascular risk factors: a randomized controlled trial. Circulation 2012;125:AP306. [Google Scholar]
Beckmann 1995 {published data only}
- Beckmann SL, Os I, Kjeldsen SE, Eide IK, Westheim AS, Hjermann I. Effect of dietary counselling on blood pressure and arterial plasma catecholamines in primary hypertension. American Journal of Hypertension 1995;8(7):704-11. [DOI] [PubMed] [Google Scholar]
Bierenbaum 1963 {published data only}
- Bierenbaum ML, Fleischman AI, Raichelson RI, Hayton T, Watson P. Ten year experience of modified fat diets on younger men with coronary heart disease. Lancet 1973;i:1404-7. [DOI] [PubMed] [Google Scholar]
- Bierenbaum ML, Green DP, Florin A, Fleischman AI, Caldwell AB. Modified-fat dietary management of the young male with coronary disease. A five-year report. JAMA 1967;202(13):1119-23. [PubMed] [Google Scholar]
- Bierenbaum ML, Green DP, Gherman C, Florin A, Caldwell AB. The effects of two low fat dietary patterns on the blood cholesterol levels of young male coronary patients. Journal of Chronic Diseases 1963;16:1073-83. [DOI] [PubMed] [Google Scholar]
Bloomgarden 1987 {published data only}
- Bloomgarden ZT, Karmally W, Metzger MJ, Brothers M, Nechemias C, Bookman J, et al. Randomized, controlled trial of diabetic patient education: improved knowledge without improved metabolic status. Diabetes Care 1987;10:263-72. [DOI] [PubMed] [Google Scholar]
Bonnema 1995 {published data only}
- Bonnema SJ, Jespersen LT, Marving J, Gregersen G. Supplementation with olive oil rather than fish oil increases small arterial compliance in diabetic patients. Diabetes, Nutrition and Metabolism Clinical and Experimental 1995;8:81-7. [Google Scholar]
Brehm 2009 {published data only (unpublished sought but not used)}
- Brehm BJ, Lattin BL, Summer SS, Boback JA, Gilchrist GM, Jandacek RJ, et al. One-year comparison of a high-monounsaturated fat diet with a high-carbohydrate diet in type 2 diabetes. Diabetes Care 2009;32(2):215-20. [DOI] [PMC free article] [PubMed] [Google Scholar]
Brensike 1982 {published data only}
- Brensike JF, Kelsey SF, Passamani ER, Fisher MR, Richardson JM, Loh IK, et al. National Heart, Lung, and Blood Institute type II Coronary Intervention Study: design, methods, and baseline characteristics. Controlled Clinical Trials 1982;3(2):91-111. [DOI] [PubMed] [Google Scholar]
Broekmans 2003 {published and unpublished data}
- Broekmans WMR, Klopping-Ketelaars IAA, Weststrate JA, Tijburg LBM, Van Poppel G, Vink AA, et al. Decreased carotenoid concentrations due to dietary sucrose polyesters do not affect possible markers of disease risk in humans. Journal of Nutrition 2003;133:720-6. [DOI] [PubMed] [Google Scholar]
Brown 1984 {published data only}
- Brown GD, Whyte L, Gee MI, Crockford PM, Grace M, Oberle K, et al. Effects of two "lipid-lowering" diets on plasma lipid levels of patients with peripheral vascular disease. Journal of the American Dietetic Association 1984;84(5):546-50. [PubMed] [Google Scholar]
Bruce 1994 {published data only}
- Bruce SL, Grove SK. The effect of a coronary artery risk evaluation program on serum lipid values and cardiovascular risk levels. Applied Nursing Research 1994;7(2):67-74. [DOI] [PubMed] [Google Scholar]
Bruno 1983 {published data only}
- Bruno R, Arnold C, Jacobson L, Winick M, Wynder E. Randomized controlled trial of a nonpharmacologic cholesterol reduction program at the worksite. Preventive Medicine 1983;12(4):523-32. [DOI] [PubMed] [Google Scholar]
Byers 1995 {published data only}
- Byers T, Mullis R, Anderson J, Dusenbury L, Gorsky R, Kimber C, et al. The costs and effects of a nutritional education program following work-site cholesterol screening. American Journal of Public Health 1995;85(5):650-5. [DOI] [PMC free article] [PubMed] [Google Scholar]
Caggiula 1996 {published data only}
- Caggiula AW, Watson JE, Kuller LH, Olson MB, Milas NC, Berry M, et al. Cholesterol-lowering intervention program. Effect of the step I diet in community office practices. Archives of Internal Medicine 1996;156(11):1205-13. [DOI] [PubMed] [Google Scholar]
CARMEN 2000 {published and unpublished data}
- Poppitt SD, Keogh GF, Prentice AM, Williams DEM, Sonnemans HMW, Valk EEJ, et al. Long-term effects of ad libitum low-fat, high-carbohydrate diets on body weight and serum lipids in overweight subjects with metabolic syndrome. American Journal of Clinical Nutrition 2002;75:11-20. [DOI] [PubMed] [Google Scholar]
- Raben A, Astrup A, Vasilaras TH, Prentice AM, Zunft H-JF, Formiguera X, et al. The CARMEN study [CARMEN-studiet]. Ugeskrift fur Laeger 2002;164(5):627-31. [PubMed] [Google Scholar]
- Saris WHM, Astrup A, Prentice AM, Zunft FJF, Formiguera X. CARMEN Project: European multicentre study on the impact of dietary fat/CHO ratio and simple/complex CHO changes on long term weight control in overweight subjects. International Journal of Obesity 1997;21(Suppl 2):S71. [Google Scholar]
- Saris WHM, Astrup A, Prentice AM, Zunft HJF, Formiguera X, Verboeket-van de Venne WPHG, et al. Randomized controlled trial of changes in dietary carbohydrate/fat ratio and simple vs complex carbohydrates on body weight and blood lipids: the CARMEN study. International Journal of Obesity 2000;24:1310-8. [DOI] [PubMed] [Google Scholar]
- Vasilaras TH, Astrup A, Raben A. Micronutrient intake in overweight subjects is not deficient on an ad libitum fat-reduced, high-simple carbohydrate diet. European Journal of Clinical Nutrition 2004;58(2):326-36. [DOI] [PubMed] [Google Scholar]
CCD 2008 {published data only}81151522
- Wolever T M, Gibbs A L, Chiasson J L, Connelly P W, Josse R G, Leiter L A, et al. Altering source or amount of dietary carbohydrate has acute and chronic effects on postprandial glucose and triglycerides in type 2 diabetes: canadian trial of Carbohydrates in Diabetes (CCD). Nutrition, metabolism, and cardiovascular diseases : NMCD 2013;23(3):227‐234. [DOI] [PubMed] [Google Scholar]
- Wolever TMS, Gibbs AL, Mehling C, Chiasson JL, Connelly PW, Josse RG, et al. The Canadian Trial of Carbohydrates in Diabetes (CCD), a 1-y controlled trial of low-glycemic-index dietary carbohydrate in type 2 diabetes: no effect on glycated hemoglobin but reduction in C-reactive protein. American Journal of Clinical Nutrition 2008;87(1):114-25. [DOI] [PubMed] [Google Scholar]
- Wolever TMS, Mehling C, Chiasson JL, Josse RG, Leiter LA, Maheux P, et al. Low glycaemic index diet and disposition index in type 2 diabetes (the Canadian trial of Carbohydrates in Diabetes): a randomised controlled trial. Diabetologia 2008;51(9):1607. [DOI] [PubMed] [Google Scholar]
Clark 1997 {published data only}
- Clark M, Ghandour G, Miller NH, Taylor CB, Bandura A, DeBusk RF. Development and evaluation of a computer-based system for dietary management of hyperlipidemia. Journal of the American Dietetic Association 1997;97(2):146-50. [DOI] [PubMed] [Google Scholar]
Cocinar para su salud 2016 {published data only}
- Greenlee H, Gaffney AO, Aycinena AC, Koch P, Contento I, Karmally W, et al. ¡Cocinar Para Su Salud!: Randomized controlled trial of a culturally based dietary intervention among Hispanic breast cancer survivors. Journal of the Academy of Nutrition and Dietetics 2015;115(5):709-723.e3. [DOI] [PMC free article] [PubMed] [Google Scholar]
Cohen 1991 {published data only}
- Cohen MD, D'Amico FJ, Merenstein JH. Weight reduction in obese hypertensive patients. Family Medicine 1991;23(1):25-8. [PubMed] [Google Scholar]
Coppell 2010 {published data only}
- Coppell KJK. Nutritional intervention in patients with type 2 diabetes who are hyperglycaemic despite optimised drug treatment - Lifestyle Over and Above Drugs in Diabetes (LOADD) study: randomised controlled trial. BMJ 2010;341:237. [DOI] [PMC free article] [PubMed] [Google Scholar]
Cox 1996 {published data only}
- Cox RH, Gonzales-Vigilar MCRV, Novascone MA, Silva-Barbeau I. Impact of a cancer intervention on diet-related cardiovascular disease risks of white and African-American EFNEP clients. Journal of Nutrition Education 1996;28:209-18. [Google Scholar]
Croft 1986 {published data only}
- Croft PR, Brigg D, Smith S, Harrison CB, Branthwaite A, Collins MF. How useful is weight reduction in the management of hypertension? Journal of the Royal College of General Practitioners 1986;36(291):445-8. [PMC free article] [PubMed] [Google Scholar]
Dalgard 2001 {published data only}
- Dalgard C, Thuroe A, Haastrup B, Haghfelt T, Stender S. Saturated fat intake is reduced in patients with ischemic heart disease 1 year after comprehensive counseling but not after brief counseling. Journal of the American Dietetic Association 2001;101(12):1420-9. [DOI] [PubMed] [Google Scholar]
Da Qing IGT 1997 {published data only}
- Pan XR, Li GW, Hu YH, Wang JX, Yang WY, An ZX, et al. Effects of diet and exercise in preventing NIDDM in people with impaired glucose tolerance. The Da Qing IGT and Diabetes Study. Diabetes Care 1997;20(4):537-44. [DOI] [PubMed] [Google Scholar]
DAS 1989 {published data only}
- Bovbjerg VE, McCann BS, Brief DJ, Follette WC, Retzlaff BM, Dowdy AA, et al. Spouse support and long-term adherence to lipid-lowering diets. American Journal of Epidemiology 1995;141(5):451-60. [DOI] [PubMed] [Google Scholar]
- Knopp RH, Retzlaff B, Walden C, Fish B, Buck B, McCann B. One-year effects of increasingly fat-restricted, carbohydrate-enriched diets on lipoprotein levels in free-living subjects. Proceedings of the Society for Experimental Biology & Medicine 2000;225(3):191-9. [DOI] [PubMed] [Google Scholar]
- Knopp RH, Walden CE, McCann BS, Retzlaff B, Dowdy A, Gey G, et al. Serial changes in lipoprotein cholesterol in hypercholesterolemic men treated with alternative diets [abstract]. Arteriosclerosis 1989;9:745A. [Google Scholar]
- Knopp RH, Walden CE, Retzlaff BM, McCann BS, Dowdy AA, Albers JJ, et al. Long-term cholesterol-lowering effects of 4 fat-restricted diets in hypercholesterolaemic and combined hyperlipidaemic men: the Dietary Alternatives study. JAMA 1997;278:1509-15. [PubMed] [Google Scholar]
- Walden CE, McCann BS, Retzlaff B, Dowdy A, Hanson M, Fish B, et al. Alternative fat-restricted diets for hypercholesterolemia and combined hyperlipidemia: feasibility, design, subject recruitment, and baseline characteristics of the Dietary Alternatives study. Journal of the American College of Nutrition 1991;10(5):429-42. [DOI] [PubMed] [Google Scholar]
Davey Smith 2005 {published data only}
- Davey Smith G, Bracha Y, Svendsen KH, Neaton JD, Haffner SM, Kuller LH, et al. Incidence of type 2 diabetes in the randomized multiple risk factor intervention trial. Annals of Internal Medicine 2005;142(5):313-22. [DOI] [PubMed] [Google Scholar]
DeBusk 1994 {published data only}
- DeBusk RF, Miller NH, Superko HR, Dennis CA, Thomas RJ, Lew HT, et al. A case-management system for coronary risk factor modification after acute myocardial infarction. Annals of Internal Medicine 1994;120(9):721-9. [DOI] [PubMed] [Google Scholar]
Delahanty 2001 {published data only}
- Delahanty LM, Hayden D, Ammerman A, Nathan DM. Medical nutrition therapy for hypercholesterolemia positively affects patient satisfaction and quality of life outcomes. Annals of Behavioral Medicine 2002;24(4):269-78. [DOI] [PubMed] [Google Scholar]
- Delahanty LM, Sonnenberg LM, Hayden D, Nathan DM. Clinical and cost outcomes of medical nutrition therapy for hypercholesterolemia: a controlled trial. Journal of the American Dietetic Association 2001;101(9):1012-23. [DOI] [PubMed] [Google Scholar]
Delius 1969 {published data only}
- Delius L. Treatment of hypotensive circulatory disorder [Die behandlung der hypotonen kreislaufregulationsstorung]. Deutsche Medizinische Wochenschrift 1969;94(42):2172-3. [DOI] [PubMed] [Google Scholar]
Dengel 1995 {published data only}
- Dengel JL, Katzel LI, Goldberg AP. Effect of an American Heart Association diet, with or without weight loss, on lipids in obese middle-aged and older men. American Journal of Clinical Nutrition 1995;62(4):715-21. [DOI] [PubMed] [Google Scholar]
Diabetes CCT 1995 {published data only}
- Anon. Effect of intensive diabetes management on macrovascular events and risk factors in the Diabetes Control and Complications trial. American Journal of Cardiology 1995;75:894-903. [DOI] [PubMed] [Google Scholar]
DIET 1998 {published data only}
- Dornelas EA, Wylie-Rosett J, Swencionis C. The DIET study: long term outcomes of a cognitive-behavioural weight control intervention in independent-living elders. Journal of the American Dietetic Association 1998;98(11):1276-81. [DOI] [PubMed] [Google Scholar]
DIRECT 2009 {published data only (unpublished sought but not used)}
- Ben-Avraham S, Harman-Boehm I, Schwarzfuchs D, Shai I. Dietary strategies for patients with type 2 diabetes in the era of multi-approaches; review and results from the Dietary Intervention Randomized Controlled Trial (DIRECT). Diabetes Research and Clinical Practice 2009;86(Suppl 1):S41-8. [DOI] [PubMed] [Google Scholar]
- Bluher M, Rudich A, Kloting N, Golan R, Henkin Y, Rubin E, et al. Two patterns of adipokine and other biomarker dynamics in a long-term weight loss intervention. Diabetes Care 2012;35(2):342-9. [DOI: 10.2337/dc11-1267] [DOI] [PMC free article] [PubMed] [Google Scholar]
- Canfi A, Gepner Y, Schwarzfuchs D, Golan R, Shahar DR, Fraser D, et al. Effect of changes in the intake of weight of specific food groups on successful body weight loss during a multi-dietary strategy intervention trial. Journal of the American College of Nutrition 2011;30(6):491-501. [DOI] [PubMed] [Google Scholar]
- Durst R, Shpitzen S, Meiner V, Schwarzfuchs D, Stampfer MJ, Schurr D, et al. Insulin receptor substrate 1 gene variation modifies insulin resistance response to various types of dietary strategies: results from the Direct Intervention trial. Journal of the American College of Cardiology 2012;59(13 Suppl):E1664. [DOI: 10.1016/S0735-1097(12)61665-9] [DOI] [Google Scholar]
- Greenberg I, Stampfer MJ, Schwarzfuchs D, Shai I. Adherence and success in long-term weight loss diets: the Dietary Intervention Randomized Controlled Trial (DIRECT). Journal of the American College of Nutrition 2009;28(2):159-68. [DOI] [PubMed] [Google Scholar]
- Leichtle AB, Helmschrodt C, Ceglarek U, Shai I, Henkin Y, Schwarzfuchs D, et al. Effects of a 2-y dietary weight-loss intervention on cholesterol metabolism in moderately obese men. American Journal of Clinical Nutrition 2011;94(5):1189-95. [DOI: 10.3945/ajcn.111.018119] [DOI] [PubMed] [Google Scholar]
- Paz-Tal O, Canfi A, Marko R, Katorzaa E, Karpas Z, Schwarzfuchs D, et al. Dynamics of magnesium, copper, selenium and zinc serum concentrations for 2-year dietary intervention. Clinical Nutrition ESPEN Journal 2013;8(3):e100-e107. [DOI: ] [Google Scholar]
- Qi Q, Durst R, Schwarzfuchs D, Leitersdorf E, Shpitzen S, Li Y, et al. CETP genotype and changes in lipid levels in response to weight-loss diet intervention in the POUNDS LOST and DIRECT randomized trials. Journal of Lipid Research 2015;56(3):713-21. [DOI: 10.1194/jlr.P055715] [DOI] [PMC free article] [PubMed] [Google Scholar]
- Qi Q, Durst R, Schwarzfuchs D, Leitersdorf E, Shpitzen S, Stampfer M, et al. CETP genetic variation modulates effects of weight-loss diets on lipid profile in two independent 2-year diet intervention studies: the pounds lost and direct trails. Circulation 2013;127(Suppl 12):Abstract MP33. [Google Scholar]
- Shai I, Schwarzfuchs D, Henkin Y, Shahar DR, Witkow S, Greenberg I, et al. Weight loss with a low-carbohydrate, Mediterranean, or low-fat diet. New England Journal of Medicine 2008;359:229-41. [DOI: 10.1056/NEJMoa0708681] [DOI] [PubMed] [Google Scholar]
- Shai I, Schwarzfuchs D, Henkin Y, Shahar DR, Witkow S, Greenberg I, et al, Dietary Intervention Randomized Controlled Trial (DIRECT) Group. Weight loss with a low-carbohydrate, Mediterranean, or low-fat diet. New England Journal of Medicine 2008;359:229-41. [DOI] [PubMed] [Google Scholar]
- Shai I, Spence JD, Schwarzfuchs D, Henkin Y, Parraga G, Rudich A, et al. Dietary intervention to reverse carotid atherosclerosis. Circulation 2010;121(10):1200-8. [DOI: 10.1161/CIRCULATIONAHA.109.879254] [DOI] [PubMed] [Google Scholar]
- Zheng Y, Ceglarek U, Huang T, Li L, Rood J, Ryan DH, et al. Weight-loss diets and 2-y changes in circulating amino acids in 2 randomized intervention trials. American Journal of Clinical Nutrition 2016;103(2):505-11. [DOI: 10.3945/ajcn.115.117689] [DOI] [PMC free article] [PubMed] [Google Scholar]
Dobs 1991 {published data only}
- Dobs AS, Sarma PS, Wilder L. Lipid-lowering diets in patients taking pravastatin, a new HMG-CoA reductase inhibitor: compliance and adequacy. American Journal of Clinical Nutrition 1991;54(4):696-700. [DOI] [PubMed] [Google Scholar]
DO IT 2006 {published and unpublished data}
- Berstad P, Seljeflot I, Veierod MB, Hjerkinn EM, Arnesen H, Pedersen JI, et al. Supplementation with fish oil affects the association between very long-chain n-3 polyunsaturated fatty acids in serum non-esterified fatty acids and soluble vascular cell adhesion molecule-1. Clinical Science 2003;105(1):13-20. [DOI] [PubMed] [Google Scholar]
- Ellingsen I, Hjerkinn EM, Seljeflot I, Arnesen H, Tonstad S, Ellingsen I, et al. Consumption of fruit and berries is inversely associated with carotid atherosclerosis in elderly men. British Journal of Nutrition 2008;99(3):674-81 Erratum in British Journal of Nutrition 2008; 99(3):697. [DOI] [PubMed] [Google Scholar]
- Ellingsen I, Seljeflot I, Arnesen H, Tonstad S. Vitamin C consumption is associated with less progression in carotid intima media thickness in elderly men: a 3-year intervention study. Nutrition Metabolism & Cardiovascular Diseases 2009;19(1):8-14. [DOI] [PubMed] [Google Scholar]
- Furenes EB, Seljeflot I, Solheim S, Hjerkinn EM, Arnesen H, Furenes EB, et al. Long-term influence of diet and/or omega-3 fatty acids on matrix metalloproteinase-9 and pregnancy-associated plasma protein-A in men at high risk of coronary heart disease. Scandinavian Journal of Clinical & Laboratory Investigation 2008;68(3):177-84. [DOI] [PubMed] [Google Scholar]
- Hjerkinn EM, Abdelnoor M, Breivik L, Bergengen L, Ellingsen I, Seljeflot I, et al. Effect of diet or very long chain omega-3 fatty acids on progression of atherosclerosis, evaluated by carotid plaques, intima-media thickness and by pulse wave propagation in elderly men with hypercholesterolaemia. European Journal of Cardiovascular Prevention & Rehabilitation 2006;13(3):325-33. [DOI] [PubMed] [Google Scholar]
- Hjerkinn EM, Seljeflot I, Ellingsen I, Berstad P, Hjermann I, Sandvik L, et al. Influence of long-term intervention with dietary counselling, long-chain n-3 fatty acid supplements, or both on circulating markers of endothelial activation in men with long-standing hyperlipidemia. American Journal of Clinical Nutrition 2005;81(3):583-9. [DOI] [PubMed] [Google Scholar]
- Lindman AS, Pedersen JI, Hjerkinn EM, Arnesen H, Veierod MB, Ellingsen I, et al. The effects of long-term diet and omega-3 fatty acid supplementation on coagulation factor VII and serum phospholipids with special emphasis on the R353Q polymorphism of the FVII gene. Thrombosis & Haemostasis 2004;91(6):1097-104. [DOI] [PubMed] [Google Scholar]
- Troseid M, Arnesen H, Hjerkinn EM, Seljeflot I. Serum levels of interleukin-18 are reduced by diet and n-3 fatty acid intervention in elderly high-risk men. Metabolism: Clinical & Experimental 2009;58(11):1543-9. [DOI] [PubMed] [Google Scholar]
- Troseid M, Seljeflot I, Hjerkinn EM, Arnesen H. Interleukin-18 is a strong predictor of cardiovascular events in elderly men with the metabolic syndrome: synergistic effect of inflammation and hyperglycemia. Diabetes Care 2009;32(3):486-92. [DOI] [PMC free article] [PubMed] [Google Scholar]
Drummond 1998 {published data only}
- Drummond S, Kirk T. Assessment of advice to reduce dietary fat and non-milk extrinsic sugar in a free-living male population. Public Health Nutrition 1999;2(2):187-97. [DOI] [PubMed] [Google Scholar]
- Drummond S, Kirk T. The effect of different types of dietary advice on body composition in a group of Scottish men. Journal of Human Nutrition and Dietetics 1998;11(6):473-85. [Google Scholar]
Duffield 1982 {published data only}
- Duffield RG, Lewis B, Miller NE, Jamieson CW, Brunt JN, Colchester AC. Treatment of hyperlipidaemia retards progression of symptomatic femoral atherosclerosis. A randomised controlled trial. Lancet 1983;2(8351):639-42. [DOI] [PubMed] [Google Scholar]
- Duffield RG, Miller NE, Jamieson CW, Lewis B. A controlled trial of plasma lipid reduction in peripheral atherosclerosis - an interim report. British Journal of Surgery 1982;69 Suppl:S3-S5. [DOI] [PubMed] [Google Scholar]
Eckard 2013 {published data only}
- Eckard C, Cole R, Lockwood J, Torres DM, Williams CD, Shaw JC, et al. Prospective histopathologic evaluation of lifestyle modification in nonalcoholic fatty liver disease: a randomized trial. Therapeutic Advances in Gastroenterology 2013;6:249-59. [DOI] [PMC free article] [PubMed] [Google Scholar]
Elder 2000 {published data only}
- Elder JP, Candelaria JI, Woodruff SI, Criqui MH, Talavera GA, Rupp JW. Results of language for health: cardiovascular disease nutrition education for Latino English-as-a-second-language students. Health Education & Behavior 2000;27(1):50-63. [DOI] [PubMed] [Google Scholar]
Entwistle 2018 {published data only}
- Entwistle T, Miura K, Keevil BG, et al. Mediterranean and low-fat diets reduce cardiovascular disease after both heart and lung transplantation: results from a randomised trial with 12 month follow up. Nutrition Journal 2018;17:22. [DOI: 10.1186/s12937-018-0337-y] [DOI] [PMC free article] [PubMed] [Google Scholar]
- Entwistle TR, Green AC, Fildes JE, et al. Adherence to Mediterranean and low-fat diets among heart and lung transplant recipients: a randomized feasibility study. Nutrition Journal 2018;17:22. [DOI] [PMC free article] [PubMed] [Google Scholar]
Esposito 2003 {published data only}
- Esposito K, Pontillo A, Di Palo C, Giugliano G, Masella M, Marfella R, et al. Effect of weight loss and lifestyle changes on vascular inflammatory markers in obese women: a randomized trial. JAMA 2003;289(14):1799-804. [DOI] [PubMed] [Google Scholar]
Esposito 2004 {published data only}
- Esposito K, Marfella R, Ciotola M, Di Palo C, Giugliano F, Giugliano G, et al. Effect of a Mediterranean-style diet on endothelial dysfunction and markers of vascular inflammation in the metabolic syndrome: a randomized trial. JAMA 2004;292(12):1440-6. [DOI] [PubMed] [Google Scholar]
Esposito 2014 {published data only}
- Esposito K, Maiorino MI, Petrizzo M, Bellastella G, Giugliano D. The effects of a Mediterranean diet on the need for diabetes drugs and remission of newly diagnosed type 2 diabetes: follow-up of a randomized trial. Diabetes Care 2014;37:1824-30. [DOI] [PubMed] [Google Scholar]
EUROACTION 2008 {published data only}
- Wood DA, Kotseva K, Connolly S, Jennings C, Mead A, Jones J, et al. Nurse-coordinated multidisciplinary, family-based cardiovascular disease prevention programme (EUROACTION) for patients with coronary heart disease and asymptomatic individuals at high risk of cardiovascular disease: a paired, cluster-randomised controlled trial. Lancet 2008;371(9629):1999-2012. [DOI] [PubMed] [Google Scholar]
FARIS 1997 {published data only}
- Goble A, Jackson B, Phillips P, Race E, Oliver RG, Worcester MC. The Family Atherosclerosis Risk Intervention Study (FARIS): risk factor profiles of patients and their relatives following an acute cardiac event. Australian and New Zealand Journal of Medicine 1997;27:568-77. [DOI] [PubMed] [Google Scholar]
Fasting HGS 1997 {published data only}
- Dyson PA, Hammersley MS, Morris RJ, Holman RR, Turner RC. The Fasting Hyperglycaemia Study: II. Randomized controlled trial of reinforced healthy-living advice in subjects with increased but not diabetic fasting plasma glucose. Metabolism 1997;46(12 Suppl 1):50-5. [DOI] [PubMed] [Google Scholar]
Ferrara 2000 {published data only}
- Ferrara LA, Raimondi AS, D'Episcopo L, Guida L, Dello Russo A, Marotta T. Olive oil and reduced need for antihypertensive medications. Archives of Internal Medicine 2000;160:837-42. [DOI] [PubMed] [Google Scholar]
Finnish Diabetes 2000 {published data only}
- Uusitupa M, Louheranta A, Lindstrom J, Valle T, Sundvall J, Eriksson J, et al. The Finnish Diabetes Prevention study. British Journal of Nutrition 2000;83 Suppl 1:S137-42. [DOI] [PubMed] [Google Scholar]
Fleming 2002 {published data only}
- Fleming RM. The effect of high-, moderate-, and low-fat diets on weight loss and cardiovascular disease risk factors. Preventive Cardiology 2002;5:110-5. [DOI] [PubMed] [Google Scholar]
Fortmann 1988 {published data only}
- Fortmann SP, Haskell WL, Wood PD. Effects of weight loss on clinic and ambulatory blood pressure in normotensive men. American Journal of Cardiology 1988;62(1):89-93. [DOI] [PubMed] [Google Scholar]
Foster 2003 {published data only}
- Foster GD, Wyatt HR, Hill JO, McGuckin BG, Brill C, Mohammed BS, et al. A randomized trial of a low-carbohydrate diet for obesity. New England Journal of Medicine 2003;348(21):2082-90. [DOI] [PubMed] [Google Scholar]
Friedman 2012 {published data only}
- Friedman AN, Ogden LG, Foster GD, Klein S, Stein R, Miller B, et al. Comparative effects of low-carbohydrate high-protein versus low-fat diets on the kidney. Clinical Journal of the American Society of Nephrology 2012;7:1103-11. [DOI] [PMC free article] [PubMed] [Google Scholar]
Gaullier 2007 {published data only}
- Gaullier J-M, Halse J, Hoivik HO, Hoye K, Syvertsen C, Nurminiemi M, et al. Six months supplementation with conjugated linoleic acid induces regional-specific fat mass decreases in overweight and obese. British Journal of Nutrition 2007;97:550-60. [DOI] [PubMed] [Google Scholar]
German Fat Reduced {published and unpublished data}
- Seppelt B, Weststrate JA, Reinert A, Johnson D, Luder W, Zunft HJ. Long-term effects of nutrition with fat-reduced foods on energy consumption and body weight [Langzeiteffekte einer ernahrung mit fettreduzierten lebensmitteln auf die energieaufnahme und das korpergewicht]. Zeitschrift fur Ernahrungswissenschaft 1996;35(4):369-77. [DOI] [PubMed] [Google Scholar]
Glatzel 1966 {published data only}
- Glatzel H. The relationship between postprandial triglyceridemia and the fat content of the basic diet [Die abhangigkeit der postcenalen triglyceridamie von fettgehalt der grundkost]. Klinische Wochenschrift 1966;44(5):283-4. [DOI] [PubMed] [Google Scholar]
Goodpaster 1999 {published data only}
- Goodpaster BH, Kelley DE, Wing RR, Meier A, Thaete FL. Effects of weight loss on regional fat distribution and insulin sensitivity in obesity. Diabetes 1999;48:839-47. [DOI] [PubMed] [Google Scholar]
Gower 2012 {published data only}
- Gower BA, Goree LL, Chandler-Laney PC, Ellis AC, Casazza K, Granger WM. A higher-carbohydrate, lower-fat diet reduces fasting glucose concentration and improves beta-cell function in individuals with impaired fasting glucose. Metabolism 2012;61:358-65. [DOI] [PMC free article] [PubMed] [Google Scholar]
- Gower BAG. Impact of dietary macronutrient composition on insulin sensitivity, fasting glucose, and beta-cell response in healthy, overweight, men and women. Endocrine Reviews 2011;32(1 Suppl):SAT-110. [Google Scholar]
Greenlee 2016 {published data only}
- NCT01414062. Cook for your life! [Cocinar para su salud!]. clinicaltrials.gov/ct2/show/NCT01414062 (first received 11 August 2011).
Gregg 2013 {published data only}
- Gregg EWK. An intensive lifestyle intervention increased remission from type 2 diabetes in overweight adults. Annals of Internal Medicine 2013;158:4. [DOI] [PubMed] [Google Scholar]
Gudlaugsson 2013 {published data only}
- Gudlaugsson J, Gudnason V. Effects of exercise training and nutrition counseling on body composition and cardiometabolic factors in old individuals. European Geriatric Medicine 2013;4:431-7. [Google Scholar]
Guelinckx 2010 {published data only}
- Guelinckx I, Devlieger R, Mullie P, Vansant G. Effect of lifestyle intervention on dietary habits, physical activity, and gestational weight gain in obese pregnant women: a randomized controlled trial. American Journal of Clinical Nutrition 2010;91:373-80. [DOI] [PubMed] [Google Scholar]
Guldbrand 2012 {published data only}
- Guldbrand H, Dizdar B, Bunjaku B, Lindstrom T, Bachrach-Lindstrom M, Fredrikson M, et al. In type 2 diabetes, randomisation to advice to follow a low-carbohydrate diet transiently improves glycaemic control compared with advice to follow a low-fat diet producing a similar weight loss. Diabetologia 2012;55:2118-27. [DOI] [PMC free article] [PubMed] [Google Scholar]
- Guldbrand H, Lindström T, Dizdar B, Bunjaku B, Östgren CJ, Nystrom FH, et al. Randomization to a low-carbohydrate diet advice improves health related quality of life compared with a low-fat diet at similar weight-loss in Type 2 diabetes mellitus. Diabetes Research and Clinical Practice 2014;106(2):221‐7. [DOI] [PubMed] [Google Scholar]
- Jonasson L, Guldbrand H, Lundberg AK, Nystrom FH. Advice to follow a low-carbohydrate diet has a favourable impact on low-grade inflammation in type 2 diabetes compared with advice to follow a low-fat diet. Annals of Medicine 2014;46(3):182‐7. [DOI] [PMC free article] [PubMed] [Google Scholar]
Hardcastle 2008 {published data only}
- Hardcastle S, Taylor A, Bailey M, Castle R. A randomised controlled trial on the effectiveness of a primary health care based counselling intervention on physical activity, diet and CHD risk factors. Patient Education & Counseling 2008;70(1):31-9. [DOI] [PubMed] [Google Scholar]
Hartman 1993 {published data only}
- Hartman T, McCarthy P, Himes J. Use of eating pattern messages to evaluate changes in eating behaviors in a worksite cholesterol education program. Journal of the American Dietetic Association 1993;93:1119-23. [DOI] [PubMed] [Google Scholar]
Hartwell 1986 {published data only}
- Hartwell SL, Kaplan RM, Wallace JP. Comparison of behavioral interventions for control of type II diabetes mellitus. Behavior Therapy 1986;17:447-61. [Google Scholar]
Haynes 1984 {published data only}
- Haynes RB, Harper AC, Costley SR, Johnston M, Logan AG, Flanagan PT, et al. Failure of weight reduction to reduce mildly elevated blood pressure: a randomized trial. Journal of Hypertension 1984;2(5):535-9. [DOI] [PubMed] [Google Scholar]
Hellenius 1993 {published and unpublished data}
- Hellenius ML, Brismar KE, Berglund BH, De FU. Effects on glucose tolerance, insulin secretion, insulin-like growth factor 1 and its binding protein, IGFBP-1, in a randomized controlled diet and exercise study in healthy, middle-aged men. Journal of Internal Medicine 1995;238(2):121-30. [DOI] [PubMed] [Google Scholar]
- Hellenius ML, Dahlof C, Aberg H, Krakau I, de FU. Quality of life is not negatively affected by diet and exercise intervention in healthy men with cardiovascular risk factors. Quality of Life Research 1995;4(1):13-20. [DOI] [PubMed] [Google Scholar]
- Hellenius ML, De Faire U, Berglund B, Hamsten A, Krakau I. Diet and exercise are equally effective in reducing risk for cardiovascular disease. Results of a randomized controlled study in men with slightly to moderately raised cardiovascular risk factors. Atherosclerosis 1993;103(1):81-91. [DOI] [PubMed] [Google Scholar]
- Hellenius ML, Krakau I, De FU. Favourable long-term effects from advice on diet and exercise given to healthy men with raised cardiovascular risks. Nutrition, Metabolism & Cardiovascular Diseases 1997;7:293-300. [Google Scholar]
- Hellenius ML. Prevention of Cardiovascular Disease: Studies on the Role of Diet and Exercise in the Prevention of Cardiovascular Disease among Middle-Aged Men [PhD Thesis]. Huddinge, Sweden: Karolinska Institute, 1995. [Google Scholar]
- Naslund GK, Fredrikson M, Hellenius ML, De FU. Effect of diet and physical exercise intervention programmes on coronary heart disease risk in smoking and non-smoking men in Sweden. Journal of Epidemiology and Community Health 1996;50(2):131-6. [DOI] [PMC free article] [PubMed] [Google Scholar]
Hildreth 1951 {published data only}
- Hildreth EA, Mellinkoff SM, Blair GW, Hildreth DM. The effect of vegetable fat ingestion on human serum cholesterol concentration. Circulation 1951;3:641. [DOI] [PubMed] [Google Scholar]
HIPERCOL 2018 {published data only}
- RBR-3ys6h4. Effects of HIPERCOL program on patients with heterozygous familial hypercholesterolemia quality of life [Effect of a nutritional education program on patients with genetic high cholesterol quality of life]. www.ensaiosclinicos.gov.br/rg/RBR-3ys6h4/ (received 9 April 2018).
Hutchison 1983 {published data only}
- Hutchison K, Oberle K, Crockford P, Grace M, Whyte L, Gee M, et al. Effects of dietary manipulation on vascular status of patients with peripheral vascular disease. JAMA 1983;249(24):3330. [DOI] [PubMed] [Google Scholar]
Hyman 1998 {published and unpublished data}
- Hyman DJ, Ho KSI, Dunn K, Simons-Morton D. Dietary intervention for cholesterol reduction in public clinic patients. American Journal of Preventive Medicine 1998;15:139-45. [DOI] [PubMed] [Google Scholar]
IMPACT 1995A {published data only}
- Fielding JE, Mason T, Knight K, Klesges R, Pelletier KR. A randomized trial of the IMPACT worksite cholesterol reduction program. American Journal Of Preventive Medicine 1995;11:120-3. [PubMed] [Google Scholar]
Iso 1991 {published data only}
- Iso H, Konishi M, Terao A, Kiyama M, Tanigaki M, Baba M, et al. A community-based education program for serum cholesterol reduction in urban hypercholesterolemic persons - comparison of intensive and usual education groups. Nippon Koshu Eisei Zasshi 1991;38(9):751-61. [PubMed] [Google Scholar]
Ives 1993 {published data only}
- Ives DG, Kuller LH, Traven ND. Use and outcomes of a cholesterol-lowering intervention for rural elderly subjects. American Journal of Preventive Medicine 1993;9(5):274-81. [PubMed] [Google Scholar]
Jalkanen 1991 {published data only}
- Jalkanen L. The effect of a weight reduction program on cardiovascular risk factors among overweight hypertensives in primary health care. Scandinavian Journal of Social Medicine 1991;19(1):66-71. [DOI] [PubMed] [Google Scholar]
Janus 2012 {published data only}
- Janus ED, Best JD, Davis-Lameloise N, Philpot B, Hernan A, Bennett CM, et al. Scaling-up from an implementation trial to state-wide coverage: results from the preliminary Melbourne Diabetes Prevention Study. Trials 2012;13:152. [DOI] [PMC free article] [PubMed] [Google Scholar]
Jonasson 2014 {published data only}
- Jonasson L, Guldbrand H, Lundberg AK, Nystrom FH. Advice to follow a low-carbohydrate diet has a favourable impact on low-grade inflammation in type 2 diabetes compared with advice to follow a low-fat diet. Annals of Medicine 2014;46:182-7. [DOI] [PMC free article] [PubMed] [Google Scholar]
Juanola‐Falgarona 2014 {published data only}
- Juanola-Falgarona M, Salas-Salvado J, Ibarrola-Jurado N, Rabassa-Soler A, Bullo M. Effect of dietary glycemic index and glycemic load on body weight and cardiovascular risk factors: the GLYNDIET Study. In: Obesity Facts. 20th European Congress on Obesity, ECO 2013; Liverpool, United Kingdom. Vol. 6. 2013:111.
- Juanola-Falgarona M, Salas-Salvado J, Ibarrola-Jurado N, Rabassa-Soler A, Diaz-Lopez A, Guasch-Ferré M, et al. Effect of the glycemic index of the diet on weight loss, modulation of satiety, inflammation, and other metabolic risk factors: a randomized controlled trial. American Journal of Clinical Nutrition 2014;100:27-35. [DOI] [PubMed] [Google Scholar]
Jula 1990 {published data only}
- Jula A, Ronnemaa T, Rastas M, Karvetti RL, Maki J. Long-term nopharmacological treatment for mild to moderate hypertension. Journal of Internal Medicine 1990;227(6):413-21. [DOI] [PubMed] [Google Scholar]
Karvetti 1992 {published data only}
- Karvetti RL, Hakala P. A seven-year follow-up of a weight reduction programme in Finnish primary health care. European Journal of Clinical Nutrition 1992;46:743-52. [PubMed] [Google Scholar]
Kastarinen 2002 {published data only}
- Kastarinen MJ, Puska PM, Korhonen MH, Mustonen JN, Salomaa VV, Sundvall JE, et al. Non-pharmacological treatment of hypertension in primary health care: a 2-year open randomized controlled trial of lifestyle intervention against hypertension in eastern Finland. Journal of Hypertension 2002;20(12):2505-12. [DOI] [PubMed] [Google Scholar]
Kattelmann 2010 {published data only}
- Kattelmann KK, Conti K, Ren C, Kattelmann KK, Conti K, Ren C. The Medicine Wheel nutrition intervention: a diabetes education study with the Cheyenne River Sioux Tribe. Journal of the American Dietetic Association 2010;110:S44-51. [DOI] [PubMed] [Google Scholar]
Katzel 1995 {published data only}
- Katzel LI, Bleecker ER, Colman EG, Rogus EM, Sorkin JD, Goldberg AP. Effects of weight loss vs aerobic exercise training on risk factors for coronary disease in healthy, obese, middle-aged and older men. A randomized controlled trial. JAMA 1995;274(24):1915-21. [DOI] [PubMed] [Google Scholar]
Kempner 1948 {published data only}
- Kempner W. Treatment of hypertensive vascular disease with rice diet. American Journal of Medicine 1948;4:545-77. [DOI] [PubMed] [Google Scholar]
Klemsdal 2010 {published data only}
- Klemsdal TO, Holme I, Nerland H, Pedersen TR, Tonstad S, Klemsdal TO, et al. Effects of a low glycemic load diet versus a low-fat diet in subjects with and without the metabolic syndrome. Nutrition Metabolism & Cardiovascular Diseases 2010;20:195-201. [DOI] [PubMed] [Google Scholar]
Korhonen 2003 {published data only}
- Korhonen M, Kastarinen M, Uusitupa M, Puska P, Nissinen A. The effect of intensified diet counseling on the diet of hypertensive subjects in primary health care: a 2-year open randomized controlled trial of lifestyle intervention against hypertension in eastern Finland. Preventive Medicine 2003;36(1):8-16. [DOI] [PubMed] [Google Scholar]
Kristal 1997 {published data only}
- Kristal AR, Shattuck AL, Bowen DJ, Sponzo RW, Nixon DW. Feasibility of using volunteer research staff to deliver and evaluate a low-fat dietary intervention: the American Cancer Society Breast Cancer Dietary Intervention Project. Cancer Epidemiology, Biomarkers and Prevention 1997;6(6):459-67. [PubMed] [Google Scholar]
Kromhout 1987 {published data only}
- Kromhout D, Arntzenius AC, Kempen-Voogd N, Kempen HJ, Barth JD, Van der Voort HA, et al. Long-term effects of linoleic-acid enriched diet, changes in body weight and alcohol consumption on serum total and HDL cholesterol. Atherosclerosis 1987;66:99-105. [DOI] [PubMed] [Google Scholar]
Kummel 2008 {published data only}
- Kummel MV. Effects of an intervention on health behaviors of older coronary artery bypass (CAB) patients. Archives of Gerontology and Geriatrics 2008;2(2):227-44. [DOI] [PubMed] [Google Scholar]
Laitinen 1993 {published data only}
- Laitinen JH, Ahola IE, Sarkkinen ES, Winberg RL, Harmaakorpi IP, Uusitupa MI. Impact of intensified dietary therapy on energy and nutrient intakes and fatty acid composition of serum lipids in patients with recently diagnosed non-insulin-dependent diabetes mellitus. Journal of the American Dietetic Association 1993;93(3):276-83. [DOI] [PubMed] [Google Scholar]
Laitinen 1994 {published data only}
- Laitinen J, Uusitupa M, Ahola I, Siitonen O. Metabolic and dietary determinants of serum lipids in obese patients with recently diagnosed non-insulin-dependent diabetes. Annals of Medicine 1994;26(2):119-24. [DOI] [PubMed] [Google Scholar]
Larsen 2011 {published data only}
- Larsen RN, Mann NJ, Maclean E, Shaw JE, Larsen RN, Mann NJ, et al. The effect of high-protein, low-carbohydrate diets in the treatment of type 2 diabetes: a 12 month randomised controlled trial. Diabetologia 2011;54:731-40. [DOI] [PubMed] [Google Scholar]
Leduc 1994 {published data only}
- Leduc CP, Cherniak D, Faucher J. Effectiveness of a group dietary intervention on hypercholesterolaemia: a randomised controlled clinical trial (poster abstract). Atherosclerosis 1994;109(1-2):149. [Google Scholar]
Leibbrandt 2010 {published data only}
- Leibbrandt AJ, Kiefte-de Jong JC, Hogenelst MHE, Snoek FJ, Weijs PJM. Effects of the PRo-active Interdisciplinary Self-MAnagement (PRISMA, Dutch DESMOND) program on dietary intake in type 2 diabetes outpatients: a pilot study. Clinical Nutrition 2010;29:199-205. [DOI] [PubMed] [Google Scholar]
Lewis 1985 {published data only}
- Lewis B. Randomised controlled trial of the treatment of hyperlipidaemia on progression of atherosclerosis. Acta Medica Scandinavica 1985;701(Suppl):53-7. [DOI] [PubMed] [Google Scholar]
LIILAC 2015 {published data only}
- Hardman RJ, Kennedy G, Macpherson H, Scholey AB, Pipingas A. A randomised controlled trial investigating the effects of Mediterranean diet and aerobic exercise on cognition in cognitively healthy older people living independently within aged care facilities: the Lifestyle Intervention in independent Living Aged Care (LIILAC) study protocol. Nutrition Journal 2015;14:53. [DOI] [PMC free article] [PubMed] [Google Scholar]
Lipid Res Clinic 1984 {published data only}
- Anon. The Lipid Research Clinics Coronary Primary Prevention trial results. I. Reduction in incidence of coronary heart disease. JAMA 1984;251(3):351-64. [DOI] [PubMed] [Google Scholar]
- Anon. The Lipid Research Clinics Coronary Primary Prevention trial results. II. The relationship of reduction in incidence of coronary heart disease to cholesterol lowering. JAMA 1984;251(3):365-74. [PubMed] [Google Scholar]
- Gordon DJ, Salz KM, Roggenkamp KJ. Dietary determinants of plasma cholesterol change in the recruitment phase of the Lipid Research Clinics Coronary Primary Prevention trial. Arteriosclerosis 1982;2(6):537-48. [DOI] [PubMed] [Google Scholar]
Luoto 2012 {published data only}
- Luoto R, Laitinen K, Nermes M, Isolauri E, Luoto R, Laitinen K, et al. Impact of maternal probiotic-supplemented dietary counseling during pregnancy on colostrum adiponectin concentration: a prospective, randomized, placebo-controlled study. Early Human Development 2012;88:339-44. [DOI] [PubMed] [Google Scholar]
Luszczynska 2007 {published data only}
- Luszczynska A, Scholz U, Sutton S. Planning to change diet: a controlled trial of an implementation intentions training intervention to reduce saturated fat intake among patients after myocardial infarction. Journal of Psychosomatic Research 2007;63(5):491-7. [DOI] [PubMed] [Google Scholar]
Lyon Diet Heart 1994 {published data only}
- De Lorgeril M, Renaud S, Mamelle N, Salen P, Martin JL, Monjaud I, et al. Mediterranean alpha-linolenic acid-rich diet in secondary prevention of coronary heart disease. Lancet 1994;343(8911):1454-9. [DOI] [PubMed] [Google Scholar]
- De Lorgeril M, Salen P, Caillat-Vallet E, Hanauer M-T, Barthelemy JC, Mamelle N. Control of bias in dietary trial to prevent coronary recurrences: the Lyon Diet Heart study. European Journal of Clinical Nutrition 1997;51(2):116-22. [DOI] [PubMed] [Google Scholar]
- De Lorgeril M, Salen P, Martin J-L, Monjaud I, Delaye J, Mamelle N. Mediterranean diet, traditional risk factors, and the rate of cardiovascular complications after myocardial infarction: final report of the Lyon Diet Heart study. Circulation 1999;99:779-85. [DOI] [PubMed] [Google Scholar]
- De Lorgeril M, Salen P, Martin JL, Mamelle N, Monjaud I, Touboul P, et al. Effect of a Mediterranean type of diet on the rate of cardiovascular complications in patients with coronary artery disease. Insights into the cardioprotective effect of certain nutriments. Journal of the American College of Cardiology 1996;28:1103-8. [DOI] [PubMed] [Google Scholar]
- De Lorgeril M, Salen P, Martin JL, Monjaud I, Boucher P, Mamelle N. Mediterranean dietary pattern in a randomised trial. Archives of Internal Medicine 1998;158:1181-7. [DOI] [PubMed] [Google Scholar]
- De Lorgeril M, Salen P. Mediterranean diet in secondary prevention of coronary heart disease. Australian Journal of Nutrition and Dietetics 1998;55(Suppl):s16-s20. [Google Scholar]
- Renaud S, De Lorgeril M, Delaye J, Guidollet J, Jacquard F, Mamelle N, et al. Cretan Mediterranean diet for prevention of coronary heart disease. American Journal of Clinical Nutrition 1995;61(6 Suppl):1360S-7S. [DOI] [PubMed] [Google Scholar]
Mansel 1990 {published data only}
- Mansel RE, Harrison BJ, Melhuish J, Sheridan W, Pye JK, Pritchard G, et al. A randomized trial of dietary intervention with essential fatty acids in patients with categorized cysts. Annals of the New York Academy of Sciences 1990;586(1):288-94. [DOI] [PubMed] [Google Scholar]
MARGARIN {published data only}
- Bemelmans WJE, Broer J, Feskens EJM, Smit AJ, Muskiet FAJ, Lefrandt JD, et al. Effect of an increased intake of alpha-linolenic acid and group nutritional education on cardiovascular risk factors: the Mediterranean Alpha-linolenic Enriched Groningen Dietary Intervention (MARGARIN) study. American Journal of Clinical Nutrition 2002;75:221-7. [DOI] [PubMed] [Google Scholar]
Martin 2011 {published data only}
- Martin CK, Rosenbaum D, Han H, Geiselman PJ, Wyatt HR, Hill JO, et al. Change in food cravings, food preferences, and appetite during a low-carbohydrate and low-fat diet. Obesity 2011;19:1963-70. [DOI] [PMC free article] [PubMed] [Google Scholar]
Maruthur 2014 {published data only}
- Maruthur N, Yau MS, Jablonski KA, Delahanty L, Franks PW, Knowler WC, et al. Genetic variation and response to weight, physical activity, and diet change to prevent diabetes in the diabetes prevention program. Diabetes 2014;63:A415. [Google Scholar]
Mayneris‐Perxachs 2014 {published data only}
- Mayneris-Perxachs J, Sala-Vila A, Chisaguano M, Castellote AI, Estruch R, Covas MI, et al. Effects of 1-year intervention with a Mediterranean diet on plasma fatty acid composition and metabolic syndrome in a population at high cardiovascular risk. PlOS One 2014;9:e85202. [DOI] [PMC free article] [PubMed] [Google Scholar]
McCarron 2001 {published data only}
- McCarron DA, Reusser ME. Reducing cardiovascular disease risk with diet. Obesity Research 2001;9 Suppl 4:335S-40S. [DOI] [PubMed] [Google Scholar]
McManus 2001 {published and unpublished data}
- McManus K, Antinoro L, Sacks F. Randomized controlled trial of a moderate-fat low-energy diet compared with a low fat, low-energy diet for weight loss in overweight adults. International Journal of Obesity 2001;25:1503-11. [DOI] [PubMed] [Google Scholar]
Medi‐RIVAGE 2004 {published and unpublished data}
- Borel P, Moussa M, Reboul E, Lyan B, Defoort C, Vincent-Baudry S, et al. Human fasting plasma concentrations of vitamin E and carotenoids, and their association with genetic variants in apo C-III, cholesteryl ester transfer protein, hepatic lipase, intestinal fatty acid binding protein and microsomal triacylglycerol transfer protein. British Journal of Nutrition 2009;101(5):680-7. [DOI] [PubMed] [Google Scholar]
- Borel P, Moussa M, Reboul E, Lyan B, Defoort C, Vincent-Baudry S, et al. Human plasma levels of vitamin E and carotenoids are associated with genetic polymorphisms in genes involved in lipid metabolism. Journal of Nutrition 2007;137(12):2653-9. [DOI] [PubMed] [Google Scholar]
- Gastaldi M, Diziere S, Defoort C, Portugal H, Lairon D, Darmon M, et al. Sex-specific association of fatty acid binding protein 2 and microsomal triacylglycerol transfer protein variants with response to dietary lipid changes in the 3-mo Medi-RIVAGE primary intervention study. American Journal of Clinical Nutrition 2007;86(6):1633-41. [DOI] [PubMed] [Google Scholar]
- Vincent S, Gerber M, Bernard MC, Defoort C, Loundou A, Portugal H, et al. The Medi-RIVAGE study (Mediterranean Diet, Cardiovascular Risks and Gene Polymorphisms): rationale, recruitment, design, dietary intervention and baseline characteristics of participants. Public Health Nutrition 2004;7(4):531-42. [DOI] [PubMed] [Google Scholar]
- Vincent-Baudry S, Defoort C, Gerber M, Bernard MC, Verger P, Helal O, et al. The Medi-RIVAGE study: reduction of cardiovascular disease risk factors after a 3-mo intervention with a Mediterranean-type diet or a low-fat diet. American Journal of Clinical Nutrition 2005;82(5):964-71. [DOI] [PubMed] [Google Scholar]
Merrill 2011 {published data only}
- Merrill RM, Aldana SG, Garrett J, Ross C, et al. Effectiveness of a workplace wellness program for maintaining health and promoting healthy behaviors. Journal of Occupational & Environmental Medicine 2011;53:782-7. [DOI] [PubMed] [Google Scholar]
Michalsen 2006 {published and unpublished data}
- Michalsen A, Lehmann N, Pithan C, Knoblauch NT, Moebus S, Kannenberg F, et al. Mediterranean diet has no effect on markers of inflammation and metabolic risk factors in patients with coronary artery disease. European Journal of Clinical Nutrition 2006;60(4):478-85. [DOI] [PubMed] [Google Scholar]
Millar 1973 {published data only}
- Millar JH, Zilkha KJ, Langman MJS, Payling-Wright H, Smith AD, Belin J, et al. Double-blind trial of linoleate supplementation of the diet in multiple sclerosis. BMJ 1973;i:765-8. [DOI] [PMC free article] [PubMed] [Google Scholar]
Milne 1994 {published data only}
- Milne RM, Mann JI, Chisholm AW, Williams SM. Long-term comparison of three dietary prescriptions in the treatment of NIDDM. Diabetes Care 1994;17(1):74-80. [DOI] [PubMed] [Google Scholar]
Minnesota HHP 1990 {published data only}
- Murray DM, Kurth C, Mullis R, Jeffery RW. Cholesterol reduction through low-intensity interventions: results from the Minnesota Heart Health Program. Preventive Medicine 1990;19(2):181-9. [DOI] [PubMed] [Google Scholar]
MUFObes low fat 2007 {published and unpublished data}
- Due A, Larsen TM, Hermansen K, Stender S, Holst JJ, Toubro S, et al. Comparison of the effects on insulin resistance and glucose tolerance of 6-mo high-monounsaturated-fat, low-fat, and control diets. American Journal of Clinical Nutrition 2008;87(4):855-62. [DOI] [PubMed] [Google Scholar]
- Due A, Larsen TM, Mu H, Hermansen K, Stender S, Astrup A. Comparison of 3 ad libitum diets for weight-loss maintenance, risk of cardiovascular disease, and diabetes: a 6-mo randomized, controlled trial. American Journal of Clinical Nutrition 2008;88(5):1232-41. [DOI] [PubMed] [Google Scholar]
- Rasmussen LG, Larsen TM, Mortensen PK, Due A, Astrup A, Rasmussen Lone G, et al. Effect on 24-h energy expenditure of a moderate-fat diet high in monounsaturated fatty acids compared with that of a low-fat, carbohydrate-rich diet: a 6-mo controlled dietary intervention trial. American Journal of Clinical Nutrition 2007;85(4):1014-22. [DOI] [PubMed] [Google Scholar]
- Sloth B, Due A, Larsen TM, Holst JJ, Heding A, Astrup A, et al. The effect of a high-MUFA, low-glycaemic index diet and a low-fat diet on appetite and glucose metabolism during a 6-month weight maintenance period. British Journal of Nutrition 2009;101(12):1846-58. [DOI] [PubMed] [Google Scholar]
MUFObes low vs mod 2007 {published and unpublished data}
- Due A, Larsen TM, Hermansen K, Stender S, Holst JJ, Toubro S, et al. Comparison of the effects on insulin resistance and glucose tolerance of 6-mo high-monounsaturated-fat, low-fat, and control diets. American Journal of Clinical Nutrition 2008;87(4):855-62. [DOI] [PubMed] [Google Scholar]
- Due A, Larsen TM, Mu H, Hermansen K, Stender S, Astrup A, et al. Comparison of 3 ad libitum diets for weight-loss maintenance, risk of cardiovascular disease, and diabetes: a 6-mo randomized, controlled trial. American Journal of Clinical Nutrition 2008;88(5):1232-41. [DOI] [PubMed] [Google Scholar]
- Rasmussen LG, Larsen TM, Mortensen PK, Due A, Astrup A, Rasmussen Lone G, et al. Effect on 24-h energy expenditure of a moderate-fat diet high in monounsaturated fatty acids compared with that of a low-fat, carbohydrate-rich diet: a 6-mo controlled dietary intervention trial. American Journal of Clinical Nutrition 2007;85(4):1014-22. [DOI] [PubMed] [Google Scholar]
- Sloth B, Due A, Larsen TM, Holst JJ, Heding A, Astrup A, et al. The effect of a high-MUFA, low-glycaemic index diet and a low-fat diet on appetite and glucose metabolism during a 6-month weight maintenance period. British Journal of Nutrition 2009;101(12):1846-58. [DOI] [PubMed] [Google Scholar]
Mujeres Felices 2003 {published data only}
- Fitzgibbon ML, Gapstur SM, Knight SJ. Mujeres felices por ser saludables: a breast cancer risk reduction program for Latino women. Preventive Medicine 2003;36(5):536-46. [DOI] [PubMed] [Google Scholar]
- Fitzgibbon ML, Gapstur SM, Knight SJ. Results of Mujeres Felices por ser Saludables: a dietary/breast health randomized clinical trial for Latino women. Annals of Behavioral Medicine 2004;28(2):95-104. [DOI] [PubMed] [Google Scholar]
Munsters 2010 {published data only}
- Munsters MJ, Saris WH. The effect of sugar-sweetened beverage intake on energy intake in an ad libitum 6-month low-fat high-carbohydrate diet. Annals of Nutrition & Metabolism 2010;57:116-23. [DOI] [PubMed] [Google Scholar]
Murillo‐Ortiz 2017 {published data only}
- Murillo-Ortiz B, Martinez-Garza S, Cardenas Landeros V, Cano Velazquez G, Suarez Garcia D. Effect of reduced dietary fat on estradiol, adiponectin, and IGF-1 levels in postmenopausal women with breast cancer. Breast Cancer 2017;9:359-64. [DOI] [PMC free article] [PubMed] [Google Scholar]
Naglak 2000 {published data only (unpublished sought but not used)}
- Naglak MC, Mitchell DC, Shannon BM, Pearson TA, Harkness WL, Kris-Etherton PM. Nutrient adequacy of diets of adults with hypercholesterolemia after a cholesterol-lowering intervention: long term assessment. Journal of the American Dietetic Association 2000;100(11):1385-91. [DOI] [PubMed] [Google Scholar]
NCT02353416 {published data only}
- NCT02353416. Effect of low-glycemic index mediterranean diet on AGEs (Nutri_AGEs). clinicaltrials.gov/ct2/show/NCT02353416 (received 22 Feb 2015).
NCT02368405 {published data only}
- NCT02368405. Nutrition education for cardiovascular disease prevention in spinal cord injury. clinicaltrials.gov/ct2/show/NCT02368405 (received 23 Feb 2015).
NCT02396264 {published data only}
- NCT02396264. Mediterranean diet as treatment for normal weight women with PCOS. clinicaltrials.gov/ct2/show/NCT02396264 (received 24 March 2015).
Neil 1995 {published data only}
- Neil HA, Roe L, Godlee RJ, Moore JW, Clark GM, Brown J, et al. Randomised trial of lipid lowering dietary advice in general practice: the effects on serum lipids, lipoproteins, and antioxidants. BMJ 1995;310(6979):569-73. [DOI] [PMC free article] [PubMed] [Google Scholar]
Neverov 1997 {published data only}
- Neverov NI, Kaysen GA, Tareyeva IE. Effect of lipid-lowering therapy on the progression of renal disease in nondiabetic nephrotic patients. Contributions to Nephrology 1997;120:68-78. [DOI] [PubMed] [Google Scholar]
Next Step 1995 {published and unpublished data}
- Tilley BC, Vernon SW, Glanz K, Myers R, Sanders K, Lu M, et al. Worksite cancer screening and nutrition intervention for high-risk auto workers: design and baseline findings of the Next Step Trial. Preventive Medicine 1997;26(2):227-35. [DOI] [PubMed] [Google Scholar]
- Tilley BC, Vernon SW, Myers R, Glanz K, Lu M, Sanders K, et al. Planning the next step. A screening promotion and nutrition intervention trial in the work site. Annals of the New York Academy of Sciences 1995;768(1):296-9. [DOI] [PubMed] [Google Scholar]
Norway Veg Oil 1968 {published data only}
- Natvig H, Borchgrevink CF, Dedichen J, Owren PA, Schiotz EH, Westlund K. A controlled trial of the effect of linolenic acid on incidence of coronary heart disease: the Norwegian Vegetable Oil Experiment of 1965-66. Scandinavian Journal of Clinical and Laboratory Investigation 1968;105(Suppl):1-20. [PubMed] [Google Scholar]
Novotny 2012 {published data only}
- Novotny R, Chen C, Williams AE, Albright CL, Nigg CR, Oshiro CE, et al. US acculturation is associated with health behaviors and obesity, but not their change, with a hotel-based intervention among Asian-Pacific Islanders. Journal of the Academy of Nutrition & Dietetics 2012;112:649-56. [DOI] [PMC free article] [PubMed] [Google Scholar]
Nutri‐EPA 2017 {published data only}
- Misciagna G, Del Pilar DM, Caramia DV, Bonfiglio C, Franco I, Noviello MR, et al. Effect of a low glycemic index Mediterranean diet on non-alcoholic fatty liver disease. A randomized controlled clinical trial. Journal of Nutrition, Health and Aging 2017;21(4):404-12. [DOI: 10.1007/s12603-016-0809-8] [DOI] [PubMed] [Google Scholar]
Nutrition Ed Study 1980 {published data only (unpublished sought but not used)}
- Mojonnier ML, Hall Y, Berkson DM, Robinson E, Wethers B, Pannbacker B, et al. Experience in changing food habits of hyperlipidaemic men and women. Journal of the American Dietetic Association 1980;77:140-8. [PubMed] [Google Scholar]
ODES 2006 {published data only}
- Anderssen S, Holme I, Urdal P, Hjermann I. Diet and exercise intervention have favourable effects on blood pressure in mild hypertensives: the Oslo Diet and Exercise Study (ODES). Blood Pressure 1995;4(6):343-9. [DOI] [PubMed] [Google Scholar]
- Anderssen SA, Hjermann I, Urdal P, Torjesen PA, Holme I. Improved carbohydrate metabolism after physical training and dietary intervention in individuals with the "atherothrombogenic syndrome'. Oslo Diet and Exercise Study (ODES). A randomized trial. Journal of Internal Medicine 1996;240(4):203-9. [DOI] [PubMed] [Google Scholar]
- Holme I, Haaheim LL, Tonstad S, Hjermann I, Holme I, Haaheim LL, et al. Effect of dietary and antismoking advice on the incidence of myocardial infarction: a 16-year follow-up of the Oslo Diet and Antismoking Study after its close. Nutrition Metabolism & Cardiovascular Diseases 2006;16(5):330-8. [DOI] [PubMed] [Google Scholar]
- Rokling-Andersen MH, Reseland JE, Veierod MB, Anderssen SA, Jacobs DR Jr, Urdal P, et al. Effects of long-term exercise and diet intervention on plasma adipokine concentrations. American Journal of Clinical Nutrition 2007;86(5):1293-301. [DOI] [PubMed] [Google Scholar]
- The ODES Investigators. The Oslo Diet and Exercise Study (ODES): design and objectives. Controlled Clinical Trials 1993;14(3):229-43. [DOI] [PubMed] [Google Scholar]
- Torjesen PA, Birkeland KI, Anderssen SA, Hjermann I, Holme I, Urdal P. Lifestyle changes may reverse development of the insulin resistance syndrome. The Oslo Diet and Exercise Study: a randomized trial. Diabetes Care 1997;20(1):26-31. [DOI] [PubMed] [Google Scholar]
Oldroyd 2001 {published data only}
- Oldroyd JC, Unwin NC, White M, Mathers JC, Alberti KG, et al. Randomised controlled trial evaluating lifestyle interventions in people with impaired glucose tolerance. Diabetes Research & Clinical Practice 2006;72(2):117-27. [DOI] [PubMed] [Google Scholar]
- Oldroyd JCU. Randomised controlled trial evaluating the effectiveness of behavioural interventions to modify cardiovascular risk factors in men and women with impaired glucose tolerance: outcomes at 6 months. Diabetes Research and Clinical Practice 2001;?(1):29-43. [DOI] [PubMed] [Google Scholar]
Orazio 2011 {published data only}
- Orazio LK, Isbel NM, Armstrong KA, Tarnarskyj J, Johnson DW, Hale RE, et al. Evaluation of dietetic advice for modification of cardiovascular disease risk factors in renal transplant recipients. Journal of Renal Nutrition 2011;21:462-71. [DOI] [PubMed] [Google Scholar]
ORIGIN 2008 {published data only}
- Origin Trial Investigators. Rationale, design, and baseline characteristics for a large international trial of cardiovascular disease prevention in people with dysglycemia: the ORIGIN Trial (Outcome Reduction with an Initial Glargine Intervention). American Heart Journal 2008;155(1):26.e1-26.e13. [DOI] [PubMed] [Google Scholar]
Ornish 1990 {published data only}
- Ornish D, Brown SE, Scherwitz LW, Billings JH, Armstrong WT, Ports TA, et al. Can lifestyle changes reverse coronary heart disease? The Lifestyle Heart trial. Lancet 1990;336:129-33. [DOI] [PubMed] [Google Scholar]
Oslo Study 1980 {published data only}
- Hjerkinn EM, Sandvik L, Hjermann I, Arnesen H. Effect of diet intervention on long-term mortality in healthy middle-aged men with combined hyperlipidaemia. Journal of Internal Medicine 2004;255(1):68-73. [DOI] [PubMed] [Google Scholar]
- Hjermann I, Leren P, Norman N, Helgeland A, Holme I. Serum insulin response to oral glucose load during a dietary intervention trial in healthy coronary high risk men: the Oslo study. Scandinavian Journal of Clinical and Laboratory Investigation 1980;40(1):89-94. [DOI] [PubMed] [Google Scholar]
- Hjermann I, Velve BK, Holme I, Leren P. Effect of diet and smoking intervention on the incidence of coronary heart disease. Report from the Oslo Study Group of a randomised trial in healthy men. Lancet 1981;2(8259):1303-10. [DOI] [PubMed] [Google Scholar]
- Hjermann I. Intervention of smoking and eating habits in healthy men carrying high risk for coronary heart disease. The Oslo Study. Acta Medica Scandinavica 1981;651(Suppl):281-4. [DOI] [PubMed] [Google Scholar]
- Hjermann I. Smoking and diet intervention in healthy coronary high risk men. Methods and 5-year follow-up of risk factors in a randomized trial. The Oslo study. Journal of the Oslo City Hospitals 1980;30(1):3-17. [PubMed] [Google Scholar]
Otago Weight Loss 2005 {published and unpublished data}
- McAuley KA, Hopkins CM, Smith KJ, McLay RT, Williams SM, Taylor RW, et al. Comparison of a high-fat and high-protein diets with a high-carbohydrate diet in insulin-resistant obese women. Diabetologia 2005;48:8-16. [DOI] [PubMed] [Google Scholar]
- McAuley KA, Smith KJ, Taylor RW, McLay RT, Williams SM, Mann JI. Long-term effects of popular dietary approaches on weight loss and features of insulin resistance. International Journal of Obesity 2006;30:342-9. [DOI] [PubMed] [Google Scholar]
Pascale 1995 {published data only}
- Pascale RW, Wing RR, Butler BA, Mullen M, Bononi P. Effects of a behavioral weight loss program stressing calorie restriction versus calorie plus fat restriction in obese individuals with NIDDM or a family history of diabetes. Diabetes Care 1995;18(9):1241-8. [DOI] [PubMed] [Google Scholar]
Paz‐Tal 2013 {published data only}
- Paz-Tal O, Canfi A, Marko R, Katorza E, Karpas Z, Schwarzfuchs D, et al. Dynamics of magnesium, copper, selenium and zinc serum concentrations for 2-year dietary intervention. Clinical Nutrition ESPEN Journal 2013;8:e100-7. [DOI] [PubMed] [Google Scholar]
PEP 2001 {published data only}
- Ohrig E, Geib HC, Haas G-M, Schwandt P. The Prevention Education Program (PEP) Nuremberg: design and baseline data of a family oriented intervention study. International Journal of Obesity 2001;25(Suppl 1):S89-92. [DOI] [PubMed] [Google Scholar]
PHYLLIS 1993 {published data only}
- Anon. Plaque HYpertension Lipid-Lowering Italian Study (PHYLLIS): a protocol for non-invasive evaluation of carotid atherosclerosis in hypercholesterolaemic hypertensive subjects. Journal of Hypertension 1993;11(Suppl 5):S314-5. [PubMed] [Google Scholar]
- Bond GM, Crepaldi G, Zanchetti A, Avogaro P, Marubini E, Maseri A, et al. Plaque hypertension lipid-lowering Italian study (PHYLLIS): a protocol for non-invasive evaluation of carotid atherosclerosis in hypercholesterolaemic hypertensive subjects. Journal of Hypertension 1993;11(Suppl 5):S314-5. [PubMed] [Google Scholar]
Portfolio 5 {published data only}
- Jenkins DJ, Jones PJ, Frohlich J, Lamarche B, Ireland C, Nishi SK, et al. The effect of a dietary portfolio compared to a DASH-type diet on blood pressure. Nutrition, Metabolism, and Cardiovascular Diseases 2015;25(12):1132-9. [DOI] [PubMed] [Google Scholar]
- Jenkins DJA, Jones PJH, Lamarche B, Kendall CWC, Faulkner D, Cermakova L, et al. Effect of a dietary portfolio of cholesterol-lowering foods given at 2 levels of intensity of dietary advice on serum lipids in hyperlipidemia: a randomized controlled trial. JAMA 2011;306(8):831-9. [DOI] [PubMed] [Google Scholar]
- Ramprasath VR, Jenkins DJA, Lamarche B, Kendall CWC, Faulkner D, Cermakova L, et al. Consumption of a dietary portfolio of cholesterol lowering foods improves blood lipids without affecting concentrations of fat soluble compounds. Nutrition Journal 2014;13(1):101. [DOI] [PMC free article] [PubMed] [Google Scholar]
PREDIMED 2006 {published data only (unpublished sought but not used)}
- Buil-Cosiales P, Irimia P, Ros E, Riverol M, Gilabert R, Martinez-Vila E, et al. Dietary fibre intake is inversely associated with carotid intima-media thickness: a cross-sectional assessment in the PREDIMED study. European Journal of Clinical Nutrition 2009;63(10):1213-9. [DOI] [PubMed] [Google Scholar]
- Estruch R, Martinez-Gonzalez MA, Corella D, Salas-Salvado J, Ruiz-Gutierrez V, Covas MI, et al. Effects of a Mediterranean-style diet on cardiovascular risk factors: a randomized trial. Annals of Internal Medicine 2006;145(1):1-11. [DOI] [PubMed] [Google Scholar]
- Estruch R, Ros E, Salas-Salvado J, Covas M-I, Corella D, Aros F et al. Retraction & Republication: Primary Prevention of Cardiovascular Disease with a Mediterranean Diet Supplemented with Extra-Virgin Olive Oil or Nuts. New England Journal of Medicine 2018;378:e34. [DOI: 10.1056/NEJMoa1800389] [DOI] [PubMed] [Google Scholar]
- Razquin C, Martinez JA, Martinez-Gonzalez MA, Mitjavila MT, Estruch R, Marti A, et al. A 3 years follow-up of a Mediterranean diet rich in virgin olive oil is associated with high plasma antioxidant capacity and reduced body weight gain. European Journal of Clinical Nutrition 2009;63(12):1387-93. [DOI] [PubMed] [Google Scholar]
- Salas-Salvado J, Fernandez-Ballart J, Ros E, Martinez-Gonzalez MA, Fito M, Estruch R, et al. Effect of a Mediterranean diet supplemented with nuts on metabolic syndrome status: one-year results of the PREDIMED randomized trial. Archives of Internal Medicine 2008;168(22):2449-58. [DOI] [PubMed] [Google Scholar]
- Salas-Salvado J, Garcia-Arellano A, Estruch R, Marquez-Sandoval F, Corella D, Fiol M, et al. Components of the Mediterranean-type food pattern and serum inflammatory markers among patients at high risk for cardiovascular disease. European Journal of Clinical Nutrition 2008;62(5):651-9. [DOI] [PubMed] [Google Scholar]
- Sanchez-Tainta A, Estruch R, Bullo M, Corella D, Gomez-Gracia E, Fiol M, et al. Adherence to a Mediterranean-type diet and reduced prevalence of clustered cardiovascular risk factors in a cohort of 3,204 high-risk patients. European Journal of Cardiovascular Prevention & Rehabilitation 2008;15(5):589-93. [DOI] [PubMed] [Google Scholar]
- Schroder H, De la Torre R, Estruch R, Corella D, Martinez-Gonzalez MA, Salas-Salvado J, et al. Alcohol consumption is associated with high concentrations of urinary hydroxytyrosol. American Journal of Clinical Nutrition 2009;90(5):1329-35. [DOI] [PubMed] [Google Scholar]
- Toledo E, Delgado-Rodriguez M, Estruch R, Salas-Salvado J, Corella D, Gomez-Gracia E, et al. Low-fat dairy products and blood pressure: follow-up of 2290 older persons at high cardiovascular risk participating in the PREDIMED study. British Journal of Nutrition 2009;101(1):59-67. [DOI] [PubMed] [Google Scholar]
- Waterhouse AL. Resveratrol metabolites in urine as biomarker of wine intake in free-living subjects: the PREDIMED Study. Free Radical Biology & Medicine 2009;46(12):1561. [DOI] [PubMed] [Google Scholar]
- Zamora-Ros R, Urpi-Sarda M, Lamuela-Raventos RM, Estruch R, Martinez-Gonzalez MA, Bullo M, et al. Resveratrol metabolites in urine as a biomarker of wine intake in free-living subjects: the PREDIMED Study. Free Radical Biology & Medicine 2009;46(12):1562-6. [DOI] [PubMed] [Google Scholar]
- Zazpe I, Estruch R, Toledo E, Sanchez-Tainta A, Corella D, Bullo M, et al. Predictors of adherence to a Mediterranean-type diet in the PREDIMED trial. European Journal of Nutrition 2010;49(2):91-9. [DOI] [PubMed] [Google Scholar]
- Zazpe I, Sanchez-Tainta A, Estruch R, Lamuela-Raventos RM, Schroder H, Salas-Salvado J, et al. A large randomized individual and group intervention conducted by registered dietitians increased adherence to Mediterranean-type diets: the PREDIMED study. Journal of the American Dietetic Association 2008;108(7):1134-44. [DOI] [PubMed] [Google Scholar]
PREMIER 2003 {published and unpublished data}
- Appel LJ, Champagne CM, Harsha DW, Cooper LS, Obarzanek E, Elmer PJ, et al. Effects of comprehensive lifestyle modification on blood pressure control: main results of the PREMIER clinical trial. JAMA 2003;289(16):2083-93. [DOI] [PubMed] [Google Scholar]
- Elmer PJ, Obarzanek E, Vollmer WM, Simons-Morton D, Stevens VJ, Young DR, et al. Effects of comprehensive lifestyle modification on diet, weight, physical fitness, and blood pressure control: 18-month results of a randomized trial. Annals of Internal Medicine 2006;144(7):485-95. [DOI] [PubMed] [Google Scholar]
- Ledikwe JH, Rolls BJ, Smiciklas-Wright H, Mitchell DC, Ard JD, Champagne C, et al. Reductions in dietary energy density are associated with weight loss in overweight and obese participants in the PREMIER trial. American Journal of Clinical Nutrition 2007;85(5):1212-21. [DOI] [PubMed] [Google Scholar]
- Lien LF, Brown AJ, Ard JD, Loria C, Erlinger TP, Feldstein AC, et al. Effects of PREMIER lifestyle modifications on participants with and without the metabolic syndrome. Hypertension 2007;50(4):609-16. [DOI] [PubMed] [Google Scholar]
- Lin PH, Appel LJ, Funk K, Craddick S, Chen C, Elmer P, et al. The PREMIER intervention helps participants follow the Dietary Approaches to Stop Hypertension dietary pattern and the current Dietary Reference Intakes recommendations. Journal of the American Dietetic Association 2007;107(9):1541-51. [DOI] [PubMed] [Google Scholar]
- Lin PH, Wang Y, Grambow SC, Goggins W, Almirall D. Dietary saturated fat intake is negatively associated with weight maintenance among the PREMIER participants. Obesity 2012;20:571-5. [DOI] [PubMed] [Google Scholar]
- Lin PH, Yancy WS Jr, Pollak KI, Dolor RJ, Marcello J, Samsa GP, et al. The influence of a physician and patient intervention program on dietary intake. Journal of the Academy of Nutrition & Dietetics 2013;113:1465-75. [DOI] [PMC free article] [PubMed] [Google Scholar]
- Maruthur NM, Wang NY, Appel LJ. Lifestyle interventions reduce coronary heart disease risk: results from the PREMIER Trial. Circulation 2009;119(15):2026-31. [DOI] [PMC free article] [PubMed] [Google Scholar]
- McGuire HL, Svetkey LP, Harsha DW, Elmer PJ, Elmer PJ, Appel LJ, et al. Comprehensive lifestyle modification and blood pressure control: a review of the PREMIER trial. Journal of Clinical Hypertension 2004;6(7):383-90. [DOI] [PMC free article] [PubMed] [Google Scholar]
- Obarzanek E, Vollmer WM, Lin PH, Cooper LS, Young DR, Ard JD, et al. Effects of individual components of multiple behavior changes: the PREMIER trial. American Journal of Health Behavior 2007;31(5):545-60. [DOI] [PubMed] [Google Scholar]
- Svetkey LP, Erlinger TP, Vollmer WM, Feldstein A, Cooper LS, Appel LJ, et al. Effect of lifestyle modifications on blood pressure by race, sex, hypertension status, and age. Journal of Human Hypertension 2005;19(1):21-31. [DOI] [PubMed] [Google Scholar]
- Svetkey LP, Harsha DW, Vollmer WM, Stevens VJ, Obarzanek E, Elmer PJ, et al. Premier: a clinical trial of comprehensive lifestyle modification for blood pressure control: rationale, design and baseline characteristics. Annals of Epidemiology 2003;13(6):462-71. [DOI] [PubMed] [Google Scholar]
Pritchard 2002 {published data only}
- Pritchard JE, Nowson CA, Billington T, Wark JD. Benefits of a year-long workplace weight loss program on cardiovascular risk factors. Nutrition and Dietetics 2002;59(2):87-96. [Google Scholar]
Reid 2002 {published data only}
- Reid R, Fodor G, Lydon-Hassen K, D'Angelo MS, McCrea J, Bowlby M, et al. Dietary counselling for dyslipidemia in primary care: results of a randomized trial. Canadian Journal of Dietetic Practice & Research 2002;63(4):169-75. [DOI] [PubMed] [Google Scholar]
Roderick 1997 {published and unpublished data}
- Roderick P, Ruddock V, Hunt P, Miller G. A randomized trial to evaluate the effectiveness of dietary advice by practice nurses in lowering diet-related coronary heart disease risk. British Journal of General Practice 1997;47(414):7-12. [PMC free article] [PubMed] [Google Scholar]
Roman CHD prev 1986 {published data only}
- Anon. The Roman Coronary Disease Prevention Project: effectiveness of intervention and reduction of mortality over a 10-year period [II Progetto Romano di Prevenzione della Cardiopatia Coronarica: efficacia dell'intervento e riduzione della mortalita in 10 anni]. Giornale Italiano di Cardiologia 1986;16(3):196-202. [PubMed] [Google Scholar]
- Research Group of the Rome Project of Coronary Heart Disease Prevention. Eight-year follow-up results from the Rome Project of Coronary Heart Disease Prevention. Preventive Medicine 1986;15(2):176-91. [DOI] [PubMed] [Google Scholar]
Rose 1987 {published data only}
- Rose DP, Boyar AP, Cohen C, Strong LE. Effect of a low fat diet on hormone levels in women with cystic breast disease. I. Serum steroids and gonadotropins. Journal of the National Cancer Institute 1987;78:623-6. [PubMed] [Google Scholar]
Rusu 2013 {published data only}
- Rusu E, Jinga M, Enache G, Rusu F, Dragomir AD, Ancuta I, et al. Effects of lifestyle changes including specific dietary intervention and physical activity in the management of patients with chronic hepatitis C - a randomized trial. Nutrition Journal 2013;12:119. [DOI] [PMC free article] [PubMed] [Google Scholar]
- Rusu ED, Jinga M, Enache G, Rusu F, Dragomir A, Ancuta I, et al. Effects of the prudent diet versus low fat diet in cytokines profile in patients with diabetes and chronic hepatitis C. Diabetologia 2012;55:S361-2. [Google Scholar]
Sacks 2009 {published and unpublished data}
- Sacks FM, Bray GA, Carey VJ, Smith SR, Ryan DH, Anton SD, et al. Comparison of weight-loss diets with different compositions of fat, protein, and carbohydrates. New England Journal of Medicine 2009;360(9):859-73. [DOI] [PMC free article] [PubMed] [Google Scholar]
Salas‐Salvado 2014 {published data only}
- Salas-Salvado J, Bullo M, Estruch R, Ros E, Covas MI, Ibarrola-Jurado N, et al. Prevention of diabetes with Mediterranean diets: a subgroup analysis of a randomized trial. Annals of Internal Medicine 2014;160:1-10. [DOI] [PubMed] [Google Scholar]
Schectman 1996 {published data only}
- Schectman G, Wolff N, Byrd JC, Hiatt JG, Hartz A. Physician extenders for cost-effective management of hypercholesterolemia. Journal of General Internal Medicine 1996;11(5):277-86. [DOI] [PubMed] [Google Scholar]
Schlierf 1995 {published data only}
- Schlierf G, Schuler G, Hambrecht R, Niebauer J, Hauer K, Vogel G, et al. Treatment of coronary heart disease by diet and exercise. Journal of Cardiovascular Pharmacology 1995;25 Suppl 4:S32-4. [PubMed] [Google Scholar]
Singh 1991 {published data only}
- Singh RB, Rastogi SS, Sircar AR. Dietary strategies for risk-factor modification to prevent cardiovascular diseases. Nutrition 1991;7(3):210-4. [PubMed] [Google Scholar]
Singh 1992 {published data only}
- Singh RB, Niaz MA, Agarwal P, Begom R, Rastogi SS. Effect of antioxidant-rich foods on plasma ascorbic acid, cardiac enzyme, and lipid peroxide levels in patients hospitalized with acute myocardial infarction. Journal of the American Dietetic Association 1995;95(7):775-80. [DOI] [PubMed] [Google Scholar]
- Singh RB, Niaz MA, Ghosh S. Effect on central obesity and associated disturbances of low-energy, fruit- and vegetable-enriched prudent diet in North Indians. Postgraduate Medical Journal 1994;70(830):895-900. [DOI] [PMC free article] [PubMed] [Google Scholar]
- Singh RB, Rastogi SS, Verma R, Bolaki L, Singh R. An Indian experiment with nutritional modulation in acute myocardial infarction. American Journal of Cardiology 1992;69(9):879-85. [DOI] [PubMed] [Google Scholar]
- Singh RB, Rastogi SS, Verma R, Laxmi B, Singh R, Ghosh S, et al. Randomised controlled trial of cardioprotective diet in patients with recent acute myocardial infarction: results of one year follow up. BMJ 1992;304(6833):1015-9. [DOI] [PMC free article] [PubMed] [Google Scholar]
Siqueira‐Catania 2010 {published data only}
- Siqueira-Catania A. Cardiometabolic benefits induced by lifestyle changes are mediated by inflammation in a Brazilian prevention program. Arquivos Brasileiros de Endocrinologia & Metabologia 2010;54(Suppl 2):S97-8. [Google Scholar]
SLIM 2008 {published data only}
- Roumen C, Corpeleijn E, Feskens EJ, Mensink M, Saris WH, Blaak EE, et al. Impact of 3-year lifestyle intervention on postprandial glucose metabolism: the SLIM study. Diabetic Medicine 2008;25(5):597-605. [DOI] [PubMed] [Google Scholar]
Sondergaard 2003 {published and unpublished data}
- Sondergaard E, Moller JE, Egstrup K. Effect of dietary intervention and lipid-lowering treatment on brachial vasoreactivity in patients with ischemic heart disease and hypercholesterolemia. American Heart Journal 2003;145(5):E19. [DOI] [PubMed] [Google Scholar]
Sopotsinskaia 1992 {published data only}
- Sopotsinskaia EB, Balitskii KP, Tarutinov VI, Zhukova VM, Semenchuk DD, Kozlovskaia SG, et al. Experience with the use of a low-calorie diet in breast cancer patients to prevent metastasis [Opyt primeneniia nizkokaloriinoi diety u bol'nykh rakom molochnoi zhelezy s tsel'iu profilaktiki metastazi]. Voprosy Onkologii 1992;38(5):592-9. [PubMed] [Google Scholar]
Stanford Weight {published and unpublished data}
- Williams PT, Krauss RM, Stefanick ML, Vranizan KM, Wood PD. Effects of low-fat diet, calorie restriction, and running on lipoprotein subfraction concentrations in moderately overweight men. Metabolism 1994;43(5):655-63. [DOI] [PMC free article] [PubMed] [Google Scholar]
Steinbach 1996 {published data only}
- Steinbach M. A Romanian contribution to the epidemiology and prevention of cardiovascular diseases. Romanian Journal of Internal Medicine 1996;34(1-2):137-48. [PubMed] [Google Scholar]
Steptoe 2001 {published data only}
- Steptoe A, Kerry S, Rink E, Hilton S. The impact of behavioral counseling on stage of change in fat intake, physical activity, and cigarette smoking in adults at increased risk of coronary heart disease. American Journal of Public Health 2001;91(2):265-9. [DOI] [PMC free article] [PubMed] [Google Scholar]
Stevens 2002 {published and unpublished data}
- Stevens VJ, Glasgow RE, Toobert DJ, Karanja N, Smith KS. One-year results from a brief, computer-assisted intervention to decrease consumption of fat and increase consumption of fruits and vegetables. Preventive Medicine 2003;36:594-600. [DOI] [PubMed] [Google Scholar]
- Stevens VJ, Glasgow RE, Toobert DJ, Karanja N, Smith KS. Randomized trial of a brief dietary intervention to decrease consumption of fat and increase consumption of fruits and vegetables. American Journal of Health Promotion 2002;16(3):129-34. [DOI] [PubMed] [Google Scholar]
Stevenson 1988 {published data only}
- Stevenson DW, Darga LL, Spafford TR, Ahmad N, Lucas CP. Variable effects of weight loss on serum lipids and lipoproteins in obese patients. International Journal of Obesity 1988;12:495-502. [PubMed] [Google Scholar]
Sweeney 2004 {published data only}
- Sweeney M. Effects of very low-fat diets on anginal symptoms. Medical Hypotheses 2004;63(3):553. [DOI] [PubMed] [Google Scholar]
TAIM 1989 {published data only}
- Davis BR, Blaufox MD, Hawkins CM, Langford HG, Oberman A, Swencionis C, et al. Trial of antihypertensive interventions and management. Design, methods, and selected baseline results. Controlled Clinical Trials 1989;10(1):11-30. [DOI] [PubMed] [Google Scholar]
- Davis BR, Blaufox MD, Oberman A, Wassertheil SS, Zimbaldi N, Cutler JA, et al. Reduction in long-term antihypertensive medication requirements. Effects of weight reduction by dietary intervention in overweight persons with mild hypertension. Archives of Internal Medicine 1993;153(15):1773-82. [DOI] [PubMed] [Google Scholar]
- Davis BR, Oberman A, Blaufox MD, Wassertheil SS, Hawkins CM, Cutler JA, et al, Trial of Antihypertensive Interventions and Management Research Group. Effect of antihypertensive therapy on weight loss. Hypertension 1992;19(4):393-9. [DOI] [PubMed] [Google Scholar]
- Langford HG, Davis BR, Blaufox D, Oberman A, Wassertheil Smoller S, Hawkins M. Effect of drug and diet treatment of mild hypertension on diastolic blood pressure. The TAIM Research. Hypertension 1991;17(2):210-7. [DOI] [PubMed] [Google Scholar]
- Oberman A, Wassertheil SS, Langford HG, Blaufox MD, Davis BR, Blaszkowski T, et al. Pharmacologic and nutritional treatment of mild hypertension: changes in cardiovascular risk status. Annals of Internal Medicine 1990;112(2):89-95. [DOI] [PubMed] [Google Scholar]
- Wassertheil SS, Davis BR, Breuer B, Chee JC, Oberman A, Blaufox MD. Differences in precision of dietary estimates among different population subgroups. Annals of Epidemiology 1993;3:619-28. [DOI] [PubMed] [Google Scholar]
- Wassertheil SS, Oberman A, Blaufox MD, Davis B, Langford H. The Trial of Antihypertensive Interventions and Management (TAIM) study. Final results with regard to blood pressure, cardiovascular risk, and quality of life. American Journal of Hypertension 1992;5(1):37-44. [DOI] [PubMed] [Google Scholar]
- Wylie RJ, Wassertheil SS, Blaufox MD, Davis BR, Langford HG, Oberman A, et al. Trial of antihypertensive intervention and management: greater efficacy with weight reduction than with a sodium-potassium intervention. Journal of the American Dietetic Association 1993;93(4):408-15. [DOI] [PubMed] [Google Scholar]
THIS DIET 2008 {published data only}
- Tuttle KR, Shuler LA, Packard DP, Milton JE, Daratha KB, Bibus DM, et al. Comparison of low-fat versus Mediterranean-style dietary intervention after first myocardial infarction (from The Heart Institute of Spokane Diet Intervention and Evaluation Trial). American Journal of Cardiology 2008;101(11):1523-30. [DOI] [PubMed] [Google Scholar]
TOHP I 1992 {published data only}
- Anon. The effects of nonpharmacologic interventions on blood pressure of persons with high normal levels. Results of the Trials of Hypertension Prevention, Phase I. JAMA 1992;267(9):1213-20. [DOI] [PubMed] [Google Scholar]
- Kumanyika SK, Hebert PR, Cutler JA, Lasser VI, Sugars CP, Steffen BL, et al, Trials of Hypertension Prevention Collaborative Research Group. Feasibility and efficacy of sodium reduction in the Trials of Hypertension Prevention, phase I. Hypertension 1993;22(4):502-12. [DOI] [PubMed] [Google Scholar]
- Satterfield S, Cutler JA, Langford HG, Applegate WB, Borhani NO, Brittain E, et al. Trials of hypertension prevention. Phase I design. Annals of Epidemiology 1991;1(5):455-71. [DOI] [PubMed] [Google Scholar]
- Stevens VJ, Corrigan SA, Obarzanek E, Bernauer E, Cook NR, Hebert P, et al, TOHP Collaborative Research Group. Weight loss intervention in phase I of the trials of hypertension prevention. Archives of Internal Medicine 1993;153(7):849-58. [PubMed] [Google Scholar]
- Whelton PK, Hebert PR, Cutler J, Applegate WB, Eberlein KA, Klag MJ, et al. Baseline characteristics of participants in phase I of the trials of hypertension prevention. Annals of Epidemiology 1992;2(3):295-310. [DOI] [PubMed] [Google Scholar]
- Whelton PK, Kumanyika SK, Cook NR, Cutler JA, Borhani NO, Hennekens CH, et al, Trials of Hypertension Prevention Collaborative Research Group. Efficacy of nonpharmacologic interventions in adults with high-normal blood pressure: results from phase 1 of the trials of hypertension prevention. American Journal of Clinical Nutrition 1997;65(2 Suppl):652S-60S. [DOI] [PubMed] [Google Scholar]
TONE 1997 {published data only}
- Whelton PK, Appel LJ, Espeland MA, Applegate WB, Ettinger-WH J, Kostis JB, et al, TONE Collaborative Research Group. Sodium reduction and weight loss in the treatment of hypertension in older persons: a randomized controlled trial of nonpharmacologic interventions in the elderly (TONE). JAMA 1998;279(11):839-46. [DOI] [PubMed] [Google Scholar]
- Whelton PK, Babnson J, Appel LJ, Charleston J, Cosgrove N, Espeland MA, et al. Recruitment in the Trial Of Nonpharmacologic intervention in the Elderly (TONE). Journal of the American Geriatrics Society 1997;45(2):185-93. [DOI] [PubMed] [Google Scholar]
Toobert 2003 {published data only}
- Toobert DJ, Glasgow RE, Strycker LA, Barrera M Jr, Radcliffe JL, Wander RC, et al. Biologic and quality-of-life outcomes from the Mediterranean Lifestyle Program: a randomized clinical trial. Diabetes Care 2003;26(8):2288-93. [DOI] [PubMed] [Google Scholar]
Toronto Polyp Prev 1994 {published and unpublished data}
- McKeown-Eyssen GE, Bright SE, Bruce WR, Jazmaji V, Toronto Polyp Prevention Group. A randomized trial of a low fat high fibre diet in the recurrence of colorectal polyps. Journal of Clinical Epidemiology 1994;47(5):525-36. [DOI] [PubMed] [Google Scholar]
Tromso Heart 1989 {published data only}
- Knutsen SF, Knutsen R. The Tromso Heart Study: family approach to intervention on CHD. Feasibility of risk factor reduction in high-risk persons - project description. Scandinavian Journal of Social Medicine 1989;17:109-19. [DOI] [PubMed] [Google Scholar]
Troyer 2010 {published data only}
- Racine E, Troyer J, Grace N, McAuley W. The effect of home delivered DASH meals on the diets of older adults with cardiovascular disease (abstract). Clinical Nutrition FASEB Journal 2010;24:published online. [DOI] [PubMed] [Google Scholar]
- Troyer JL, Racine EF, Ngugi GW, McAuley WJ. The effect of home-delivered Dietary Approach to Stop Hypertension (DASH) meals on the diets of older adults with cardiovascular disease. American Journal of Clinical Nutrition 2010;91(5):1204-12. [DOI] [PubMed] [Google Scholar]
Turku Weight {published and unpublished data}
- Hakala P, Karvetti RL. Weight reduction on lactovegetarian and mixed diets. European Journal of Clinical Nutrition 1989;43:421-30. [PubMed] [Google Scholar]
- Marniemi J, Seppanen A, Hakala P. Long-term effects on lipid metabolism of weight reduction on lactovegetarian and mixed diet. International Journal of Obesity 1990;14:113-25. [PubMed] [Google Scholar]
UK PDS 1996 {published data only}
- Turner R, Cull C, Holman R. United Kingdom Prospective Diabetes Study 17: a 9-year update of a randomized, controlled trial on the effect of improved metabolic control on complications in non-insulin-dependent diabetes mellitus. Annals of Internal Medicine 1996;124(1 Pt 2):136-45. [DOI] [PubMed] [Google Scholar]
- Turner RC, Holman RR. Lessons from UK prospective diabetes study. Diabetes Research and Clinical Practice 1995;28 Suppl:S151-7. [DOI] [PubMed] [Google Scholar]
Urbach 1952 {published data only}
- Urbach R, Hildreth EA, Wackerman MT. The therapeutic uses of low fat, low cholesterol diets: I. Treatment of essential familial xanthomatosis. Journal of Clinical Nutrition 1952;1:52-6. [DOI] [PubMed] [Google Scholar]
Uusitupa 1993 {published data only}
- Uusitupa M, Laitinen J, Siitonen O, Vanninen E, Pyorala K. The maintenance of improved metabolic control after intensified diet therapy in recent type 2 diabetes. Diabetes Research and Clinical Practice 1993;19(3):227-38. [DOI] [PubMed] [Google Scholar]
Wassertheil 1985 {published data only}
- Wassertheil SS, Blaufox MD, Langford HG, Oberman A, Cutter G, Pressel S. Prediction of response to sodium intervention for blood pressure control. Journal of Hypertension 1986;4(5 Suppl):S343-6. [PubMed] [Google Scholar]
- Wassertheil SS, Langford HG, Blaufox MD, Oberman A, Hawkins M, Levine B, et al. Effective dietary intervention in hypertensives: sodium restriction and weight reduction. Journal of the American Dietetic Association 1985;85(4):423-30. [PubMed] [Google Scholar]
Weintraub 1992 {published data only}
- Weintraub M, Sundaresan PR, Schuster B. Long-term weight control study. VII (weeks 0 to 210). Serum lipid changes. Clinical Pharmacology and Therapeutics 1992;51(5):634-41. [DOI] [PubMed] [Google Scholar]
Westman 2006 {published data only}
- Westman EC, Yancy WS Jr, Olsen MK, Dudley T, Guyton JR, Westman Eric C, et al. Effect of a low-carbohydrate, ketogenic diet program compared to a low-fat diet on fasting lipoprotein subclasses. International Journal of Cardiology 2006;110(2):212-6. [DOI] [PubMed] [Google Scholar]
WHO primary prev 1979 {published data only}
- Anon. Primary prevention of ischaemic heart disease: WHO coordinated cooperative trial. A summary report. Bulletin Of The World Health Organization 1979;57:801-5. [PMC free article] [PubMed] [Google Scholar]
Williams 1990 {published data only}
- Williams PT, Krauss RM, Vranizan KM, Wood PS. Changes in lipoprotein subfractions during diet-induced and exercise-induced weight loss in moderately overweight men. Circulation 1990;81:1293-304. [DOI] [PubMed] [Google Scholar]
Williams 1992 {published data only}
- Williams PT, Krauss RM, Vranizan KM, Albers JJ, Wood PD. Effects of weight-loss by exercise and by diet on apolipoproteins A-I and A-II and the particle-size distribution of high-density lipoproteins in men. Metabolism: Clinical and Experimental 1992;41:441-9. [DOI] [PMC free article] [PubMed] [Google Scholar]
Williams 1994 {published data only}
- Williams PT, Stefanick ML, Vranizan KM, Wood PD. The effects of weight loss by exercise or by dieting on plasma high-density lipoprotein (HDL) levels in men with low, intermediate, and normal-to-high HDL at baseline. Metabolism 1994;43(7):917-24. [DOI] [PMC free article] [PubMed] [Google Scholar]
Wilmot 1952 {published data only}
- Wilmot VA, Swank RL. The influence of low fat diet on blood lipid levels in health and in multiple sclerosis. American Journal of the Medical Sciences 1952;223:25-34. [DOI] [PubMed] [Google Scholar]
Wing 1998 {published data only}
- Wing RR, Venditti E, Jakicic JM, Polley BA, Lang W. Lifestyle intervention in overweight individuals with a family history of diabetes. Diabetes Care 1998;21(3):350-9. [DOI] [PubMed] [Google Scholar]
Wolever 2008 {published data only}
- Wolever TM, Gibbs AL, Mehling C, et al. The Canadian trial of Carbohydrates in Diabetes (CCD), a 1-y controlled trial of low-glycemic-index dietary carbohydrate in type 2 diabetes: no effect on glycated hemoglobin but reduction in C-reactive protein. American Journal of Clinical Nutrition 2008;87(1):114-25. [DOI] [PubMed] [Google Scholar]
WOMAN 2007 {published data only}
- Kuller LH, Kriska AM, Kinzel LS, Simkin-Silverman LR, Sutton-Tyrrell K, Johnson BD, et al. The clinical trial of Women On the Move through Activity and Nutrition (WOMAN) study. Contemporary Clinical Trials 2007;28(4):370-81. [DOI] [PMC free article] [PubMed] [Google Scholar]
Wood 1988 {published data only}
- Wood PD, Stefanick ML, Dreon DM, Frey HB, Garay SC, Williams PT, et al. Changes in plasma lipids and lipoproteins in overweight men during weight loss through dieting as compared with exercise. New England Journal of Medicine 1988;319(18):1173-9. [DOI] [PubMed] [Google Scholar]
Woollard 2003 {published data only}
- Woollard J, Burke V, Beilin LJ, Verheijden M, Bulsara MK. Effects of a general practice-based intervention on diet, body mass index and blood lipids in patients at cardiovascular risk. Journal of Cardiovascular Risk 2003;10(1):31-40. [DOI] [PubMed] [Google Scholar]
Working Well 1996 {published data only}
- Sorensen G, Thompson B, Glanz K, Feng Z, Kinne S, DiClemente C, et al. Work site-based cancer prevention: primary results from the Working Well Trial. American Journal of Public Health 1996;86(7):939-47. [DOI] [PMC free article] [PubMed] [Google Scholar]
Young 2010 {published data only}
- Young DR, Coughlin J, Jerome GJ, Myers V, Chae SE, Brantley PJ, et al. Effects of the PREMIER interventions on health-related quality of life. Annals of Behavioral Medicine 2010;40:302-12. [DOI] [PMC free article] [PubMed] [Google Scholar]
References to studies awaiting assessment
Casas‐Agustench 2013 {published data only}
- Casas-Agustench P, Molina S, Espinosa-Salinas I, Olivares M, Reglero G, Ordovás JM, et al. SELP variant modulates plasma HDL-C responses in subjects with moderate cardiovascular risk after skimmed milk consumption. Clinical Nutrition FASEB Journal 2013;27(1 suppl):640.21. [Google Scholar]
- Loria-Kohen V, Espinosa-Salinas I, Ramirez de Molina A, Casas-Agustench P, Herranz J, Molina S, et al. A genetic variant of PPARA modulates cardiovascular risk biomarkers after milk consumption. Nutrition 2014;30(10):1144-50. [DOI] [PubMed] [Google Scholar]
DIPI {published data only}
- Arentoft JL, Hoppe C, Andersen EW, Overvad K, Tetens I. Associations between adherence to the Danish Food-Based Dietary Guidelines and cardiometabolic risk factors in a Danish adult population: the DIPI study. British Journal of Nutrition 2018;119(6):664-73. [DOI] [PubMed] [Google Scholar]
- NCT02062424. DIet and Prevention of Ischemic heart disease: a translational approach (DIPI). clinicaltrials.gov/ct2/show/NCT02062424 (received 13 Feb 2014).
ICFAMED {published data only}
- ISRCTN27497769. A Mediterranean diet for preventing heart failure and atrial fibrillation in hypertensive patients. doi.org/10.1186/ISRCTN27497769 (received retrospectively 2 May 2012).
- Lapetra J, Lozano-Rodríguez JM, Caballero-Valderrama MR, Santos-Lozano JM, Ortega-Calvo M, García de la Corte FJ, et al. Effect of a Mediterranean diet on the primary prevention of atrial fibrillation and major cardiovascular events in hypertensive patients with high cardiovascular risk: results of ICFAMED study. In: Obesity and Nutrition in the 21st Century. VIII Symposium Ciber Fisiopatología de la Obesidad y Nutrición; 2017; Madrid. Madrid: Ciber Fisiopatología de la Obesidad y Nutrición, 2017:71.
- Lapetra J, Lozano-Rodriguez JM, Miro-Moriano L, Ortega-Calvo M, Santos-Lozano JM, Garcia-Corte FJ, et al. Effect of a Mediterranean diet on the primary prevention of atrial fibrillation and major cardiovascular events in hypertensive patients with high cardiovascular risk: results of ICFAMED randomized trial. European Journal of Clinical Investigation 2018;48:182‐3. [Google Scholar]
MEDINA {published data only}
- ACTRN12615001010583. MEDINA: Mediterranean dietary intervention study in NonAlcoholic Fatty Liver Disease (NAFLD) patients [The effects of a Mediterranean Dietary Intervention on insulin resistance and hepatic steatosis in patients with NonAlcoholic Fatty Liver Disease (NAFLD).]. www.anzctr.org.au/Trial/Registration/TrialReview.aspx?id=369214 (received 28 August 2015).
- Papamiltiadous ES, Roberts SK, Nicoll AJ, Ryan MC, Itsiopoulos C, Salim A, et al. A randomised controlled trial of a Mediterranean dietary intervention for adults with non alcoholic fatty liver disease (MEDINA): study protocol. BMC Gastroenterology 2016;16:14. [DOI] [PMC free article] [PubMed] [Google Scholar]
Mottalib 2018 {published data only}
- Mottalib A, Mitri J, Salsberg V, Ashrafzadeh S, Elseaidy T, Tomah S, et al. Effect of dairy consumption and Its fat content on glycemic control and cardiovascular risk factors in patients with type 2 diabetes — randomized controlled study. Diabetes 2018;67(Suppl 1):760-P. [DOI] [PMC free article] [PubMed] [Google Scholar]
Soul Food Light {published data only}
- Anderson-Loftin W, Barnett S, Bunn P, Sullivan P, Hussey J, Tavakoli A. Soul Food Light: culturally competent diabetes education. Diabetes Educator 2005;31(4):555-63. [DOI] [PubMed] [Google Scholar]
References to ongoing studies
NCT02481466 due 2020 {published data only}
- NCT02481466. The combined Portfolio diet and Exercise study (PortfolioEx). clinicaltrials.gov/ct2/show/NCT02481466 (received 25 June 2015).
NCT02938832 due 2023 {published data only}
- NCT02938832. Does the advice to eat a Mediterranean diet with low carbohydrate intake, compared with a low-fat diet, reduce diabetes and cardiovascular disease? clinicaltrials.gov/ct2/show/NCT02938832 (first received 19 October 2016).
NCT03068078 due 2020 {published data only}
- NCT03068078. A reduced-carbohydrate diet high in monounsaturated fats in type 2 diabetes (ReDuCtion). clinicaltrials.gov/ct2/show/NCT03068078 (received 1 March 2017).
Additional references
Aljadani 2015
- Aljadani H, Patterson A, Sibbritt D, Collins CE. Diet quality and weight change in adults over time: a systematic review of cohort studies. Current Nutrition Reports 2015;4:88-101. [Google Scholar]
Ambrosini 2014
- Ambrosini GL. Childhood dietary patterns and later obesity: a review of the evidence. Proceedings of the Nutrition Society 2014;73:137-46. [DOI] [PubMed] [Google Scholar]
Benatar 2013
- Benatar JR, Sidhu K, Stewart RA, Benatar JR, Sidhu K, Stewart RAH. Effects of high and low fat dairy food on cardio-metabolic risk factors: a meta-analysis of randomized studies. PlOS One 2013;8:e76480. [DOI] [PMC free article] [PubMed] [Google Scholar]
Berkley 1995
- Berkley CS, Hoaglin DC, Mosteller F, Colditz GA. A random-effects regression model for meta-analysis. Statistics in Medicine 1995;14:395-411. [DOI] [PubMed] [Google Scholar]
Egger 1997
- Egger M, Davey Smith G, Schneider M, Minder C. Bias in meta-analysis detected by a simple graphical test. BMJ 1997;315:629-34. [DOI] [PMC free article] [PubMed] [Google Scholar]
Higgins 2003
- Higgins JPT, Thompson SG, Deeks JJ, Altman DG. Measuring inconsistency in meta-analyses. BMJ 2003;327:557-60. [DOI] [PMC free article] [PubMed] [Google Scholar]
Higgins 2011a
- Higgins JPT, Green S (editors). Cochrane Handbook for Systematic Reviews of Interventions Version 5.1.0 [updated March 2011]. The Cochrane Collaboration, 2011. Available from handbook.cochrane.org.
Higgins 2011b
- Higgins JPT, Altman DG, Sterne JAC (editors). Chapter 8: Assessing risk of bias in included studies. In: Higgins JPT, Green S (editors). Cochrane Handbook for Systematic Reviews of Interventions Version 5.1.0 [updated March 2011]. The Cochrane Collaboration, 2011. Available from handbook.cochrane.org.
Hooper 2012a
- Hooper L, Summerbell CD, Thompson R, Sills D, Roberts FG, Moore HJ, et al. Reduced or modified dietary fat for preventing cardiovascular disease. Cochrane Database of Systematic Reviews 2012, Issue 5. [DOI: 10.1002/14651858.CD002137] [DOI] [PMC free article] [PubMed] [Google Scholar]
Hooper 2015b
- Hooper L, Martin N, Abdelhamid A, Davey Smith G. Reduction in saturated fat intake for cardiovascular disease. Cochrane Database of Systematic Reviews 2015, Issue 6. [DOI: 10.1002/14651858.CD011737] [DOI] [PubMed] [Google Scholar]
Kelly 2006
- Kelly S, Hillier F, Whittaker V, Ells LJ, Edmunds LD, Smith S, et al. The associations between food, nutrition, physical activity and the risk of weight gain, overweight and obesity and underlying mechanisms: systematic literature review. In: Food, Nutrition, Physical Activity, and the Prevention of Cancer: a Global Perspective (www.dietandcancerreport.org/cancer_resource_center/downloads/SLR/Obesity_SLR.pdf.5). World Cancer Research Fund/American Institute for Cancer Research, 2006. [Google Scholar]
Lefebvre 2011
- Lefebvre C, Manheimer E, Glanville J. Chapter 6: Searching for studies. In: Higgins JPT, Green S, editors(s). Cochrane Handbook for Systematic Reviews of Interventions. Version 5.1 [updated March 2011]. The Cochrane Collaboration, 2011. Available from handbook.cochrane.org.
Manson 1990
- Manson JE, Colditz GA, Stampfer MJ, Willett WC, Rosner B, Monson RR, et al. A prospective study of obesity and risk of coronary heart disease in women. New England Journal of Medicine 1990;322:882-9. [DOI: 10.1056/NEJM199003293221303] [DOI] [PubMed] [Google Scholar]
Naude 2018
- Naude CE, Visser ME, Nguyen KA, Durao S, Schoonees A. Effects of total fat intake on bodyweight in children. Cochrane Database of Systematic Reviews 2018, Issue 2. [DOI: 10.1002/14651858.CD012960] [DOI] [PMC free article] [PubMed] [Google Scholar]
Ni 2010
- Ni MC, Aston LM, Jebb SA. Effects of worksite health promotion interventions on employee diets: a systematic review. BMC Public Health 2010;10:62. [DOI] [PMC free article] [PubMed] [Google Scholar]
Page 2019
- Page MJ, Higgins JPT, Sterne JAC. Chapter 13: Assessing risk of bias due to missing results in a synthesis. In: Higgins JPT, Thomas J, Chandler J, Cumpston M, Li T, Page MJ, Welch VA, editors. Cochrane Handbook for Systematic Reviews of Interventions version 6.0 (updated July 2019), Cochrane 2019. Available from www.training.cochrane.org/handbook.
RevMan 2014 [Computer program]
- The Nordic Cochrane Centre, The Cochrane Collaboration Review Manager 5 (RevMan 5). Version 5.3. Copenhagen: The Nordic Cochrane Centre, The Cochrane Collaboration, 2014.
Schwingshackl 2013
- Schwingshackl L, Hoffmann G. Comparison of effects of long-term low-fat vs high-fat diets on blood lipid levels in overweight or obese patients: a systematic review and meta-analysis. Journal of the Academy of Nutrition & Dietetics 2013;113:1640-61. [DOI] [PubMed] [Google Scholar]
Sharp 1998
- Sharp S. Meta-analysis regression. Stata Technical Bulletin 1998;42:16-22. [Google Scholar]
Song 2004
- Song Y-M, Sung J, Davey Smith G, Ebrahim S. Body mass index and ischemic and hemorrhagic stroke: a prospective study in Korean men. Stroke 2004;35:831-6. [DOI] [PubMed] [Google Scholar]
Sterne 2001
- Sterne JAC, Bradburn MJ, Egger M. Meta-analysis in STATA. In: Egger M, Davey Smith G, Altman DG, editors(s). Systematic Reviews in Health Care: Meta-analysis in Context. London: BMJ Books, 2001. [Google Scholar]
Sterne 2009
- Sterne JAC. Meta-analysis in Stata: an Updated Collection from the Stata Journal. Texas, USA: STATA Press, 2009. [Google Scholar]
WCRF/AICR 2009
- World Cancer Research Fund/American Institute for Cancer Research. Preventability of cancer by food, nutrition, and physical activity: Appendix A. In: Policy and Action for Cancer Prevention. Food, Nutrition, and Physical Activity: a Global Perspective. Washington DC: AICR, 2009. [Google Scholar]
Yu‐Poth 1999
- Yu-Poth S, Zhao G, Etherton T, Naglak M, Jonnalagadda S, Kris-Etherton PM. Effects of the National Cholesterol Education Program's Step I and Step II dietary intervention programs on cardiovascular disease risk factors: a meta-analysis. American Journal of Clinical Nutrition 1999;69:632-46. [DOI] [PubMed] [Google Scholar]
References to other published versions of this review
Hooper 2000
- Hooper L, Summerbell CD, Higgins JPT, Thompson RL, Clements G, Capps N, et al. Reduced or modified dietary fat for prevention of cardiovascular disease. Cochrane Database of Systematic Reviews 2000, Issue 2. [DOI: 10.1002/14651858.CD002137] [DOI] [PubMed] [Google Scholar]
Hooper 2001
- Hooper L, Summerbell CD, Higgins JPT, Thompson RL, Capps N, Davey Smith G, et al. Dietary fat intake and prevention of cardiovascular disease: systematic review. BMJ 2001;322:757-63. [DOI] [PMC free article] [PubMed] [Google Scholar]
Hooper 2012b
- Hooper L, Abdelhamid A, Moore HJ, Douthwaite W, Skeaff CM, Summerbell CD. Effect of reducing total fat intake on body weight: systematic review and meta-analysis of randomised controlled trials and cohort studies. BMJ 2012;345:e7666. [DOI: 10.1136/bmj.e7666] [DOI] [PMC free article] [PubMed] [Google Scholar]
Hooper 2015a
- Hooper L, Abdelhamid A, Bunn D, Brown T, Summerbell CD, Skeaff CM. Effects of total fat intake on body weight. Cochrane Database of Systematic Reviews 2015, Issue 8. [DOI: 10.1002/14651858.CD011834] [DOI] [PMC free article] [PubMed] [Google Scholar]