

Abstract
The Phylogenetics And Networks for Generalized HIV Epidemics in Africa (PANGEA-HIV) consortium has been vital in the generation and examination of near full-length HIV-1 sequences generated from Sub-Saharan Africa. In this study, we examined a subset (n = 275) of sequences from Rakai, Uganda, collected between August 2011 and January 2015. Sequences were initially screened with COMET for subtyping and then evaluated using bootscanning and phylogenetic inference. Among 275 sequences, 38.6% were subtype D, 19.3% were subtype A, 2.9% were subtype C, and 39.3% were recombinant. The recombinants were structurally diverse in the number of breakpoints observed, the location of recombinant segments, and represented subtypes, with AD recombinants accounting for the majority of all recombinants (29.8%). Within the AD subpopulation, we identified a potential new circulating recombinant form in five individuals where the polymerase gene was subtype D and most of env was subtype A (D-A junctures at HXB2 6760 and 8709). While the breakpoints were identical for the viruses from these individuals, the viral fragments did not cluster together. These results suggest selection for a viral strain where properties of the subtype A and subtype D portions of the virus confer a survival advantage. The continued study of recombinants will increase our breadth of knowledge for the genetic diversity and evolution of HIV-1, which can further contribute to our understanding toward a universal HIV-1 vaccine.
Keywords: HIV-1, circulating recombinant form, HIV-1 recombination, HIV-1 diversity, subtype
Introduction
HIV-1 is differentiated into several distinct genetic groups, where the largest group (Group-M) is further subdivided into 10 pure subtypes (A, B, C, D, F–H, J–L).1,2 Recently, it has been suggested that “sub-subtypes” can also be defined that have arisen by geographic boundaries.3 For example, subtypes F and A have been sub-subtyped into F1/F2 and A1/A2 (and unofficially A3/A4), respectively. If a cell is infected with two or more subtypes, HIV can exchange genetic fragments, resulting in recombinant viruses.4 Circulating recombinant forms (CRFs) are strains that have been observed in at least three epidemiologically unlinked individuals, whereas unique recombinant forms (URFs) have been observed in two individuals.5 Due to the global HIV-1 epidemic, the continued establishment of new recombinants within a population has been increasing.1 Currently, more than 90 CRFs have been identified, including the major CRF01_AE and CRF02_AG forms. Consequently, between 2010 and 2015, recombinants comprised 22.9% of the global HIV-1 distribution.1
To develop an HIV-1 vaccine that targets all subtypes, the variability observed in recombinants must be considered. In this study, we assess HIV-1 subtype diversity among HIV-1-seropositive individuals in Rakai, located in central Uganda. The Rakai region of Uganda was the place where the first HIV-1 cases in Eastern Africa were identified,6 and today represents one of the most genetically diverse HIV-1 epidemics in the world. Prior studies from Rakai have shown that HIV-1 subtypes A and D predominate with increasing levels of AD recombinant viruses over time7; however, these earlier studies considered only two subgenomic regions (p24 and gp41) and likely underestimated the extent of recombination and HIV-1 diversity in the region. Here, we determine HIV-1 subtype and recombinant forms of 275 near full-length HIV-1 sequences obtained from HIV-1-infected individuals in Rakai.
Methods
Ethics statement
The study was approved by institutional review boards of the National Institute of Allergy and Infectious Diseases, Johns Hopkins Medical Institutions, Western Institutional Review Board (Olympia, WA), the Research and Ethics Committee of the Uganda Virus Research Institute, and the Uganda National Council for Science and Technology. This study is registered on ClinicalTrials.gov (No. NCT00782158). The studies were conducted according to the ethical standards of the Declaration of Helsinki of the World Medical Association. Study participants provided written informed consent at all visits using institutional review board-approved forms. The study was independently reviewed and approved by the Ugandan Virus Research Institute, Scientific Research and Ethics Committee, Protocol GC/127/13/01/16; the Ugandan National Council of Science and Technology; and the Western Institutional Review Board, Protocol 200313317.
This report includes an analysis of stored samples and data from those studies.
Samples
The samples originated from the Rakai Community Cohort Study (RCCS),8 which is an open population cohort study of participants aged 15–49 years in rural Rakai district, Uganda. Samples obtained between August 2011 and January 2015 were sequenced from HIV-positive individuals who did not self-report antiretroviral treatment (ART) use.
Laboratory methods on generation of full-length sequences
HIV sequence data were generated through the Phylogenetics And Networks for Generalized HIV Epidemics in Africa (PANGEA-HIV) consortium as previously described.9 The PANGEA-HIV consortium was established to collect and obtain viral sequence data across Sub-Saharan Africa to study dynamics of HIV-1 transmission. Briefly, viral RNA was extracted from peripheral blood plasma in patients enrolled in the study and purified using the QIAsymphony DSP Virus/Pathogen Kit (Cat. No. 937036, 937055; Qiagen, Hilden, Germany), followed by one-step reverse transcription–polymerase chain reaction with products sequenced on Illumina MiSeq and HiSeq instruments.10 Sequence data were assembled using SHIVER.11
Assembly and alignment generation
Two hundred and seventy-five near full-length HIV-1 sequences (HXB2 coordinates: ∼788 to ∼7309) were obtained using the HIV SHIVER pipeline as previously described.12 The new sequence data used for this article are available in GenBank, accession numbers MN694970 to MN695026 and MN650370 to MN650586. Sequences were aligned using Gene Cutter (www.hiv.lanl.gov/content/sequence/GENE_CUTTER/cutter.html) with minor modifications in Geneious R11.1.13 High insertion/deletion regions were identified [365 base pairs (bp) in total, ∼5.6% of the analyzed genome] and were excised from the alignment (HXB2 coordinates 1099–1172, 1348–1484, 5252–5285, 5894–5989, and 6086–6139). The following reference subtype sequences were included in the alignment: A1 (Uganda n = 5) and A2 (Democratic Republic of Congo n = 1 and Cameroon n = 1), B (South Africa n = 6), C (Kenya n = 2 and Tanzania n = 10), D (Uganda n = 12), F2 (Cameroon n = 8), G (Kenya n = 3), H (Democratic Republic of Congo n = 4), J (Democratic Republic of Congo n = 3), and K (Democratic Republic of Congo n = 1 and Cameroon n = 1) (see Supplementary Table S1 for details). Additional reference sequences for the sub-subtypes A3, A4, A6, A7, D2, and D3 were included for closer examination of pure subtypes using phylogenetic analysis (see Supplementary Table S1 for details).3 For detailed analysis of subtype C sequences, references from Tanzania (n = 4), South Africa (n = 6), and Kenya (n = 3) were used (see Supplementary Table S2 for details).
Subtype assignment and initial identification of pure recombinant forms
All sequences were initially assessed for subtype using HIV COMET (https://comet.lih.lu) and designated as a pure subtype or a recombinant (“unassigned”). All “unassigned” sequences underwent further analysis to define their potential recombinant mosaic.
Recombination analyses of “unassigned” sequences
Sequences that were identified as “unassigned” by HIV COMET were subsequently analyzed in SimPlot v.3.5.,14 with a window size set at 500 bp and step size of 10 bp to determine if they were recombinants, and if so, the location of putative breakpoints. Reference sequences (described above) were categorized by subtype for SimPlot analysis. In SimPlot, the queried sample was run with three parent reference subtypes typically circulating in Rakai, A, D, and C (Supplementary Fig. S1A). Therefore, a parental strain of subtype D was comprised group of all 12 reference sequences from Uganda. The breakpoint location in the putative subtype was inferred from the location where the major subtype signals (>85%) crossed. The alignment was then fragmented into recombination segments corresponding to the breakpoint locations between two recombination junctions. A neighbor-joining (NJ) phylogenetic tree was reconstructed under an HKY85 correction within Geneious for each alignment segment. All phylogenetic trees were visualized in FigTree v.1.4.3 (http://tree.bio.ed.ac.uk/software/figtree). Sequences were classified as “consistent” if all segments branched with the subtype references predicted by SimPlot. Sequences were classified as “inconsistent” if one or more segments did not group with the subtype references predicted by SimPlot, and further analyses were conducted.
Resolving discrepancies between recombination and phylogenetic results
To resolve discrepancies between SimPlot and phylogenetic analysis, three new segmented alignments were generated for each inconsistent sequence (Supplementary Fig. S1B). The new alignments were segmented relative to the inconsistent queried region: (1) midpoint of the inconsistent queried region and extended 50 bp into the 5′ direction of the next phylogenetically confirmed region segment; (2) midpoint of the inconsistent queried region and extended 50 bp into the 3′ direction of the next phylogenetically confirmed region segment; and/or (3) from the midpoint of inconsistent queried region and extended by 50% of the total queried region segment length in both the 5′ and 3′ directions. In some cases, the extension into the adjacent phylogenetically confirmed region segment was increased to either 100 or 150 bp to improve the phylogenetic signal. NJ trees were inferred for each of the three new segmented alignments and visualized with FigTree. All resolved discrepancies initially observed between the recombination and phylogenetic results underwent a validation stage before finalizing the recombinant mosaic.
Validation for the resolution of prior found recombinant discrepancies
For each inconsistent sequence, additional testing with SimPlot was performed after phylogenetic analysis. All additional SimPlot analyses were carried out with window sizes of 400, 600, and 1,000 bp and a constant step size of 10 bp. Reference sequences from different subtypes were also used to reduce background noise (e.g., subtype B-containing sequences, SimPlot analyses had parent references set to: A/C/D, A/C/B, B/F2/A, and B/C/D). NJ trees were generated as described previously to validate the new subtype assignments. The final resolved recombinant mosaic depicting the putative subtype-specific segments was generated using the Recombinant HIV-1 Drawing Tool (www.hiv.lanl.gov/content/sequence/DRAW_CRF/recom_mapper.html).
Analysis of small recombinant regions
Maximum likelihood (ML) trees were inferred in cases where sequences exhibited recombinant segments <350 bp. ML trees were inferred using PhyML 2.2.315 in Geneious using the F81+G model of nucleotide substitution. Among-site rate variation was modeled using the gamma distribution with alpha set at 0.5. Initial branch support using bootstrapping was assessed but proved computationally exhaustive; therefore, the aLRT chi-squared model16 was employed instead. All reconstructed phylogenies were visualized in FigTree.
Results
Identified pure subtypes and recombinants
Two hundred and seventy-five near full-length HIV-1 sequences from Rakai, Uganda, were analyzed for recombination (Fig. 1, GenBank accession numbers MN694970 to MN695026 and MN650370 to MN650586). We identified 125 sequences as pure subtype, whereas 150 sequences required further investigation. Thirty-nine of these unassigned sequences were subsequently classified as a pure subtype by two alternative methods, whereas 111 sequences were designated as putative recombinants by SimPlot. Putative recombinant sequences were then examined to determine if they contained recombinant regions <350 bp, if so, a ML analysis was further carried out, which resulted in three resolved pure subtypes.
FIG. 1.

Flowchart depicting the analysis of near full-length HIV-1 sequences from Rakai, Uganda, using recombination software and phylogenetic inference. All sequences were initially screened with HIV COMET and categorized as either a pure subtype or “unassigned” sequence using prediction results from HIV COMET, whereby the latter underwent detailed recombination analysis. At each stage of the recombination analysis, there was the potential for pure subtypes to be identified. In the end, there were two categories, pure subtypes that were subdivided into subtypes A, D, and C, and recombinants that were subdivided into six groups: AD, AC, ACD, DC, DG, and DAK.
Overall, the majority of sequences were identified as pure subtypes (60.7%, 167/275), whereas 39.3% were identified as recombinants (108/275). Of the pure subtypes, subtypes D (38.6%, 106/275), A (19.3%, 53/275), and C (2.9%, 8/275) were identified. An NJ tree, which included all pure subtype sequences, demonstrated grouping with the predicted subtype (Supplementary Fig. S2). All pure subtype A sequences grouped with the A1 clade except for one (A111597R15S_7032013), which grouped with the A3 clade (Supplementary Fig. S3A). For pure subtype D sequences, all individuals grouped with the D1 clade (Supplementary Fig. S3B).
Among the 275 sequences, 33 were recombinant forms, which grouped into 6 “classes”: AD (n = 13), AC (n = 3), ACD (n = 11), DC (n = 4), DG (n = 1), and DAK (n = 1). A complete list with HXB2 coordinates is provided (Supplementary File 1). Sequences in the recombinant AD class were diverse with respect to order and frequency of subtypes found in the genomes (e.g., AD, DA, ADA, DAD) and were 29.8% (82/275) among all sequences. One AD recombinant sequence (NEURO_E096303_8102013) was unique, with eight crossover events appearing in the genome, resulting in an ADADADADA subtype designation (Supplementary File 1) with gag, pol, and vif regions exhibiting mixtures of subtypes A and D; and most of vpu and env designated as subtype A. Altogether, a total of 12 URFs were identified.
Detection of a potential new HIV-1 CRF in Rakai, Uganda
Among the identified recombinants (n = 108), 17 sequences were the DAD recombinant form; of these, 7 sequences had similar breakpoint patterns. Additional sequence coverage (HXB2 coordinates: 803–9190) that spanned into the nef region was explored in these seven sequences without excising the high insertion/deletion regions. We found that five of these sequences had comparable breakpoints with a subtype D-A juncture at HXB2 6760 (±270 bp) and D-A juncture 8709 (±115 bp) (Fig. 2). However, when NJ trees were reconstructed with the five sequences, they did not group together, thus not suggesting a new CRF (Supplementary Fig. S4).
FIG. 2.

Identification of the potential CRF, D-A-D. (A) Representative genome map of the five sequences found to have similar breakpoint patterns. The genome numbers are based on HXB2-coordinates. The mosaic map was generated using the Recombinant HIV-1 Drawing Tool (www.hiv.lanl.gov/content/sequence/DRAW_CRF/recom_mapper.html). (B) Phylogenetic analysis of mosaic segments in order: subtype D (left), subtype A (middle), and subtype D (right). Phylogenetic trees were reconstructed by the NJ method in Geneious with the HKY85 correction. The queried sample is highlighted in blue. Reference sequence names were truncated for visualization (CD, Democratic Republic of Congo; CM, Cameroon; KE, Kenya; TZ, Tanzania; UG, Uganda; ZA, Zambia), and subtypes D and A branches are colored to match the mosaic. CRF, circulating recombinant form; NJ, neighbor-joining.
Confidence assessment for minimal recombinant region length
The SimPlot analysis suggested that five sequences contained smaller recombinant regions (<350 bp). To determine if these smaller regions could be supported phylogenetically, we inferred ML trees for each segment alignment based on the predicted breakpoints in SimPlot (Supplementary Fig. S5A–E). In all ML trees, the queried sequence grouped with the predicted subtype that was identified by SimPlot with branch support >0.90. In the particular case of G107265R16, the segmented region of 48 bp was located in the gp120 region of env before V1 (Supplementary Fig. S5E). Furthermore, there was disagreement between the NJ and ML topologies in the G107265R16 sequence where SimPlot and ML analysis suggested that the recombinant region was subtype D, whereas in the NJ analysis, the query sequence of 48 bp branched with subtype A.
To address a cutoff that could be used in our analysis for assessing the observation of recombinant regions of short lengths, we examined the relationship between segment length and aLRT chi-squared branch support for 20 fragmented sequences (5 individuals) (Fig. 3). All sequence segments >200 bp in length (n = 12) grouped with their respective reference subtype with high support (>0.98). Of the sequence segments <200 bp in length, four sequence segments grouped with the reference subtype with branch support >0.98, whereas four sequence segments grouped with the reference subtype with support values ranging from 0.90 to 0.97. Due to the minor observable shift in distribution around 200 bp, we excluded recombinant regions smaller than 200 bp as the cutoff in these analyses. This affected the five individuals with small recombinant size fragments, resolving three of them as a pure subtype in our overall analysis.
FIG. 3.
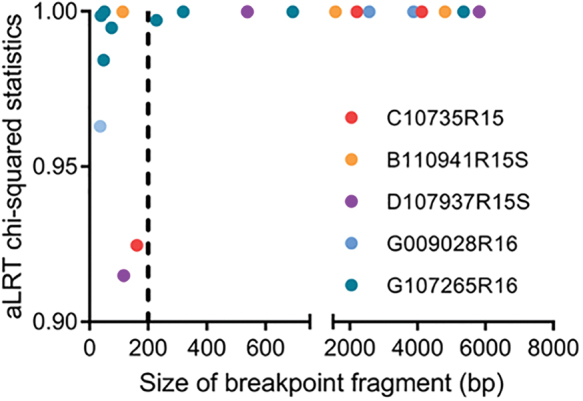
Recombinant fragment size correlation with aLRT chi-squared branch support. Five individuals had recombinant regions <350 bp. Each individual is color-coded. The most immediate node of the branch for the query was selected for the branch support. aLRT statistics varied when breakpoint fragments were <200 bp (left of the dotted line). Recombinant size fragments >200 bp (right of the dotted line) were accepted for recombination analysis. bp, base pair.
Discussion
We examined 275 near full-length HIV-1 sequences and described the frequency of HIV-1 sequence subtype in Rakai, Uganda. Most of the examined sequences were classified as pure subtype D, A, or C (60.7%, 167/275). A proportion of the “unassigned” sequences during initial recombinant analysis (28%, 42/150) were, after further analysis, classified as pure subtype D, A, or C. While some recombinant strains were only observed once, the most frequent recombinant form (DAD) was observed in 17 individuals. When recombinant sequences were categorized into “classes,” AD recombinants (forms: AD, DA, ADA, DAD, etc.) were observed in 82 individuals, comprising nearly 30% of the entire study population. Within Rakai, subtype D is the most prominent subtype with an increasing number of subtype A infections17; therefore, the finding of a diverse mixing of subtypes A and D was expected.15
Harris et al.18 examined the frequency of pure subtypes and recombinants in Rakai using near full-length HIV-1 sequencing from 46 individuals. Compared with the data obtained in the Harris et al.18 study from 1998–1999 to the current study (2011–2015), the net change in pure subtypes was a decrease in subtype D (−15.5%) and an increase in subtype A (+4.3%). In 1998–1999, pure subtype C was not detected, possibly due to undersampling in the original Harris et al. study18; whereas in the current study, both subtype C-containing recombinants and subtype C sequences were observed. We found an increase in the frequency of pure subtype C (+2.9%) and subtype C-containing recombinants (+1.7%). It has been proposed that the introduction of subtype C into Rakai originated from neighboring Tanzania19,20; however, in the current study, pure subtype C sequences group phylogenetically with sequences from Kenya (Supplementary Fig. S6). Additional near full-length pure subtype C sequences from Rakai will need to be isolated to determine if other geographic regions have had a contribution to the introduction of subtype C in Rakai, Uganda.
We also observed a modest rise in subtype A (+4.3%) with a corresponding decrease in subtype D as reported in this population with much smaller HIV-1 domains, gp41 and p24.17,21 While the frequency of subtype D decreased since the initial report of Harris et al.,18 the diversity within the recombinant sequence population has also changed. For example, we identified novel recombinants such as DAK, DG, and CB, which were not previously observed. Thus, even though the frequency of the predominant subtype D decreased over the span of 14 years, the overall diversity of HIV-1 has continued to evolve in Rakai. A recent analysis study of 200 sequences from Mbarara from 2005 to 2010,22 ∼130 km west of Rakai, found a similar composition of recombinant forms with a net difference between Mbarara to Rakai in AC (−1.8%) and AD (−3.7%) (Supplementary Table S3). Whereas in pure subtypes, the net difference between Mbarara and Rakai in subtype D (−12.8%), subtype A (+19.6%) and a minimal difference in subtype C (+0.4%) (Supplementary Table S3). While there are some observed changes, it would appear that Mbarara and Rakai are partially similar in their pure subtype and recombinant diversity.
In this study, we also identified five potentially new CRFs with the mosaic subtype structure DAD. Further phylogenetic analysis revealed that while these sequences shared similar breakpoints, a phylogenetic approach demonstrated that the derivative subtype virus involved in recombination was not consistent between sequences. This was further highlighted by the one sequence (F087403R15S) being basal to the subtype D (-and B) clades from the end of env and into nef. Nevertheless, the DAD recombinant had a unique structure with subtype D from gag to the beginning of env, switching to subtype A for the majority of env, then crossing back to subtype D in the nef region. A previous study suggested that subtype A is more transmissible23 and subtype D is associated with increased pathogenesis,24,25 with a more frequent tropism switch from R5 to X4 virus26 and more rapid depletion of CD4+ T lymphocytes.27 If in fact, the subtype A or D env gene is responsible for decreased or increased progression, respectively, then these newly identified recombinant forms may continue to accumulate in the region, as this recombinant might maximize replication capacity and transmission while minimizing pathogenicity.
One potential limitation in recombination studies is that some sequences may contain small recombinant regions from multiple recombinant breakpoint events that are difficult to subtype. While studies have identified potential hotspots for HIV-1 recombination to occur,28,29 the minimal sequence length required to calculate a recombinant breakpoint within HIV-1 has not been well established or widely accepted. Online HIV subtyping tools such as the REGA Institute's HIV Subtyping Tool (www.bioafrica.net/subtypetool/html/subtypinghiv.html) and Luxembourg Institute of Health's HIV COMET (https://comet.lih.lu) use 800 bp as their required threshold to accurately determine subtype. In theory, a larger region is more likely to undergo recombination with another HIV-1 strand. However, in our analyses, several sequences demonstrated putative recombinant regions less that were smaller than 350 bp and were confirmed phylogenetically with strong branch support (>0.90). However, when the length of the sequence was >200 bp, there was an observable shift in the distribution of aLRT chi-squared values (>0.98). While the differences in branch support that are being distinguished here are minor, they imply that a robust branch support for smaller fragments in ML-based analyses using aLRT chi-squared values for branch support, additional variables that affect phylogenetic signal (i.e., rate heterogeneity) may play a large role.
Putative small recombinant regions can be difficult to identity, as we demonstrated in one sequence (G107265R16) where the phylogenetic topology disagreed significantly (0.95 branch support) between the NJ and ML trees. While NJ and ML reconstruction differ in their approach, in this case, the query sample grouped with either the subtype A (NJ) or the subtype D (ML). This was a clear example that the shorter a recombinant region became the integrity of the tree topology could be severely affected. Taken in combination with the distribution of branch support values and topological variances observed, we decided to enforce a cutoff for our analyses in recombinant segments <200 bases. An issue with small recombinant segments is their potential for being distributed throughout the HIV-1 genome, which may also relate to functionality. For example, if the segment is located in the reverse transcriptase gene, then the replication capacity might be more reflective of that subtype; however, if it exists in a hypervariable region of env, then its function will be less linked to its predicted subtype. Unfortunately, until more sophisticated software tools are developed to improve the limitation of unresolved small breakpoint fragments or a cutoff for analyses is widely accepted, HIV recombination analyses will remain problematic.
In summary, we performed subtype analyses on 275 near full-length HIV-1 sequences from the PANGEA-HIV consortium that were isolated from Rakai, Uganda. Any subtypes that were not pure were analyzed in a variety of tests to identify the nature of the genomic recombinant structure and the location of recombinant segments. With these data, we assessed the dynamic changes in prevalence of subtypes and recombinants in near full-length HIV sequences over the past 14 years in the Rakai. While it is well known that the length of the recombinant segment can limit the ability of the available tools to successfully predict HIV-1 subtype, for these analyses, we suggest a procedure to determine a cutoff of recombinant size fragments with reasonable confidence. Finally, we potentially identified a newly CRF among five epidemiologically unlinked individuals; the unique genetic organization of this recombinant may enable it to become established in Rakai, Uganda. Accordingly, the importance of these subtype studies is warranted to understand the complex evolution of HIV-1.
Supplementary Material
Acknowledgments
We would like to thank the participants and staff of the Rakai Health Sciences Program. The PANGEA consortium consists of: Lucie Abeler-Dörner,1 Helen Ayles,2,3 David Bonsall,1 Rory Bowden,4 Vincent Calvez,5 Myron Cohen,6 Ann Denis,7 Daniel Frampton,8 Tulio de Oliveira,9,10 Max Essex,11,12 Sarah Fidler,13 Christophe Fraser,1 Tanya Golubchik,1 Mary Kathryn Grabowski,14 Richard Hayes,15 Joshua T Herbeck,16 Anne Hoppe,8 Joseph Kagaayi,17 Pontiano Kaleebu,18 Paul Kellam,19,20 Cissy Kityo,21 Andrew Leigh-Brown,22 Jairam R Lingappa,23 Vladimir Novitsky,12 Nick Paton,24,25 Deenan Pillay,8,26 Thomas C Quinn,27,28 Andrew Rambaut,22 Oliver Ratmann,29,30 Janet Seeley,26,31 Deogratius Ssemwanga,18 Frank Tanser,26,32–34 and Maria J Wawer14
1Big Data Institute, Li Ka Shing Centre for Health Information and Discovery, Nuffield Department of Medicine, University of Oxford, Oxford, UK
2Clinical Research Department, Infectious and Tropical Diseases, London School of Hygiene & Tropical Medicine, London, UK
3Zambart, University of Zambia, Lusaka, Zambia
4Wellcome Trust Centre for Human Genetics, University of Oxford, Oxford, UK
5Institut Camille Jordan, Université de Lyon, Université Claude Bernard, CNRS UMR 5208, Lyon, France
6UNC School of Medicine, Institute for Global Health & Infectious Diseases, Chapel Hill, NC, USA
7Division of Infectious Diseases, University of North Carolina at Chapel Hill, Chapel Hill, NC, USA
8Division of Infection and Immunity, University College London, London, UK
9KwaZulu-Natal Research Innovation and Sequencing (KRISP), College of Health Sciences, Durban, South Africa
10School of Laboratory Medicine and Medical Sciences, University of KwaZulu-Natal, Durban, South Africa
11Research Laboratory, Botswana Harvard AIDS Institute Partnership, Gaborone, Botswana
12Department of Immunology and Infectious Diseases, Harvard T.H. Chan School of Public Health, Boston, MA, USA
13St Mary's Hospital and Imperial College London, London, UK
14Department of Epidemiology, Johns Hopkins Bloomberg School of Public Health, Rakai Health Sciences Program, Baltimore, MD, USA
15Department of Infectious Disease Epidemiology, London School of Hygiene & Tropical Medicine, London, UK
16Department of Global Health, University of Washington, Seattle, WA, USA
17Rakai Health Sciences Program, Kalisizo, Uganda
18Medical Research Council/Uganda Virus Research Institute and London School of Hygiene & Tropical Medicine Uganda Research Unit, Entebbe, Uganda
19Department of Infection and Immunity, Imperial College London, London, UK
20Kymab Ltd, Babraham Research Campus, Cambridge, UK
21Joint Clinical Research Centre, Kampala, Uganda
22Institute of Evolutionary Biology, University of Edinburgh, Edinburgh, UK
23Departments of Global Health, Medicine and Pediatrics, University of Washington, Seattle, WA, USA
24The MRC Clinical Trials Unit at UCL, University College London, London, UK
25Department of Medicine, National University of Singapore, Singapore
26Africa Health Research Institute, KwaZulu-Natal, South Africa
27Laboratory of Immunoregulation, NIAID, NIH, Baltimore, MD, USA
28Department of Medicine, Johns Hopkins School of Medicine, Baltimore MD, USA
29Department of Mathematics, Imperial College London, London, UK
30Department of Infectious Disease, Epidemiology School of Public Health, Imperial College London, London, UK
31London School of Hygiene and Tropical Medicine, London, UK
32Department of Epidemiology & Harvard Center for Population and Development Studies, Harvard T.H. Chan School of Public Health, Boston, MA, USA
33Lincoln Institute for Health, University of Lincoln, Lincoln, UK
34Centre for the AIDS Programme of Research in South Africa (CAPRISA), University of KwaZulu-Natal, KwaZulu-Natal, South Africa.
Contributor Information
Collaborators: for the Rakai Health Sciences Program and the PANGEA Consortium, Lucie Abeler-Dörner, Helen Ayles, David Bonsall, Rory Bowden, Vincent Calvez, Myron Cohen, Ann Denis, Daniel Frampton, Tulio de Oliveira, Max Essex, Sarah Fidler, Christophe Fraser, Tanya Golubchik, Richard Hayes, Joshua T Herbeck, Anne Hoppe, Pontiano Kaleebu, Paul Kellam, Cissy Kityo, Andrew Leigh-Brown, Jairam R Lingappa, Vladimir Novitsky, Nick Paton, Deenan Pillay, Andrew Rambaut, Oliver Ratmann, Janet Seeley, Deogratius Ssemwanga, and Frank Tanser
Author Disclosure Statement
No competing financial interests exist.
Funding Information
The Bill & Melinda Gates Foundation (OPP1175094, OPP1084362) supported this study. Division of Intramural Research, National Institute of Allergy and Infectious Diseases (NIAID), National Institutes of Health (NIH) provided additional support. NIH grants that supported this work were: R01AI110324, U01AI100031, U01AI075115, R01AI110324, R01AI102939, K01AI125086-01, NIAID; R01MH107275 National Institute of Mental Health; RO1HD070769, R01HD050180 National Institute of Child Health and Development. The World Bank, the Doris Duke Charitable Foundation, the Johns Hopkins University Center for AIDS Research P30AI094189), and the President's Emergency Plan for AIDS Relief through the Centers for Disease Control and Prevention (NU2GGH000817) also provided support. The findings and conclusions in this report are those of the authors and do not represent the official position of the funding agencies.
Supplementary Material
References
- 1. Hemelaar J, Elangovan R, Yun J, et al. : Global and regional molecular epidemiology of HIV-1, 1990–2015: A systematic review, global survey, and trend analysis. Lancet Infect Dis 2019;19:143–155 [DOI] [PubMed] [Google Scholar]
- 2. Yamaguchi J, McArthur C, Vallari A, et al. : Complete genome sequence of CG-0018a-01 establishes HIV-1 subtype L. J Acquir Immune Defic Syndr J Acquir Immune Defic Syndr 2020;83:319–322 [DOI] [PMC free article] [PubMed] [Google Scholar]
- 3. Desire N, Cerutti L, Le Hingrat Q, et al. : Characterization update of HIV-1 M subtypes diversity and proposal for subtypes A and D sub-subtypes reclassification. Retrovirology 2018;15:80. [DOI] [PMC free article] [PubMed] [Google Scholar]
- 4. Robertson DL, Anderson JP, Bradac JA, et al. : HIV-1 nomenclature proposal. Science 2000;288:55–56 [DOI] [PubMed] [Google Scholar]
- 5. Smyth RP, Davenport MP, Mak J: The origin of genetic diversity in HIV-1. Virus Res 2012;169:415–429 [DOI] [PubMed] [Google Scholar]
- 6. Serwadda D, Mugerwa RD, Sewankambo NK, et al. : Slim disease: a new disease in Uganda and its association with HTLV-III infection. Lancet 1985;2:849–852 [DOI] [PubMed] [Google Scholar]
- 7. Conroy SA, Laeyendecker O, Redd AD, et al. : Changes in the distribution of HIV type 1 subtypes D and A in Rakai District, Uganda between 1994 and 2002. AIDS Res Hum Retroviruses 2010;26:1087–1091 [DOI] [PMC free article] [PubMed] [Google Scholar]
- 8. Grabowski MK, Serwadda DM, Gray RH, et al. : HIV prevention efforts and incidence of HIV in Uganda. N Engl J Med 2017;377:2154–2166 [DOI] [PMC free article] [PubMed] [Google Scholar]
- 9. Ratmann O, Grabowski MK, Hall M, et al. : Inferring HIV-1 transmission networks and sources of epidemic spread in Africa with deep-sequence phylogenetic analysis. Nat Commun 2019;10:1411. [DOI] [PMC free article] [PubMed] [Google Scholar]
- 10. Gall A, Ferns B, Morris C, et al. : Universal amplification, next-generation sequencing, and assembly of HIV-1 genomes. J Clin Microbiol 2012;50:3838–3844 [DOI] [PMC free article] [PubMed] [Google Scholar]
- 11. Wymant C, Blanquart F, Golubchik T, et al. : Easy and accurate reconstruction of whole HIV genomes from short-read sequence data with shiver. Virus Evol 2018;4:vey007. [DOI] [PMC free article] [PubMed] [Google Scholar]
- 12. Ratmann O, Hodcroft EB, Pickles M, et al. : Phylogenetic tools for generalized HIV-1 epidemics: Findings from the PANGEA-HIV methods comparison. Mol Biol Evol 2017;34:185–203 [DOI] [PMC free article] [PubMed] [Google Scholar]
- 13. Kearse M, Moir R, Wilson A, et al. : Geneious Basic: An integrated and extendable desktop software platform for the organization and analysis of sequence data. Bioinformatics 2012;28:1647–1649 [DOI] [PMC free article] [PubMed] [Google Scholar]
- 14. Lole KS, Bollinger RC, Paranjape RS, et al. : Full-length human immunodeficiency virus type 1 genomes from subtype C-infected seroconverters in India, with evidence of intersubtype recombination. J Virol 1999;73:152–160 [DOI] [PMC free article] [PubMed] [Google Scholar]
- 15. Guindon S, Dufayard J-F, Lefort V, Anisimova M, Hordijk W, Gascuel O: New algorithms and methods to estimate maximum-likelihood phylogenies: Assessing the performance of PhyML 3.0. Syst Biol 2010;59:307–321 [DOI] [PubMed] [Google Scholar]
- 16. Hordijk W, Gascuel O: Improving the efficiency of SPR moves in phylogenetic tree search methods based on maximum likelihood. Bioinformatics 2005;21:4338–4347 [DOI] [PubMed] [Google Scholar]
- 17. Collinson-Streng AN, Redd AD, Sewankambo NK, et al. Geographic HIV type 1 subtype distribution in Rakai district, Uganda. AIDS Res Hum Retroviruses 2009;25:1045–1048 [DOI] [PMC free article] [PubMed] [Google Scholar]
- 18. Harris ME, Serwadda D, Sewankambo N, et al. : Among 46 near full length HIV type 1 genome sequences from Rakai District, Uganda, subtype D and AD recombinants predominate. AIDS Res Hum Retroviruses 2002;18:1281–1290 [DOI] [PubMed] [Google Scholar]
- 19. Njai HF, Ewings FM, Lyimo E, et al. : Deciphering the complex distribution of human immunodeficiency virus type 1 subtypes among different cohorts in Northern Tanzania. PLoS One 2013;8:e81848. [DOI] [PMC free article] [PubMed] [Google Scholar]
- 20. Herbinger K-H, Gerhardt M, Piyasirisilp S, et al. : Frequency of HIV type 1 dual infection and HIV diversity: Analysis of low- and high-risk populations in Mbeya Region, Tanzania. AIDS Res Hum Retroviruses 2006;22:599–606 [DOI] [PubMed] [Google Scholar]
- 21. Blanquart F, Grabowski MK, Herbeck J, et al. : A transmission-virulence evolutionary trade-off explains attenuation of HIV-1 in Uganda. Elife 2016;5 pii: [DOI] [PMC free article] [PubMed] [Google Scholar]
- 22. Lee GQ, Bangsberg DR, Mo T, et al. : Prevalence and clinical impacts of HIV-1 intersubtype recombinants in Uganda revealed by near-full-genome population and deep sequencing approaches. AIDS 2017;31:2345–2354 [DOI] [PMC free article] [PubMed] [Google Scholar]
- 23. Kiwanuka N, Laeyendecker O, Robb M, et al. : Effect of human immunodeficiency virus Type 1 (HIV-1) subtype on disease progression in persons from Rakai, Uganda, with incident HIV-1 infection. J Infect Dis 2008;197:707–713 [DOI] [PubMed] [Google Scholar]
- 24. Kiguoya MW, Mann JK, Chopera D, et al. : Subtype-specific differences in Gag-protease-driven replication capacity are consistent with intersubtype differences in HIV-1 disease progression. J Virol 2017;91 pii: [DOI] [PMC free article] [PubMed] [Google Scholar]
- 25. Ng OT, Laeyendecker O, Redd AD, et al. : HIV type 1 polymerase gene polymorphisms are associated with phenotypic differences in replication capacity and disease progression. J Infect Dis 2014;209:66–73 [DOI] [PMC free article] [PubMed] [Google Scholar]
- 26. Church JD, Huang W, Mwatha A, et al. : HIV-1 tropism and survival in vertically infected Ugandan infants. J Infect Dis 2008;197:1382–1388 [DOI] [PubMed] [Google Scholar]
- 27. Kaleebu P, Nankya IL, Yirrell DL, et al. : Relation between chemokine receptor use, disease stage, and HIV-1 subtypes A and D: Results from a rural Ugandan cohort. J Acquir Immune Defic Syndr 2007;45:28–33 [DOI] [PubMed] [Google Scholar]
- 28. Smyth RP, Schlub TE, Grimm AJ, et al. : Identifying recombination hot spots in the HIV-1 genome. J Virol 2014;88:2891–2902 [DOI] [PMC free article] [PubMed] [Google Scholar]
- 29. Song H, Giorgi EE, Ganusov VV, et al. : Tracking HIV-1 recombination to resolve its contribution to HIV-1 evolution in natural infection. Nat Commun 2018;9:1928. [DOI] [PMC free article] [PubMed] [Google Scholar]
Associated Data
This section collects any data citations, data availability statements, or supplementary materials included in this article.