

Abstract
Cryo-EM has become one of the prime methods for protein structure elucidation, frequently yielding density maps with near-atomic or medium resolution. If protein structures cannot be deduced unambiguously from the density maps, computational structure refinement tools are needed to generate protein structural models. We have previously developed an iterative Rosetta-MDFF protocol that used cryo-EM densities to refine protein structures. Here we show that, in addition to cryo-EM densities, incorporation of other experimental restraints into the Rosetta-MDFF protocol further improved refined structures. We used NMR chemical shift (CS) data integrated with cryo-EM densities in our hybrid protocol in both the Rosetta step and the molecular dynamics (MD) simulations step. In 15 out of 18 cases for all MD rounds, the refinement results obtained when density maps and NMR chemical shift data were used in combination outperformed those of density map-only refinement. Notably, the improvement in refinement was highest when medium and low-resolution density maps were used. With our hybrid method, the RMSDs of final models obtained were always better than the RMSDs obtained by our previous protocol with just density refinement for both medium (6.9 Å) and low (9 Å) resolution maps. For all the six test proteins with medium resolution density maps (6.9 Å), the final refined structure RMSDs were lower for the hybrid method than for the cryo-EM only refinement. The final refined RMSDs were less than 1.5 Å when our hybrid protocol was used with 4 Å density maps. For four out of the six proteins the final RMSDs were even less than 1 Å. This study demonstrates that by using a combination of cryo-EM and NMR restraints it is possible to refine structures to atomic resolution, outperforming single restraint refinement. This hybrid protocol will be a valuable tool when only low-resolution cryo-EM density data and NMR chemical shift data are available to refine structures.
Keywords: protein structure prediction, protein structure refinement, molecular dynamics simulations, cryo-EM density maps, NMR chemical shifts, PLUMED, hybrid protocols, MDFF, structure validation, Rosetta refinement
Graphical Abstract

INTRODUCTION
Being able to determine or predict protein structure is of paramount importance since protein structure determines protein function1, 2. We also rely on macromolecular structure information in structure-based drug design3–5. With known catalytic site structural information, drugs can be designed to bind target proteins implicated in diseases to regulate function and relive symptoms4, 6, 7. Experimental methods of structure determination have made tremendous contributions to our understanding of protein structure. X-ray crystallography and NMR have historically been the two most popular and widely used experimental methods of structure determination8, 9. The majority of the protein structures available in the PDB are X-ray crystal structures. In NMR spectroscopy distance restraints of proximal atoms are obtained and have been utilized to elucidate almost 13,000 protein structures10. Cryo-electron microscopy (cryo-EM) is another increasingly popular technique to determine macromolecular structures11–15. Cryo-EM is continuing to revolutionize the field of structural biology and was also worthy of a recent noble prize award11, 16, 17.
Despite their successes, there are some caveats associated with experimental structure determination as well. Experimental methods of protein structure determination are expensive, time consuming and have technical difficulties associated with them18. For example, in order to obtain X-ray diffraction patterns of a protein, that protein first needs to be in crystal form18, which can be challenging particularly for flexible proteins. NMR is mostly limited to small proteins although there are exceptions19. In cryo-EM, flexible protein regions are commonly not resolved in the densities and it is still oftentimes challenging to obtain side chain atom coordinates. For example, receptor binding pocket side-chain residues are frequently not explicitly defined in cryo-EM density maps20. Therefore, in order to supplement experimental structure determination, computational methods are valuable tools for prediction of protein structure and function. Computational tools are used routinely in understanding protein structure and in bridging the sequence-structure gap that is continuously increasing21.
Some computational methods are designed to predict structures solely based on sequence (ab initio predictions). Some of the software that is commonly used in ab initio structure prediction are Rosetta, I-TASSER, QUARK and MODELLER22–25. Experimental restraints are used extensively in protein structure prediction and refinement26–29. Many different types of experimental restraints have been used. Cryo-EM densities30–36, NMR chemical shifts37, 38 and NOE data39, 40, EPR41, 42, small angle X-ray scattering43, mass spectrometry44–48, fluorescence energy transfer microscopy (FRET)49 have successfully been used as restraints in structure prediction and refinement. Using sparse experimental data can significantly improve protein structure prediction and refinement methods.
Two methods that can use sparse experimental data in structure prediction and refinement are molecular dynamics simulations and Rosetta. Rosetta is a macromolecular structure modeling software50, 51 and one of the most popular tools used for structure refinement using cryo-EM experimental restraints36, 52. It can use sparse experimental data to predict and refine protein structures42, 53. Cryo-EM density data is used and the regions that least agree with the density maps are identified and rebuilt in an iterative fashion35, 36, 52, 54. Notably, Rosetta can use NMR data in refinement of structures in conjunction with other types of experimental restraints in its structure refinement protocols55. Molecular dynamics (MD) simulations are another computational method frequently used in structure refinement56, 57. Restraints obtained from experiments can be used in these calculations to bias the simulations towards native-like structures. One such experimental data used in molecular dynamics simulations is cryo-EM density data. Cryo-EM density data was first incorporated in molecular dynamics simulations by the Schulten group58. In these molecular dynamics simulations with flexible fitting (MDFF), the cryo-EM density map is converted to an external potential which is added in addition to the standard force field in molecular dynamics simulations. This additional potential function guides the model towards the density map structure. NMR chemical shift data has also been incorporated into molecular dynamics simulations, for example by PLUMED59. In PLUMED an additional force field term is introduced based on the agreement with a set of experimental chemical shift data59. Unlike in MDFF where the cryo-EM density is used as the additional force field in the molecular dynamics simulations, in PLUMED, the difference between the measured and the experimental chemical shift data is used as a linear bias potential to direct the simulations.
In our previous protein structure refinement protocols, we only used cryo-EM density data in refining protein structures60–62. Here, we explored the simultaneous use of cryo-EM density maps and NMR chemical shift data in refining a set of protein structures in an integrated fashion. Cryo-EM density maps and NMR chemical shifts contain complementary information. Previously, these two experimental methods have been integrated to derive atomic structures for the HIV-1 capsid protein C-terminal domain39. In this work, both of these experimental restraints were integrated and applied at the same time to molecular dynamics simulations. Here we went beyond the use of MD simulations by employing an iterative approach where we utilized cryo-EM density maps and NMR chemical shift data in Rosetta refinement and molecular dynamics simulations. Our findings show that the presence of multiple orthogonal experimental restraints further improved the quality of refined structures.
METHODS
Ab initio protein model building
We selected six soluble proteins (5NPG, 2N5B, 2L8O, 2N2T, 2MZJ and 5T1N) with NMR structures deposited in the PDB databank (Table 1). The starting structures that were used as input into the refinement protocol were generated using Rosetta ab initio model building (in the absence of any experimental restraints)63. None of the structures had any missing residues. The number of residues in the starting structures ranged from 82–144. A total of 5000 models for each protein sequence were generated using Rosetta ab initio model building without using any experimental restraints. Rosetta ab initio builds protein structures starting from the sequence by assembling small protein fragments obtained from the PDB63–65. Out of the 5000 models generated for each protein sequence, the lowest Rosetta all atom energy model was selected as the input starting model for our refinement protocols.
Table 1:
The proteins used in this work. The names of the proteins, the number of residues and the ab initio starting model RMSDs are shown. The starting RMSDs are in the range of 4 to 7 Å. All proteins have less than 150 residues.
| PDB ID | Protein name | No. of Residues | Starting RMSD (Å) |
|---|---|---|---|
| 5NPG | Drosophila Melanogaster Loquacious dsRBD1 | 83 | 4.98 |
| 2N5B | Yeast Thioredoxin | 103 | 4.93 |
| 2L8O | Chr148 from Cytophaga hutchinsonii | 144 | 6.56 |
| 2N2T | De novo Designed Protein Target OR303 | 84 | 5.22 |
| 2MZJ | Nop6-RBD from S.Cerevisiae | 82 | 4.98 |
| 5T1N | Phosphocarrier Protein NPr | 85 | 5.12 |
RMSDs of the starting structures generated by Rosetta were calculated using the BCL::Quality program66 using all backbone atoms. The RMSDs of the models selected for each protein were in the 4–7 Å range from the native structure. These starting structures agreed with the native structures in their overall topology and in the arrangement of the secondary structure elements, however, some of the backbone and most of the side chain orientations were not accurate. This starting structure RMSD range is generally the same range that one would get using manual model building into low resolution cryo-EM density data. Alternatively, the starting structures could be generated by combining techniques such as Rosetta, SSEHunter and EM-Fold30–32. The RMSDs of these initial models mimicked the models that are frequently built using other ab initio model building tools and tracing of cryo-EM density maps. The starting structure information and RMSDs are shown in Table 1.
Simulation of density maps
Density maps of all six proteins were generated using the Situs package67. Specifically, Pdb2vol was used to generate volumetric maps of the native protein structures. The voxel spacing used was one third of the desired resolution of the simulated density map. A Gaussian smoothing kernel with amplitude 1 was used. Density maps at three different resolutions were generated (4 Å, 6.9 Å, and 9 Å) using the native NMR representative structures. Voxel spacings of 1.3 Å, 2.3 Å, and 3 Å, respectively, were used for 4 Å, 6.9 Å and 9 Å resolution density maps. Higher resolution maps (4 Å) showed backbone details of structures as well as some of the side chain details. Medium resolution (6.9 Å) and low-resolution maps (9 Å) did not resolve side chain and backbone coordinates.
Cryo-EM density and chemical shift guided Rosetta-MD (Hybrid protocol)
The initial starting models for the protocols were obtained using Rosetta ab initio model building without using any experimental restraints. In the new hybrid protocol three iterative rounds of Rosetta-MDFF were performed guided by both CS data and cryo-EM density data (Figure 1).
Figure 1:

Schematic diagram illustrating the two structure refinement protocols used in this study. The initial models that were inputted to the protocols were obtained using Rosetta ab initio model building without using any experimental restraints. In the first protocol which is the same protocol used in our previous publication, three rounds of Rosetta-MDFF were run iteratively without using any chemical shift information. Only cryo-EM density data was used in this refinement. In the new hybrid protocol three rounds of Rosetta-MDFF were performed using both chemical shift data and cryo-EM density data. The final models were obtained after the last round of Rosetta and validated by their chemical shift agreement using the ShiftX2 program. The chemical shift data was used in molecular dynamics simulations with the PLUMED program which was integrated into the MD flexible fitting algorithm. In the Rosetta steps of the protocol, chemical shifts were used in picking the fragments in the model building step.
After each round of MDFF simulation the final frame obtained was inputted into the next Rosetta refinement step. Out of all the models generated during the Rosetta step, a model was picked based on the fit of the model to the density map. This model was used as input into the next MDFF step. After three Rosetta-MDFF iterations, the final models were obtained after the third round of the Rosetta refinement step. CS-based fragments were used in the Rosetta model building steps. The final models obtained after the third round of Rosetta were validated by their chemical shift agreement using the ShiftX2 program. The chemical shift data was used in molecular dynamics simulations using the PLUMED program that was integrated into MD flexible fitting algorithm. Different MDFF simulations corresponding to different PLUMED weights were run in order to incorporate chemical shift data. From all the simulations corresponding to different PLUMED weights, the best fit-to-density final model out of all final frames was used in the next Rosetta round (explained in more detail in the Results and Discussion section). For comparison, the protocol was also run without using any NMR chemical shift information exactly as in our previous publication. Only cryo-EM density data was used in this refinement60.
Experimental chemical shifts for backbone and side chain heavy atoms (Cα, Cβ, C and N) and backbone hydrogens (Cα-H, N-H) were used. NMR chemical shift data for each of the proteins was obtained from the PDB databank. If experimental chemical shift data for a certain residue was missing, these residues were ignored when calculating chemical shifts and the data for these atoms were not considered. For chemical shift biasing, the simulations were guided by the reference experimental chemical shifts towards the experimental native reference structure. After each time step, the chemical shifts were calculated using Almost (CS2BACKBONE)59. The difference between the measured and the experimental shift (current deviation) was applied as a linear potential with a slope (hereafter called the PLUMED weight) using PLUMED59.
The MD simulations were biased using both the experimental chemical shift data and the simulated cryo-EM density maps. The chemical shift biased molecular dynamic simulations were performed using PLUMED59. Cryo-EM density data was incorporated using molecular dynamics flexible fitting (MDFF)68. In MDFF a potential corresponding to the density map is applied during the simulations to guide the structure towards the density map structure. In our hybrid protocol, chemical shift-based biasing and the potential corresponding to the density map were both integrated and applied at the same time. The density map was converted into a potential function that can be read by the MDFF simulations using mdff griddx. Particle Mesh Ewald (PME) was used with periodic boundary conditions in each simulation. A local interaction distance cutoff of 12 Å was used for van der Waals and electrostatic calculations. The simulation pairlistdist and nonbondedFreq were set to 13.5 and 1 Å. In our previous publications we showed that the default scaling factor of 0.2 does well overall for most of the test cases60. Therefore we used the default density scaling factor of 0.2 in this study. For molecular dynamics simulations NAMD 2.10 with CHARMM22 force field was used. The MDFF package ssrestraints was used to apply restraints to enforce that secondary structures were maintained. All simulations were run at a 300 K simulation temperature for 1 ns.
The simulations were run at the following PLUMED bias weights: 0.0001, 0.0005, 0.001, 0.005, 0.01 and 0.05. After each simulation, the last frame was extracted. The fit-to-density of each of the last frames was calculated using Rosetta density-tools54, to measure the model-map agreement for all the different PLUMED bias weight simulations. In previous work we observed a correlation of high fit-to-density values and native-like structures60. The best fit-to-density model (corresponding to one PLUMED bias weight) was used in the subsequent Rosetta step in each case.
During the Rosetta refinement step, regions that least agree with the density map were identified and rebuilt. Amino acid sequence fragments (three-residue and nine residue) were generated using the Robetta server based on the fasta sequence of the target protein69. The chemical shift information for the target protein was also used as input when generating fragment files70. These fragments were subsequently used in Rosetta ab initio structure prediction. Usage of chemical shift-filtered fragments led to a targeted reduction of the protein structure search space.
During each Rosetta step of the hybrid protocol a total of 5000 independent models were generated. RMSDs of each model were again calculated using BCL::Quality program. The fit-to-density score of each model was calculated using Rosetta density tools. This score gives an indication of how well the models agree with the density map of the native structures. After each Rosetta round the best fit-to-density model was obtained as input to the next MDFF round. Rosetta refinement was performed three times iteratively. After the third round of Rosetta the model picked was considered the final refined model. For comparison purposes, the initial structures were also refined using our previous cryo-EM density guided refinement protocol without using any NMR chemical shift data60.
RESULTS AND DISCUSSION
In this work, we used a combination of cryo-EM density maps and experimental NMR chemical shift (CS) data as restraints in computational protein structure refinement. Restraints from both methods were used in Rosetta and molecular dynamics simulation steps to refine the protein structures. We tested our iterative protocol on six proteins where experimental NMR chemical shift data was available and additionally guided the simulations by cryo-EM density maps of varying resolutions (4 Å, 6.9 Å, and 9 Å). We iteratively applied molecular dynamics and Rosetta refinement over the course of three rounds. Chemical shift data was incorporated into Rosetta in the fragment building step. CS data was also used in molecular dynamics simulations by integrating it directly into the MD flexible fitting algorithm. For each molecular dynamics simulation, two files were given as input for restraining the simulations; the cryo-EM density and NMR chemical shift data. For comparison, we also repeated the protocol without using any NMR chemical shift information, exactly as we did in our previous publication using only cryo-EM density.
During each MD simulation step, six PLUMED weights (0.0001, 0.0005, 0.001, 0.005, 0.01 and 0.05) were used to run six different simulations. The cryo-EM density potential was always applied while running simulations. The simulations tended to get unstable when PLUMED weights of 0.1 or higher were used with the density potential. After each simulation, the fit-to-density of the final frames of the six simulations (corresponding to different PLUMED weights) were calculated. We picked the best model based on the fit-to-density score. Table 2 shows an example of the effect of different PLUMED weights on protein RMSDs and the fit-to-density scores for the last frame in the final round of MDFF for 2L8O. At a PLUMED weight of 0.05, the highest fit-to-density of 0.92 corresponded to the lowest RMSD structure (1.71 Å). A significant improvement was obtained compared to the density-only refinement of 2L8O which yielded a model with an RMSD of 4.26 Å. The average RMSD of all other last frames (generated by non-zero PLUMED weights that did not yield the best fit-to-density) of the simulations corresponding to each PLUMED weight was compared to the best fit-to-density weight RMSD for all benchmark proteins (Figure 2). For MDFF1, MDFF2 and MDFF3 the final frame corresponding to the best fit-to-density was significantly better than the averaged model RMSD obtained for all other PLUMED weights. Out of all the MDFF rounds for all benchmark proteins, the best RMSD model was picked using the fit-to-density score in 89% of the time. There were only two cases for which the model selected by the best fit-to-density score had a slightly higher RMSD than the average of the other models. Even for these two cases this difference in RMSD was not significant. Hence, we used the fit-to-density to select the simulation (i.e. PLUMED weight) that best agreed with the NMR chemical shift data.
Table 2:
The RMSD and fit-to-density of the final frame obtained when different PLUMED weights were used for 2L8O, MDFF3 round. The highest fit-to-density (0.922) corresponded to the lowest RMSD structure (1.71 Å) and showed a significant improvement compared to the density only refinement of 2L8O (RMSD 4.26 Å).
| PLUMED weight | RMSD (Å) | Fit-to-density |
|---|---|---|
| 0 (no PLUMED) | 4.26 | 0.886 |
| 0.0001 | 1.71 | 0.923 |
| 0.0005 | 1.77 | 0.918 |
| 0.001 | 1.9 | 0.915 |
| 0.005 | 1.75 | 0.919 |
| 0.01 | 1.92 | 0.92 |
| 0.05 | 1.71 | 0.922 |
| 0.1 | 1.84 | 0.921 |
Figure 2:

The RMSDs of the models picked based on the best fit-to-density of the model and the average model RMSDs of all other non-zero PLUMED weights for the 6 benchmark proteins. The RMSDs are shown for all the MDFF rounds (MDFF1, MDFF2 and MDFF3). Most of the time the best fit-to-density model is significantly better than the RMSDs corresponding all the other PLUMED weights.
To test the effect of the combined NMR/cryo-EM guided refinement, we also performed three rounds of iterative refinement guided by cryo-EM density maps only for comparison. The RMSDs of the last frame of MDFF1, MDFF2 and MDFF3 simulations when only cryo-EM density maps were used in refinement and when cryo-EM density and NMR chemical shift data were both used in refinement were compared. In each of these steps, 5/6 times using NMR chemical shift data in addition to cryo-EM data yielded better RMSD models (Figure 3). On average, an RMSD improvement of 3.11 Å was observed when a dual NMR/cryo-EM-guided refinement was performed at a map resolution of 6.9 Å. We examined three different density map resolutions (4 Å, 6.9 Å and 9 Å) and the ability of NMR chemical shift data to supplement the density map during refinement. Figure 4 shows the RMSDs for the final models for all three density map resolutions where the refinement was guided by either cryo-EM data or combined cryo-EM/NMR data.
Figure 3:

The RMSDs of the last frame of MDFF1 (a), MDFF2 (b) and MDFF3 (c) simulations when only cryo-EM densities were used in refinement (blue, green, red, respectively) and when cryo-EM density and NMR chemical shift data were both used in refinement (black). The density map resolution used was 6.9 Å. For each of these MDFF rounds, 5/6 times using NMR chemical shift data in addition to cryo-EM data helped identify a better RMSD model.
Figure 4:

The RMSDs after the final Rosetta round obtained for three different density map resolutions (4 Å, 6.9 Å and 9 Å) are shown. (a) 5NPG (b) 2N5B (c) 2L80 (d) 2N2T (e) 2MZJ (f) 5TIN. The results are shown for pure cryo-EM density refinement (red) and the integrated cryo-EM and NMR chemical shift refinement (black).
Independent of whether or not chemical shift data was used for the refinement, the RMSDs of the final models obtained by the 4 Å density map refinement were the lowest and those obtained using the 9 Å density resolution were the highest (Figure 4).When NMR chemical shift restraints were used in addition to near-atomic resolution (4 Å) density data, the final structure RMSDs did not generally improve compared to the cryo-EM-only refinement. In fact, guiding the refinement by NMR chemical shift data frequently slightly worsened the final model RMSD when near-atomic resolution density maps were used. For 5NPG, 2N2T, 2MZJ, 2N5B and 5T1N, we saw an average increase in RMSD of 0.3 Å. However, for 2L8O even with a 4 Å resolution density map, the final model was significantly improved when NMR data was used for the refinement. In the case of 2L8O, when NMR chemical shifts were not used, the alpha helices unwound during the refinement, causing RMSDs to the native structure of above 4 Å. However, when NMR chemical shifts were present, there was significant improvement with the final model for all density resolutions (Figure 4). When medium resolution (6.9 Å and 9 Å) density maps were used in the refinements, the final model RMSDs when both cryo-EM data and NMR chemical shifts were used (hybrid protocol) were better for all proteins than when only cryo-EM density maps were used. Using NMR chemical shift data in addition to the density maps yielded an average RMSD improvement of 0.55 Å for the 6.9 Å resolution density maps and an average RMSD improvement of 1.23 Å for the 9 Å resolution density maps.
The model RMSDs decreased gradually with each step of the protocol, as exemplified for 2N5B in Figure 5(a) and 2L8O in Figure 6(a). A similar improvement of RMSDs was observed with our earlier membrane protein structure refinement protocol as well60. Here, we observed that a combination of NMR chemical shift information with cryo-EM density maps, generally led to a greater improvement in RMSDs than compared with a cryo-EM-only refinement.
Figure 5:

(a) The RMSD variation with each step of the iterative Rosetta-MD protocol for 2N5B when 6.9 Å density maps were used and (b) the model Rosetta energy score vs the RMSD to the native for the last Rosetta round.
Figure 6:

(a) The RMSD variation with each step of the iterative Rosetta-MD protocol for 2L8O when 6.9 Å density maps were used and (b) the model Rosetta energy score vs the RMSD to the native for the last Rosetta round.
There was a clear drop in RMSDs after the first iteration for all six proteins regardless of the density map resolution for both the hybrid protocol and the cryo-EM only refinement. After the first iteration, the RMSDs further dropped slightly during the next two iterations of Rosetta-MDFF for the hybrid protocol that used CS data. This general trend was observed for all six test proteins. For example, for the last round of 2L8O Rosetta refinement with a 6.9 Å density map, RMSDs for the hybrid method were in the range of ~1.8 Å to 3.2 Å (Figure 6 (b)), compared to an RMSD range of ~3.6 Å to 5.2 Å for the cryo-EM only refinement. For 2N5B, the difference in the range of RMSDs for the models generated by the hybrid method and the cryo-EM only refinement was not that distinguishable (Figure 5(b)). However, with the hybrid method, models with RMSDs of less than 2.4 Å were generated, while this was not observed for the cryo-EM only refinement. In general, Use of the hybrid method allowed us to build models with low RMSDs which were never generated with the cryo-EM only refinement.
Root Mean Square Error (RMSE) of Cα chemical shifts at each time frame of the molecular dynamics simulations were calculated using shiftx2. For the six proteins, the final RMSEs were lower than the starting RMSEs when the hybrid protocol was used. For 5NPG, 2L8O and 5T1N the average decrease in Cα chemical shift RMSE of the final MDFF3 simulations for the hybrid protocol was 0.45 ppm (Figure S1). However, in the case of refinement by just cryo-EM density data the final RMSEs did not show the trend seen for the hybrid refinement. An average increase of 0.51 ppm was observed. For 5NPG, 2L8O, 2N2T, 2MZJ and 5TIN the RMSEs increased with the simulation time. For 2N5B, the RMSE slightly decreased but was still considerably higher than what was obtained for the hybrid protocol (1.61 ppm vs. 1.29 ppm).
The variation of RMSE, fit-to-density and RMSD were further analyzed for final MDFF round models. We found strong correlations between RMSE, fit-to-density and RMSD. For example, low RMSD models exhibited low chemical shift RMSEs, suggesting that those agreed with the experimental shifts of the native structures (Figure 7). The low RMSD models also showed high fit-to-density scores, indicating these models agreed with the experimental cryo-EM density data better. All three qualifiers were generally better for models obtained from the hybrid refinement protocol. Figure 7 exemplifies these trends for 5T1N models with the hybrid method that used cryo-EM and chemical shift data and the cryo-EM only protocol.
Figure 7:
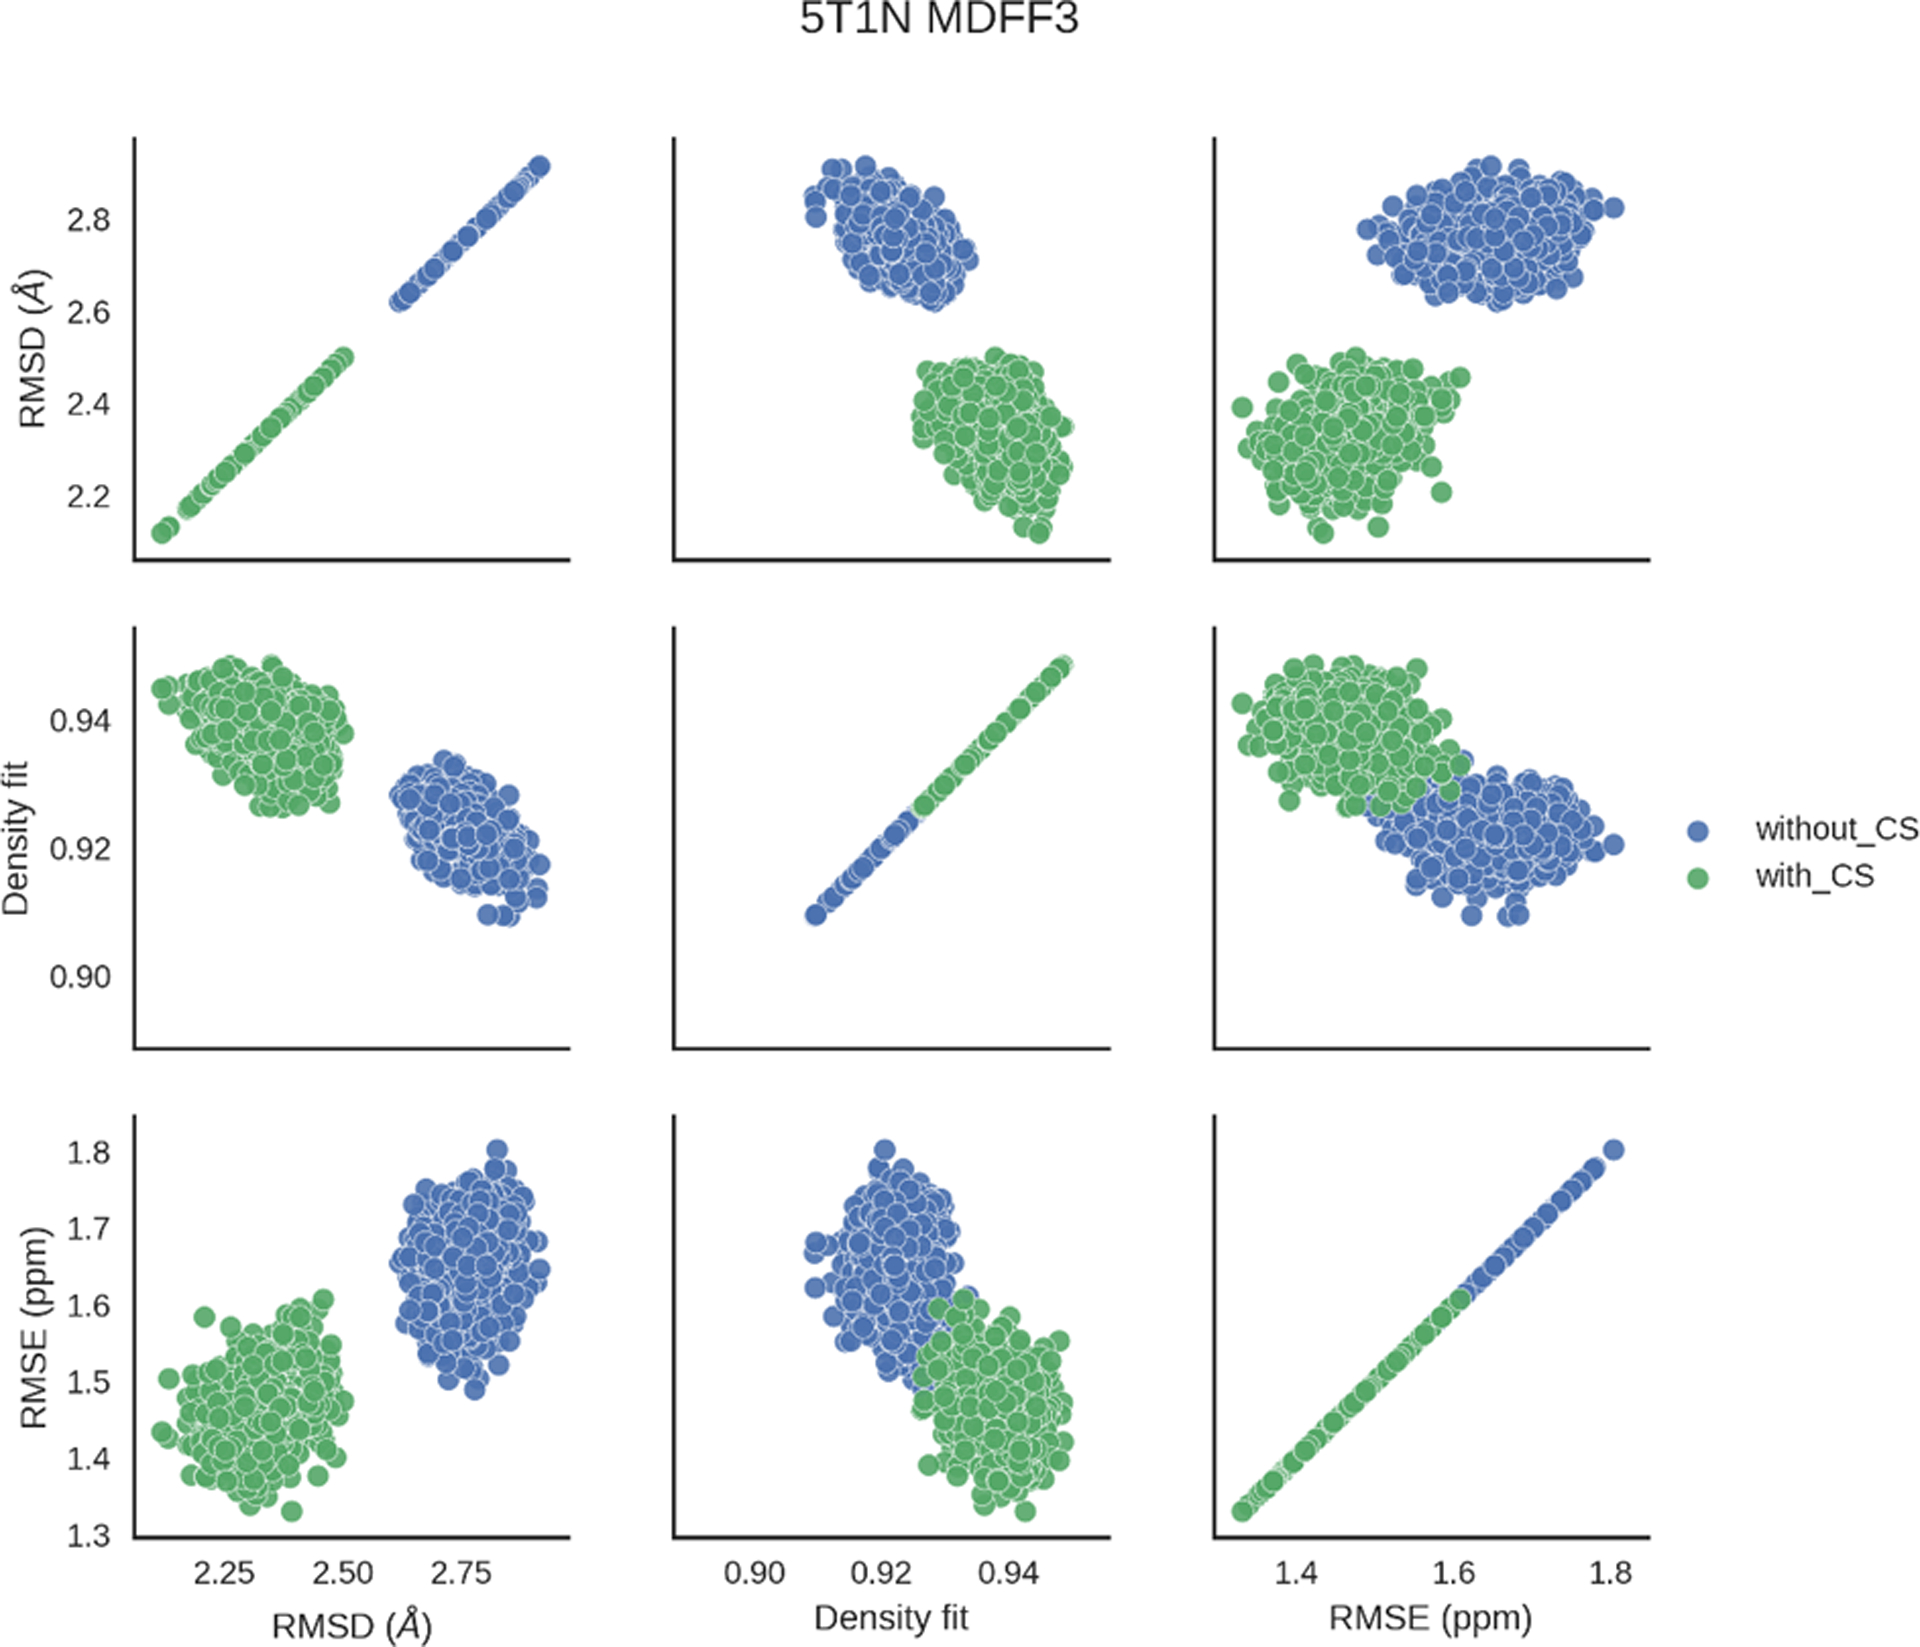
The variations of RMSD, RMSE and fit-to-density of models for the last round of MDFF for 5T1N. Models obtained from the hybrid refinement protocol are shown in green, while models that were refined using only the cryo-EM density map are shown in blue.
We calculated the RMSEs separately for each of the secondary structure classes (helix, sheet and loop) using DSSP71. The DSSP database includes the secondary structure assignment for the proteins deposited in the PDB. The RMSEs of each structural class were lower when chemical shift data was incorporated than when only cryo-EM density maps were used in structure refinement (Figure S2). The average RMSEs for each class showed that helices were the best refined in terms of NMR chemical shift agreement. The average Cα chemical shift RMSE for helices with and without CS data was 0.78 and 0.93 ppm, respectively. The highest RMSEs were observed for sheets. The average Cα chemical shift RMSEs for sheets with and without NMR chemical shift refinement were 1.22 and 1.31 ppm, respectively (Table S1). Additionally, the largest improvement of chemical shifts upon usage of the hybrid method was observed for helices.
The final refined structures with the hybrid protocol showed better agreement with the native structures than structures generated with cryo-EM density data as the only refinement restraint (Figure 8). When medium resolution density maps (6.9 Å) guided the refinement for all the six proteins, the final refined structure RMSDs were lower for the hybrid method than for the cryo-EM only refinement. The final model RMSDs for 5NPG, 2L8O, 2N2T, 2MZJ, 2N5B and 5TIN were 1.30, 1.81, 3.18, 2.26, 2.25 and 2.36 Å, respectively, when the hybrid method with medium resolution density data was used. For comparison, when only cryo-EM density data was used in the refinement, final model RMSDs were 1.40, 4.21, 3.26, 2.32, 2.79, 2.47 Å, respectively. The best final RMSDs were obtained for the 4 Å refinement. The final refined model RMSDs for the hybrid protocol using density maps of 4 Å resolution for 5NPG, 2L8O, 2N2T, 2MZJ, 2N5B and 5TIN were 0.34, 0.74, 1.31, 1.17, 0.58, 0.51 Å, respectively. For four out of the six proteins the final model RMSDs were less than 1 Å. For the non-hybrid method the average RMSD improvement for 4, 6.9 and 9 Å refinement was 4.22, 2.55 and 0.61 Å, respectively. With the hybrid method the average RMSD improvement for 4, 6.9 and 9 Å refinement was 4.52, 3.11, 1.84 Å, respectively. Therefore, the addition of CS data had the greatest impact when 9 Å resolution density maps were used.
Figure 8:

Native structure (orange), starting structure (blue), refined structure without NMR chemical shift data at 6.9 Å resolution density maps (green), refined structure with both NMR chemical shift data and cryo-EM density maps at 6.9 Å resolution (red) and refined structure with both NMR chemical shift data and cryo-EM density maps at 4 Å resolution (tan). (a) 2L8O (b) 2N5B (c) 5NPG (d) 2N2T.
Conclusions
In our previously reported iterative Rosetta-MDFF protocol we used cryo-EM density maps for refinement of protein structures. Here we showed that using additional experimental restraints in conjunction with cryo-EM density maps we can further improve the refined structures. As an additional experimental restraint we used NMR chemical shift data integrated with cryo-EM density maps in our hybrid protocol in both the Rosetta and MD steps. In the density-guided Rosetta refinement steps, the NMR chemical shift data was employed in the selection of protein fragments for the model building. In density-guided molecular dynamics (MDFF) refinement, the chemical shift data were incorporated to guide the simulations using the PLUMED program. These reference chemical shifts were used to guide the simulations towards the experimental native reference structure. After each time step, the chemical shifts were calculated using Almost (CS2BACKBONE). The difference between the measured and the experimental shift (current deviation) was applied as a linear potential with a slope.
In 15 out of 18 cases for all MDFF rounds, the refinement results obtained when both density maps and NMR chemical shift data were used outperformed those of the density map-only refinement. The improvement in refinement was highest when maps of higher resolutions were used. For medium (6.9 Å) and low (9 Å) resolution maps, with our hybrid method, the RMSDs of the final models were always lower than the RMSDs obtained by our previous protocol using just density-guided refinement. When we used near-atomic resolution density maps (4 Å) for the refinement, we frequently built sub 2 Å models without using the NMR chemical shift data. Additionally, at this stage, addition of the chemical shifts did not improve the refinements and actually decreased the model quality for almost all the test cases except 2L8O (Figure 4). This suggests that cryo-EM density maps at around 4 Å resolution contain sufficient structural restraints for a successful refinement even without NMR chemical shift data. Addition of NMR chemical shift data improved the refinement in cases where the cryo-EM density maps did not contain sufficient structural restraints for an unambiguous refinement to atomic resolution. As such, a combination of NMR chemical shift data and medium resolution cryo-EM density maps proved to be most useful.
This study demonstrates that by using a combination of cryo-EM and NMR restraints it is possible to refine structures to atomistic resolution that is not attainable using only one type of restraint. This hybrid protocol will be a valuable tool when only low to medium resolution cryo-EM density data and NMR chemical shift data are available to refine structures. Instructions for running the protocols are provided in the Supplementary Information.
Supplementary Material
Acknowledgments
We thank the members of the Lindert lab for many useful discussions. We would like to thank the Ohio Supercomputer Center for valuable computational resources72. Work in the Lindert laboratory is supported through NIH (R01 HL137015, R03 AG054904, P41 GM128577, R01 AI140541), NSF (CHE 1750666) and a Falk Medical Research Trust Catalyst Award.
Footnotes
Supplementary Material
Supporting Information Available. Instructions on the protocol and how to generate simulated density maps are provided. The variation of RMSE with each time step of the final round of MDFF (MDFF3) for each of the six proteins when the hybrid protocol with 6.9 Å density data was used is shown. The NMR chemical shift RMSEs for each secondary class type (helix, sheet and loop) for the final MDFF round for the test proteins and the average Cα chemical shift RMSEs for each of the secondary structure classes are shown.
REFERENCES
- 1.Abbot ES, The Causal Relations between Structure and Function in Biology. The American Journal of Psychology 1916, 27 (2), 245–250. [Google Scholar]
- 2.Lee D; Redfern O; Orengo C, Predicting protein function from sequence and structure. Nature Reviews Molecular Cell Biology 2007, 8, 995. [DOI] [PubMed] [Google Scholar]
- 3.Leelananda SP; Lindert S, Computational methods in drug discovery. Beilstein Journal of Organic Chemistry 2016, 12, 2694–2718. [DOI] [PMC free article] [PubMed] [Google Scholar]
- 4.Schmidt T; Bergner A; Schwede T, Modelling three-dimensional protein structures for applications in drug design. Drug discovery today 2014, 19 (7), 890–897. [DOI] [PMC free article] [PubMed] [Google Scholar]
- 5.Anderson AC, The Process of Structure-Based Drug Design. Chemistry & Biology 2003, 10 (9), 787–797. [DOI] [PubMed] [Google Scholar]
- 6.Brooijmans N; Kuntz ID, Molecular Recognition and Docking Algorithms. Annual Review of Biophysics and Biomolecular Structure 2003, 32 (1), 335–373. [DOI] [PubMed] [Google Scholar]
- 7.Cheng T; Li Q; Zhou Z; Wang Y; Bryant SH, Structure-Based Virtual Screening for Drug Discovery: a Problem-Centric Review. The AAPS Journal 2012, 14 (1), 133–141. [DOI] [PMC free article] [PubMed] [Google Scholar]
- 8.Ilari A; Savino C, Protein Structure Determination by X-Ray Crystallography In Bioinformatics: Data, Sequence Analysis and Evolution, Keith JM, Ed. Humana Press: Totowa, NJ, 2008; pp 63–87. [DOI] [PubMed] [Google Scholar]
- 9.Robustelli P; Kohlhoff K; Cavalli A; Vendruscolo M, Using NMR chemical shifts as structural restraints in molecular dynamics simulations of proteins. Structure 2010, 18 (8), 923–933. [DOI] [PubMed] [Google Scholar]
- 10.Cavalli A; Salvatella X; Dobson CM; Vendruscolo M, Protein structure determination from NMR chemical shifts. Proceedings of the National Academy of Sciences 2007, 104 (23), 9615. [DOI] [PMC free article] [PubMed] [Google Scholar]
- 11.Cheng Y, Single-particle cryo-EM at crystallographic resolution. Cell 2015, 161 (3), 450–457. [DOI] [PMC free article] [PubMed] [Google Scholar]
- 12.Egelman, Edward H, The Current Revolution in Cryo-EM. Biophysical Journal 2016, 110 (5), 1008–1012. [DOI] [PMC free article] [PubMed] [Google Scholar]
- 13.Murata K; Wolf M, Cryo-electron microscopy for structural analysis of dynamic biological macromolecules. Biochimica et Biophysica Acta (BBA) - General Subjects 2018, 1862 (2), 324–334. [DOI] [PubMed] [Google Scholar]
- 14.Carroni M; Saibil HR, Cryo electron microscopy to determine the structure of macromolecular complexes. Methods (San Diego, Calif.) 2016, 95, 78–85. [DOI] [PMC free article] [PubMed] [Google Scholar]
- 15.Scott H; Huang W; Bann JG; Taylor DJ, Advances in structure determination by cryo-EM to unravel membrane-spanning pore formation. Protein Science 2018, 27 (9), 1544–1556. [DOI] [PMC free article] [PubMed] [Google Scholar]
- 16.Bai X.-c.; McMullan G; Scheres SHW, How cryo-EM is revolutionizing structural biology. Trends in Biochemical Sciences 2015, 40 (1), 49–57. [DOI] [PubMed] [Google Scholar]
- 17.Raunser S, Cryo‐EM Revolutionizes the Structure Determination of Biomolecules. Angewandte Chemie International Edition 2017, 56 (52), 16450–16452. [DOI] [PubMed] [Google Scholar]
- 18.Davis AM; Teague SJ; Kleywegt GJ, Application and limitations of X‐ray crystallographic data in structure‐based ligand and drug design. Angewandte Chemie International Edition 2003, 42 (24), 2718–2736. [DOI] [PubMed] [Google Scholar]
- 19.Frueh DP; Goodrich A; Mishra S; Nichols S, NMR methods for structural studies of large monomeric and multimeric proteins. Current opinion in structural biology 2013, 23 (5), 734–739. [DOI] [PMC free article] [PubMed] [Google Scholar]
- 20.García-Nafría J; Lee Y; Bai X; Carpenter B; Tate CG, Cryo-EM structure of the adenosine A(2A) receptor coupled to an engineered heterotrimeric G protein. eLife 2018, 7, e35946. [DOI] [PMC free article] [PubMed] [Google Scholar]
- 21.Rost B; Sander C, Bridging the Protein Sequence-Structure Gap by Structure Predictions. Annual Review of Biophysics and Biomolecular Structure 1996, 25 (1), 113–136. [DOI] [PubMed] [Google Scholar]
- 22.Eswar N; Webb B; Marti-Renom MA; Madhusudhan MS; Eramian D; Shen M. y.; Pieper U; Sali A, Comparative Protein Structure Modeling Using Modeller. Current protocols in bioinformatics 2006, 0 5, Unit-5. [DOI] [PMC free article] [PubMed] [Google Scholar]
- 23.Zhang Y, I-TASSER server for protein 3D structure prediction. BMC bioinformatics 2008, 9 (40). [DOI] [PMC free article] [PubMed] [Google Scholar]
- 24.Rohl CA; Strauss CEM; Misura KMS; Baker D, Protein structure prediction using Rosetta. Methods in enzymology 2004, 383, 66–93. [DOI] [PubMed] [Google Scholar]
- 25.Xu D; Zhang Y, Toward optimal fragment generations for ab initio protein structure assembly. Proteins 2013, 81 (2), 229–239. [DOI] [PMC free article] [PubMed] [Google Scholar]
- 26.Mierke DF; Huber T; Kessler H, Coupling constants again: Experimental restraints in structure refinement. Journal of Computer-Aided Molecular Design 1994, 8 (1), 29–40. [DOI] [PubMed] [Google Scholar]
- 27.Li W; Zhang Y; Kihara D; Huang YJ; Zheng D; Montelione GT; Kolinski A; Skolnick J, TOUCHSTONEX: Protein structure prediction with sparse NMR data. Proteins: Structure, Function, and Bioinformatics 2003, 53 (2), 290–306. [DOI] [PubMed] [Google Scholar]
- 28.Kovalevskiy O; Nicholls RA; Long F; Carlon A; Murshudov GN, Overview of refinement procedures within REFMAC5: utilizing data from different sources. Acta crystallographica. Section D, Structural biology 2018, 74 (Pt 3), 215–227. [DOI] [PMC free article] [PubMed] [Google Scholar]
- 29.Lindert S; Stewart PL; Meiler J, Hybrid approaches: applying computational methods in cryo-electron microscopy. Current opinion in structural biology 2009, 19 (2), 218–225. [DOI] [PMC free article] [PubMed] [Google Scholar]
- 30.Lindert S; Staritzbichler R; Wötzel N; Karakaş M; Stewart PL; Meiler J, EM-Fold: De Novo Folding of α-Helical Proteins Guided by Intermediate-Resolution Electron Microscopy Density Maps. Structure 2009, 17 (7), 990–1003. [DOI] [PMC free article] [PubMed] [Google Scholar]
- 31.Lindert S; Alexander N; Wötzel N; Karakaş M; Stewart, Phoebe L; Meiler J, EM-Fold: De Novo Atomic-Detail Protein Structure Determination from Medium-Resolution Density Maps. Structure 2012, 20 (3), 464–478. [DOI] [PMC free article] [PubMed] [Google Scholar]
- 32.Baker ML; Ju T; Chiu W, Identification of Secondary Structure Elements in Intermediate-Resolution Density Maps. Structure 2007, 15 (1), 7–19. [DOI] [PMC free article] [PubMed] [Google Scholar]
- 33.Lindert S; Hofmann T; Wötzel N; Karakaş M; Stewart PL; Meiler J, Ab initio protein modeling into CryoEM density maps using EM‐Fold. Biopolymers 2012, 97 (9), 669–677. [DOI] [PMC free article] [PubMed] [Google Scholar]
- 34.Frenz B; Walls AC; Egelman EH; Veesler D; DiMaio F, RosettaES: a sampling strategy enabling automated interpretation of difficult cryo-EM maps. Nature methods 2017, 14 (8), 797–800. [DOI] [PMC free article] [PubMed] [Google Scholar]
- 35.Wang RY-R; Song Y; Barad BA; Cheng Y; Fraser JS; DiMaio F, Automated structure refinement of macromolecular assemblies from cryo-EM maps using Rosetta. eLife 2016, 5, e17219. [DOI] [PMC free article] [PubMed] [Google Scholar]
- 36.DiMaio F; Song Y; Li X; Brunner MJ; Xu C; Conticello V; Egelman E; Marlovits TC; Cheng Y; Baker D, Atomic-accuracy models from 4.5-A cryo-electron microscopy data with density-guided iterative local refinement. Nat Meth 2015, 12 (4), 361–365. [DOI] [PMC free article] [PubMed] [Google Scholar]
- 37.Weiner BE; Alexander N; Akin LR; Woetzel N; Karakas M; Meiler J, BCL::Fold--protein topology determination from limited NMR restraints. Proteins 2014, 82 (4), 587–595. [DOI] [PMC free article] [PubMed] [Google Scholar]
- 38.Meiler J; Baker D, Rapid protein fold determination using unassigned NMR data. Proceedings of the National Academy of Sciences of the United States of America 2003, 100 (26), 15404–15409. [DOI] [PMC free article] [PubMed] [Google Scholar]
- 39.Perilla JR; Zhao G; Lu M; Ning J; Hou G; Byeon I-JL; Gronenborn AM; Polenova T; Zhang P, CryoEM Structure Refinement by Integrating NMR Chemical Shifts with Molecular Dynamics Simulations. The Journal of Physical Chemistry B 2017. [DOI] [PMC free article] [PubMed] [Google Scholar]
- 40.Papaleo E; Camilloni C; Teilum K; Vendruscolo M; Lindorff-Larsen K, Molecular dynamics ensemble refinement of the heterogeneous native state of NCBD using chemical shifts and NOEs. PeerJ 2018, 6, e5125. [DOI] [PMC free article] [PubMed] [Google Scholar]
- 41.Alexander N; Bortolus M; Al-Mestarihi A; McHaourab H; Meiler J, De Novo High-Resolution Protein Structure Determination from Sparse Spin labeling EPR Data. Structure (London, England : 1993) 2008, 16 (2), 181–195. [DOI] [PMC free article] [PubMed] [Google Scholar]
- 42.Hirst SJ; Alexander N; McHaourab HS; Meiler J, RosettaEPR: An Integrated Tool for Protein Structure Determination from Sparse EPR Data. Journal of structural biology 2011, 173 (3), 506–514. [DOI] [PMC free article] [PubMed] [Google Scholar]
- 43.Shevchuk R; Hub JS, Bayesian refinement of protein structures and ensembles against SAXS data using molecular dynamics. PLOS Computational Biology 2017, 13 (10), e1005800. [DOI] [PMC free article] [PubMed] [Google Scholar]
- 44.Kahraman A; Herzog F; Leitner A; Rosenberger G; Aebersold R; Malmström L, Cross-link guided molecular modeling with ROSETTA. PLoS One 2013, 8 (9), e73411. [DOI] [PMC free article] [PubMed] [Google Scholar]
- 45.Aprahamian ML; Lindert S, Utility of Covalent Labeling Mass Spectrometry Data in Protein Structure Prediction with Rosetta. Journal of Chemical Theory and Computation 2019, 15 (5), 3410–3424. [DOI] [PMC free article] [PubMed] [Google Scholar]
- 46.Harvey SR; Seffernick JT; Quintyn RS; Song Y; Ju Y; Yan J; Sahasrabuddhe AN; Norris A; Zhou M; Behrman EJ; Lindert S; Wysocki VH, Relative interfacial cleavage energetics of protein complexes revealed by surface collisions. Proceedings of the National Academy of Sciences 2019, 116 (17), 8143. [DOI] [PMC free article] [PubMed] [Google Scholar]
- 47.Aprahamian ML; Chea EE; Jones LM; Lindert S, Rosetta Protein Structure Prediction from Hydroxyl Radical Protein Footprinting Mass Spectrometry Data. Analytical Chemistry 2018, 90 (12), 7721–7729. [DOI] [PMC free article] [PubMed] [Google Scholar]
- 48.Seffernick JT; Harvey SR; Wysocki VH; Lindert S, Predicting Protein Complex Structure from Surface-Induced Dissociation Mass Spectrometry Data. ACS Central Science 2019. [DOI] [PMC free article] [PubMed] [Google Scholar]
- 49.Kalinin S; Peulen T; Sindbert S; Rothwell PJ; Berger S; Restle T; Goody RS; Gohlke H; Seidel CAM, A toolkit and benchmark study for FRET-restrained high-precision structural modeling. Nat Meth 2012, 9 (12), 1218–1225. [DOI] [PubMed] [Google Scholar]
- 50.Kaufmann KW; Lemmon GH; DeLuca SL; Sheehan JH; Meiler J, Practically Useful: What the Rosetta Protein Modeling Suite Can Do for You. Biochemistry 2010, 49 (14), 2987–2998. [DOI] [PMC free article] [PubMed] [Google Scholar]
- 51.Leaver-Fay A; Tyka M; Lewis SM; Lange OF; Thompson J; Jacak R; Kaufman KW; Renfrew PD; Smith CA; Sheffler W; Davis IW; Cooper S; Treuille A; Mandell DJ; Richter F; Ban Y-EA; Fleishman SJ; Corn JE; Kim DE; Lyskov S; Berrondo M; Mentzer S; Popović Z; Havranek JJ; Karanicolas J; Das R; Meiler J; Kortemme T; Gray JJ; Kuhlman B; Baker D; Bradley P, Chapter nineteen - Rosetta3: An Object-Oriented Software Suite for the Simulation and Design of Macromolecules In Methods in Enzymology, Johnson ML; Brand L, Eds. Academic Press: 2011; Vol. 487, pp 545–574. [DOI] [PMC free article] [PubMed] [Google Scholar]
- 52.DiMaio F; Tyka MD; Baker ML; Chiu W; Baker D, Refinement of Protein Structures into Low-Resolution Density Maps using Rosetta. Journal of molecular biology 2009, 392 (1), 181–190. [DOI] [PMC free article] [PubMed] [Google Scholar]
- 53.Pilla KB; Leman JK; Otting G; Huber T, Capturing Conformational States in Proteins Using Sparse Paramagnetic NMR Data. PLOS ONE 2015, 10 (5), e0127053. [DOI] [PMC free article] [PubMed] [Google Scholar]
- 54.DiMaio F; Chiu W, Tools for Model Building and Optimization into Near-Atomic Resolution Electron Cryo-Microscopy Density Maps. Methods in enzymology 2016, 579, 255–276. [DOI] [PMC free article] [PubMed] [Google Scholar]
- 55.Ovchinnikov S; Park H; Kim DE; Liu Y; Wang RY-R; Baker D, Structure prediction using sparse simulated NOE restraints with Rosetta in CASP11. Proteins: Structure, Function, and Bioinformatics 2016, 84 (S1), 181–188. [DOI] [PMC free article] [PubMed] [Google Scholar]
- 56.Feig M; Mirjalili V, Protein structure refinement via molecular-dynamics simulations: What works and what does not? Proteins: Structure, Function, and Bioinformatics 2016, 84, 282–292. [DOI] [PMC free article] [PubMed] [Google Scholar]
- 57.Lupala CS; Rasaeifar B; Gomez-Gutierrez P; Perez JJ, Using molecular dynamics for the refinement of atomistic models of GPCRs by homology modeling. Journal of Biomolecular Structure and Dynamics 2017, 1–13. [DOI] [PubMed] [Google Scholar]
- 58.Trabuco LG; Villa E; Schreiner E; Harrison CB; Schulten K, Molecular dynamics flexible fitting: A practical guide to combine cryo-electron microscopy and X-ray crystallography. Methods 2009, 49 (2), 174–180. [DOI] [PMC free article] [PubMed] [Google Scholar]
- 59.Tribello GA; Bonomi M; Branduardi D; Camilloni C; Bussi G, PLUMED 2: New feathers for an old bird. Computer Physics Communications 2014, 185 (2), 604–613. [Google Scholar]
- 60.Leelananda SP; Lindert S, Iterative Molecular Dynamics–Rosetta Membrane Protein Structure Refinement Guided by Cryo-EM Densities. Journal of Chemical Theory and Computation 2017, 13 (10), 5131–5145. [DOI] [PMC free article] [PubMed] [Google Scholar]
- 61.Lindert S; Meiler J; McCammon JA, Iterative Molecular Dynamics Rosetta Protein Structure Refinement Protocol to Improve Model Quality. Journal of chemical theory and computation 2013, 9 (8), 3843–3847. [DOI] [PMC free article] [PubMed] [Google Scholar]
- 62.Lindert S; McCammon JA, Improved cryoEM-Guided Iterative Molecular Dynamics–Rosetta Protein Structure Refinement Protocol for High Precision Protein Structure Prediction. Journal of Chemical Theory and Computation 2015, 11 (3), 1337–1346. [DOI] [PMC free article] [PubMed] [Google Scholar]
- 63.Bonneau R; Tsai J; Ruczinski I; Chivian D; Rohl C; Strauss C; Baker D, Rosetta in CASP4: progress in ab initio protein structure prediction. 2001; Vol. Suppl 5, p 119–26. [DOI] [PubMed] [Google Scholar]
- 64.Simons KT; Kooperberg C; Huang E; Baker D, Assembly of protein tertiary structures from fragments with similar local sequences using simulated annealing and bayesian scoring functions1. Journal of Molecular Biology 1997, 268 (1), 209–225. [DOI] [PubMed] [Google Scholar]
- 65.Bonneau R; Strauss CEM; Rohl CA; Chivian D; Bradley P; Malmström L; Robertson T; Baker D, De Novo Prediction of Three-dimensional Structures for Major Protein Families. Journal of Molecular Biology 2002, 322 (1), 65–78. [DOI] [PubMed] [Google Scholar]
- 66.Woetzel N; Karakaş M; Staritzbichler R; Müller R; Weiner BE; Meiler J, BCL::Score—Knowledge Based Energy Potentials for Ranking Protein Models Represented by Idealized Secondary Structure Elements. PLOS ONE 2012, 7 (11), e49242. [DOI] [PMC free article] [PubMed] [Google Scholar]
- 67.Wriggers W, Conventions and workflows for using Situs. Acta Crystallographica Section D: Biological Crystallography 2012, 68 (4), 344–351. [DOI] [PMC free article] [PubMed] [Google Scholar]
- 68.McGreevy R; Teo I; Singharoy A; Schulten K, Advances in the molecular dynamics flexible fitting method for cryo-EM modeling. Methods 2016, 100, 50–60. [DOI] [PMC free article] [PubMed] [Google Scholar]
- 69.Kim DE; Chivian D; Baker D, Protein structure prediction and analysis using the Robetta server. Nucleic acids research 2004, 32 (suppl 2), W526–W531. [DOI] [PMC free article] [PubMed] [Google Scholar]
- 70.Shen Y; Lange O; Delaglio F; Rossi P; Aramini JM; Liu G; Eletsky A; Wu Y; Singarapu KK; Lemak A, Consistent blind protein structure generation from NMR chemical shift data. Proceedings of the National Academy of Sciences 2008, 105 (12), 4685–4690. [DOI] [PMC free article] [PubMed] [Google Scholar]
- 71.Kabsch W; Sander C, Dictionary of protein secondary structure: Pattern recognition of hydrogen‐bonded and geometrical features. Biopolymers 1983, 22 (12), 2577–2637. [DOI] [PubMed] [Google Scholar]
- 72.Ohio Supercomputer Center. 1987.
Associated Data
This section collects any data citations, data availability statements, or supplementary materials included in this article.