

Abstract
Early identification of kidney function deterioration is essential to determine which newborn patients with dilation of the renal pelvis (hydronephrosis) should undergo surgery. Kidney function can be measured by fitting a tracer kinetic (TK) model onto a series of Dynamic Contrast Enhanced (DCE) MR images and deriving the glomerular filtration rate (GFR) from the TK model. Unfortunately, heavy breathing and large bulk motion events create outliers and misalignments that introduce large errors in the TK estimates. Moreover, aligning the series of DCE images is not trivial due to the contrast differences between them and the undersampling artifacts due to fast imaging. We present a bulk motion detection and a linear time invariant (LTI) model-based motion correction approach for DCE-MRI alignment that leverages the temporal dynamics of the DCE data at each voxel. We evaluate our approach on 10 newborn patients that underwent DCE imaging without sedation. For each patient, we reconstructed the sequence of DCE images, detected and removed the volumes corrupted by motion using a self navigation approach, aligned the sequence using our approach and fitted the TK model to compute GFR. The results show that our approach correctly aligned all volumes and improved the TK model fit and, on average, reducing the normalized root-mean-squared error by 0.17.
Keywords: First keyword, Second keyword, Another keyword
1. Introduction
Congenital anomalies of the urinary tract, the most common being urinary tract dilation or hydronephrosis, is found in 2 to 7% of all maternal ultrasounds and can lead to chronic renal insufficiency (CRI). In these newborn patients, surgical intervention is indicated when there is clear evidence of renal function deterioration and delays in intervention can lead to potential lifelong complications and CRI. Hence, timely determination of which patients should undergo surgery is important to reduce the risk of developing CRI. The best measures of kidney function are glomerular filtration rate (GFR) and differential renal function. Dynamic Contrast Enhanced (DCE) MRI is a technology with great potential to simultaneously evaluate kidney function (GFR and DRF) and anatomy without ionizing radiation. DCE-MR imaging acquires a temporal sequence of volumes after injection of a contrast agent (CA) into the patient’s bloodstream and kidney function is then measured by fitting a tracer kinetic (TK) model onto the series of DCE MR images. Unfortunately, current DCE methods are sensitive to motion and do not provide the high temporal resolution (3sec/volume) that is necessary to capture the rapidly changing dynamics of the arterial input function (AIF) —i.e. the input to the TK model that is necessary for accurate computation of kidney function.
Recent advances in MR imaging such as radial sampling and compressed-sensing (CS) reconstruction have allowed to attain sufficient spatio-temporal resolution to be able to reliably fit the TK model and estimate the GFR. However, there are still limitations that impede the accurate assessment of kidney function with DCE-MRI in clinical practice. One of them is motion due to breathing or changes of position of the subject, which cause miss-alignment of the voxels across time and introduces error in the TK model fit. These complications are particularly acute when imaging newborns, for whom sedation is avoided and who cannot hold their breath. Alignment of images in the DCE-MRI sequence acquired with radial sampling is especially challenging due to major contrast differences between volumes and low quality of the images due to presence of streaking artifacts from undersampling. Previous methods have attempted to register the sequence of volumes by reducing a PCA metric on the temporal covariance [5] or by registering onto templates generated using a TK model [1,8]. These methods, either implicitly or explicitly, model the temporal behavior of the DCE-MR signal to align the sequence of images. However, linear models like PCA are too simple to capture the behavior of DCE-MR data with presence of noise and TK models are too specific to the organs of interest to be fitted to the entire field of view (FOV) and the non-linear optimizations on which they depend are prone to converge to local minima, specially under the presence of noise.
Here, we introduce a new linear time invariant (LTI) model-based method to co-register a sequence of DCE volumes. Our method approximates the temporal behaviour of the CA in each patient as the response of an LTI system to an input —i.e. AIF. We iteratively fit the LTI model to the data, reconstruct template volumes from the LTI model and register each acquired volume to its corresponding template. Differently from other models, the LTI model is capable of accurately characterizing the organs of interest as well as the rest of the tissue. Moreover, it can be fitted with convex optimization that does not depend on an accurate initialization to converge to a global minimum.
2. Methods
Our registration approach is inspired by previous methods that use a TK model prior to register the sequence of volumes. These models characterize the signal intensity change due to CA in the tissue as the convolution of the AIF (a(t)) with a system response (h(t)). For example, Sourbron introduced the ”seperable two-compartment” model, which characterizes the impulse response in the kidneys with equation (1).
| (1) |
where TP , TE, FE, FP are the parameters of the model [9]. Unfortunately, estimating the parameters of such models requires solving a non-linear least-squares optimization, which can lead to convergence to local minima. Especially under the presence of streaking artifacts and large motion, this method is not robust and therefore results in inaccurate priors for registration.
2.1. LTI Model for Tissue Contrast Enhancement
Our approach overcomes this limitation with two modifications: an LTI model for h(t) and a convex optimization to estimate its parameters without risk of converging into local minima. Hence, our model characterizes the DCE-MR data s(t) as the convolution of the AIF with the impulse response of an LTI system (s(t) = h(t) * a(t)). Specifically, we approximate h(t) as a sum of first-order, strictly proper transfer functions () with poles (pk) restricted to a low frequency section of the unit disk —with normalized frequency below ρ = 0.014. The resulting impulse response decays over time and does not allow for large oscillations, matching the expected behavior of DCE-MR data.
To determine the exact form of h(t), it is then necessary to find the minimum number of coefficients and transfer functions that satisfy To solve this problem, we use the system identification method by Yilmaz’s et.al. [11]. This method solves a convex relaxation of the original l0 norm minimization problem (eq. 2) and uses a randomized version of the Frank-Wolfe algorithm [6] to optimize over all possible .
| (2) |
In short, at every iteration k, the algorithm selects N random poles pn ∈ Dρ, computes their corresponding impulse responses , and picks the one most aligned with the descent direction. Then, it updates the coefficients ck such that is minimized with
The LTI model for DCE-MR data requires an AIF, a(t), which is not typically known a priori and must be extracted from the data. In order to estimate it, we use the LTI model on the voxels that correspond to the aorta, now using a delta function as an input. First, we select the relevant voxels with a precomputed aorta mask, then we cluster them with K-means (K = 10) and, finally, we fit the LTI model to the mean signal from each cluster. This procedure provides denoised time intensity curves of the aorta, from which we select final AIF as the intensity curve with the highest peak to minimize the effect of inflow artifacts. Once the AIF is computed, we use it as an input function to the LTI model and fit the model to the rest of the tissue voxels. To reduce computational demands and noise, we also cluster the voxels within the tissue with K-means (K = 1000 clusters per slice) and fit the LTI model to each cluster mean.
2.2. LTI model based Groupwise Registration
The proposed registration algorithm, shown in algorithm 1, consists of iteratively fitting the LTI model to the data and then registering each volume to its corresponding template generated with the LTI model. This iterative method is repeated until convergence of the registration parameters. However, we have observed that after 2 iterations, the diminishing returns in the quality of the registration are outweighted by the computational time required by the model fit and we terminate the optimization. To register each volume, our algorithm allows to choose any interpolation or optimization metric in the registration step—e.g. rigid or non-rigid registration, intensity or information based metrics and register the entire FOV or only the organs of interest. In this implementation, we choose to use a non-rigid registration using mutual information as an optimization metric. In particular, we used a 3rd order B-spline interpolation (spacing of 28mm) with “AdvancedMattesMutualInformation” metric implemented in ELASTIX [7].
After registering the sequence of volumes, we correct those volumes that have been corrupted by rapid motion events. To that objective we use an outlier rejection algorithm that leverages the center of raw k-space data acquired with stack-of-stars [2] sampling scheme. This algorithm takes the signal acquired at the center of k-space with each spoke —i.e. the center of each line traversing k-space radially— and determines that a spoke is corrupted when its correlation with neighboring spokes decreases below a threshold. With this algorithm, we detected the volumes that included corrupted spokes and substituted them with the template volumes generated with the LTI model.
3. Experiments
We evaluated our algorithm on data from 10 infants with hydronephrosis (age 0–4 months) that underwent DCE-MRI of their kidneys. The data acquisition was done following IRB approval and with consent. The infants were fed, swaddled and rocked to sleep without sedation. We imaged each subject with a stack-of-stars sampling scheme and reconstructed the sequence of volumes with GRASP, a CS technique that uses total-variation regularization over time [4]. We used 34 k-space spokes per slice, leading to an average temporal resolution of 3.3 sec. We then applied the proposed LiMo-MoCo algorithm 1 for motion correction.
We evaluated the quality of the registration algorithm based on the TK model fit on the average time intensity curves throughout each kidney. Volume sequences with large outliers or changes in position will increase the TK fitting error, in contrast, proper detection of outliers and correction of motion will reduce it. Hence, we fitted the TK model (eq. 1) to the data and computed the normalized root-mean-square error (nRMSE) of the fit. For each kidney we used wild bootstrap to estimate the variance of the nRMSE [3] and determined statistical significance of the results with the Wilcoxon statistical test [10].
We compared the results of the LiMo-MoCo against no motion compensation (No MoCo), registration to a fixed reference volume (REFVOL)3 and a PCA-based groupwise registration for quantitative MRI (gPCA) [5]. For all cases, we used non-rigid registration with B-spline interpolation implemented in ELASTIX[7].
4. Results
Figure 1 shows the evolution in time of a line of voxels in a volume for three subjects. Without MoCo, all subjects showed different degrees of motion: (a) presented little motion in the form of oscillations, (b) motion events with corruption of volumes and large displacements and (c) small but continuous motion that corrupted several volumes.
Fig. 1.
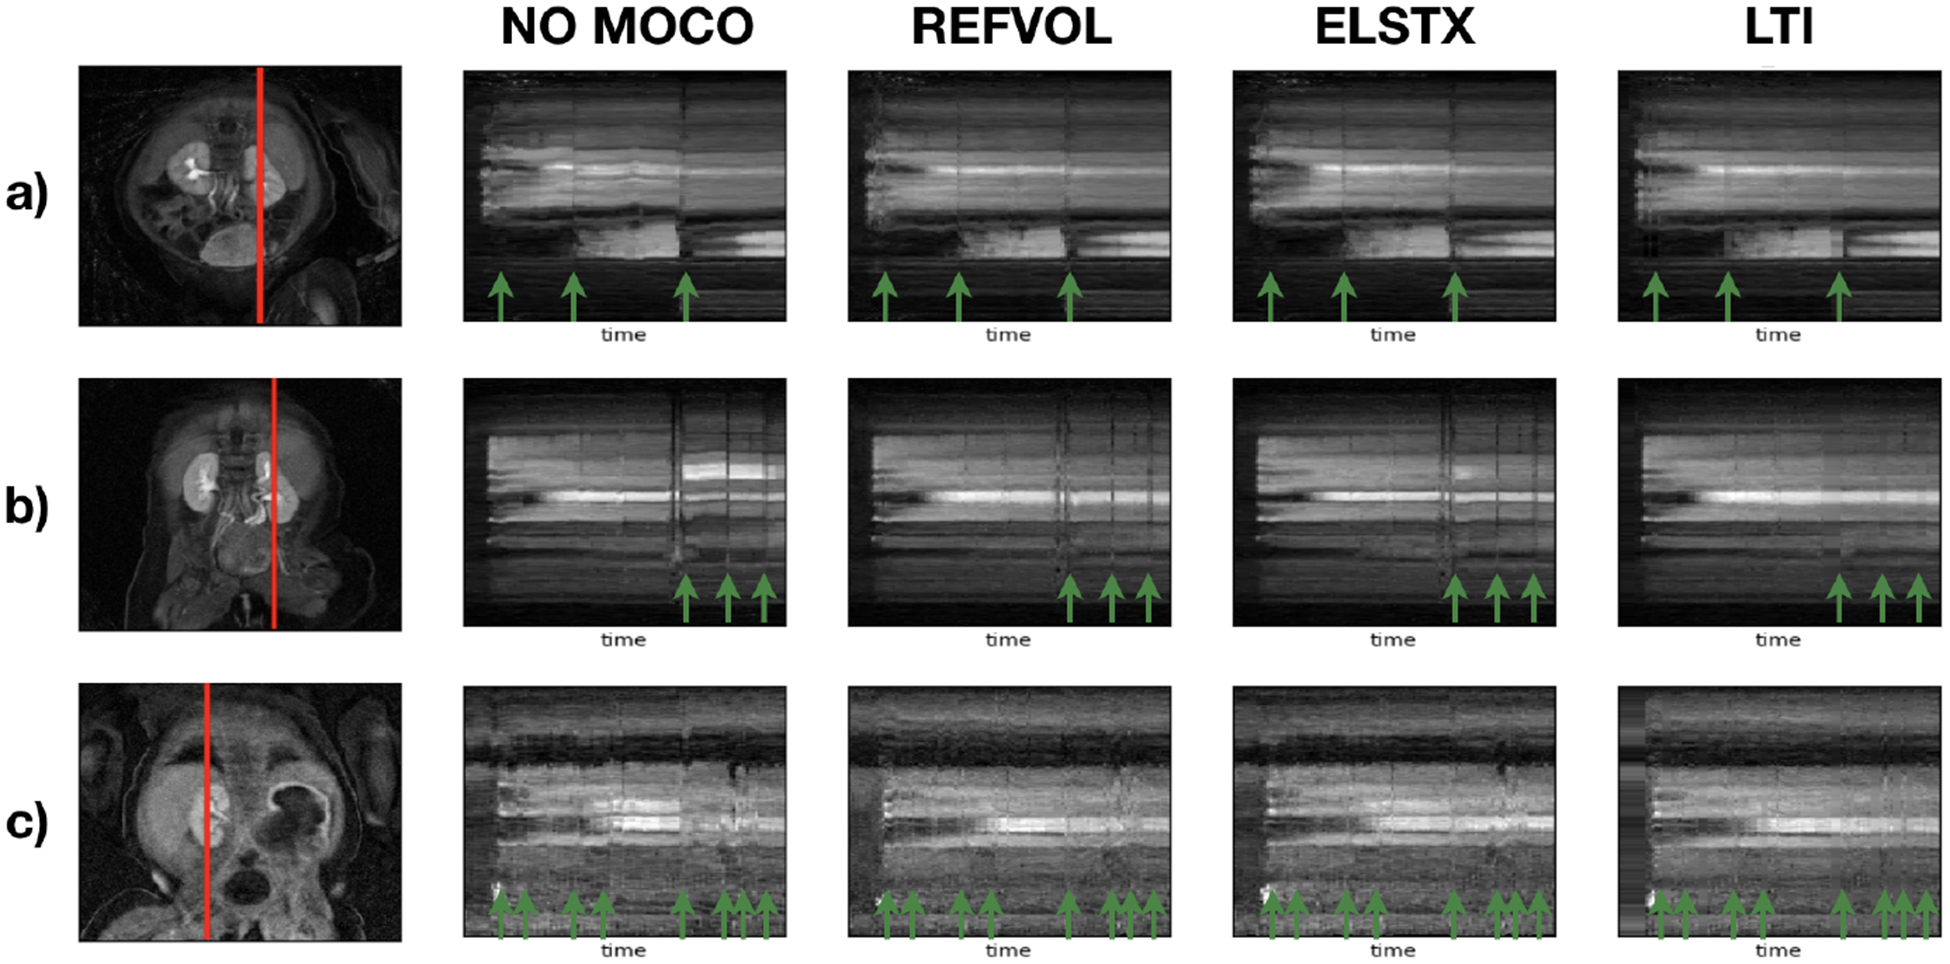
Temporal evolution of the intensity of a line of voxels for three subjects. The first column shows a a coronal image with the line of voxels marked in red as reference. The rest of the columns show the temporal evolution of the line of voxels for No-MoCo, REFVOL, gPCA and the proposed LiMo-MoCo, respecitvely. Green arrows indicate volumes corrupted by sudden motion.
All MoCo algorithms recovered the continuity of the voxel intensities over time. However, the corrupted volumes —marked with green arrows— remained dark and some alignment errors prevailed. LiMo-MoCo corrects those displacements and impaints the outliers, hence correcting the time intensity curves in each voxel. These errors are more apparent in areas with small anatomical features, such as the aorta, where the signal shows large deviations after motion events. We illustrate this effect in Fig. 2 with the coronal plots over time and the time intensity curves of subject (b). The displacements and outliers observed in the coronal images create large deviations in intensity of the voxels near boundaries and eliminate the initial intensity peak in some voxels on the aorta.
Fig. 2.
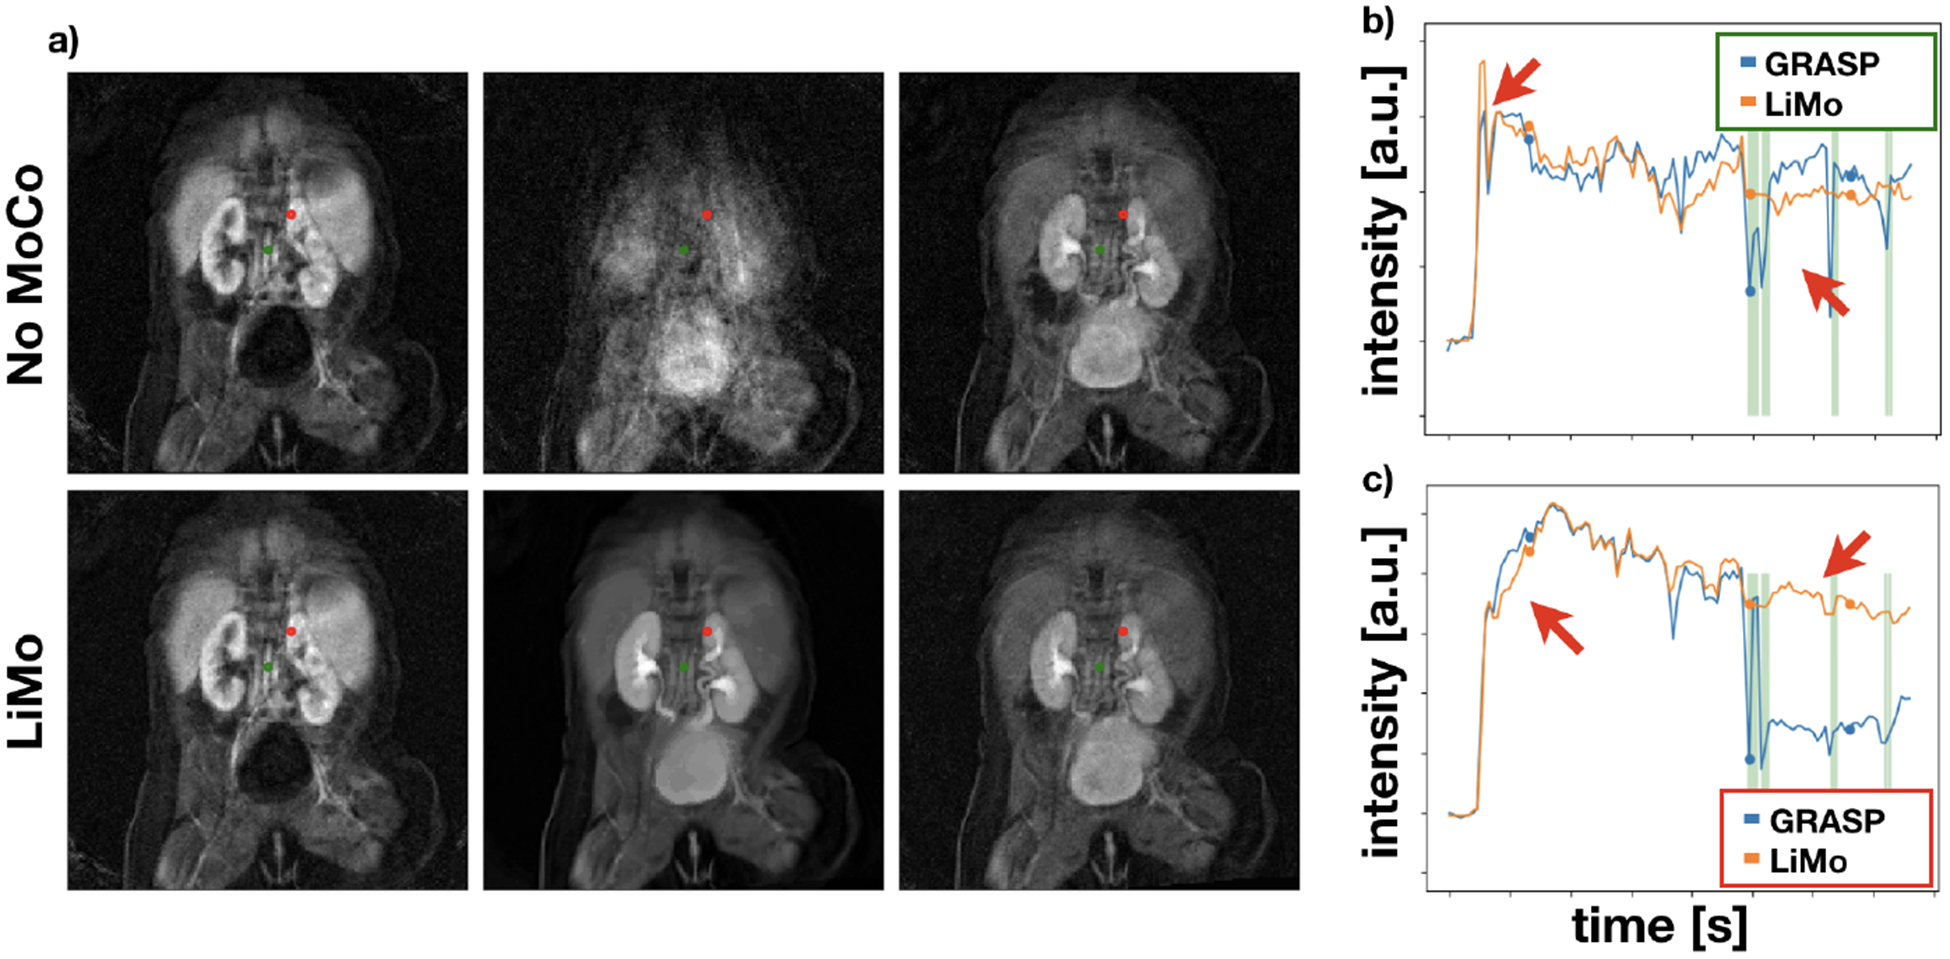
a) Coronal images at three different time instances of subject (b) for before alignment (top) and after aligning with LiMo-MoCo. Red and green marks indicate the voxels used to generate time intensity curves of the right panels. b) and c) show the time intensity curves of the areas marked in red (top) and green (bottom) in the coronal images for No MoCo and LiMo-MoCo.
We show the numerical results in the nRMSE boxplots of figure 3. The median nRMSE for No MoCo, REFVOL, gPCA and LiMo are, respectiely, 0.044, 0.023, 0.036 and 0.018. All differences were statistically significant (p < 0.005). As expected, there is a considerable decrease in nRMSE of all registration methods with respect to No MoCo. The median error of all MoCo methods was near the bottom 95% confidence interval of the No MoCo results. However, all MoCo algorithms exhibited heavy tails with considerable number of outliers: 300 for REFVOL, 107 for gPCA and 101 for LiMo. From those outliers, ~ 100 of them in each method were produced by the presence of a highly abnormal kidney whose signal did not match Sourbrone’s model. The rest of outliers in REFVOL were caused by the failed alignment of a subject.
Fig. 3.
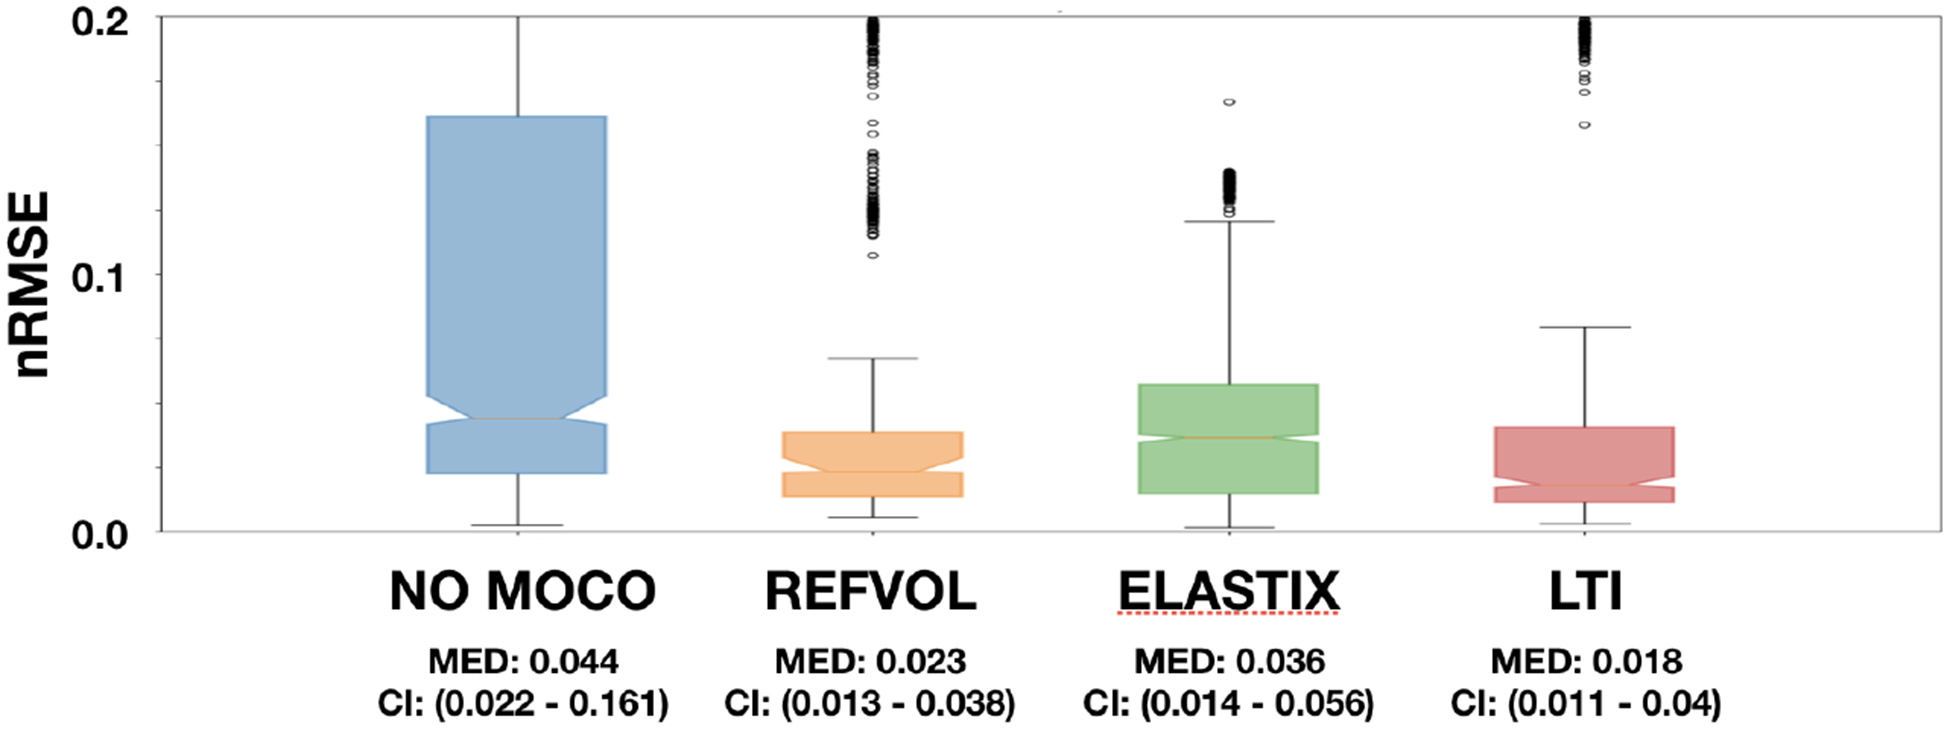
Normalized Root Mean Squared Error for all four approaches (No MoCo, REFVOL, gPCA and LiMo). The plots were generated with data from both kidneys in 10 subjects and after applying wild bootstrap. Medians and 95% confidence intervals of each method are indicated below each box.
The results presented show that it is beneficial to apply alignment of any kind to the DCE-MR image sequences. However, including a model to enforce temporal consistency introduces robustness to the spurious bad registrations like the ones observed in the outliers of REFVOL. Moreover, including models tai-lored to DCE-MR data further improves the alignment and allows to interpolate volumes corrupted due to sudden motion. Future work should inform the LTI model fitting procedure about which volumes have been corrupted by sudden motion and make it robust to those.
5. Conclusions
We present a model-based approach to align temporal sequences of DCE volumes. Our approach characterizes the DCE data over time as the response of an LTI system to the contrast agent injected. It iteratively fits this model and registers the acquired volumes to the fitted model. We tested this approach on newborn patients that underwent DCE MRI for kidney function assessment and evaluated the improvement in TK model fit. The results suggest our approach provides better accuracy in TK model fitfitng and that correct alignment of the aorta is key to successful evaluation of GFR.
Footnotes
Determined as the volume with least motion detected by the center-of-k-space metric
References
- 1.Buonaccorsi GA, et al. : Tracer kinetic modeldriven registration for dynamic contrast-enhanced MRI time-series data. Magnetic Resonance in Medicine 58(5), 1010–1019 (November 2007). 10.1002/mrm.21405 [DOI] [PubMed] [Google Scholar]
- 2.Coll-Font J, et al. : Self-navigated bulk motion detection for feed and wrap renal dynamic radial VIBE DCE-MRI. In: ISMRM (2019) [Google Scholar]
- 3.Davidson R, Flachaire E: The wild bootstrap, tamed at last. Journal of Econometrics 146(1), 162–169 (September 2008). 10.1016/J.JECONOM.2008.08.003 [DOI] [Google Scholar]
- 4.Feng L, et al. : Golden-angle radial sparse parallel MRI: combination of compressed sensing, parallel imaging, and golden-angle radial sampling for fast and flexible dynamic volumetric MRI. Magnetic resonance in medicine 72(3), 707–717 (September 2014). 10.1002/mrm.24980 [DOI] [PMC free article] [PubMed] [Google Scholar]
- 5.Huizinga W, et al. : PCA-based groupwise image registration for quantitative MRI. Medical Image Analysis 29, 65–78 (April 2016). 10.1016/j.media.2015.12.004 [DOI] [PubMed] [Google Scholar]
- 6.Jaggi M: Revisiting Frank-Wolfe: Projection-Free Sparse Convex Optimization. Proceedings of the 30th International Conference on Machine Learning 28, 427–435 (2013) [Google Scholar]
- 7.Klein S, et al. : elastix: A Toolbox for Intensity-Based Medical Image Registration. IEEE Transactions on Medical Imaging 29(1), 196–205 (January 2010). 10.1109/TMI.2009.2035616 [DOI] [PubMed] [Google Scholar]
- 8.Kurugol S, et al. : Motion-robust parameter estimation in abdominal di usion-weighted MRI by simultaneous image registration and model estimation. Medical Image Analysis 39, 124–132 (July 2017). 10.1016/J.MEDIA.2017.04.006 [DOI] [PMC free article] [PubMed] [Google Scholar]
- 9.Sourbron SP, et al. : MRI-measurement of perfusion and glomerular filtration in the human kidney with a separable compartment model. Investigative Radiology 43(1), 40–48 (2008). 10.1097/RLI.0b013e31815597c5 [DOI] [PubMed] [Google Scholar]
- 10.Wilcoxon F: Individual Comparisons by Ranking Methods. Biometrics Bulletin 1(6), 80 (December 1945) [Google Scholar]
- 11.Yilmaz B, et al. : A Randomized Algorithm for Parsimonious Model Identification. IEEE Transactions on Automatic Control 63(2), 532–539 (February 2018). 10.1109/TAC.2017.2723959 [DOI] [Google Scholar]