Abstract
Microorganisms play a crucial role in biogeochemical cycles and ecosystem processes, but the key factors driving microbial community structure are poorly understood, particularly in alpine environments. In this study, we aim to disentangle the relative contribution of abiotic and biotic factors shaping bacterial and fungal community structure at large and small spatial and integration scales in an alpine system dominated by a stress-tolerant cushion species Thylacospermum ceaspitosum. These effects were assessed in two mountain ranges of northwest China and for two contrasting phenotypes of the cushion species inhabiting two different microtopographic positions. The large- and small-scale abiotic effects include the site and microhabitat effects, respectively, while the large- and small-scale biotic effects include the effects of cushion presence and cushion phenotype, respectively. Soil microbial communities were characterized by Illumina Miseq sequencing. Uni- and multivariate statistics were used to test the effects of abiotic and biotic factors at both scales. Results indicated that the site effect representing the soil pH and abiotic hydrothermal conditions mainly affected bacterial community structure, whereas fungal community structure was mainly affected by biotic factors with an equal contribution of cushion presence and cushion phenotype effects. Future studies should analyze the direct factors contributing to shaping microbial community structure in particular of the cushion phenotypes.
Keywords: cushion plant, phenotypes, facilitation, high-throughput sequencing, soil microbial community, scale
Introduction
Microorganisms are ubiquitous and play key roles in biogeochemical cycles (Delgado-Baquerizo et al., 2016; Fierer, 2017). They also contribute to shaping plant community diversity and sustaining terrestrial ecosystem functions (van der Heijden et al., 2008; Bardgett and van der Putten, 2014). Microbial community structure (i.e., biomass, species richness, and composition) and ecological distribution are influenced by a variety of interacting abiotic and biotic factors (Wardle et al., 2004; Singh et al., 2009; Andrew et al., 2012; de Vries et al., 2012). These ecological filters are different from those of macro-organisms such as plants (Fierer and Jackson, 2006; Fierer et al., 2011; Singh et al., 2012). It has been proposed either that microbial distribution is influenced by geography (Caruso et al., 2011), or that microbes have a cosmopolitan distribution (Fenchel and Finlay, 2003). These alternative theories have stimulated important microbial research. Nevertheless, such researches are by far less common than for macro-organisms, likely due to the small size, unexpected high diversity of microbes and limited resolution of detection methods (Fierer and Jackson, 2006; Green and Bohannan, 2006; Schuster, 2008).
Biotic factors are known to also have a strong influence on the structure and ecological distribution of microbial communities, as direct factors (De Deyn et al., 2011; Barberán et al., 2015), or in interactions with abiotic factors (Yergeau et al., 2010; de Vries et al., 2012). In contrast to macro-organisms, microbes are major participants in material decomposition and, thus, are very likely to have different responses to the biotic and abiotic environment. Specifically, bacterial communities are highly influenced by abiotic factors, such as pH and soil moisture (Singh et al., 2009; Rousk et al., 2010; Bainard et al., 2016), whereas fungal communities are more influenced by biotic factors. This might be due to the strong dependence of the latter organisms on plant litter, rhizodeposition or the direct interactions with dominant plant species, such as pathogens and mycorrhiza (Sugiyama et al., 2008; Millard and Singh, 2009; Lange et al., 2014; Urbanová et al., 2015; Chen et al., 2017). Moreover, because of the differences in dispersion abilities, bacterial and fungal communities may show different biogeographic patterns, and respond to abiotic or biotic factors at different geographic scales (Yergeau et al., 2010; Roy et al., 2013; Li et al., 2017; Ma et al., 2017).
Concerning abiotic factors, soil bacterial communities appear to be more dependent on local soil variables, such as pH, C/N, and water content than on regional abiotic factors, such as climate (Fierer et al., 2011; Bahram et al., 2018). The contribution of local (centimeters to meters) and regional (kilometers to thousands of kilometers) (Bardgett and van der Putten, 2014) abiotic factors to fungal community structure and ecological distribution depend on the scale that is inquired. Climate factors or geographic distance showed a higher contribution to the variation of the fungal community at the regional scale, whereas edaphic variables contribute more at the local scale (Wu et al., 2013; Tedersoo et al., 2014; Chen et al., 2017). Concerning biotic factors (such as plant diversity and genotypes), more focus has been made on plant presence than intraspecific variation effects on soil microbial community (Eskelinen et al., 2009; Weber et al., 2015; Wang et al., 2016; Gao et al., 2017), although intraspecific variation in plant traits has been shown to also influence soil microbial communities (Schweitzer et al., 2008; Yao and Wu, 2010; Courty et al., 2011; Madritch and Lindroth, 2011; de Vries et al., 2012; İnceoğlu et al., 2012). However, compared to abiotic factors, to our knowledge, there has been no study exploring the relative importance of plant presence vs. phenotypic variation in the biotic factors driving soil bacterial and fungal communities. Recently, the effect of different genotypes of cushion plants on soil fungal community has been shown (Roy et al., 2018). In addition, although the relative roles of abiotic and biotic factors on microbial community have been studied at the individual plant level or the ecosystem level (Philippot et al., 2013; Tripathi et al., 2013; Wang et al., 2017), there has been no study assessing the relative importance of abiotic and biotic factors acting at different geographical and integration scales for shaping microbial community structure.
Cushion plants are common nurse plants found in alpine, sub-alpine, Arctic and sub-Arctic habitats (Cavieres and Badano, 2009; Aubert et al., 2014). Cushion plants have been shown to have positive effects on neighboring plants via temperature amelioration (Arroyo et al., 2003), water retention (Schöb et al., 2012) or increase in nutrient availability (Cavieres et al., 2005; Schöb et al., 2012; Roy et al., 2013). However, some cushion plants are also known for their negative effects on understory plants, in particular, those species or phenotypes having very tight canopies (Al Hayek et al., 2015a, b; Bonanomi et al., 2016; Jiang et al., 2018; Pistón et al., 2018). Additionally, in the alpine belt, the beginning of soil formation occurs at the habitats occupied by cushions and their influence on soil organic matter is crucial (Roy et al., 2013). Thus, the microhabitats covered by cushions are like islands embedded in a bare rock background. Their specific characteristics and large distribution in alpine ecosystems made them an ideal model to illustrate the effects of abiotic and biotic factors on soil microbial communities. Casanova-Katny et al. (2011) investigated the role of fungal root symbionts in the facilitative effects of the cushion plant Azorella madreporica on their associated plants. They found that the mycorrhization of three native plants was six times higher for individuals associated with A. madreporica than individuals outside cushions, and the number of spores also showed a similar trend. Roy et al. (2013) investigated in the French Alps by capillary-electrophoresis single-strand conformation polymorphism (CE-SSCP) the effects of the cushion plant Silene acaulis on the composition of bacterial and fungal communities in soils from calcareous and siliceous rocks. They found that cushion plants structured microbial communities and that this foundation effect was stronger in stressful, acidic and nutrient-limited environments on siliceous rocks. Moreover, bacterial community composition was more similar inside cushions compared to outside, due to the soil pH buffering by cushions. By comparison, genotyping of cushions showed a strong effect on fungal community composition, even when the topography and soil properties were considered (Roy et al., 2013, 2018).
Recent studies have documented that several alpine cushion plant species worldwide exhibited two distinct phenotypes, i.e., ‘tight’ cushions and ‘loose’ cushions, in relation to varying stress conditions induced by mesotopographic positions (Michalet et al., 2011, 2016; Al Hayek et al., 2014, 2015a,b; Jiang et al., 2018; Pistón et al., 2018). ‘Tight’ cushions with dense canopies and convex morphology are more frequent at habitats with infertile soils from convex mesotopography, whereas ‘loose’ cushions with a more open canopy and flat morphology are more frequent at habitats with more fertile soils from concave mesotopography. The former phenotypes have dominant negative effects on other plant species, whereas the latter ones have important facilitative effects (Michalet et al., 2011, 2016; Al Hayek et al., 2015a).
It has been shown that both varying environmental conditions and dominant plant genotypes may alter the effect of cushion plants on soil microbial communities (Roy et al., 2018). To expand on these findings, alpine cushion systems from western China dominated by two contrasting phenotypes of the cushion plant Thylacospermum caespitosum (Michalet et al., 2016; Jiang et al., 2018) were selected in order to assess the relative roles of large- and small-scale abiotic and biotic factors in shaping the structure of soil microbial communities. Large-scale abiotic effects (site effects) were assessed by sampling two sites in different regions and climates (Qilian and Tianshan Mountains). Thus, the site effects were related to the abiotic changes at regional scale (Lortie et al., 2004; Michalet et al., 2015). Small-scale abiotic effects (microhabitat effects) were assessed in two contrasting mesotopographic positions (unfertile convex and fertile concave) (Brooker et al., 2009; Michalet et al., 2015). Large-scale biotic factors were assessed sampling below cushions and in adjacent open areas (cushion presence/absence treatment), whereas small-scale biotic factors were assessed sampling at the microhabitats of two contrasting phenotypes of the cushions. We aim to answer the following questions: (1) Does the relative importance of abiotic and biotic factors vary between bacteria and fungi? (2) Does the relative importance of regional versus local scale abiotic factors vary between bacteria and fungi? (3) Does the relative importance of cushion presence versus cushion phenotype effects vary between bacteria and fungi? Our study has the potential to better understanding the role of facilitation for ecosystem functioning and soil microbial diversity in alpine environments.
Materials and Methods
Materials, Experimental Design, and Soil Sampling
The study was conducted in two alpine sites (Qilian and Tianshan Mountains) with contrasting climate conditions. The Qilian Mountain site (hereafter QL, 39.590°N, 96.433°E, and 3696 m elevation) is located in the Yanchiwan national nature reserve, in Gansu Province, close to the edge of Qaidam Basin. Annual precipitation is 167 mm and mean annual temperature −3.9°C. Tianshan-mountain field site (hereafter TS, 43.117°N, 86.821°E, and 3772 m elevation) is situated in Xinjiang Province, with 312 mm of annual precipitation and −7.2°C of mean annual temperature. Both sites were located in northwest China where the climate is a typically continental temperate climate with a maximum of rainfall during the summer season. However, the Qilian site is drier than the Tianshan site, likely due to more western oceanic influences reaching the latter but not the former (Jiang et al., 2018). In addition to the obvious differences of hydrothermal conditions, the variance of abiotic factors between these two sites were mainly reflected by soil pH. Meanwhile, the abiotic factor differences of microhabitat were mainly due to soil nutrient contents (total organic carbon and C/N) (Jiang et al., 2018, also Supplementary Figure S3).
At Qilian and Tianshan sites, the plant communities are dominated by the alpine cushion plant Thylacospermum ceaspitosum (Caryophyllaceae), which is one of the most drought-tolerant alpine cushion species in the world, occurring between 3600 and 5900 m of elevation depending on latitudes (de Bello et al., 2011; Řeháková et al., 2015). In the previous study, two phenotypes of T. caespitosum have been observed in Ladakh (India) (Dvorský et al., 2013). Michalet et al. (2016) and Jiang et al. (2018) have shown that at our sites these two phenotypes occurred in contrasting habitats in relation to local mesotopographic variations. Tight dome-shaped phenotypes occur on convex topography on shallow drier soils, whereas loose flat phenotypes occur on concave topography with deeper and wetter soils (Figure 1), as described for other alpine cushion species (Michalet et al., 2011; Al Hayek et al., 2015a). Thus, these two contrasting microhabitats were used to assess at the two sites the contribution of the small-scale abiotic effects.
FIGURE 1.
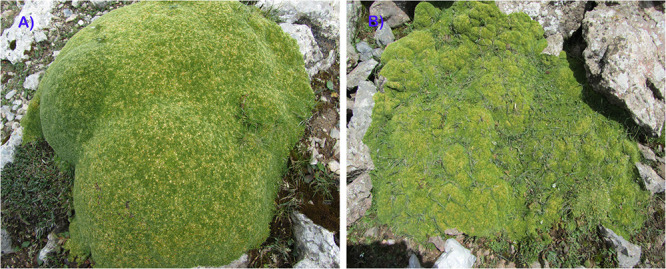
Different phenotypes of Thylacospermum caespitosum (Caryophyllaceae). (A): tight phenotype; (B): loose phenotype.
To assess the contribution of biotic factors to the diversity and composition of bacterial and fungal communities, we sampled the soils below cushions of the two phenotypes and in adjacent open areas with similar microhabitat conditions (i.e., with similar mesotopography and soil depth than the cushions) (Jiang et al., 2018). Three individual cushions of each phenotype of T. caespitosum were selected in late July of 2015 in each microhabitat for soil sampling. Then, four soil cores (0–10 cm deep) were obtained from both soils below the cushions and in open areas close to each cushion. All soil samples were sieved and the four soil cores form each replicate of each treatment were mixed thoroughly to produce one composite soil sample. A total of 24 soil samples [two sample sites × two phenotypes × two cushion treatments (i.e., inside and outside cushions) × three replicates] were transferred to sterile polythene bags, labeled and transported to the laboratory with cooler and then stored at −20°C for molecular analysis.
Nucleic Acid Extraction and PCR Amplification
DNA of soil microbes was extracted by E.Z.N.A. Soil DNA Kit (Omega Bio-Tek, Inc., United States). The primer pair 338F-806R with barcodes was used to amplify bacterial V3–V4 regions fragments (Mori et al., 2014). ITS-5 and ITS-2 with barcodes were used to amplify fungal partial rRNA gene and ITS fragments (White et al., 1990). The total volume of PCR amplification is 20 μL, which contains 4 μL 5 × FastPfu Buffer, 2 μL 2.5 mM dNTPs, 0.4 μL FastPfu Polymerase (TransGen, CN), 0.8 μL 5 μM forward primer, 0.8 μL 5 μM reverse primer and 10 ng template DNA, respectively. PCR performed the following steps: (1) 95°C for 3 min; 27 cycles of 95°C for 30 s, 55°C for 30 s, 72°C for 45 s; then 72°C for 10 min and 2) 95°C for 3 min; 30 cycles of 95°C for 30 s, 58°C for 30 s; 72°C for 45 s; followed by 72°C for 10 min. In order to eliminate the bias induced by amplification, each sample had three duplicates and we mixed the product of the amplification from one sample. Then amplicons were extracted from 2% agarose gels and purified using the AxyPrep DNA Gel Extraction Kit (Axygen Biosciences, Union City, CA, United States) and quantified by QuantiFluorTM-ST (Promega, United States).
Sequencing and Data Processing
The purified PCR products were subjected to paired-end sequencing by Illumina Miseq pair-end 300 at Majorbio BioPharm Technology Co., Ltd. (Shanghai, China). We used QIIME (version 1.9.1) for quality-filtering (Caporaso et al., 2010). Reads shorter than 50 bp or quality scores below 20 were removed and then paired reads that overlap longer than 10 bp were merged into one sequence according to overlap between pair-end reads. All merged sequences with any ambiguous bases or with any errors in either forward or reverse primer, or sequences with mismatch rate more than 0.2 among the overlapped region were removed. Chimeras were eliminated by using UCHIME (Edgar et al., 2011). Valid sequences without chimeras were subsequently clustered into different OTUs (Operational Taxonomic Units) by using UPARSE (version 7.1, Edgar, 2013) at 97% similarity cutoff. The taxonomy of each 16S rRNA and ITS OTUs were analyzed against the RDP (Cole et al., 2014) and UNITE (Nilsson et al., 2018) database at a default confidence threshold. Shannon diversity index was calculated by counting the number of observed OTUs through mothur (version v.1.35.1)1 (Schloss et al., 2009, 2011). In order to avoid the overestimation of diversity, the Shannon diversity index was calculated after eliminating singletons from all data. Relative abundances of different samples for bacteria and fungi on the phyla level or other main taxonomic groups were calculated. Moreover, we predicted the bacterial and fungal community functions profile with Faprotax (version 1.2.1, Louca et al., 2016) and FUNGuild (Nguyen et al., 2016), respectively. The ten most abundant OTUs of both bacterial and fungal communities were selected and assigned with the presumable specific function. The raw sequence reads have been submitted to the NCBI Sequence Read Archive repositories (BioProject ID: PRJNA516351).
Statistical Analyses
All analyses were conducted with R (versions 3.4.3, R Development Core Team, 2015) using the packages “vegan” (Oksanen et al., 2017), “stats” (R Development Core Team, 2018) and “MASS” (Venables and Ripley, 2002). Figures were generated mainly by “ggplot2” package (Wickham, 2009) and “plotrix” (Lemon, 2006).
Three-way ANOVA using non-parametric tests was used to assess the effects of the site, habitat, cushion treatments and their interactions on Shannon diversity index and relative abundance of different taxonomic groups. Differences in microbial community composition among treatments were investigated with principal coordinate analysis (PCoA, “vegan” R package) based on Bray-Curtis dissimilarities using three-way non-parametric multivariate analysis of variance (NPMANOVA, “vegan” R package, Anderson, 2001) with 999 permutations. Variance partitioning analyses were conducted on the three-way ANOVA of microbial Shannon diversity and the three-way NPMANOVA of the microbial composition obtained from OTUs to quantify the relative contribution of each explanatory factor to soil microbial community variances (“stats” R package, “MASS” R package). Based on the tested abiotic factors (Jiang et al., 2018, Supplementary Figure S3), the site effect was used to quantify the large scale abiotic effects, which were mainly related to soil pH and abiotic hydrothermal conditions. The habitat and the habitat × site interaction effect were used to quantify the small scale abiotic effects (microhabitat effects) because different phenotypes and their paired-open microsites occurred in different local environmental conditions. Additionally, this microhabitat effects were mainly related to soil nutrition contents. The cushion and the site × cushion interaction effect was used to quantify the cushion presence effects (large-scale biotic effects), whereas the habitat × cushion and site × habitat × cushion interaction effects were used to quantify the cushion phenotypic effects (small-scale biotic effects) (Table 1).
TABLE 1.
Abiotic and biotic factors at different scales.
| Factors | Scales | Explanations |
| Abiotic | ||
| Site | Site (large-scale) | Effects of this treatment are related to abiotic factor changes at regional scale, here, the effects are mainly due to the variance of soil pH and abiotic hydrothermal conditions. |
| Habitat Habitat × site |
Microhabitat (small-scale) | Effects of these treatments are related to abiotic changes in meso-topography, here, the effects are mainly due to the variance of soil nutrients. |
| Biotic | ||
| Cushion Cushion × site |
Cushion presence | Effects of these treatments are relevant to cushion presence/absence (i.e., differences between cushion and open microhabitats). |
| Cushion × habitat cushion × habitat × site |
Cushion phenotype | Effects of these treatments are relevant to cushion phenotypes (i.e., loose- and tight-cushions). |
Results
A total of 362,331 raw 16S rRNA gene sequences and 723,303 raw ITS sequences were obtained from the 24 soil samples collected in all treatments combinations. After quality filtering, we obtained a total of 324,709 and 369,086 valid sequences for bacteria and fungi, respectively. Valid sequences were assigned to a total of 2,440 OTUs for the bacteria and 1,457 OTUs for the fungi.
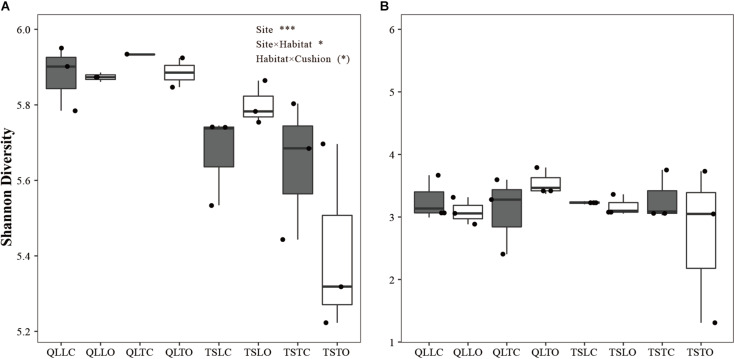
There was a highly significant site effect on the Shannon index of bacterial communities, due to slightly higher diversity in the Qilian Mountains than in the Tianshan Mountains (PSite < 0.001, Figure 2A). There was also a weakly significant site × habitat interaction, due to lower bacterial diversity in the tight than in the loose habitat in the Tianshan Mountains only (PSite × Habitat < 0.05, Figure 2A). Finally, there was a marginally significant habitat × cushion interaction (PHabitat × Cushion < 0.1), due to a tendency in both mountain ranges for lower bacterial diversity in the open than below cushions in the tight cushion habitats and the converse in the loose cushion habitats. Altogether, these results show that the effect of abiotic factors on bacterial diversity, and in particular the site effect (related to soil pH and abiotic hydrothermal conditions) was significant and the effect was larger in effect size than other effects. In contrast, there was no significant effect of any abiotic or biotic factors on the Shannon index of fungal communities (Figure 2B).
FIGURE 2.
Mean (±SE) Shannon diversity index for (A) bacterial and (B) fungal communities from the soils of the loose and tight phenotypes of Thylacospermum caespitosum (black boxes) and their paired open plots (white boxes) in the two mountain ranges. The first three letters of QLL and QLT indicate loose and tight phenotypes in the Qilian mountains, respectively; TSL and TST indicate loose and tight phenotypes in the Tianshan mountains. Results of the effects of the Site, Habitat, Cushion treatments and their interactions are indicated above panel. (*)P < 0.1; *P < 0.05; ***P < 0.001.
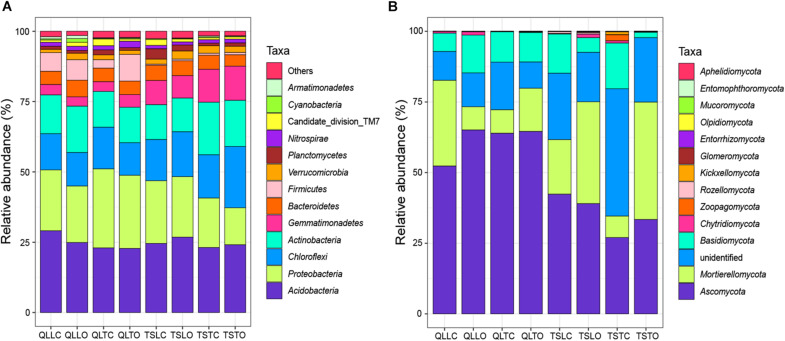
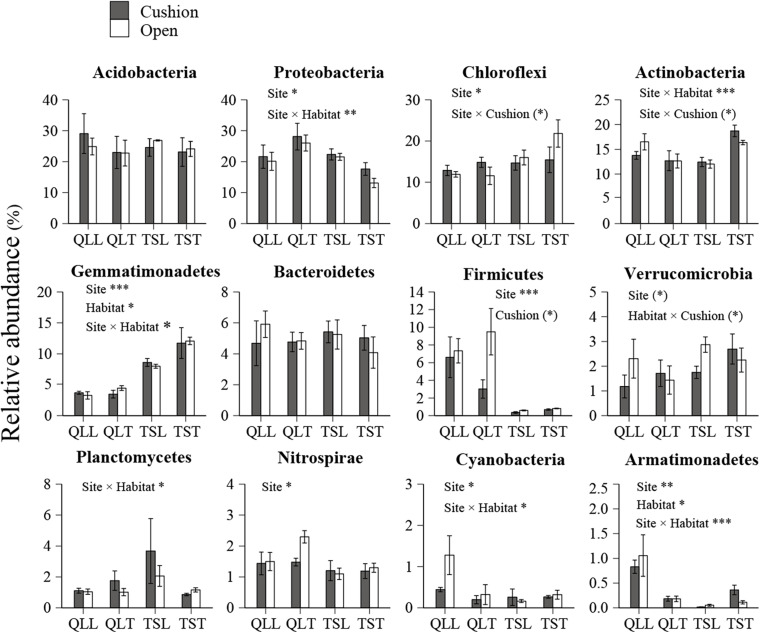
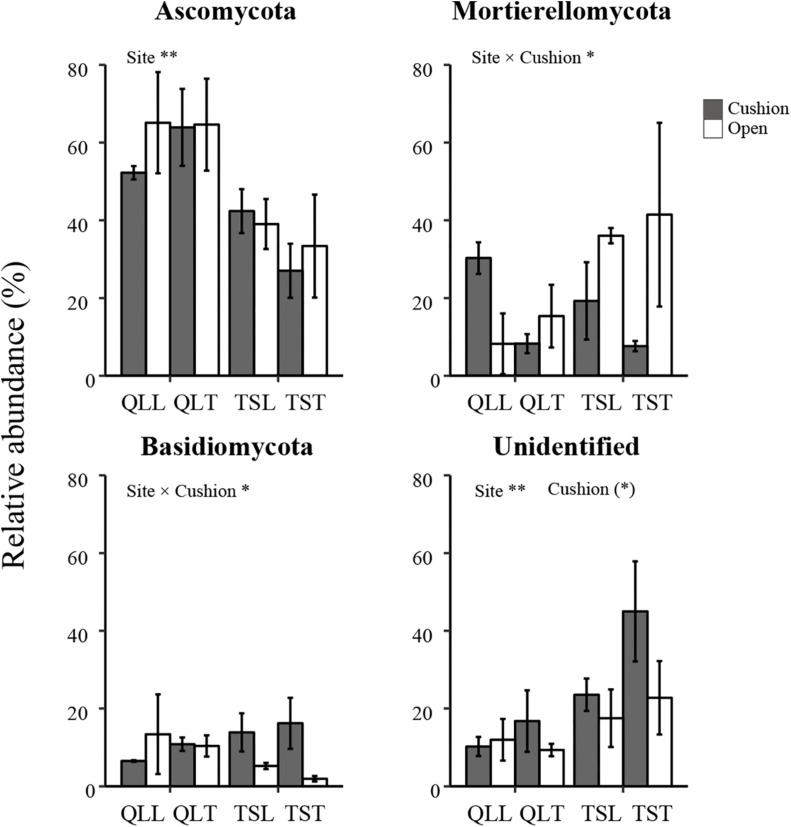
All the representative sequences with the highest abundance of each OTU were selected for the taxonomy assignment. The taxa with abundance below 1% were assigned to one group and named “others”. Finally, 14 phyla (39 orders) for bacteria and 13 phyla (22 orders) for fungi were examined (Figure 3). The relative abundances of Proteobacteria, Chloroflexi, Gemmatimonadetes, Firmicutes, Verrucomicrobia, Nitrospirae, Cyanobacteria, and Armatimonadetes were significantly affected by the site effect, with most of these phyla more abundant at the Qilian Mountains site, except Chloroflexi and Gemmatimonadetes, that were conversely more abundant at the Tianshan Mountains site (Figure 4). In addition, the relative abundances of Proteobacteria, Actinobacteria, Gemmatimonadates, Planctomycetes, Cyanobacteria, and Armatimonadetes were also significantly affected by the microhabitat effect, with specific variations across habitats at the two sites for each phylum (Figure 4). Only the relative abundances of three phyla (Chloroflexi, Actinobacteria, and Firmicutes) were marginally significantly affected by cushion presence and only the relative abundance of Verrucomicrobia was marginally significantly affected by cushion phenotype (Figure 4). For the fungi, the relative abundances of both Ascomycota and the entire unidentified taxa were significantly affected by the site effect, whereas the relative abundance of Mortierellomycota, Basidiomycota and the unidentified taxa were significantly affected by cushion presence (Figure 5). Also, Ascomycota is more abundant in Qilian than Tianshan while the unidentified taxa showed the opposite trend. Irrespective of the phenotype, Mortierellomycota is more abundant in open areas while Basidiomycota is more abundant below the cushions, but this is only true in the Tianshan mountain site.
FIGURE 3.
The stacked columns of (A) bacterial and (B) fungal community at the phylum level. “Others” of bacteria indicate the taxa with abundance below 1%. “Unidentified” of fungi indicate the OTUs without specific taxon.
FIGURE 4.
Mean (±SE) relative abundance of main bacterial taxonomic groups at the phylum level from the soils of the loose and tight phenotypes of Thylacospermum caespitosum (black bars) and their paired open plots (white bars) in the two mountain ranges. Legend of bars is the same as in Figure 2. Results of the effects of the Site, Habitat, Cushion treatments and their interactions are indicated above each panel. *P < 0.05; **P < 0.01; ***P < 0.001; (*)P < 0.1.
FIGURE 5.
Mean (±SE) relative abundance of main fungal taxonomic groups at the phylum level from the soils of the loose and tight phenotypes of Thylacospermum caespitosum (black bars) and their paired open plots (white bars) in the two mountain ranges. Legend of bars is the same as in Figure 2. Results of the effects of the Site, Habitat, Cushion treatments and their interactions are indicated above each panel. *P < 0.05; **P < 0.01; (*)P < 0.1.
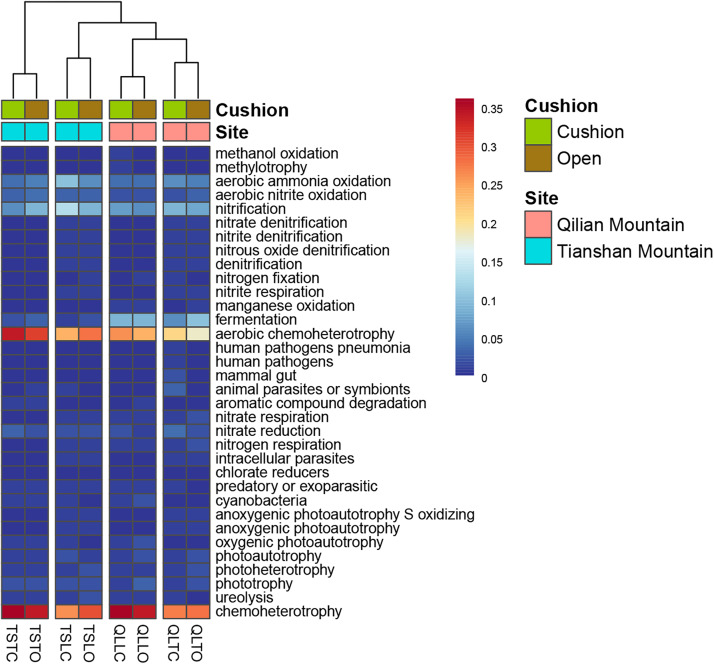
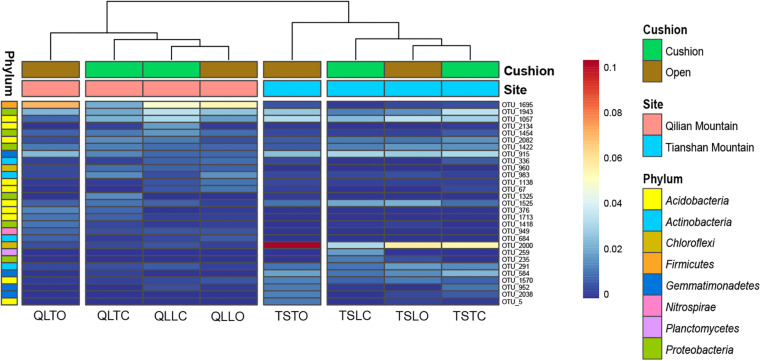
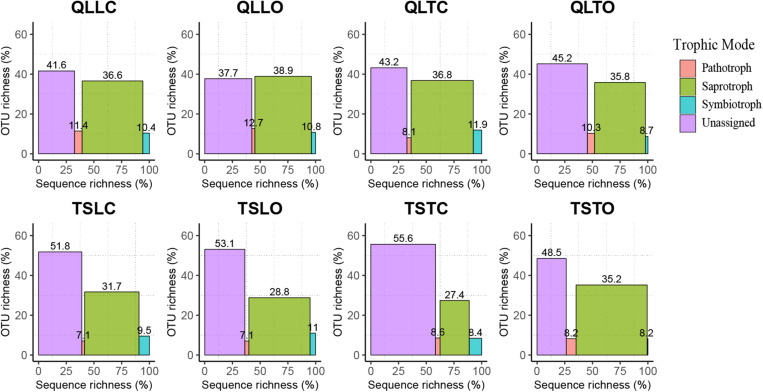
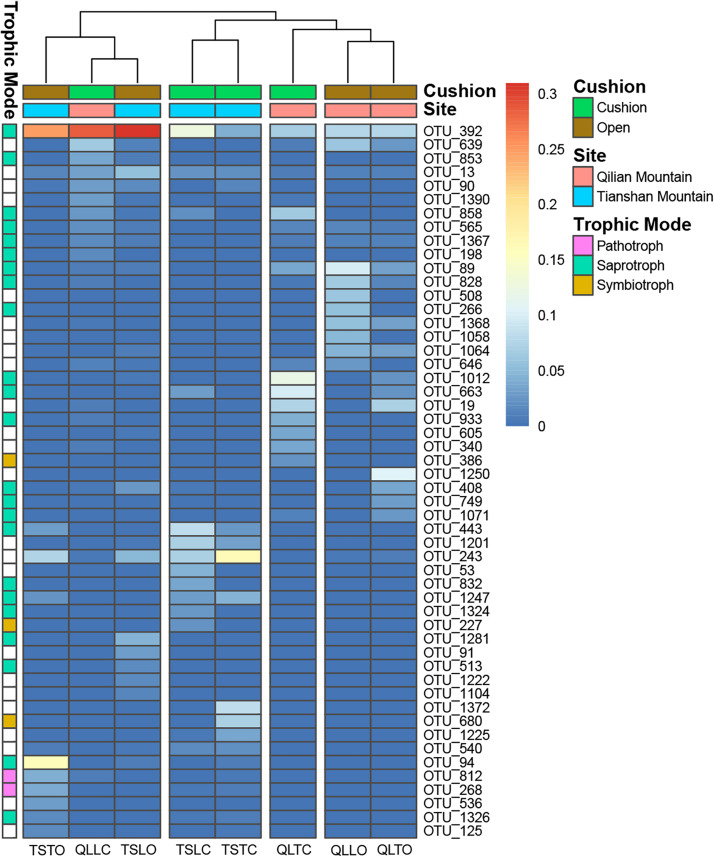
The bacterial-community functions were predicted by Faprotax, and most of the bacterial taxa were not assigned the specific presumable functions, leading to a low relative abundance of the assigned functional groups. The aerobic chemo-heterotrophic groups and chemo-heterotrophic groups had the highest relative abundances, range from 0.2–0.35 and 0.28–0.35, respectively (Figure 6). Moreover, aerobic ammonia oxidation, nitrification and fermentation groups had the second-highest relative abundance, with 0.1–0.15 in values. The functional profile of the bacterial community was similar within the same habitat. The samples were clustered into four groups according to the sampling plots (Figure 6). The site and microhabitat effects and the cushion presence significantly influenced the presumable functions (Supplementary Figure S1). The ten most abundant bacterial OTUs of each treatment were selected to explore their functions, but only two OTUs (OTU1943 and OTU1418) were assigned the presumable function (aerobic- chemoheterotrophy and nitrite-denitrification, respectively). The result illustrated that the bacterial dominant OTUs were mainly assigned to Acidobacteria, Proteobacteria, Gemmatimonadetes and Actinobacteria (Figure 7). In particular, OTU2000 (Chloroflexi) showed higher relative abundance at tight-cushion habitat and loose-cushion paired open plots of Tianshan. Additionally, OTU1695 (Firmicutes) showed higher relative abundance at open plots of Qilian regardless of the phenotypes (Figure 7). Most of the fungal taxa were also not assigned presumable functions by the current FUNGuild analysis. A large number of the taxa with the presumable functions belonged to saprotroph, as the result showed high relative abundance for both OTUs and sequences (i.e., the area of each green bar, Figure 8). Moreover, only the site effect showed a marginally significant effect on the fungal functional groups (Supplementary Figure S2). The ten most abundant fungal OTUs were also selected to explore their functions, most of them belonging to saprotrophic modes which are consistent with the entire fungal community (Figure 9). The fungal trophic modes of dominant OTUs were similar, regardless of the phenotypes of the cushions, below cushions at the Tianshan site or at open plots of both the Qilian and Tianshan sites.
FIGURE 6.
The functional profile of the bacterial community. The samples were clustered by the relative abundance of the assigned functional groups. The third letter of sample names (i.e., L and T) indicate the loose and tight phenotypes, respectively; the samples below cushions of the two phenotypes and in adjacent open areas which were labeled with green and brown colors, respectively.
FIGURE 7.
The 10 most abundant bacterial OTUs of each treatment. The color blocks on the left represent the taxa corresponding to each OTUs. The third letter of sample names (i.e., L and T) indicate the loose and tight phenotypes, respectively; the samples below cushions of the two phenotypes and in adjacent open areas which were labeled with green and brown colors, respectively.
FIGURE 8.
The functional profile of the fungal community predicted by FUNGuild. OTUs and sequences not assigned to trophic modes were placed into the unassigned groups. The proportion of sequence richness and proportion of OTU richness assigned to the trophic modes were represented by the x- and y-axis, respectively.
FIGURE 9.
The 10 most abundant fungal OTUs of each treatment. The color blocks on the left represent the trophic modes assigned to each OTUs, and the white blocks of trophic mode indicate the taxa were not assigned functions.
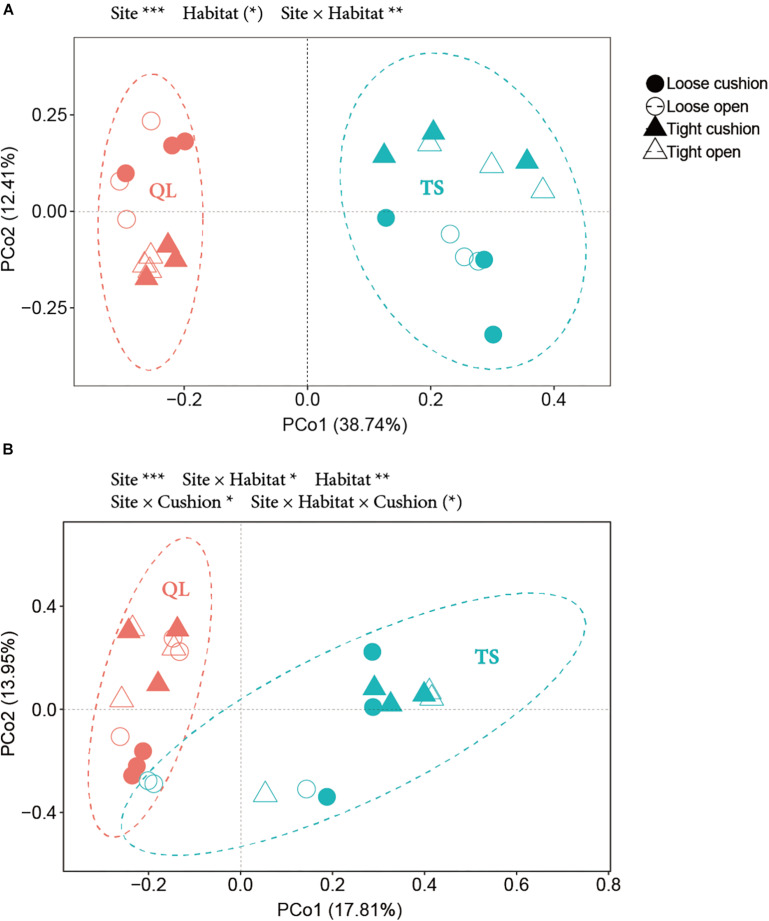
The results of the PCoA showed that the primary source of variation in OTUs composition was, for both bacterial and fungal communities, the large-scale abiotic effect, with always TS plots and QL plots separated along the first axis (highly significant site effect in both Figures 10A,B, both PSite < 0.001). The second source of variation was for both community types the small-scale abiotic effects, with-in both cases contrasting positions along axis 2 for the concave and convex habitats depending on sites (significant site × habitat interactions in both Figures 10A,B, PSite × Habitat < 0.01 for A, PSite × Habitat < 0.05 for B). However, only the fungal community was also affected by cushion presence and cushion phenotype effects (PSite × Cushion < 0.05, PSite × Habitat × Cushion < 0.1) (Figure 10B and Supplementary Table S2).
FIGURE 10.
PCoA (Principal coordinate analysis) based on OTUs data from (A) bacteria and (B) fungi. Solid and hollow shapes indicate cushion and non-cushion plots, respectively. Circles and triangles indicate loose and tight phenotypes, respectively. Pink and blue indicate Qilian (QL) and Tianshan (TS) mountains, respectively. Ellipses show the 95% confidence intervals of the samples from each site. Results of treatment effects in the NPMANOVA are given on the top of each panel: * P < 0.05; ** P < 0.01; *** P < 0.001; (*) P < 0.1.
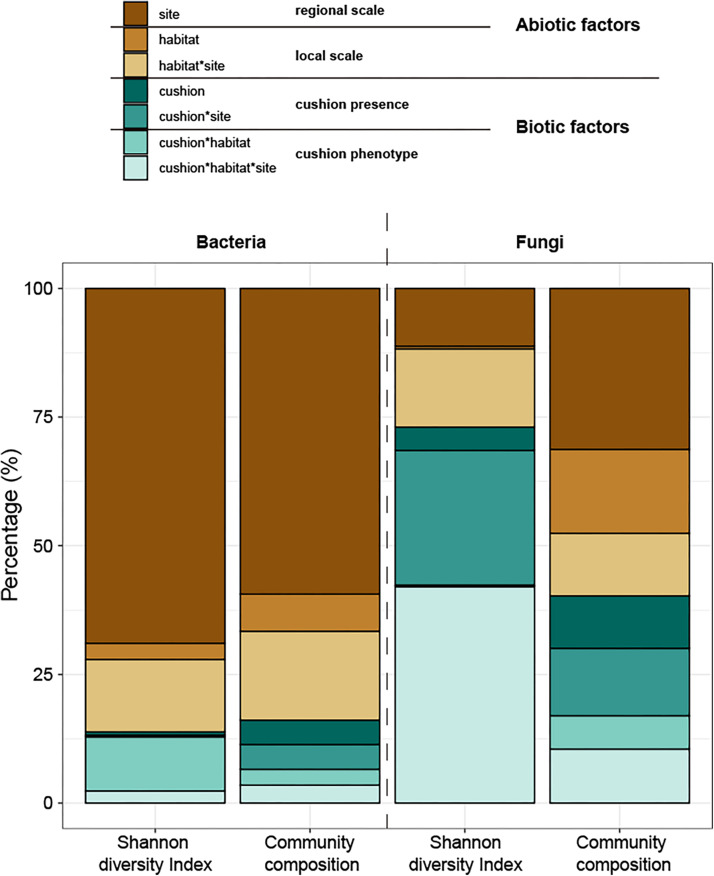
The total amounts of variation explained by the treatments were 73.8% and 20.5% for bacterial and fungal diversity, respectively and 62.3 and 45.0% for bacterial and fungal composition, respectively. Variance partitioning showed that bacterial diversity was primarily (69%) driven by the site effect, and only weakly (17%) by the microhabitat effects, whereas both cushion presence and their phenotypes had small effects (1 and 13%, respectively) (Figure 11). In contrast, fungal diversity was strongly driven by biotic factors with similar contributions of cushion presence (31%) and cushion phenotype effects (42%). Bacterial community composition was also primarily driven by the site effect (59%), with weak microhabitat effect (24%), whereas cushion-presence effects (10%) had a stronger contribution than the phenotypic effects (7%). Meanwhile, abiotic and biotic factors similarly contributed to fungal community composition (59 and 41%, respectively, Figure 11 and Supplementary Table S1).
FIGURE 11.
Variance partitioning of the different treatment effects and their interaction on the Shannon diversity indexes and composition of microbial communities. The colors of brown series indicate abiotic effects (regional and local abiotic factors); the colors of the green series indicate biotic effects (cushion presence and cushion phenotypes). Each color indicates the specific factor as shown in the legend on the top of the panel.
Discussion
Our study aimed at disentangling the effects of large- and small-scale abiotic and biotic factors in shaping soil microbial communities. Results of PCoA and variance partitioning consistently showed that the contribution of abiotic and biotic factors and of large and small-scale effects strongly differed among micro-organisms inhabiting similar environmental conditions in specific plant communities. Abiotic factors had a much higher influence than biotic factors for bacterial communities and the converse was observed for fungal communities, in particular for diversity. The site effect had a much higher influence on both bacterial diversity and composition than the microhabitat effect. But when the tested abiotic factors were considered (Supplementary Figure S3), the site effect was mainly related to soil pH and abiotic hydrothermal conditions, and the microhabitat effect was mainly related to soil nutrition contents (STOC and C/N). For biotic factors, both cushion presence and cushion phenotypes had a similar contribution to the composition of both community types, whereas the effects of cushion phenotypes had a much higher contribution to bacterial diversity than cushion presence.
The Relative Contribution of Abiotic and Biotic Factors
Bacterial community structure was mainly driven by abiotic factors, in particular the site effect which was probably related to environmental filtering rather than dispersal limitation effects (Hanson et al., 2012; Xiao et al., 2018). The bacterial dominant OTUs showed convergence in the same site. Fungal dominant OTUs also showed the convergence except for fungal community inside the loose cushion of Qilian. Furthermore, previous studies documented the high dependency of bacterial community to abiotic factors and in particular pH (Lauber et al., 2009; Andrew et al., 2012; Shen et al., 2013). The result of this research also supported such conclusions, due to the site effect was mainly related to soil pH and the hydrothermal conditions. Additionally, other important direct factors for bacterial life generally covary with pH, and especially salinity and organic matter content and quality (Lozupone and Knight, 2007; Singh et al., 2009; Ma et al., 2017; Weil and Brady, 2017; Bahram et al., 2018). Soil pH is also relevant to the precipitation on a global scale (Lladó et al., 2017). This probably also explained the strong site effect in this study. In contrast, fungal community structure was mainly affected by biotic factors, which is consistent with previous studies showing that fungal community structure is related to plant diversity (Prober et al., 2014; Chen et al., 2018) and genetic variation (Roy et al., 2018). A recent research showed that the fungal diversity was also determined by the net primary productivity (Liu et al., 2020). These are mostly due to the important impacts of plants on soil fungal communities through root exudates (Broeckling et al., 2007; Zinger et al., 2011; Prober et al., 2014). Fungi can decompose high molecular substrates, such as cellulose and lignin (de Boer et al., 2005). This tight relationship might also be due to direct interactions between fungi and plants (Millard and Singh, 2009; Peay et al., 2013). Especially, mycorrhizal fungi and fungal plant pathogens usually show close correlations with plants (Berg and Smalla, 2009; Martínez-García and Pugnaire, 2011; Hiiesalu et al., 2014).
The Relative Contribution of Site and Microhabitat Effects
We found that the site effect had a much higher influence on both diversity and composition than the microhabitat effect, especially for bacteria. However, the strong site effect was likely due to the variance of soil pH among others (such as precipitation and average summer temperature) (Supplementary Figure S3). Thus, this result is consistent with most previous studies showing an dominant influence of local soil factors. For example, in their continental-scale assessment of macro-organisms and soil bacterial communities, Fierer and Jackson (2006) found that the common predictors of macro-organisms were not suitable for bacteria, which geographical distribution was more influenced by local soil factors (see also Dequiedt et al., 2011). In general, microbial communities have been shown to be more influenced by local than regional soil factors, as found by Chu et al. (2010) in the arctic. Roy et al. (2013) also explored soil microbial communities in the alpine cushion plants system. They found a dominant effect of local variation in soil factors in relation to bedrock types, in particular for fungal communities that are highly influenced by differences in nutrient availability induced by bedrock types. In the recent global investigation of topsoil communities, local environmental variables are also the dominant factors for bacterial communities, and in particular, pH having the strongest effect before other abiotic factors (Bahram et al., 2018). Compared to bacteria, soil and climate variables had similar effects on fungal community composition (Bahram et al., 2018). In contrast, Wang et al. (2015) and Andam et al. (2016) found that regional abiotic parameters highly contribute to variation in bacterial community structure. The assessment of 248 isolates of Pseudomonas from ten sites with molecular technologies at different resolutions, showed that genotypic composition was mainly driven by geographical distance (Cho and Tiedje, 2000). These contrasting results of the literature might be explained by the scale of inquiry, with the effects of geographical distance more likely to show up at global (continental) scales than at smaller scales (Martiny et al., 2006). We also suggest that the dominant influence of site over the microhabitat found in our study might be due to stronger differences in soil conditions existing between mountain ranges than between topographic positions within mountain ranges in this alpine system, as shown by Jiang et al. (2018) on the same alpine system (Supplementary Figure S3).
Carbon mineralization rate was found to be the direct factor driving the relative abundance of bacterial phyla in the study of Fierer et al. (2007) on forest soils. In addition, Acidobacteria, Proteobacteria, Chloroflexi, Verrucomicrobia, and Actinobacteria may split into two different nutritional types, i.e., oligotrophic or copiotrophic types. The relative abundance of oligotrophic taxa, such as Acidobacteria and Verrucomicrobia, decreased with accelerating carbon mineralization rate, while copiotrophic (Proteobacteria and Actinobacteria) abundance increased. In our study, these phyla responded differently to the abiotic factors of different scales. This shows that not all microbial taxa manifest similar biogeographical patterns (Fierer, 2008). In addition, Chloroflexi (OTU2000) was more abundant at open plots and under tight cushions of Tianshan. Previous research has documented the Chloroflexi are usually distributed in oligotrophic conditions (Yamada et al., 2005) and tight cushions occur more frequently at habitats with infertile soils. Similarly, Firmicutes (OTU1965) can tolerate extreme conditions (Hortal et al., 2013), and it had higher abundances at tight-cushion paired open plots.
The Relative Contribution of Cushion Presence and Cushion Phenotypes Effects
Our results also indicate that both cushion presence and cushion phenotype effects contributed similarly to the composition of both community types, whereas for bacterial diversity we found a much higher contribution of cushion phenotypes than cushion presence. The lack of studies assessing the relative importance of the effects of plant presence and plant phenotypic effects on microbial communities impedes a straightforward comparison of our results to those of the literature. However, Li et al. (2018) found that bacterial and fungal communities responded differently to spruce phenotypes with leaf water content significantly influencing fungal community composition, but not bacterial communities. In contrast, Aira et al. (2010) found that the soils of two different genotypes of maize hosted different bacterial and fungal communities. Different biotic effects mainly result from contrasting root excretions (Cregger et al., 2018; Li et al., 2018; Zhalnina et al., 2018), and generally, saprotrophic bacteria show faster response than saprotrophic fungi, the latter needing readily accessible energy for proliferation (Cardon and Gage, 2006). In nitrogen-poor conditions dominated by nutrient conservative plants with low relative growth rate and low specific leaf area, fungi are relatively more abundant than bacteria due to the higher advantage of the former organisms to degrade low-quality plant litter (de Vries et al., 2012). The result of FUNGuild showed that the abundance of saprotrophic fungi was much higher than that of pathogenic and symbiotic fungi (Figure 8). Furthermore, most of the dominant OTUs belonged to saprotrophic fungi which might be due to the traits of the cushion species Thylacospermum caespitosum. The results of Faprotax illustrated that the abundance of aerobic-ammonia-oxidation bacteria and nitrifiers were slightly higher than that of other functional groups (Figure 6). In our study, cushion presence had a weak influence on the relative abundance of Actinobacteria, Chloroflexi, and Firmicutes. Since eutrophic soils with more root exudates are generally preferred by Actinobacteria, the observed variation in relative abundance may result from the indirect effects of cushions on soil nutrients. Only the relative abundance of Verrucomicrobia responded slightly to the cushion phenotype effect. This taxon is known for its oligotrophic life history (Bergmann et al., 2011) and a crucial role in biogeochemical cycles (Pol et al., 2007). In addition, Buckley and Schmidt (2001) showed that this taxon was particularly sensitive to soil water content, which is consistent with the contrasting effects on water content found by Michalet et al. (2017) in Lebanon for two different phenotypes of the alpine cushion plant Onobrychis cornuta.
Conclusion
We showed that the variance in soil bacterial community structure was mainly driven by the site effect which due to the variance of soil pH and hydrothermal conditions, whereas variance in fungal community structure was mainly driven by biotic factors with an equal contribution of cushion presence and cushion phenotype effects. Future studies should explore the underlying mechanisms of direct and indirect effects of different cushion phenotypes on soil microbial communities. Integrating below-ground biota and plant–plant interactions in ecosystem studies will certainly improve our understanding of ecosystem functioning and community dynamics in natural systems.
Data Availability Statement
The original contributions presented in the study are included in the article/Supplementary Material; further inquiries can be directed to the corresponding authors.
Author Contributions
RM and CW planned and designed the research. ZL, XJ, and XW helped to analyze the data. CW conducted the experiments and wrote the manuscript. All authors were involved in revising the manuscript critically.
Conflict of Interest
The authors declare that the research was conducted in the absence of any commercial or financial relationships that could be construed as a potential conflict of interest.
Acknowledgments
We offer our special thanks to Peng Guo, Zilong Chen, Meiqin Xie, Rui Liao, Yingfeng Ding, Letao Bo, and Aifeng Guo for helping during field work.
Funding. This research was supported by the National Natural Science Foundation of China (41830321, 31870412, 31670435, 31670437, and 31230014), the Ministry of Agriculture of the People’s Republic of China (2016ZX08009-003-002), the Fundamental Research Funds for the Central Universities (lzujbky-2020-31), the Science and Technology Partnership Program, Ministry of Science and Technology of China (KY201501008), and the National Science and Technology Major Project in Gansu (17ZD2WA017).
Supplementary Material
The Supplementary Material for this article can be found online at: https://www.frontiersin.org/articles/10.3389/fmicb.2020.00925/full#supplementary-material
References
- Aira M., Gómez-Brandón M., Lazcano C., Bååth E., Domínguez J. (2010). Plant genotype strongly modifies the structure and growth of maize rhizosphere microbial communities. Soil Biol. Biochem. 42 2276–2281. 10.1016/j.soilbio.2010.08.029 [DOI] [Google Scholar]
- Al Hayek P., Maalouf J.-P., Baumel A., Dagher-Kharrat M. B., Médail F., Touzard B., et al. (2015a). Differential effects of contrasting phenotypes of a foundation legume shrub drive plant-plant interactions in a Mediterranean mountain. Veg. Sci. 26 373–384. [Google Scholar]
- Al Hayek P., Maalouf J.-P., Touzard B., Michalet R., Semchenko M. (2015b). Disentangling the heritable and plastic components of the competitive and facilitative effects of an alpine foundation species. J. Ecol. 103 1172–1182. 10.1111/1365-2745.12445 [DOI] [Google Scholar]
- Al Hayek P., Touzard B., Le Bagousse-Pinguet Y., Michalet R. (2014). Phenotypic differentiation within a foundation grass species correlates with species richness in a subalpine community. Oecologia 176 533–544. [DOI] [PubMed] [Google Scholar]
- Andam C. P., Doroghazi J. R., Campbell A. N., Kelly P. J., Choudoir M. J., Buckley D. H. (2016). A latitudinal diversity gradient in terrestrial bacteria of the genus Streptomyces. mBio 7:e02200-15. 10.1128/mBio.02200-15 [DOI] [PMC free article] [PubMed] [Google Scholar]
- Anderson M. J. (2001). A new method for non-parametric multivariate analysis of variance. Austral Ecol. 26 32–46. 10.1111/j.1442-9993.2001.01070.pp.x [DOI] [Google Scholar]
- Andrew D. R., Fitak R. R., Munguia-Vega A., Racolta A., Martinson V. G., Dontsova K. (2012). Abiotic factors shape microbial diversity in Sonoran Desert soils. Appl. Environ. Microbiol. 78 7527–7537. 10.1128/AEM.01459-12 [DOI] [PMC free article] [PubMed] [Google Scholar]
- Arroyo M. T. K., Cavieres L. A., Peñaloza A., Arroyo-Kalin M. A. (2003). Positive associations between the cushion plant Azorella monantha (Apiaceae) and alpine plant species in the Chilean Patagonian Andes. Plant Ecol. 169 121–129. 10.1023/A:1026281405115 [DOI] [Google Scholar]
- Aubert S., Boucher F., Lavergne S., Renaud J., Choler P. (2014). 1914-2014: a revised worldwide catalogue of cushion plants 100 years after Hauri and Schröter. Alp. Bot. 124 59–70. 10.1007/s00035-014-0127-x [DOI] [Google Scholar]
- Bahram M., Hildebrand F., Forslund S. K., Anderson J. L., Soudzilovskaia N. A., Bodegom P. M., et al. (2018). Structure and function of the global topsoil microbiome. Nature 560 233–237. 10.1038/s41586-018-0386-6 [DOI] [PubMed] [Google Scholar]
- Bainard L. D., Hamel C., Gan Y. (2016). Edaphic properties override the influence of crops on the composition of the soil bacterial community in a semiarid agroecosystem. Appl. Soil Ecol. 105 160–168. 10.1016/j.apsoil.2016.03.013 [DOI] [Google Scholar]
- Barberán A., McGuire K. L., Wolf J. A., Jones F. A., Wright S. J., Turner B. L., et al. (2015). Relating belowground microbial composition to the taxonomic, phylogenetic, and functional trait distributions of trees in a tropical forest. Ecol. Lett. 18 1397–1405. 10.1111/ele.12536 [DOI] [PubMed] [Google Scholar]
- Bardgett R. D., van der Putten W. H. (2014). Belowground biodiversity and ecosystem functioning. Nature 515 505–511. 10.1038/nature13855 [DOI] [PubMed] [Google Scholar]
- Berg G., Smalla K. (2009). Plant species and soil type cooperatively shape the structure and function of microbial communities in the rhizosphere. FEMS Microbiol. Ecol. 68 1–13. 10.1111/j.1574-6941.2009.00654.x [DOI] [PubMed] [Google Scholar]
- Bergmann G. T., Bates S. T., Eilers K. G., Lauber C. L., Caporaso J. G., Walters W. A., et al. (2011). The under-recognized dominance of Verrucomicrobia in soil bacterial communities. Soil Biol. Biochem. 43 1450–1455. 10.1016/j.soilbio.2011.03.012 [DOI] [PMC free article] [PubMed] [Google Scholar]
- Bonanomi G., Stinca A., Chirico G. B., Ciaschetti G., Saracino A., Incerti G., et al. (2016). Cushion plant morphology controls biogenic capability and facilitation effects of Silene acaulis along an elevation gradient. Funct. Ecol. 30 1216–1226. 10.1111/1365-2435.12596 [DOI] [Google Scholar]
- Broeckling C. D., Broz A. K., Bergelson J., Manter D. K., Vivanco J. M. (2007). Root exudates regulate soil fungal community composition and diversity. Appl. Environ. Microbiol. 74 738–744. [DOI] [PMC free article] [PubMed] [Google Scholar]
- Brooker R. W., Callaway R. M., Cavieres L. A., Kikvidze Z., Lortie C. J., Michalet R., et al. (2009). Don’t diss integration: a comment on Ricklefs’s disintegrating communities. Am. Nat. 174 919–927. 10.1086/648058 [DOI] [PubMed] [Google Scholar]
- Buckley D. H., Schmidt T. M. (2001). Environmental factors influencing the distribution of rRNA from Verrucomicrobia in soil. FEMS Microbiol. Ecol. 35 105–112. 10.1111/j.1574-6941.2001.tb00793.x [DOI] [PubMed] [Google Scholar]
- Caporaso J. G., Kuczynski J., Stombaugh J., Bittinger K., Bushman F. D., Costello E. K., et al. (2010). QIIME allows analysis of high-throughput community sequencing data. Nat. Methods 7 335–336. 10.1038/nmeth.f.303 [DOI] [PMC free article] [PubMed] [Google Scholar]
- Cardon Z. G., Gage D. J. (2006). Resource exchange in the rhizosphere: molecular tools and the microbial perspective. Annu. Rev. Ecol. Evol. Syst. 37 459–488. 10.1146/annurev.ecolsys.37.091305.110207 [DOI] [Google Scholar]
- Caruso T., Chan Y., Lacap D. C., Lau M. C., McKay C. P., Pointing S. B. (2011). Stochastic and deterministic processes interact in the assembly of desert microbial communities on a global scale. ISME J. 5 1406–1413. 10.1038/ismej.2011.21 [DOI] [PMC free article] [PubMed] [Google Scholar]
- Casanova-Katny M. A., Torres-Mellado G. A., Palfner G., Cavieres L. A. (2011). The best for the guest: high Andean nurse cushions of Azorella madreporica enhance arbuscular mycorrhizal status in associated plant species. Mycorrhiza 21 613–622. 10.1007/s00572-011-0367-1 [DOI] [PubMed] [Google Scholar]
- Cavieres L. A., Badano E. I. (2009). Do facilitative interactions increase species richness at the entire community level? J. Ecol. 97 1181–1191. 10.1111/j.1365-2745.2009.01579.x [DOI] [Google Scholar]
- Cavieres L. A., Quiroz C. L., Molina-Montenegro M. A., Muñoz A. A., Pauchard A. (2005). Nurse effect of the native cushion plant Azorella monantha on the invasive non-native Taraxacum officinale in the high-Andes of central Chile. Perspect. Plant Ecol. Evol. Syst. 7 217–226. 10.1016/j.ppees.2005.09.002 [DOI] [Google Scholar]
- Chen W., Xu R., Wu Y., Chen J., Zhang Y., Hu T., et al. (2018). Plant diversity is coupled with beta not alpha diversity of soil fungal communities following N enrichment in a semi-arid grassland. Soil Biol. Biochem. 116 388–398. 10.1016/j.soilbio.2017.10.039 [DOI] [Google Scholar]
- Chen Y., Xu T., Veresoglou S. D., Hu H., Hao Z., Hu Y., et al. (2017). Plant diversity represents the prevalent determinant of soil fungal community structure across temperate grasslands in northern China. Soil Biol. Biochem. 110 12–21. 10.1016/j.soilbio.2017.02.015 [DOI] [Google Scholar]
- Cho J. C., Tiedje J. M. (2000). Biogeography and degree of endemicity of fluorescent Pseudomonas strains in soil. Appl. Environ. Microbiol. 66 5448–5456. [DOI] [PMC free article] [PubMed] [Google Scholar]
- Chu H., Fierer N., Lauber C. L., Caporaso J. G., Knight R., Grogan P. (2010). Soil bacterial diversity in the Arctic is not fundamentally different from that found in other biomes. Environ. Microbiol. 12 2998–3006. 10.1111/j.1462-2920.2010.02277.x [DOI] [PubMed] [Google Scholar]
- Cole J. R., Wang Q., Fish J. A., Chai B., McGarrell D. M., Sun Y., et al. (2014). Ribosomal database project: data and tools for high throughput rRNA analysis. Nucleic Acids Res. 42 D633–D642. 10.1093/nar/gkt1244 [DOI] [PMC free article] [PubMed] [Google Scholar]
- Courty P. E., Labbe J., Kohler A., Marcais B., Bastien C., Churin J. L., et al. (2011). Effect of poplar genotypes on mycorrhizal infection and secreted enzyme activities in mycorrhizal and non-mycorrhizal roots. J. Exp. Bot. 62 249–260. 10.1093/jxb/erq274 [DOI] [PMC free article] [PubMed] [Google Scholar]
- Cregger M. A., Veach A. M., Yang Z. K., Crouch M. J., Vilgalys R., Tuskan G. A., et al. (2018). The Populus holobiont: dissecting the effects of plant niches and genotype on the microbiome. Microbiome 6:31. [DOI] [PMC free article] [PubMed] [Google Scholar]
- de Bello F., Doležal J., Dvorský M., Chlumská Z., Řeháková K., Klimešová J., et al. (2011). Cushions of Thylacospermum caespitosum (Caryophyllaceae) do not facilitate other plants under extreme altitude and dry conditions in the north-west Himalayas. Ann. Bot. 108 567–573. 10.1093/aob/mcr183 [DOI] [PMC free article] [PubMed] [Google Scholar]
- de Boer W., Folman L. B., Summerbell R. C., Boddy L. (2005). Living in a fungal world: impact of fungi on soil bacterial niche development. FEMS Microbiol. Rev. 29 795–811. 10.1016/j.femsre.2004.11.005 [DOI] [PubMed] [Google Scholar]
- De Deyn G. B., Quirk H., Bardgett R. D. (2011). Plant species richness, identity and productivity differentially influence key groups of microbes in grassland soils of contrasting fertility. Biol. Lett. 7 75–78. 10.1098/rsbl.2010.0575 [DOI] [PMC free article] [PubMed] [Google Scholar]
- de Vries F. T., Manning P., Tallowin J. R. B., Mortimer S. R., Pilgrim E. S., Harrison K. A., et al. (2012). Abiotic drivers and plant traits explain landscape-scale patterns in soil microbial communities. Ecol. Lett. 15 1230–1239. 10.1111/j.1461-0248.2012.01844.x [DOI] [PubMed] [Google Scholar]
- Delgado-Baquerizo M., Maestre F. T., Reich P. B., Jeffries T. C., Gaitan J. J., Encinar D., et al. (2016). Microbial diversity drives multifunctionality in terrestrial ecosystems [J]. Nat. Commun. 7;10541 10.1038/ncomms10541 [DOI] [PMC free article] [PubMed] [Google Scholar]
- Dequiedt S., Saby N. P. A., Lelievre M., Jolivet C., Thioulouse J., Toutain B., et al. (2011). Biogeographical patterns of soil molecular microbial biomass as influenced by soil characteristics and management. Glob. Ecol. Biogeogr. 20 641–652. 10.1111/j.1466-8238.2010.00628.x [DOI] [Google Scholar]
- Dvorský M., Doležal J., Kopeckı M., Chlumská Z., Janatková K., Altman J., et al. (2013). Testing the stress-gradient hypothesis at the roof of the world: effects of the cushion plant Thylacospermum caespitosum on species assemblages. PLoS One 8:e53514. 10.1371/journal.pone.0053514 [DOI] [PMC free article] [PubMed] [Google Scholar]
- Edgar R. C. (2013). UPARSE: highly accurate OTU sequences from microbial amplicon reads. Nat. Methods 10 996–998. 10.1038/nmeth.2604 [DOI] [PubMed] [Google Scholar]
- Edgar R. C., Haas B. J., Clemente J. C., Quince C., Knight R. (2011). UCHIIME improves sensitivity and speed of chimera detection. Bioinformatics 27 2194–2200. 10.1093/bioinformatics/btr381 [DOI] [PMC free article] [PubMed] [Google Scholar]
- Eskelinen A., Stark S., Mannisto M. (2009). Links between plant community composition, soil organic matter quality and microbial communities in contrasting tundra habitats. Oecologia 161 113–123. 10.1007/s00442-009-1362-5 [DOI] [PubMed] [Google Scholar]
- Fenchel T., Finlay B. J. (2003). Is microbial diversity fundamentally different from biodiversity of larger animals and plants? Europ. J. Protistol. 39 486–490. 10.1078/0932-4739-00025 [DOI] [Google Scholar]
- Fierer N. (2008). “Microbial biogeography: patterns in the microbial diversity across space and time,” in Accessing Uncultivated Microorganisms: from the Environment to Organisms and Genomes and Back, ed. Zengler K. (Washington DC: ASM Press; ). [Google Scholar]
- Fierer N. (2017). Embracing the unknown: disentangling the complexities of the soil microbiome. Nat. Rev. Microbiol. 15 579–590. 10.1038/nrmicro.2017.87 [DOI] [PubMed] [Google Scholar]
- Fierer N., Bradford M. A., Jackson R. B. (2007). Toward an ecological classification of soil bacteria. Ecology 88 1354–1364. 10.1890/05-1839 [DOI] [PubMed] [Google Scholar]
- Fierer N., Jackson R. B. (2006). The diversity and biogeography of soil bacterial communities. Proc. Natl. Acad. Sci. U.S.A. 103 626–631. 10.1073/pnas.0507535103 [DOI] [PMC free article] [PubMed] [Google Scholar]
- Fierer N., McCain C. M., Meir P., Zimmermann M., Rapp J. M., Silman M. R., et al. (2011). Microbes do not follow the elevational diversity patterns of plants and animals. Ecology 92 797–804. 10.1890/10-1170.1 [DOI] [PubMed] [Google Scholar]
- Gao C., Shi N. N., Chen L., Ji N. N., Wu B. W., Wang Y. L., et al. (2017). Relationships between soil fungal and woody plant assemblages differ between ridge and valley habitats in a subtropical mountain forest. New Phytol. 213 1874–1885. 10.1111/nph.14287 [DOI] [PubMed] [Google Scholar]
- Green J., Bohannan B. J. M. (2006). Spatial scaling of microbial biodiversity. Trends Ecol. Evol. 21 501–507. 10.1016/j.tree.2006.06.012 [DOI] [PubMed] [Google Scholar]
- Hanson C. A., Fuhrman J. A., Horner-Devine M. C., Martiny J. B. (2012). Beyond biogeographic patterns: processes shaping the microbial landscape. Nat. Rev. Microbiol. 14 497–506. 10.1038/nrmicro2795 [DOI] [PubMed] [Google Scholar]
- Hiiesalu I., Partel M., Davison J., Gerhold P., Metsis M., Moora M., et al. (2014). Species richness of arbuscular mycorrhizal fungi: associations with grassland plant richness and biomass. New Phytol. 203 233–244. 10.1111/nph.12765 [DOI] [PubMed] [Google Scholar]
- Hortal S., Bastida F., Armas C., Lozano Y. M., Moreno J. L., García C., et al. (2013). Soil microbial community under a nurse-plant species changes in composition, biomass and activity as the nurse grows. Soil Biol. Biochem. 64 139–146. 10.1016/j.soilbio.2013.04.018 [DOI] [Google Scholar]
- İnceoğlu O., Falcão Salles J., van Elsas J. D. (2012). Soil and cultivar type shape the bacterial community in the potato rhizosphere. Microb. Ecol. 63 460–470. 10.1007/s00248-011-9930-8 [DOI] [PMC free article] [PubMed] [Google Scholar]
- Jiang X., Michalet R., Chen S., Zhao L., Wang X., Wang C., et al. (2018). Phenotypic effects of the nurse Thylacospermum caespitosum on dependent plant species along regional climate stress gradients. Oikos 127 252–263. 10.1111/oik.04512 [DOI] [Google Scholar]
- Lange M., Habekost M., Eisenhauer N., Roscher C., Bessler H., Engels C., et al. (2014). Biotic and abiotic properties mediating plant diversity effects on soil microbial communities in an experimental grassland. PLoS One 9:e96182 10.1371/journal.pone.0096182 [DOI] [PMC free article] [PubMed] [Google Scholar]
- Lauber C. L., Hamady M., Knight R., Fierer N. (2009). Pyrosequencing-based assessment of soil pH as a predictor of soil bacterial community structure at the continental scale. Appl. Environ. Microbiol. 75 5111–5120. 10.1128/AEM.00335-09 [DOI] [PMC free article] [PubMed] [Google Scholar]
- Lemon J. (2006). Plotrix: a package in the red light district of R. R News 6 8–12. [Google Scholar]
- Li Y., Adams J., Shi Y., Wang H., He J. S., Chu H. (2017). Distinct soil microbial communities in habitats of differing soil water balance on the Tibetan Plateau. Sci. Rep. 7:46407. 10.1038/srep46407 [DOI] [PMC free article] [PubMed] [Google Scholar]
- Li Y., Wu X., Chen T., Wang W., Liu G., Zhang W., et al. (2018). Plant phenotypic traits eventually shape its microbiota: a common garden test. Front. Microbiol. 9:2479. 10.3389/fmicb.2018.02479 [DOI] [PMC free article] [PubMed] [Google Scholar]
- Liu S., Wang H., Tian P., Yao X., Sun H., Wang Q., et al. (2020). Decoupled diversity patterns in bacteria and fungi across continental forest ecosystems. Soil Biol. Biochem. 144:107763 10.1016/j.soilbio.2020.107763 [DOI] [Google Scholar]
- Lladó S., López-Mondéjar R., Baldrian P. (2017). Forest soil bacteria: diversity, involvement in ecosystem processes, and response to global change. Microbiol. Mol. Biol. Rev. 81:e00063-16. [DOI] [PMC free article] [PubMed] [Google Scholar]
- Lortie C. J., Brooker R. W., Choler P., Kikvidze Z., Michalet R., Pugnaire F. I., et al. (2004). Rethinking plant community theory. Oikos 107 433–438. 10.1111/j.0030-1299.2004.13250.x [DOI] [Google Scholar]
- Louca S., Parfrey L. W., Doebeli M. (2016). Decoupling function and taxonomy in the global ocean microbiome. Science 353 1272–1277. 10.1126/science.aaf4507 [DOI] [PubMed] [Google Scholar]
- Lozupone C. A., Knight R. (2007). Global patterns in bacterial diversity. Proc. Natl. Acad. Sci. U.S.A. 104 11436–11440. 10.1073/pnas.0611525104 [DOI] [PMC free article] [PubMed] [Google Scholar]
- Ma B., Dai Z., Wang H., Dsouza M., Liu X., He Y., et al. (2017). Distinct biogeographic patterns for Archaea, bacteria, and fungi along the vegetation gradient at the continental scale in eastern china. mSystems 2:e00174-16. 10.1128/mSystems.00174-16 [DOI] [PMC free article] [PubMed] [Google Scholar]
- Madritch M. D., Lindroth R. L. (2011). Soil microbial communities adapt to genetic variation in leaf litter inputs. Oikos 120 1696–1704. 10.1111/j.1600-0706.2011.19195.x [DOI] [Google Scholar]
- Martínez-García L. B., Pugnaire F. I. (2011). Arbuscular mycorrhizal fungi host preference and site effects in two plant species in a semiarid environment. Appl. Soil Ecol. 48 313–317. 10.1016/j.apsoil.2011.04.003 [DOI] [Google Scholar]
- Martiny J. B., Bohannan B. J., Brown J. H., Colwell R. K., Fuhrman J. A., Green J. L., et al. (2006). Microbial biogeography: putting microorganisms on the map. Nat. Rev. Microbiol. 4 102–112. 10.1038/nrmicro1341 [DOI] [PubMed] [Google Scholar]
- Michalet R., Maalouf J. P., Al Hayek P. (2017). Direct litter interference and indirect soil competitive effects of two contrasting phenotypes of a spiny legume shrub drive the forb composition of an oromediterranean community. Oikos 126 1090–1100. 10.1111/oik.03800 [DOI] [Google Scholar]
- Michalet R., Maalouf J. P., Choler P., Clément B., Rosebery D., Royer J. M., et al. (2015). Competition, facilitation and environmental severity shape the relationship between local and regional species richness in plant communities. Ecography 38 335–345. 10.1111/ecog.01106 [DOI] [Google Scholar]
- Michalet R., Schöb C., Xiao S., Zhao L., Chen T., An L., et al. (2016). Beneficiary feedback effects on alpine cushion benefactors become more negative with increasing cover of graminoids and in dry conditions. Funct. Ecol. 30 79–87. 10.1111/1365-2435.12507 [DOI] [Google Scholar]
- Michalet R., Xiao S., Touzard B., Smith D. S., Cavieres L. A., Callaway R. M., et al. (2011). Phenotypic variation in nurse traits and community feedbacks define an alpine community. Ecol. Lett. 14 433–443. 10.1111/j.1461-0248.2011.01605.x [DOI] [PubMed] [Google Scholar]
- Millard P., Singh B. K. (2009). Does grassland vegetation drive soil microbial diversity? Nutr. Cycl. Agroecosyst. 88 147–158. [Google Scholar]
- Mori H., Maruyama F., Kato H., Toyoda A., Dozono A., Ohtsubo Y., et al. (2014). Design and experimental application of a novel non-degenerate universal primer set that amplifies prokaryotic 16S rRNA genes with a low possibility to amplify eukaryotic rRNA genes. DNA Res. 21 217–227. 10.1093/dnares/dst052 [DOI] [PMC free article] [PubMed] [Google Scholar]
- Nguyen N. H., Song Z., Bates S. T., Branco S., Tedersoo L., Menke J., et al. (2016). FUNGuild: an open annotation tool for parsing fungal community datasets by ecological guild. Fungal Ecol. 20 241–248. 10.1016/j.funeco.2015.06.006 [DOI] [Google Scholar]
- Nilsson R. H., Larsson K.-H., Taylor A. F. S., Bengtsson-Palme J., Jeppesen T. S., Schigel D., et al. (2018). The UNITE database for molecular identification of fungi: handling dark taxa and parallel taxonomic classifications. Nucleic Acids Res. 47 D259–D264. 10.1093/nar/gky1022 [DOI] [PMC free article] [PubMed] [Google Scholar]
- Oksanen J., Blanchet F. G., Friendly M., Kindt R., Legendre P., McGlinn D., et al. (2017). vegan: Community Ecology Package. R package version 2.4-5. Available online at: https://CRAN.R-project.org/package=vegan (accessed September, 2018). [Google Scholar]
- Peay K. G., Baraloto C., Fine P. V. (2013). Strong coupling of plant and fungal community structure across western Amazonian rainforests. ISME J. 7 1852–1861. 10.1038/ismej.2013.66 [DOI] [PMC free article] [PubMed] [Google Scholar]
- Philippot L., Raaijmakers J. M., Lemanceau P., van der Putten W. H. (2013). Going back to the roots: the microbial ecology of the rhizosphere. Nat. Rev. Microbiol. 11 789–799. 10.1038/nrmicro3109 [DOI] [PubMed] [Google Scholar]
- Pistón N., Michalet R., Schöb C., Macek P., Armas C., Pugnaire F. I. (2018). The balance of canopy and soil effects determines intraspecific differences in foundation species’ effects on associated plants. Funct. Ecol. 32 2253–2263. 10.1111/1365-2435.13139 [DOI] [Google Scholar]
- Pol A., Heijmans K., Harhangi H. R., Tedesco D., Jetten M. S., Op den Camp H. J. M., et al. (2007). Methanotrophy below pH 1 by a new Verrucomicrobia species. Nature 450 874–878. 10.1038/nature06222 [DOI] [PubMed] [Google Scholar]
- Prober S. M., Leff J. W., Bates S. T., Borer E. T., Firn J., Harpole W. S., et al. (2014). Plant diversity predicts beta but not alpha diversity of soil microbes across grasslands worldwide. Ecol. Lett. 18 85–95. 10.1111/ele.12381 [DOI] [PubMed] [Google Scholar]
- Řeháková K., Chroòáková A., Krištùfek V., Kuchtová B., Èapková K., Scharfen J., et al. (2015). Bacterial community of cushion plant Thylacospermum ceaspitosum on elevational gradient in the Himalayan cold desert. Front. Microbiol. 6:304. 10.3389/fmicb.2015.00304 [DOI] [PMC free article] [PubMed] [Google Scholar]
- Rousk J., Bååth E., Brookes P. C., Lauber C. L., Lozupone C., Caporaso J. G., et al. (2010). Soil bacterial and fungal communities across a pH gradient in an arable soil. ISME J. 4 1340–1351. 10.1038/ismej.2010.58 [DOI] [PubMed] [Google Scholar]
- Roy J., Albert C. H., Ibanez S., Saccone P., Zinger L., Choler P., et al. (2013). Microbes on the cliff: alpine cushion plants structure bacterial and fungal communities. Front. Microbiol. 4:64. 10.3389/fmicb.2013.00064 [DOI] [PMC free article] [PubMed] [Google Scholar]
- Roy J., Bonneville J. M., Saccone P., Ibanez S., Albert C. H., Boleda M., et al. (2018). Differences in the fungal communities nursed by two genetic groups of the alpine cushion plant, Silene acaulis. Ecol. Evol. 8 11568–11581. 10.1002/ece3.4606 [DOI] [PMC free article] [PubMed] [Google Scholar]
- Schloss P. D., Gevers D., Westcott S. L. (2011). Reducing the effects of PCR amplification and sequencing artifacts on 16S rRNA-based studies. PLoS One 6:e27310. 10.1371/journal.pone.0027310 [DOI] [PMC free article] [PubMed] [Google Scholar]
- Schloss P. D., Westcott S. L., Ryabin T., Hall J. R., Hartmann M., Hollister E. B., et al. (2009). Introducing mothur: open-source, platform-independent, community-supported software for describing and comparing microbial communities. Appl. Environ. Microbiol. 75 7537–7541. 10.1128/AEM.01541-09 [DOI] [PMC free article] [PubMed] [Google Scholar]
- Schöb C., Butterfield B. J., Pugnaire F. I. (2012). Foundation species influence trait-based community assembly. New Phytol. 196 824–834. 10.1111/j.1469-8137.2012.04306.x [DOI] [PubMed] [Google Scholar]
- Schuster S. C. (2008). Next-generation sequencing transforms today’s biology. Nat. Methods 5 16–18. 10.1038/nmeth1156 [DOI] [PubMed] [Google Scholar]
- Schweitzer J. A., Bailey J. K., Fischer D. G., LeRoy C. J., Lonsdorf E. V., Whitham T. G., et al. (2008). Plant-soil-microorganism interactions: heritable relationship between plant genotype and associated soil microorganisms. Ecology 89 773–781. [DOI] [PubMed] [Google Scholar]
- Shen C., Xiong J., Zhang H., Feng Y., Lin X., Li X., et al. (2013). Soil pH drives the spatial distribution of bacterial communities along elevation on Changbai Mountain. Soil Biol. Biochem. 57 204–211. 10.1016/j.soilbio.2012.07.013 [DOI] [Google Scholar]
- Singh B. K., Dawson L. A., Macdonald C. A., Buckland S. M. (2009). Impact of biotic and abiotic interaction on soil microbial communities and functions: a field study. Appl. Soil Ecol. 41 239–248. 10.1016/j.apsoil.2008.10.003 [DOI] [Google Scholar]
- Singh D., Takahashi K., Kim M., Chun J., Adams J. M. (2012). A hump-backed trend in bacterial diversity with elevation on Mount Fuji, Japan. Microb. Ecol. 63 429–437. 10.1007/s00248-011-9900-1 [DOI] [PubMed] [Google Scholar]
- Sugiyama S.-I., Zabed H. M., Okubo A. (2008). Relationships between soil microbial diversity and plant community structure in seminatural grasslands. Grassl. Sci. 54 117–124. 10.1111/j.1744-697X.2008.00113.x [DOI] [Google Scholar]
- Tedersoo L., Bahram M., Põlme S., Kõljalg U., Yorou N. S., Wijesundera R., et al. (2014). Fungal biogeography. Global diversity and geography of soil fungi. Science 346:1256688 10.1126/science.1256688 [DOI] [PubMed] [Google Scholar]
- Tripathi B. M., Kim M., Lai-Hoe A., Shukor N. A., Rahim R. A., Go R., et al. (2013). pH dominates variation in tropical soil archaeal diversity and community structure. FEMS Microbiol. Ecol. 86 303–311. 10.1111/1574-6941.12163 [DOI] [PubMed] [Google Scholar]
- Urbanová M., Šnajdr J., Baldrian P. (2015). Composition of fungal and bacterial communities in forest litter and soil is largely determined by dominant trees. Soil Biol. Biochem. 84 53–64. 10.1016/j.soilbio.2015.02.011 [DOI] [Google Scholar]
- van der Heijden M. G., Bardgett R. D., van Straalen N. M. (2008). The unseen majority: soil microbes as drivers of plant diversity and productivity in terrestrial ecosystems. Ecol. Lett. 11 296–310. 10.1111/j.1461-0248.2007.01139.x [DOI] [PubMed] [Google Scholar]
- Venables W. N., Ripley B. D. (2002). Modern Applied Statistics with S, 4th Edn New York, NY: Springer. [Google Scholar]
- Wang J., Zhang T., Li L., Li J., Feng Y., Lu Q. (2017). The patterns and drivers of bacterial and fungal β-diversity in a typical Dryland ecosystem of Northwest China. Front. Microbiol. 8:2126 10.3389/fmicb.2017.02126 [DOI] [PMC free article] [PubMed] [Google Scholar]
- Wang S. K., Zuo X. A., Zhao X. Y., Li Y. Q., Zhou X., Lv P., et al. (2016). Responses of soil fungal community to the sandy grassland restoration in Horqin Sandy Land, Northern China. Environ. Monit. Assess. 188:21. [DOI] [PubMed] [Google Scholar]
- Wang X., Nostrand J. D. V., Deng Y., Lü X., Wang C., Zhou J., et al. (2015). Scale-dependent effects of climate and geographic distance on bacterial diversity patterns across northern China’s grasslands. FEMS Microbiol. Ecol. 91:fiv133. [DOI] [PubMed] [Google Scholar]
- Wardle D. A., Bardgett R. D., Klironomos J. N., Setälä H., van der Putten W. H., Wall D. H. (2004). Ecological linkages between aboveground and belowground biota. Science 304 1629–1633. 10.1126/science.1094875 [DOI] [PubMed] [Google Scholar]
- Weber C. F., King G. M., Aho K. (2015). Relative abundance of and composition within fungal orders differ between cheatgrass (Bromus tectorum) and sagebrush (Artemisia tridentate)-associated soils. PLoS One 10:e0117026 10.1371/journal.pone.0117026 [DOI] [PMC free article] [PubMed] [Google Scholar]
- Weil R. R., Brady N. C. (2017). The Nature and Properties of Soils. London: Pearson Education. [Google Scholar]
- White T. J., Bruns T., Lee S., Taylor J. (1990). “Amplification and direct sequencing of fungal ribosomal RNA genes for phylogenetics,” in PCR Protocols, eds Innis M. A., Gelfand D. H., Sninsky J. J., White T. J. (Emeryville, CA: Elsevier; ), 315–322. [Google Scholar]
- Wickham H. (2009). ggplot2: Elegant Graphics for Data Analysis. New York, NY: Springer-Verlag. [Google Scholar]
- Wu B., Tian J., Bai C., Xiang M., Sun J., Liu X. (2013). The biogeography of fungal communities in wetland sediments along the Changjiang River and other sites in China. ISME J. 7 1299–1309. 10.1038/ismej.2013.29 [DOI] [PMC free article] [PubMed] [Google Scholar]
- Xiao X., Liang Y., Zhou S., Zhuang S., Sun B. (2018). Fungal community reveals less dispersal limitation and potentially more connected network than that of bacteria in bamboo forest soils. Mol. Ecol. 27 550–563. 10.1111/mec.14428 [DOI] [PubMed] [Google Scholar]
- Yamada T., Sekiguchi Y., Imachi H., Kamagata Y., Ohashi A., Harada H. (2005). Diversity, localization, and physiological properties of filamentous microbes belonging to Chloroflexi subphylum I in mesophilic and thermophilic methanogenic sludge granules. Appl. Environ. Microbiol. 71 7493–7503. 10.1128/AEM.71.11.7493-7503.2005 [DOI] [PMC free article] [PubMed] [Google Scholar]
- Yao H., Wu F. (2010). Soil microbial community structure in cucumber rhizosphere of different resistance cultivars to fusarium wilt. FEMS Microbiol. Ecol. 72 456–463. 10.1111/j.1574-6941.2010.00859.x [DOI] [PubMed] [Google Scholar]
- Yergeau E., Bezemer T. M., Hedlund K., Mortimer S. R., Kowalchuk G. A., Van Der Putten W. H. (2010). Influences of space, soil, nematodes and plants on microbial community composition of chalk grassland soils. Environ. Microbiol. 12 2096–2106. 10.1111/j.1462-2920.2009.02053.x [DOI] [PubMed] [Google Scholar]
- Zhalnina K., Louie K. B., Hao Z., Mansoori N., da Rocha U. N., Shi S., et al. (2018). Dynamic root exudate chemistry and microbial substrate preferences drive patterns in rhizosphere microbial community assembly. Nat. Microbiol. 3 470–480. [DOI] [PubMed] [Google Scholar]
- Zinger L., Lejon D. P. H., Baptist F., Bouasria A., Aubert S., Geremia R. A., et al. (2011). Contrasting diversity patterns of crenarchaeal, bacterial and fungal soil communities in an alpine landscape. PLoS One 6:e19950 10.1371/journal.pone.0019950 [DOI] [PMC free article] [PubMed] [Google Scholar]
Associated Data
This section collects any data citations, data availability statements, or supplementary materials included in this article.
Supplementary Materials
Data Availability Statement
The original contributions presented in the study are included in the article/Supplementary Material; further inquiries can be directed to the corresponding authors.


