

In this study, Qiao et al. set out to investigate the role of REDD1 in the development of KRAS-driven tumors. Using genetically engineered mouse models, the authors show that loss of REDD1 promotes the development of oncogenic KRAS-driven pancreatic and lung cancers. Additionally, the authors use a combination of transcriptomic and metabolomic analyses to show that REDD1 deficiency induces lipid uptake, enhances fatty acid oxidation, and suppresses de novo lipid biosynthesis, in particular under hypoxia conditions, which plays an important role for the redox homeostasis of tumor cells through the regulation of NADPH levels.
Keywords: RAS, REDD1, metastasis, lipid metabolism, oxidative stress, energy stress, lysophospholipids, fatty acid oxidation, glycolysis
Abstract
Human cancers with activating RAS mutations are typically highly aggressive and treatment-refractory, yet RAS mutation itself is insufficient for tumorigenesis, due in part to profound metabolic stress induced by RAS activation. Here we show that loss of REDD1, a stress-induced metabolic regulator, is sufficient to reprogram lipid metabolism and drive progression of RAS mutant cancers. Redd1 deletion in genetically engineered mouse models (GEMMs) of KRAS-dependent pancreatic and lung adenocarcinomas converts preneoplastic lesions into invasive and metastatic carcinomas. Metabolic profiling reveals that REDD1-deficient/RAS mutant cells exhibit enhanced uptake of lysophospholipids and lipid storage, coupled to augmented fatty acid oxidation that sustains both ATP levels and ROS-detoxifying NADPH. Mechanistically, REDD1 loss triggers HIF-dependent activation of a lipid storage pathway involving PPARγ and the prometastatic factor CD36. Correspondingly, decreased REDD1 expression and a signature of REDD1 loss predict poor outcomes selectively in RAS mutant but not RAS wild-type human lung and pancreas carcinomas. Collectively, our findings reveal the REDD1-mediated stress response as a novel tumor suppressor whose loss defines a RAS mutant tumor subset characterized by reprogramming of lipid metabolism, invasive and metastatic progression, and poor prognosis. This work thus provides new mechanistic and clinically relevant insights into the phenotypic heterogeneity and metabolic rewiring that underlies these common cancers.
Activating mutations in RAS family members are observed in a substantial proportion of human cancers, where they are associated with aggressive behavior and poor clinical outcomes (Pylayeva-Gupta et al. 2011). Despite a relatively detailed understanding of the pathways downstream from RAS activation, selectively targeting these pathways has met with limited clinical success. While this fact relates in part to the myriad downstream effects of RAS, it also reflects the various collateral adaptations that the mutant cells undergo to cope with metabolic stress engendered by RAS activation. Numerous studies in recent years have documented a fundamental reconfiguring of metabolism in the context of RAS mutation, including up-regulation of nutrient acquisition pathways, together with rewiring of mechanisms for biosynthesis, energy generation, and detoxification of reactive oxygen species (ROS) (DeNicola et al. 2011; White 2013; Harris et al. 2015). Nonetheless, the observed heterogeneity in the genomic organization and clinical behavior of RAS mutant cancers strongly suggests distinct mechanisms of metabolic rewiring in different tumor subsets that remain incompletely characterized.
Pivotal studies on metabolism in the context of activated RAS have revealed altered glucose utilization via aerobic glycolysis, the Warburg effect, which facilitates shunting of glycolytic intermediates into biosynthetic pathways (Ying et al. 2012). This adaptation is accompanied by altered utilization of glutamine, which provides a source of TCA cycle intermediates for oxidative ATP generation and for cytosolic export and subsequent generation of ROS-detoxifying NADPH (Son et al. 2013). Alterations in lipid metabolism in RAS mutant tumors have generally received less attention, but recent studies have implicated deregulated lipid synthesis, uptake, storage, and catabolism as potential contributors in this context (Kamphorst et al. 2013; Bensaad et al. 2014; Padanad et al. 2016; Svensson et al. 2016; Patra et al. 2018). Overall, however, the mechanisms and phenotypic consequences of altered lipid metabolism in RAS-driven tumors are poorly understood.
As RAS mutation induces profound metabolic stress, endogenous stress response pathways may serve as barriers to RAS-mediated tumor progression (Biancur and Kimmelman 2018). An intriguing potential factor in this regard is REDD1, which is up-regulated in response to hypoxia and energy stress, and functions as a pleiotropic regulator of cell metabolism (Ellisen 2005; Gordon et al. 2016b; Lipina and Hundal 2016). Both mammalian REDD1 and its Drosophila orthologs inhibit TORC1 kinase activity in the acute response to hypoxia (Brugarolas et al. 2004; Reiling and Hafen 2004), while genetic and biochemical studies have demonstrated both mTORC1-dependent and TORC1-independent roles for REDD1 in control of glycolysis, autophagy, and mitochondrial oxidative metabolism (DeYoung et al. 2008; Horak et al. 2010; Qiao et al. 2015; Gordon et al. 2016a; Alvarez-Garcia et al. 2017). Phenotypes associated with REDD1 genetic loss support its role as a physiological mediator of diverse pathologic cellular stress responses. In lung tissue, oxidative stress resulting from chronic cigarette smoke exposure induces REDD1 and results in tissue destruction known as emphysema, and Redd1-null mice exhibit protection against smoke-induced emphysema (Yoshida et al. 2010). REDD1 has also been associated with stress responses in the central nervous system (CNS), where REDD1 is activated in response to environmental stress to suppress mTORC1-mediated phosphorylation. Redd1-null mice are protected against both of these biochemical changes and the behavioral manifestations of stress-induced depression (Ota et al. 2014). The contribution of REDD1 to human cancer has remained uncertain, as Redd1-null mice do not die prematurely or exhibit tumor predisposition, and studies have reported mixed results regarding the contribution of REDD1 to cell proliferation and survival relevant to tumorigenesis (DeYoung et al. 2008; Reuschel et al. 2015; Lipina and Hundal 2016).
Given the overlap and potential interaction of pathways controlled by REDD1 and RAS, we analyzed the phenotypic and metabolic effects of REDD1 loss in the context of RAS activation. While RAS mutation alone in lung and pancreatic epithelium induces preneoplastic lesions, loss of REDD1 in RAS mutant cells promotes rapidly growing invasive carcinomas and distant metastatic dissemination. Biochemical and metabolic studies reveal that loss of REDD1 activates lipid uptake and fatty acid oxidation to meet the metabolic and energetic demands of RAS activation. Accordingly, in vivo studies demonstrate the vulnerability of these tumors to antioxidant depletion, while analysis of human tumors shows that decreased REDD1 expression predicts poor patient survival selectively in RAS mutant lung and pancreas carcinomas. Collectively, our findings reveal that a deregulated REDD1-mediated stress response underpins a previously unidentified, metabolically distinct and poor-prognosis subset of RAS mutant cancers.
Results
REDD1 deficiency cooperates with mutant KRAS to drive tumor progression
To test the hypothesis that REDD1 may function as a barrier to RAS-driven tumorigenesis in vivo we created GEMMs, intercrossing Redd1−/− mice with the inducible knock-in Ras mutant allele loxP-stop-loxP (LSL) KrasG12D (KrasG12D/+) (Supplemental Fig. S1A; Jackson et al. 2001; Sofer et al. 2005). Consistent with previous reports, we found that in B6 mice, crossing LSL-KrasG12D/+ alone to the pancreas-specific Cre recombinase allele p48-Cre (hereafter p48K mice) results in preneoplastic lesions known as pancreatic intraepithelial neoplasm (PanIN) and a median survival (to a humane endpoint) of ∼2 yr, but only rarely invasive PDAC (Fig. 1A; Hingorani et al. 2003). These mice ultimately succumb to sequelae of pancreatic insufficiency related to extensive PanIN (Hingorani et al. 2003). In contrast, a matched cohort of mice with loss of REDD1 (p48-Cre;LSL-KrasG12D/+;Redd1−/−; hereafter p48KR) had dramatically shortened survival (Fig. 1A; Supplemental Fig. S1B). These mice were universally found to have extensive PanIN, and a nearly one-third had already progressed to invasive PDAC (Fig. 1B,C; Supplemental Fig. S1C). Notably, the majority of PDAC-bearing p48KR mice exhibited extensive metastatic disease, including to liver and lung. In contrast, both invasive PDAC and metastasis were rare in p48K mice (Fig. 1C; Supplemental Fig. S1B).
Figure 1.

REDD1 deficiency cooperates with KRAS to drive tumor progression and metastatic dissemination. (A) Kaplan-Meier analysis of p48-Cre;KrasG12D; Redd1−/− (p48KR) mice (n = 6, median survival = 364 d) and p48-Cre;KrasG12D;Redd1+/+ (p48K) mice (n = 12, median survival = 610.5 d). All animals euthanized exhibited PanIN and/or PDAC. P = 0.0005 by log-rank test. (B, top) representative gross photographs depicting enlarged, nodule-studded pancreas and enlarged spleen (left) and liver with metastatic foci (right) from 17-mo-old p48KR mice. (Bottom) Hematoxylin and eosin (H&E)-stained tissue sections from the indicated genotypes. The right panels represent higher magnification of the respective left panels. p48KR mice show PDAC and liver metastasis (indicated by an asterisk) compared with p48K mice that show early PanIN histology. Scale bars: left, 50 µm; right 20 µm. (C) Summary of histological findings of PDAC and metastasis including those reported in A and additional mice sacrificed at 11 mo. Total n = 20 mice analyzed per genotype. (D) Kaplan-Meier analysis of KrasG12D; Redd1+/+ and KrasG12D; Redd1−/−mice after intratracheal adenoviral Cre (AdK and AdKR mice, respectively). AdK mice (median survival = 229 d, n = 7); AdKR mice, median survival = 196 d, n = 13. Survival times are after infection. P = 0.011 by log-rank test. (E, left) Representative H&E-stained sections of whole-mount lung tissues from a pair of age- and sex-matched AdK and AdKR mice 20 wk after intratracheal delivery of Cre. Tumors are indicated by arrows. Scale bars, 2 mm. (Right) Quantification of lung tumor burden per lung lobe from mice of the denoted genotypes. Each dot indicates one lobe (n ≥ 2 mice for each time point per genotype). Horizontal lines indicate mean ± SEM. (*) P = 0.01, by two-tailed t-test. (F) Necropsy of AdKR mice euthanized 28 wk after intratracheal Cre treatment showing metastasis to kidney (K), diaphragm (D), and pancreas (P). H&E-stained sections of primary lung tumor and metastatic foci (indicated by an asterisk) are shown. Scale bars, 100 µm. See also Supplemental Figure S1.
We wished to determine whether this phenotype is likely to result from a cell-autonomous effect of REDD1 loss. Thus, we isolated primary p48-Cre; LSL-KrasG12D/+ pancreatic epithelial cells (hereafter, KPECs), then ablated REDD1 expression via lentiviral shRNA ex vivo and reimplanted cells into the pancreas of immunodeficient hosts (Supplemental Fig. S1D; Corcoran et al. 2011). At 4 wk after implantation, vector-expressing KPECs formed small masses of well-differentiated neoplasms, whereas the matched cells expressing REDD1 shRNA developed significantly larger, invasive tumors demonstrating histological features consistent with poorly differentiated PDAC (Supplemental Fig. S1E,F). Thus, loss of REDD1 confers a cell-autonomous advantage to Kras mutant pancreatic epithelia in vivo, resulting in aggressive, invasive tumor progression.
We then developed a second model to establish whether the cooperative effect of REDD1 loss on RAS-dependent tumorigenesis was limited to the PDAC context. Thus, we exposed LSL-KrasG12D/+ mice to intratracheal adenoviral Cre (Ad-Cre) (Supplemental Fig. S1A). As demonstrated previously, such mice develop multifocal pulmonary adenomas that rarely progress to invasive adenocarcinomas, although these mice ultimately die of pulmonary complications (Fig. 1D,E; Jackson et al. 2001). However, when we compared LSL-KrasG12D/+; Redd1+/+ and LSL-KrasG12D/+; Redd1−/− mice exposed to Ad-Cre (hereafter AdK and AdKR mice, respectively), we noted significantly shorter survival for the AdKR mice (Fig. 1D). Necropsy revealed substantially greater tumor burden in the lungs of AdKR mice, including frequent progression to invasive adenocarcinomas (Fig. 1E,F; Supplemental Fig. S1G). Furthermore, a subset of AdKR mice exhibited grossly evident hematogenous metastasis to distant organs including liver and kidney (Fig. 1F; Supplemental Fig. S1H). Collectively, these findings suggest that loss of REDD1 promotes RAS-mediated tumor progression and metastasis.
REDD1 loss is sufficient to activate lipid uptake and storage
As a first step to unravel the physiological basis for REDD1's cooperation with mutant RAS, we developed multiple cell-based models. We found that this cooperation was not restricted to epithelial cells, as Redd1−/− MEFs immortalized with adenoviral E1A and expressing ectopic mutant KRAS rapidly formed tumors when injected subcutaneously into immunodeficient mice, while matched KRAS-expressing Redd1+/+ cells and primary Redd1−/− cells without KRAS never formed tumors (Supplemental Fig. S2A). To reveal the relevant gene expression programs associated with REDD1 loss we generated primary LSL-KrasG12D/+; Redd1−/− MEFs (KRMEFs) and matched LSL-KrasG12D/+; Redd1+/+MEFs (KMEFs), exposed them to adenoviral Cre (Ad-Cre) and carried out RNA-seq analysis (Fig. 2A; Supplemental Fig. S2B). The most highly significant gene expression differences between KRMEFs and KMEFs were evident under both normoxia and hypoxia, where Gene Set Enrichment Analysis (GSEA) revealed profound suppression of genes regulating cholesterol and fatty acid synthesis (FASyn) as the top differentially expressed signature (Fig. 2A; Supplemental Fig. S2C–E; Engelking et al. 2017). Conversely, we observed increased expression of fatty acid transport genes in KRMEFs compared with KMEFs, including Fabp3, Fabp7, and Fabp4, the latter of which has been implicated in progression and metastasis of ovarian cancer (Supplemental Fig. S2E; Nieman et al. 2011; Bensaad et al. 2014).
Figure 2.

REDD1 deficiency activates lipid uptake and suppresses de novo lipogenesis. (A) Gene set enrichment analysis (GSEA) reveals SREBF targets (signature M3009) as the most significantly differentially expressed signature. (Left) GSEA plot of RNA-seq data showing suppression of fatty acid (FA) and cholesterol synthesis genes in paired KrasG12D;Redd1−/− versus KrasG12D; Redd1+/+ primary MEFs (KRMEFs and KMEFs, respectively, cultured under hypoxia (1% O2, 18 h). (NES) Normalized enrichment score; (FDR) false discovery rate. (Right) Heat map of the entire gene signature shown at left. Asterisks indicate FA synthesis genes. (B) Levels of phospholipids in KMEFs and KRMEFs (top) and their spent medium (bottom) collected during growth under hypoxia (1% O2) for 18 h as detected by UHPLC-MS lipidomics analysis. Data were normalized by MetaboAnalyst. Vertical lines (whiskers) denote range, and boxes indicate one SD. Triplicate samples from two mice per genotype were analyzed. (LPC) Lysophosphatidylcholine; (LPE) lysophosphatidylethanolamine; (PC) phosphatidylcholine; (PE) phosphatidylethanolamine; (CE) cholesterol ester. (*) P < 0.05; (**) P < 0.01; (***) P < 0.001. (C) Histogram showing increased uptake of TopFluor-LPC in REDD1-ablated compared with control KRAS-activated primary pancreatic epithelial cells (KPECs) as assessed by flow cytometry. (Right) Quantification of relative fluorescence intensity (RFU) from seven independent experiments is shown as a histogram at the right. Error bars indicate SD. (***) P < 0.001. (D) Unsaturated long chain triglyceride (TAG) levels in KRMEFs compared with KMEFs under hypoxia as detected by lipidomic analysis. Vertical lines (whiskers) indicate range and boxes indicate one SD. Triplicate samples from two mice per genotype were analyzed. (E) Lipid droplet (LD) staining via LD540 (green) in shCtrl and shRedd1 KPECs cultured in hypoxia (1% O2) for 48 h and visualized by fluorescence microscopy. Nuclei were stained with DAPI (blue). (Right) Quantification of LD levels from at least five random fields (dots) of >200 cells/field per genotype. LD numbers were normalized to cell numbers (nuclei) quantitated by DAPI. (*) P = 0.013 by two tailed t-test. Scale bar, 20 µm. (F) De novo lipogenesis, determined from 14C-acetate incorporation in A549 cells stably expressing empty vector control (shCtrl) or shRNA (shREDD1). Error bars denote ±SD of three independent experiments. (G) Loss of REDD1 decreases reliance on FA synthesis. A549 cells were treated with the specific ACC2 inhibitor (ACC2i) {N-[1-(2′-{4-isopropoxyphenoxy}-2,5′-bithiazol-5-yl)ethyl] acetamide} or the isoform-nonselective ACC inhibitor CP640186 at denoted doses for 72 h. Error bars indicate SD from quintuplicate wells in each of three independent experiments. (*) P < 0.05; (**) P < 0.01; (***) P < 0.001 for all graphs unless noted otherwise. See also Supplemental Figure S2.
To unveil the consequences of these gene expression changes we then carried out analysis of lipid metabolites in KRMEFs and matched KMEFs via ultra-high-performance liquid chromatography-mass spectrometry (UHPLC-MS) under both normoxia and hypoxia (Priolo et al. 2015). A marked intracellular increase in both saturated and unsaturated long and very long chain lipid species was noted in the absence of REDD1, including phosphotidylcholine (PC), phosphoethanolamine (PE), and the lysophospholipidslysophosphotidylcholine (LPC) and lysophosphoethanolamine (LPE) (Fig. 2B; Supplemental Fig. S2F). Concurrent analysis of culture media from these cells demonstrated consistent depletion of the same lipid species from the medium, potentially suggesting cellular uptake (Fig. 2B). Indeed, staining cells with fluorescent-labeled Topfluor-LPC revealed that LPC uptake was significantly increased in Redd1−/− MEFs compared with matched wild-type cells, even in the absence of RAS mutation (Supplemental Fig. S2G).
Importantly, this phenotype was recapitulated in primary, RAS mutant pancreatic epithelial cells. Thus, ablation of REDD1 expression via lentiviral shRNA in KPEC cells followed by exposure to fluorescent-labeled Topfluor-LPC showed a highly significant increase in LPC uptake (Fig. 2C; Supplemental Fig. S2H; Nguyen et al. 2014). Thus, loss of REDD1 is associated with suppression of fatty acid synthesis genes, together with increases in transport genes and uptake of selected lipid species.
Consistent with these findings, increased uptake triggered by REDD1 loss was associated with increased storage of lipids in both epithelial cells and MEFs. We found evidence for increased intracellular synthesis of triglycerides (TAGs), including elevated TAG levels in KRMEFs compared with matched primary KMEFs (Fig. 2D; Supplemental Fig. S2I). As anticipated, these same TAGs were not depleted from the medium (Supplemental Fig. S2J). Lysophospholipids are remodeled and stored together with accumulated TAGs in lipid droplets (LDs), and we therefore tested for the presence of LDs by staining cells with the lipophilic fluorophore LD540 (Spandl et al. 2009). Indeed, we observed increased LD formation in primary KPECs following REDD1 knockdown (Fig. 2E), and in Redd1−/− compared with WT MEFs (Supplemental Fig. S2K). These findings suggest that loss of REDD1 is sufficient to induce increased lipid uptake and storage in both the presence and absence of RAS mutation.
In order to test whether REDD1 loss induced these changes in human cells we ablated REDD1 via lentiviral shRNA in KRAS mutant A549 carcinoma cells. Loss of REDD1 indeed significantly increased LPC uptake (Supplemental Fig. S2L,M). We then measured de novo FASyn (i.e., de novo lipogenesis) directly through analysis of 14C-acetate incorporation in these cells. We observed dramatic suppression of de novo FASyn resulting from loss of REDD1 (Fig. 2F). Correspondingly, REDD1-ablated cells were less reliant on FASyn, as loss of REDD1 conveyed significant resistance to inhibitors of acetyl CoA carboxylase (ACC), the first committed step of FASyn (Fig. 2G). Taken together, these results reveal that REDD1 loss activates a program of increased lipid uptake and storage, together with suppressed de novo lipogenesis.
REDD1 loss in RAS mutant cells promotes fatty acid oxidation for energy and redox homeostasis
Under stress conditions including hypoxia, enhanced lipid uptake and storage is linked to catabolism of stored lipids through fatty acid oxidation (FAO), which can contribute to homeostasis through multiple mechanisms including ROS detoxification (via generation of NADPH) and relief of energy stress (via oxidative ATP generation) (Fig. 3A; Bensaad et al. 2014; Patra and Hay 2014; Henne et al. 2018). We measured FAO by tracing the fate of tritiated palmitate in Kras mutant KMEFs and KRMEFs, and demonstrated that loss of REDD1 significantly induces FAO in this context (Fig. 3B). These Redd1-null cells were highly dependent on FAO for ATP generation, as inhibition of FAO with etomoxir significantly attenuated ATP levels in KRMEFs compared with KMEFs (Fig. 3C). Furthermore, increased FAO in KRMEFs was accompanied by decreased ROS (Supplemental Fig. S3A), and conversely, restoration of REDD1 expression increased ROS levels (Supplemental Fig. S3B). In agreement with these findings, NADPH levels were substantially elevated in KRMEFs compared with KMEFs (Fig. 3D), as they were following REDD1 knockdown in KPECs (Fig. 3E). Notably, REDD1-dependent differences in ROS between KRMEFs and KMEFs were not associated with any change in the antioxidant response factor NRF2, which is increased in a subset of RAS mutant tumors (Supplemental Fig. S3C; DeNicola et al. 2011).
Figure 3.

REDD1 loss potentiates fatty acid oxidation (FAO) to drive metabolic dependencies on redox and energy homeostasis. (A) Schematic showing proposed pathways linking FAO to redox and energy homeostasis. (B) Increased FAO in primary KRMEFs compared with KMEFs under serum starvation for 3 h as measured by 3H palmitate labeling. Bar graph shows mean of three experiments. Error bars indicate SD. (C) Rapid ATP depletion in KRMEFs compared with KMEFs with FAO inhibition by etomoxir treatment (250 µM) for 1 h, assessed by ATP Cell Titer-Glo assay. Bar graph shows mean from duplicate experiments. (D) Increased NADPH/NADP+ ratio in KRMEFs compared with KMEFs, assessed as described in the Materials and Methods. Graph shows mean of two experiments performed in duplicate. (E) Increased NADPH/NADP+ ratio in REDD1-ablated primary KPECS. Bars indicate mean of two experiments performed in duplicate. (F) Increased GSH concentration and GSH/GSSG ratio in KRMEFs as compared with KMEFs. (G) REDD1 ablation renders KPECs resistant to glutamine withdrawal. Cells were cultured in the denoted concentrations for 3 d. Data represents mean of three independent experiments. See also Supplemental Figure S3. Unless noted otherwise, all error bars denote SD. (*) P < 0.05; (**) P < 0.01; (***) P < 0.001; (****) P < 0.0001 by two-tailed t-test for all panels.
We then tested the functional consequences of increased NADPH in this setting, demonstrating that REDD1 knockdown in KPECs was sufficient to confer oxidative stress resistance (Supplemental Fig. S3D). NADPH provides reducing power to generate the key cellular antioxidant reduced glutathione (GSH) and, as expected, both the relative and absolute levels of GSH were increased in the absence of REDD1 (Fig. 3F). Furthermore, we tested the glutamine dependence of these cells, as glutamine has been reported to be required for NADPH generation, ROS detoxification and proliferation in some RAS mutant cells (Son et al. 2013; Romero et al. 2017). Consistent with the hypothesis that FAO rather than glutamine meets these metabolic demands in the setting of REDD1 loss, knockdown of REDD1 rendered KPECs substantially less sensitive to glutamine withdrawal than controls (Fig. 3G). Thus, loss of REDD1 in RAS mutant cells increases FAO, on which these cells depend for ATP generation and ROS detoxification.
Increased lipid storage and redox dependence in RAS mutant, REDD1-deficient tumors in vivo
The key hallmark of rewired lipid metabolism we identified in RAS mutant/REDD1-deficient cells is increased lipid uptake, resulting in accumulation of Lipid Droplets (LDs). To establish whether this phenotype was indeed reflected in the in vivo models, we tested lipid storage by staining primary Kras mutant lung and pancreas tumors from Redd1 mutant or wild-type mice with Oil Red O (ORO). While LDs were not identified in the pancreatic or lung tumors of p48K or AdK mice, respectively, the tumors in p48KR and AdKR mice demonstrated abundant ORO-positive LDs (Fig. 4A). Thus, loss of REDD1 increases lipid storage in RAS mutant tumors in vivo.
Figure 4.

REDD1-deficient tumors show increased lipid storage and glutathione dependence. (A) Accumulation of neutral lipid droplets analyzed by Oil Red O (ORO) staining of matched AdK and AdKR primary lung tumor sections, showing characteristic speckled droplets only in AdKR tumors. Scale bars, 20 µm. (Right) Summary quantification of ORO staining in lung and pancreatic tumors of the indicated genotypes. Values represent mean ± SEM. (*) P = 0.030, by paired t-test. (B) AdKR orthotopic tumors are responsive to glutathione synthase inhibitor buthionine sulfoximine (BSO). Cells from tumors shown in Figure 1E were implanted subcutaneously, and BSO (10 mmol/kg, daily) was administered by i.p. injection 14 d after implantation (=day 0). (***) P < 0.001 by one-way ANOVA. (C) Representative sections of AdKR orthotopic tumors stained by H&E (top), Ki67 (middle), and cleaved caspase-3 (bottom) after 12-d treatment with vehicle or BSO. Scale bars, 20 µm. (D) Quantification of Ki67-positive cell percentage from AdKR orthotopic mouse tumor sections from C. (E) Quantification of cleaved caspase-3 positive cells from AdKR orthotopic mouse tumor sections from C. For D and E, five random fields per tumor from each of five randomly selected tumors were quantitated. Data represent mean ± SD. (*) P < 0.05; (**) P < 0.01; (***) P < 0.001, by two-tailed t-test. See also Supplemental Figure S4.
Our findings suggest that increased lipid storage and activated FAO in this context promotes tumor progression through enhanced ROS detoxification via NADPH generation and increased reduced glutathione (GSH) (Fig. 3). We therefore sought to assess the requirement for such ROS detoxification in REDD1/RAS-associated tumors in vivo, using an allograft model involving implantation of primary AdKR lung carcinomas into immunodeficient mice. We found that this approach produces visibly progressive tumors within 2 wk (Fig. 4B). We assessed dependence on GSH-mediated ROS detoxification in these tumors by blocking glutathione synthesis using buthionine sulfoxamine (BSO) (Harris et al. 2015; Chio et al. 2016). Treatment of tumor-bearing mice with BSO consistently arrested progression of AdKR tumors (Fig. 4B; Supplemental Fig. S4). Even more striking was the histologic appearance of posttreatment tumors. Untreated tumors showed uniform fields of viable cells with a high proliferative index as assessed by Ki67 staining. In contrast, BSO-treated tumors showed decreased Ki67 expression and increased apoptosis, evidenced by immunohistochemistry strongly positive for activated Caspase 3 (Fig. 4C–E). Thus, loss of REDD1 increases GSH levels, on which these aggressive tumors are highly dependent for viability in vivo.
A HIF1α/PPARγ/CD36 axis activated by REDD1 deficiency contributes to lipid uptake and cell migration
A clue to the mechanism of altered REDD1-dependent lipid metabolism was our observation that multiple genes deregulated in REDD1/RAS mutant cells, including fatty acid transport genes (Supplemental Fig. S2), are transcriptional targets of the Hypoxia-Inducible Factor HIF1 (Bensaad et al. 2014). Indeed, REDD1 is a hypoxia-regulated gene whose loss has been linked to stabilization of HIF1α (Brunelle et al. 2005; Horak et al. 2010). HIF1α levels were in fact increased in primary KPECs following REDD1 knockdown compared with controls, under both normoxia and hypoxia (Fig. 5A; Supplemental Fig. S5A), and in KRMEFs compared with matched KMEFs (Supplemental Fig. S5B). Accordingly, expression of the key HIF1 target gene encoding the glucose transporter GLUT1 was markedly elevated (Supplemental Fig. S5C), and was associated with increased glucose uptake in REDD1-deficient KPECs (Fig. 5B). Further supporting a glycolytic phenotype, oxygen consumption and maximal respiratory capacity were suppressed in Ras mutant, REDD1-deficient cells compared with Ras mutant controls (Supplemental Fig. S5D). In addition, steady-state metabolite profiling using LC-MS demonstrated accumulation of pyruvate and lactate, with concurrent suppression of pentose phosphate pathway and TCA metabolites in the REDD1-deficient cells (Supplemental Fig. S5E). Thus, HIF1α, its target genes and a glycolytic phenotype are induced due to REDD1 loss.
Figure 5.

REDD1-dependent HIF1α activation induces the PPARγ-CD36 fatty acid transport pathway and promotes cell migration. (A) Knockdown of REDD1 in primary KPECs increases the protein level of HIF1α as detected by IP/Western analysis. IgG serves as a control for IP. (B) Histogram showing increased uptake of fluorescent glucose analog 2-NBDG in REDD1-ablated KPECs, assessed by flow cytometry. (Right) Summary data from three independent experiments. (C) mRNA expression levels of PPARγ in KPECs following shCtrl and shRedd1, as measured by qRT-PCR. Cells were cultured under normoxia or hypoxia (1% O2) for 18 h. Graph shows mean of two experiments performed in duplicate. (D) Western analysis of primary tumors from AdK and AdKR mice, demonstrating an increase in PPARγ protein in the absence of REDD1. (E) Cotreatment with HIF1α inhibitor C23 (60 µM) blocks induction of PPARγ under hypoxia (1% O2) for 24 h in shRedd1 primary KPECs, as measured by qRT-PCR. Pioglitazone serves as a positive control for PPARγ induction. (F) C23 treatment (40 µM) for 12 h decreased uptake of Topfluor-LPC in shRedd1 primary KPECs as measured by flow cytometry. (G) Summary of three independent experiments performed as in F, using two distinct REDD1-directed shRNAs. (H) mRNA expression levels of CD36 in shCtrl and shRedd1 primary KPECs, as measured by qRT-PCR. Cells were cultured under normoxia or hypoxia (1% O2) for 18 h. Graph shows mean of two experiments performed in duplicate. (I) CD36 inhibitor SSO (200 µM) for 12 h blocked uptake of Topfluor-LPC in shRedd1 primary KPECs as measured by flow cytometry. (J) Summary of three independent experiments performed as in I, using two distinct REDD1-directed shRNAs. (K) Representative images showing the scratch (wound) at time 0 and 48 h with and without SSO treatments (200 µM) in shRedd1 KPECs cultured under hypoxia (1% O2). Uniform cassette inserts were removed to create 0.9 mm wound at time 0 h. The same area was pictured on time 0 and 48 h. (L) Quantification of wound closure. Percent wound closure was measured using Image J. Shown are the means of three independent experiments. Error bars represent SEM. Unless otherwise noted, for all graphs. (**) P < 0.01; (***) P < 0.001, by two-tailed t-test. See also Supplemental Figure S5.
HIF1α has been linked to fatty acid uptake and lipid storage in cardiomyocytes under pathologic stress through a novel pathway involving activation of the peroxisome proliferator-activated receptor γ (PPARγ) (Krishnan et al. 2009). PPARγ is known to play an important role in lipid metabolism, promoting fatty acid uptake and TAG accumulation in multiple tissues (Spiegelman 1998). We indeed found that the increase in HIF1α observed with loss of REDD1 in both KPECs and MEFs was associated with increased mRNA for PPARγ, which, like HIF1α itself, is further up-regulated under hypoxia (Fig. 5C; Supplemental Fig. S5F). Similarly, PPARγ protein was highly up-regulated in lung tumors of REDD1-deficient AdKR compared with AdK mice (Fig. 5D). We then tested whether HIF1α was required for REDD1-associated PPARγ induction. Using three distinct HIF1α inhibitors, we found that induction of PPARγ in KPECs following REDD1 knockdown was HIF dependent (Fig. 5E; Supplemental Fig. S5G). Furthermore, we found that lysophospholipid uptake was promoted through this HIF1α/PPARγ pathway, as inhibition of HIF1α or applying a PPARγ antagonist significantly reduced LPC uptake in KPECs following REDD1 knockdown (Fig. 5F,G; Supplemental Fig. S5H,I).
Among the key target genes of PPARγ we found to be induced in the setting of REDD1 deficiency is the CD36 receptor. We observed increased CD36 expression in KPECs after REDD1 knockdown (Fig. 5H), in KRMEFs compared with KMEFs (Supplemental Fig. S5J), and in vivo in human pancreas carcinomas with low REDD1 levels (Supplemental Fig. S5K). CD36 is at the apex of a signaling cascade involved in lipid uptake and storage, through which it has recently been shown to enable tumor metastasis (Pascual et al. 2017). We implicated CD36 in lipid transport in these cells, as treatment with the irreversible CD36 inhibitor Sulfosuccinimidyl Oleate (SSO) substantially blocked LPC uptake (Fig. 5I,J; Coort et al. 2002). CD36 engenders metastasis by promoting a sub-population of slow-cycling cells with enhanced metastatic capacity (Pascual et al. 2017). To explore such phenotypes in the REDD1 context we used an in vitro wound healing assay, in which migration across a uniform gap is quantitated (Kramer et al. 2013). REDD1 knockdown in KPECs consistently enhanced migration across the gap, and this effect was abolished by inhibition of CD36 with SSO (Fig. 5K,L). Taken together, these observations imply that RAS mutant, REDD1-deficient cells co-opt a HIF1α/PPARγ-dependent pathway for pathological lipid storage characteristic of cardiomyocytes, while activating CD36 to promote lipid uptake, altered metabolism and enhanced cell migration.
Decreased REDD1 levels are associated with poor outcomes selectively in RAS mutant human cancers
Finally, we tested the hypothesis that RAS mutant human tumors with loss of REDD1 expression, like their murine counterparts, may behave particularly aggressively and therefore be associated with especially poor patient outcomes. Thus, we developed a gene expression signature of REDD1-loss from matched REDD1/RAS versus RAS mutant cells (see Materials and Methods), then we determined the ability of this signature to predict patient outcomes in a large clinical data set (TCGA) (The Cancer Genome Atlas Research Network 2014, 2017). Using a signature of REDD1 loss was required, as tumor cell levels of REDD1 itself in bulk RNA-seq data are confounded by substantially higher expression in nonepithelial than epithelial cells (Supplemental Fig. S6A). We observed that the median survival of patients with RAS mutant tumors expressing the lowest levels of the REDD1 signature (that is, associated with REDD1 loss) was approximately one-third that of those whose tumors expressed the highest levels of the signature (P = 0.015, Fig. 6A). Remarkably, no statistically significant association with survival was observed based on the REDD1 signature among those with RAS wild-type tumors (P = 0.12) (Fig. 6A). Also of note, the association between the REDD1 signature and outcomes in RAS mutant tumors was not confounded by smoking status (Supplemental Fig. S6B) or by additional prognostic somatic mutations, as there was no statistically significant association between the REDD1 signature and the presence/absence of such mutations, including TP53 and KEAP1 in this cohort. We then analyzed the TCGA cohort for PDAC, the large majority of which harbor RAS mutations (The Cancer Genome Atlas Research Network 2014, 2017). Again, the REDD1 loss gene expression phenotype predicted worse outcome with high statistical significance (P = 0.00097), even considering the overall dismal survival of PDAC as a whole (Fig. 6B).
Figure 6.

Low REDD1 levels confer worse outcomes in RAS mutant human cancers. (A) Kaplan-Meier analysis of patient outcomes in the TCGA lung adenocarcinoma (LUAD) cohort, applying the REDD1 gene expression signature (see the text). (Left) Shorter survival is seen among RAS mutant LUAD patients with low REDD1 signature. Comparison of bottom (n = 35, median survival 656 d) and top (n = 104, median survival 1653 d) quartiles of metagene values. (Right) No significant difference in survival among RAS WT patients based on the REDD1 signature. Comparison of bottom (n = 77, median survival 1115 d) and top (n = 230, median survival 1499 d) quartiles of metagene values. P-values calculated by log-rank test. (B) Kaplan-Meier analysis of patient outcomes in the TCGA pancreatic adenocarcinoma (PDAC) cohort, applying the REDD1 signature. Shorter survival is observed among RAS mutant PDAC patients with low REDD1 signature. Comparison of bottom (n = 29, median survival 293 d) and top (n = 87, median survival 634 d) quartiles of metagene values. (C) IHC for REDD1 using affinity-purified anti-REDD1 antibody on lung adenocarcinomas (LUAD; n = 47 cases) and normal lung tissue. Representative photomicrographs of REDD1 low (left) and high (middle) LUAD cases. Scale bars, 20 µm. (Bottom, right panel) Distribution of REDD1 IHC scores among 47 cases. (D) Kaplan-Meier analysis of clinical outcomes based on tumor cell REDD1 protein expression, showing significantly shorter progression free survival (PFS) for patients with RAS mutant adenocarcinomas in the bottom 50% of REDD1 IHC scores (median PFS: 749 d) compared with the top 50% of REDD1 IHC scores (median PFS: 1338 d). P-values calculated by log-rank test. (E) Among RAS WT patients, no statistically significant difference in PFS is observed based on REDD1 protein expression. P-value by log-rank test. (F) Lower REDD1 protein expression is associated with larger primary tumors. Shown are tumors in the top and bottom quartiles of REDD1 expression. (*) P = 0.045 by two tailed t-test.
We further credentialed these findings by direct analysis of REDD1 protein in tumors via immunohistochemistry. We developed and validated a high specificity, affinity-purified anti-REDD1 antibody (DeYoung et al. 2008) that we applied to a clinically annotated set of primary lung adenocarcinomas (Huynh et al. 2016). REDD1 expression is moderate in normal pulmonary epithelia, and we developed a scoring system to identify subsets of RAS mutant tumors with both high and low/absent tumor cell expression of REDD1 (Fig. 6C). Despite the relatively small numbers, patients with RAS mutant tumors exhibiting low REDD1 protein expression experienced significantly worse progression-free survival (P = 0.029, Fig. 6D). As in the TCGA cohort, low REDD1 expression was not associated with worse progression-free survival among those whose lung tumors lacked RAS mutation (Fig. 6E). Furthermore, RAS mutant tumors with low REDD1 protein levels were found to be significantly larger at time of diagnosis that REDD1-high tumors, consistent with a role for REDD1 loss in particularly aggressive disease (Fig. 6F). All together, these findings reveal REDD1 loss as a hallmark and driver of a RAS mutant tumor subset characterized by a reprogramming of lipid metabolism, rapid progression and poor outcomes (Fig. 7).
Figure 7.
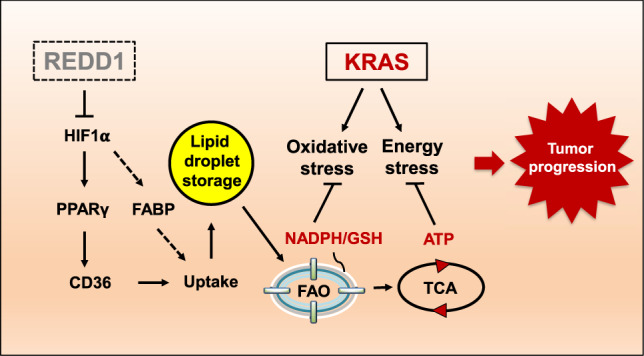
Model for REDD1 loss in RAS-driven tumorigenesis. REDD1 loss up-regulates HIF, PPARγ/CD36, and fatty acid-binding proteins (FABPs) to mediate uptake and lipid droplet storage. This effect is associated with increased fatty acid oxidation (FAO) that generates ATP as well as reducing equivalents (NADPH and GSH) through the mitochondrial Krebs (TCA) cycle, resulting in relief from RAS-induced energy stress and oxidative stress, and ultimately tumor progression. We hypothesize that combination therapies targeting the multiple metabolic nodes described herein are likely to be effective against REDD1-deficient, RAS mutant cancers.
Discussion
Here we reveal that loss of the stress response gene, REDD1, underlies a particularly lethal subgroup of RAS mutant tumors. Our studies show that REDD1 deficiency engenders markedly elevated lipid uptake and storage, coupled to a glycolytic phenotype and activated FAO that sustains metabolic demands of the RAS mutant context to promote tumor progression including metastatic dissemination. Notably, the contribution of REDD1 to human cancer has to date been unclear, as deletion of REDD1 alone is insufficient to confer tumor predisposition in mice (Lipina and Hundal 2016). However, we found that in the context of activated RAS, loss of REDD1 and the ensuing metabolic rewiring convert preneoplastic lesions into invasive and in some cases metastatic malignancies. A highly relevant functional interaction between REDD1 and mutant RAS is further supported by our observation that REDD1 expression is associated with clinical outcomes selectively in human RAS mutant, but not RAS wild-type lung and pancreas tumors. Collectively, these findings suggest the REDD1-mediated stress response as a novel tumor suppressor mechanism in the context of RAS mutation.
Multiple aspects of lipid metabolism are deregulated in the setting of RAS mutation, yet the details of how this rewiring occurs and contributes to cancer pathogenesis remains to be fully elucidated (Biancur and Kimmelman 2018). For example, increased lipid uptake has been described in KRAS mutant pancreatic epithelial cells, but the upstream pathways and in vivo consequences were not established (Kamphorst et al. 2013). Furthermore, reports have varied regarding the role of fatty acid synthesis (FASyn) in the context of RAS mutation, with some studies suggesting FASyn as an essential contributor and potential therapeutic target in the setting of RAS mutation (Singh et al. 2018), while others report reliance instead on uptake and oxidation of fatty acids (Padanad et al. 2016). Here, we show that RAS mutant cells and tumors with REDD1 loss exhibit increased lipid uptake, storage, and fatty acid oxidation (FAO), and accordingly that decreased reliance on FASyn is triggered by REDD1 loss even in established human tumor cells (Fig. 2). Taken together, these findings speak to the potential for intertumor heterogeneity of lipid metabolism in this context, and they suggest REDD1 loss as a metabolic switch that activates a unique pathway for lipid deregulation.
Our findings point to activation of HIF1α as a key contributor to the metabolic effects associated with REDD1 loss. The elevated HIF1α levels we observed are consistent with previous work demonstrating that stabilization of HIF1α results from the increased mitochondrial (but not cytosolic) ROS that results from loss of REDD1 (Brunelle et al. 2005; Horak et al. 2010). Furthermore, our results are also in keeping with prior work demonstrating a functional interaction between REDD1 and the stress-induced metabolic regulator TXNIP (Qiao et al. 2015). Like REDD1, loss of TXNIP is associated with stabilization and activation of HIF1α in multiple cellular contexts (Shin et al. 2008; Ji Cho et al. 2019). We found that the activation of HIF1α and PPARγ/CD36 that result from loss of REDD1 are associated with both increased glycolysis and fatty acid/lysophospholipid uptake. Similar effects of HIF1α/PPARγ/CD36 are known to occur under pathologic stress in cardiomyocytes, leading to increased TAG generation from fatty acid conjugation to the glucose-derived glycerol-3-phosphate backbone (Krishnan et al. 2009). While in the latter context pathologic cardiac steatosis results, we provide evidence that HIF1α-dependent lipid storage and an associated increase in FAO confer a distinct advantage to RAS mutant tumors. This finding is in keeping with a prior report describing lipid droplet formation and associated increased FAO as a HIF1α-mediated survival mechanism selectively in epithelial tumor cells (Bensaad et al. 2014). Thus, not only is HIF1α/PPARγ/CD36 activation in RAS/REDD1 mutant tumors associated with dramatic accumulation of lipid storage droplets in vivo, this storage is coupled to increased FAO that we found is important for generation of both ATP and ROS-detoxifying NADPH. We further link FAO and redox homeostasis to REDD1-dependent tumor progression in vivo, demonstrating the critical sensitivity of RAS/REDD1 mutant tumors to NADPH/GSH-mediated detoxification. Thus, treatment with the glutathione synthesis inhibitor BSO induces growth arrest and cell death within these tumors in vivo.
A consistent feature of the RAS mutant, REDD1-deficient phenotype is the progression to invasive malignancy including in some cases disseminated hematogenous metastasis. Our data suggest that this effect relates in part to the up-regulation of the CD36 receptor in this context. CD36 has now been implicated as a mediator of poor outcomes and metastasis in multiple different cancers (Pascual et al. 2017; Ladanyi et al. 2018). Our findings that CD36 is required for lipid uptake and cell migration in REDD1-deficient cells provide new insight into CD36 activation in cancer, and they collectively suggest a direct contribution of CD36 to the pathogenesis of REDD1-deficient tumors. Collectively, these results point to a potential role for lipid metabolism as a driver of invasive and ultimately metastatic disease.
All the points noted above imply that the metabolic rewiring that characterizes RAS mutant, REDD1-deficient tumors may be of direct clinical relevance. For example, multiple studies have suggested a particular reliance of certain KRAS mutant tumors on glutamine, and glutaminase inhibitors that aim to exploit this dependence have now entered clinical trials (Son et al. 2013; Fung and Chan 2017; Romero et al. 2017). However, the relative insensitivity to glutamine withdrawal we demonstrate in the setting of REDD1 loss may predict that patients presenting with such tumors will be poor candidates for this therapy. Similarly, recent work has documented dependence of Kras mutant GEMMs on fatty acid synthesis, resulting in tumor sensitivity to inhibition of the key committed step in this process catalyzed by ACC (Svensson et al. 2016). Again, the REDD1 phenotype is distinct, as REDD1 loss is associated with suppressed fatty acid synthesis in the mutant RAS context, and we show directly that this effect confers substantial resistance to ACC inhibitors. Conversely, we found that REDD1-deficient tumors are highly sensitive to glutathione depletion with BSO. Clinical trials using this agent have not yielded responses in a large proportion of tumors, yet our findings suggest the possibility that targeting a metabolically defined tumor subset, such as that discovered here, may be more successful (Kirkpatrick and Powis 2017). Finally, CD36 itself is an attractive potential therapeutic target whose inhibition has proven relatively nontoxic in preclinical models (Pascual et al. 2017).
In summary, we show that REDD1 deficiency defines and drives progression and poor clinical outcomes in RAS mutant tumors. We reveal distinct metabolic rewiring engendered by REDD1 that alleviates RAS-induced metabolic stress and is associated with the progression to invasive disease and metastasis. Collectively, these findings advance our understanding of the heterogeneity of common RAS mutant tumors, and they reveal loss of REDD1 as a clinically important and potentially therapeutically actionable hallmark in these malignancies.
Materials and methods
GEMMs
Mice were housed in pathogen-free animal facilities at Massachusetts General Hospital. All experiments were performed under protocol 2004N000228, approved by the Subcommittee on Research Animal Care at Massachusetts General Hospital. Mice were maintained on a C57BL/6 background. Data presented include both male and female mice. All mice included in the survival analysis were killed when criteria for disease burden (including abdominal distension that impeded movement, loss of >15% of body weight, labored breathing, and/or abnormal posture) were reached. Redd1−/− strain were crossed with p48-Cre strain and the LSL-KrasG12D strain (Jackson Laboratory, from the Bardeesy laboratory), which consisted of a mutant KrasG12D allele knocked into the endogenous Kras locus, preceded by an LSL cassette.
Adenovirus-induced lung adenocarcinoma
LSL-KrasG12D (Kras) and LSL-KrasG12D; Redd1−/− mice were treated with 5 × 10⁵ or 5 × 10⁶ plaque-forming units of adenovirus expressing Cre (University of Iowa Adenovirus Core) by intratracheal infection as described previously (DuPage et al. 2009). Tumors were analyzed 12 wk after infection.
Allograft lung cancer mouse model
KrasG12D; Redd1−/− primary tumors were dissociated by collagenase digestion containing soybean trypsin inhibitor, digested samples were teased through a 100-mm filter, resuspended in culture medium. CD31 and CD45 positive cells were discarded through flow cytometry sorting. Tumor cells were then mixed with matrigel and were injected subcutaneously into nude mice in double-flanks. Two weeks later, when tumors reached an average diameter of 4–5 mm, tumor-bearing mice were randomized into two groups with that day as day 0. For in vivo buthionine sulfoximine (BSO; Sigma) treatment, tumor-bearing mice were treated daily with intraperitoneal injections of vehicle or BSO at a dose of 10 mmol/kg dissolved in PBS. Tumors were measured every other day for up to 12 d, and tumor volumes were calculated with the formula: tumor volume (mm3) = 4/3π × length/2 × width/2.
Orthotopic pancreatic cancer mouse model
SCID mice (C3SnSmn.CB17-Prkdcscid/J,; Jackson Laboratories) were subjected to general anesthesia according to Massachusetts General Hospital Subcommittee on Research Animal Care policies. Orthotopic injections of the pancreas were conducted as previously described (Corcoran et al. 2011) using 2 × 10⁴ p48-Cre; LSL-KrasG12D pancreatic ductal cells suspended in 50 mL of duct medium mixed (Agbunag et al. 2006) with 50 mL of Matrigel (BD Biosciences).
Primary pancreatic cancer epithelial cells
Primary pancreatic epithelial cells were derived from 9-wk-old p48-Cre; LSL-KrasG12D mice as described previously (Agbunag et al. 2006). These KrasG12D-acitivated pancreatic epithelial cells were propagated on surfaces coated with laminin (BD Biosciences) and in a specific pancreatic medium.
Primary mouse embryonic fibroblasts
Early passage MEFs (P < 5) were used for all of the experiments. LSL-KrasG12D mice were crossed with Redd1−/− mice to generate LSL-KrasG12D; Redd1−/− MEFs. Mice and MEFs were on C57BL/6 background. Embryos were genotyped according to published procedures. MEFs were grown in DMEM/10% FCS/Pen/Strep. To activate Kras in the LSL-KrasG12D, cultures were infected with Ad-Cre (500-1000 pfu/cell) leading to activation of KrasG12D in AdK and AdKR cells.
Cell culture
The REDD1−/− allele was generated as previously described (Sofer et al. 2005). MEFs not harboring LSL-KrasG12D were immortalized by retroviral transduction of SV40 large T-antigen unless indicated otherwise, and were maintained in DMEM/10% FCS/Pen/Strep. Human non-small cell lung cancer cell line A549 was obtained from the American Type Culture Collection and maintained in DMEM/10% FCS/pen/strep. Primary pancreatic intraepithelial cells (AH375) were isolated from LSL-KRASG12D mice as described previously (Corcoran et al. 2011). All pancreatic ductal epithelial cells were routinely maintained in ductal media on laminin-coated plates. Negative mycoplasma contamination status of all cancer cell lines, 293T cell line and primary cells used in the study was established using LookOut mycoplasma PCR kit (Sigma MP0035).
Metabolite profiling
IC method
A Thermo Scientific Dionex ICS-5000+ HPIC ion chromatography system consisting of a dual pump, an eluent generator (EG) with a capillary KOH cartridge, and a detection compartment (DC) featuring an IC module with suppressed conductivity detection was used in this study. The whole system was metal free. The ERS 500 suppressor was operated in external-water mode with ultrapure Milli-Q water, and regenerant was delivered by pressure using an argon gas tank at a pressure of 20 psi. The eluent of the IC system was converted to pure water after the column and flowed directly to the MS source. To help with the desolvation for better electrospray, makeup solvent of methanol was delivered at 60 μL/min and mixed with the eluent via a low dead volume mixing tee, and passed through a grounding union before entering the MS. The HPIC analysis was conducted with the IonPac AS11HC-4 μm, 2.0 × 250-mm columns (2000 Å). IC flow rate was 380 μL/min (at 30°C supplemented postcolumn with makeup flow). The gradient conditions were as follows: An initial 25 mM KOH was held for 3 min prior to injection, increased linearly to 95 mM at 8 min, held at 95 mM for 1 min, followed by a drop to 25 mM within 0.1 min, and held for 10 min to re-equilibrate the column. The total run time was 23 min. The ion spray voltage was −3 kV and the source temperature was 350°C. Raw data were taken using full scan analysis over m/z 67–1000 at 140,000 resolution. LC-MS data were processed and visually checked using TraceFinder 3.3 software (Thermo Fisher Scientific). Medium samples (30 μL) were derived using 120 μL of 80% methanol (VWR) containing the internal standards inosine-15N4, thymine-d4, and glycocholate-d4 (Cambridge Isotope Laboratories). The samples were centrifuged at 9000g for 10 min at 4°C, and 5 µL of supernatant was transferred to an autosampler vial and injected on to the HPIC. Cellular extracts were put directly into the system.
C8-pos and HILIC-pos methods
Lipid extracts were analyzed using a Nexera X2 U-HPLC (Shimadzu) coupled to an Exactive Plus orbitrap mass spectrometer (Thermo Fisher Scientific). Extracts (10 μL) were injected onto an Acquity UPLC BEH C8 column (1.7 μm, 2.1 × 100 mm; Waters). The column was initially eluted isocratically at a flow rate of 450 μL/min with 80% mobile phase A (95:5:0.1 [v/v/v] 10 mM ammonium acetate/methanol/formic acid) for 1 min, followed by a linear gradient to 80% mobile-phase B (99.9:0.1 [v/v] methanol/formic acid) over 2 min, a linear gradient to 100% mobile phase B over 7 min, and then 3 min at 100% mobile phase B. MS analyses were performed using electrospray ionization in the positive ion mode (source voltage was 3 kV, source temperature was 300°C, sheath gas was 50.0, auxillary gas was 15) using full scan analysis over m/z 200–1100 and at 70,000 resolution. Hydrophilic interaction liquid chromatography (HILIC) analyses of water soluble metabolites were carried out in the positive ion mode using a Nexera X2 U-HPLC (Shimadzu)-Q Exactive Orbitrap (Thermo Fisher Scientific) LC-MS instrument. Cell extracts (10 μL) were diluted using 90 μL of 74.9:24.9:0.2 (v/v/v) acetonitrile/methanol/formic acid containing stable isotope-labeled internal standards (valine-d8 [Isotec] and phenylalanine-d8 [Cambridge Isotope Laboratories]). The samples were centrifuged at 9000g for 10 min at 4°C and the supernatants were injected directly onto a 150 × 2-mm Atlantis HILIC column (Waters). The column was eluted isocratically at a flow rate of 250 μL/min with 5% mobile phase A (10 mM ammonium formate, 0.1% formic acid in water) for 1 min followed by a linear gradient to 40% mobile phase B (acetonitrile with 0.1% formic acid) over 10 min. The electrospray ionization voltage was 3.5 kV and data were taken using full scan analysis over m/z 70–800 at 70,000 resolution. HILIC analyses of water-soluble metabolites in the negative-ion mode were performed using a Nexera X2 U-HPLC (Shimadzu) coupled to a Q-Exactive Plus Orbitrap mass spectrometer (Thermo Fisher Scientific). Cell extracts (10 μL) were injected onto a 150 × 2.0-mm Luna NH2 column (Phenomenex) that was eluted at a flow rate of 400 μL/min with initial conditions of 10% mobile phase A (20 mM ammonium acetate, 20 mM ammonium hydroxide in water) and 90% mobile phase B (10 mM ammonium hydroxide in 75:25 [v/v] acetonitrile/methanol) followed by a 10-min linear gradient to 100% mobile phase A. MS full-scan data were acquired over m/z 70–750. Instrument settings were source voltage −3.0 kV, source temperature 325°C, capillary temperature 350°C, sheath gas 55, auxiliary gas 10, and resolution 70,000. LC-MS data were processed and visually inspected using TraceFinder 3.1 software (Thermo Fisher Scientific) LC-MS (Mascanfroni et al. 2015).
Retroviral and lentiviral production
Viruses expressing pLPC-REDD1-HA, Redd1, and REDD1 were used in this study. shRedd1 clones were cotransfected into HEK293T cells with lentiviral packaging plasmids by using CalPhos mammalian transfection kit (Clontech Laboratories) according to manufacturer's instruction. The conditioned medium containing lentiviral particles was collected 36 h after transfection and filtered with a 0.45-μm pore filter (Milipore). The filtered media was then used to infect target cells. Polybrene (Sigma) was supplemented at final concentration of 10 μg/mL to increase infection efficiency. The infected cells were selected using 1 μg/μL puromycin (Sigma) 72 h after infection. Genetic knockdown of Redd1 was confirmed via either immunoblotting or qRT-PCR analysis. shRNA sequences for Redd1 were GCTATCTTACAGACGCATGAA and GTGTAGCATGTACCTTATTAT. shRNA sequences for REDD1 were GCTATCTTACAGACGCATGAA and GCTATCTTACAGACGCATGAA.
Immunohistochemistry
Mouse tissue specimens were fixed in 4% buffered formalin for 24 h and kept in 70% ethanol until paraffin embedding. Assistance in processing of murine tumor samples was offered by the Dana-Farber/Harvard Cancer Center Specialized Histopathology Core Facility. Five-micron sections were taken from formalin-fixed, paraffin-embedded tumors and stained using standard protocols. Lung cancer patient tissue microarray were generated at Massachusetts General Hospital Pathology department. Staining for cleaved caspase 3 was performed by Massachusetts General Hospital Histopathology Research Core. Staining for human REDD1 using affinity-purified antibody were conducted by the core staff. IHC results were further evaluated by H-score system or (“histo” score) to tumor samples. The H-score included the sum of individual H-scores for each intensity level seen (score 0: no positive staining; score 3: strongest staining) using the following formula: [0 × (% cells 0) + 1 × (% cells 1+) + 2 × (% cells 2+) + 3 × (% cells 3+). Thus, there were 300 possible values. Using this system, <1% positive cells was considered to be a negative result.
Staining of LD with LD540 or Oil Red O
For microscopic analysis of LD540 staining, cells were fixed with 4% paraformaldehyde (PFA) for 15 min, incubated with a solution of 0.05 mg/mL LD540 (stock solution in ethanol at 0.5 mg/mL) in PBS in the dark for 10 min at room temperature , and washed three times with PBS. Cells were stained in 1 µg/mL DAPI (Sigma) and mounted in VectaShield mounting medium (Vector Laboratories H-1000). Images were captured with the Olympus IX81 inverted fluorescence microscope. The quantification was performed by counting at least five random fields of view with a 60× objective, and calculating the average and standard deviation. For Oil Red O staining, murine tumors were snap-frozen in HistoPrep (Fisher Scientific), and 5-μm sections were stained with the Abcam Oil Red O (lipid stain) kit (ab150678) according to the manufacturer's instructions. ImageJ was used to quantitate LD levels from microscopic images.
Flow cytometry
To examine glucose uptake, 100 mM of the fluorescent glucose analog 2-NBDG (Invitrogen) was added to cell culture medium 16 h before analysis. For ROS measurement, cells were stained in full medium at final concentrations of 5 μM CM-H2DCFDA (Sigma) for 40 min in the dark at 37°C. Cells were trypsinized and single-cell suspensions were analyzed by flow cytometry. To measure in vitro transport of LPC, TopFluor LPC was dissolved in 12% BSA, which was diluted in 150 mM NaCl. Uptake of TopFluor LPC in cells were then stained for 20 min at 37°C and cells were then harvested for measurement of flow cytometry analysis.
Seahorse XFe96
The cellular oxygen consumption rate of live cells was assessed using the Seahorse XFe96 (Seahorse Biosciences). Respiration was measured under basal conditions as well as in the presence of mitochondrial inhibitor 0.25 µM oligomycin, 5 µM uncoupler carbonyl cyanide-4-(tri-fluoromethoxy)phenylhydrazone (FCCP), and 1 µM respiratory chain inhibitors antimycin A and rotenone. Results were normalized to protein concentration. ATP content of cells was determined using the Cell Titer-Glo kit (Promega). Luminescence was normalized to number of cells as measured by DNA content using CyQuant NF.
Cell viability and proliferation
For growth assays, cells were plated at a density of 1500 cells per well in black 96-well plates using five to six replicates per time point and/or condition, and allowed to attach overnight. Cell viability was measured by ATP content measurement using the CellTiter-Glo luminescent assay (Promega) according to the manufacturer's instructions. Cell growth was assessed by DNA content measurement using the CyQuant NF kit according to the manufacturer's instructions. Day 0 was considered the day after the initial seeding.
Fatty acid oxidation and lipogenesis
For fatty acid oxidation, primary MEFs were serum starved for 3 h and incubated overnight in culture medium containing 100 mM palmitate (C16:0) and 1 mM carnitine. In the final 2 h of incubation, cells were pulsed with 1.7 µM Ci[9,10(n)-3H] palmitic acid (GE Healthcare), and the medium was collected and eluted on ion exchange columns packed with DOWEX 1X2-400 resin (Sigma) to analyze the released 3H2O, formed during cellular oxidation of [3H] palmitate. Primary MEFs used for this assay were below passage 5.
For the measurement of lipogenesis, A549 cells were cultured, placed overnight in low-glucose low-serum medium, then labeled with 1-14C acetic acid (Perkin Elmer) while stimulated with serum-containing medium for 1 h. Cells were washed twice with PBS before lysis in 0.5% Triton X-100. The lipid fraction was isolated by the addition of chloroform and methanol (2:1 [v/v]), followed by the addition of water. Samples were centrifuged, and 14C incorporation was measured in the bottom, lipid-containing phase using a scintillation counter. Each condition was normalized to protein concentrations.
NADPH, NADH, and GSH assays
Cells were seeded at 5000 cells/well in a 96-well plate. Assays were performed according to instructions from Promega (NADP/NADPH-Glo [G9081], NAD/NADH-Glo [G9071], and GSH/GSSG-Glo assay [V6611]).
PCR
Total RNA extraction, cDNA synthesis, and qRT-PCR were carried out as described previously. The expression of each gene was normalized to b-actin. Primers used were as follows: Redd1 (5′-GACAGCAGCAACAGTGGCTTC-3′ and 5′-CCACGCTATGGCAGCTCTTGC-3′), Actb (5′-CCAACCGTGAAAAGATGACC-3′ and 5′-CCAGAGGCATACAGGGACAG-3′), PPARγ (5′-CCACCAACTTCGGAATCAGCT-3′ and 5′-TTTGTGGATCCGGCAGTTAAGA-3′), and CD36 (5′-TCCTCTGACATTTGCAGGTCTATC-3′ and 5′-AAAGGCATTGGCTGGAAGAA-3′).
Co-IP and Western blot
Western analysis was conducted as described previously (Qiao et al. 2015). For immunoprecipitation (IP)/Western analysis of HIF-1α, cells were lysed in RIPA buffer, and equal amounts of total lysate (0.75–1.5 mg) were incubated with anti-HIF1α antibody for 90 min or overnight at 4°C. HIF1α protein was precipitated using Protein G Sepharose (GE Healthcare) for 30 min at 4°C, washed three times with lysis buffer, and visualized by SDS-PAGE. For Western blot of Nrf2 and HIF-1α, nuclear proteins were isolated using NE-PER nuclear and cytoplasmic extraction reagents (Thermo Fisher 78833). Blots were incubated with antibodies recognizing the following proteins: anti-HIF-1α (Novus Biologicals NB100-105), anti-lamin-B1 (Abcam ab16048), Nrf2 rabbit monoclonal antibody (Dr. Edward E. Schmidt, Montana State University), REDD1 (Bethyl Laboratories A302-169A), b-tubulin (Millipore MAB 3408), Ras (G12D mutant-specific, rabbit mAb; Cell Signaling 14429),
RNA-seq and bioinformatics analysis
RNA sequencing was performed using total RNA isolated from at least three independent mouse embryos per genotype. RNA-seq library preparation and sequencing were performed by Massachusetts General Hospital NextGen Sequencing Core. Gene set enrichment analysis (GSEA) analysis of RNA-seq data was used to generate an unselected statistical ranking of differentially expressed gene signatures. The meta-gene signature applied to TCGA LUAD and PDAC cohorts was derived from RNA-seq results of KRMEFs compared with KMEFs (n = 4 samples per genotype). Following normalization and variation filtering, a t-test was performed to find genes significantly varying between genotypes with a P-value <0.05 and corrected for multiple hypothesis testing. Ultimately, 339 statistically differentially expressed genes could be mapped to TCGA RNA-seqV2 and were used to generate a metagene value used for the analysis (see the Supplemental Material for details).
Wound healing assay
Experiments were performed according to instructions provided by CytoSelect 24-well wound healing assay (Cell Biolabs CBA-120).
Statistical analysis
For qRT-PCR analysis, proliferation assays, glucose uptake, tumor sphere formation, and tumor size, significance was analyzed using two-tailed Student's t-test. A P-value of <0.05 was considered statistically significant. A log-rank test was used to determine significance for Kaplan-Meier analyses. P-values are depicted in the figures as follows: P-value < 0.05 (*), P-value < 0.01 (**), P-value < 0.001 (***), P-value < 0.0001 (****), and not significant (ns).
Supplementary Material
Acknowledgments
This work was supported by RO1 CA122589, by grants from the National Cancer Center and the Massachusetts General Hospital (MGH) Executive Committee on Research (ECOR) Fund for Medical Discovery to S.Q. and S.-B.K., by an MGH Cancer Center Excellence Award to S.-B.K., and by the ECOR Research Scholar Award to L.W.E.
Author contributions: L.W.E. and S.Q. conceived the study. S.Q., S.-B.K., C.C., M.H., and N.B. performed the methodology. K.R. and S.R. performed the formal analysis. S.Q., S.-B.K., V.V., D.S., K.C.P., E.Z., Y.M., S.J., and A.C. performed the investigation. M.M.-K., M.H., C.C., and N.B. obtained the resources. S.Q., S.-B.K., and V.V. visualized the study. S.Q., S.-B.K., and L.W.E. wrote the original draft of the manuscript. L.W.E. supervised the study. S.Q., S.-B.K., and L.W.E. acquired the funding.
Footnotes
Supplemental material is available for this article.
Article published online ahead of print. Article and publication date are online at http://www.genesdev.org/cgi/doi/10.1101/gad.335166.119.
Freely available online through the Genes & Development Open Access option.
References
- Agbunag C, Lee KE, Buontempo S, Bar-Sagi D. 2006. Pancreatic duct epithelial cell isolation and cultivation in two-dimensional and three-dimensional culture systems. Methods Enzymol 407: 703–710. 10.1016/S0076-6879(05)07055-2 [DOI] [PubMed] [Google Scholar]
- Alvarez-Garcia O, Matsuzaki T, Olmer M, Plate L, Kelly JW, Lotz MK. 2017. Regulated in development and DNA damage response 1 deficiency impairs autophagy and mitochondrial biogenesis in articular cartilage and increases the severity of experimental osteoarthritis. Arthritis Rheumatol 69: 1418–1428. 10.1002/art.40104 [DOI] [PMC free article] [PubMed] [Google Scholar]
- Bensaad K, Favaro E, Lewis CA, Peck B, Lord S, Collins JM, Pinnick KE, Wigfield S, Buffa FM, Li JL, et al. 2014. Fatty acid uptake and lipid storage induced by HIF-1α contribute to cell growth and survival after hypoxia-reoxygenation. Cell Rep 9: 349–365. 10.1016/j.celrep.2014.08.056 [DOI] [PubMed] [Google Scholar]
- Biancur DE, Kimmelman AC. 2018. The plasticity of pancreatic cancer metabolism in tumor progression and therapeutic resistance. Biochim Biophys Acta Rev Cancer 1870: 67–75. 10.1016/j.bbcan.2018.04.011 [DOI] [PMC free article] [PubMed] [Google Scholar]
- Brugarolas J, Lei K, Hurley RL, Manning BD, Reiling JH, Hafen E, Witters LA, Ellisen LW, Kaelin WG Jr. 2004. Regulation of mTOR function in response to hypoxia by REDD1 and the TSC1/TSC2 tumor suppressor complex. Genes Dev 18: 2893–2904. 10.1101/gad.1256804 [DOI] [PMC free article] [PubMed] [Google Scholar]
- Brunelle JK, Bell EL, Quesada NM, Vercauteren K, Tiranti V, Zeviani M, Scarpulla RC, Chandel NS. 2005. Oxygen sensing requires mitochondrial ROS but not oxidative phosphorylation. Cell Metab 1: 409–414. 10.1016/j.cmet.2005.05.002 [DOI] [PubMed] [Google Scholar]
- The Cancer Genome Atlas Research Network. 2014. Comprehensive molecular profiling of lung adenocarcinoma. Nature 511: 543–550. 10.1038/nature13385 [DOI] [PMC free article] [PubMed] [Google Scholar]
- The Cancer Genome Atlas Research Network. 2017. Integrated genomic characterization of pancreatic ductal adenocarcinoma. Cancer Cell 32: 185–203.e13. 10.1016/j.ccell.2017.07.007 [DOI] [PMC free article] [PubMed] [Google Scholar]
- Chio IIC, Jafarnejad SM, Ponz-Sarvise M, Park Y, Rivera K, Palm W, Wilson J, Sangar V, Hao Y, Öhlund D, et al. 2016. NRF2 promotes tumor maintenance by modulating mRNA translation in pancreatic cancer. Cell 166: 963–976. 10.1016/j.cell.2016.06.056 [DOI] [PMC free article] [PubMed] [Google Scholar]
- Coort SL, Willems J, Coumans WA, van der Vusse GJ, Bonen A, Glatz JF, Luiken JJ. 2002. Sulfo-N-succinimidyl esters of long chain fatty acids specifically inhibit fatty acid translocase (FAT/CD36)-mediated cellular fatty acid uptake. Mol Cell Biochem 239: 213–219. 10.1023/A:1020539932353 [DOI] [PubMed] [Google Scholar]
- Corcoran RB, Contino G, Deshpande V, Tzatsos A, Conrad C, Benes CH, Levy DE, Settleman J, Engelman JA, Bardeesy N. 2011. STAT3 plays a critical role in KRAS-induced pancreatic tumorigenesis. Cancer Res 71: 5020–5029. 10.1158/0008-5472.CAN-11-0908 [DOI] [PMC free article] [PubMed] [Google Scholar]
- DeNicola GM, Karreth FA, Humpton TJ, Gopinathan A, Wei C, Frese K, Mangal D, Yu KH, Yeo CJ, Calhoun ES, et al. 2011. Oncogene-induced Nrf2 transcription promotes ROS detoxification and tumorigenesis. Nature 475: 106–109. 10.1038/nature10189 [DOI] [PMC free article] [PubMed] [Google Scholar]
- DeYoung MP, Horak P, Sofer A, Sgroi D, Ellisen LW. 2008. Hypoxia regulates TSC1/2–mTOR signaling and tumor suppression through REDD1-mediated 14-3-3 shuttling. Genes Dev 22: 239–251. 10.1101/gad.1617608 [DOI] [PMC free article] [PubMed] [Google Scholar]
- DuPage M, Dooley AL, Jacks T. 2009. Conditional mouse lung cancer models using adenoviral or lentiviral delivery of Cre recombinase. Nat Protoc 4: 1064–1072. 10.1038/nprot.2009.95 [DOI] [PMC free article] [PubMed] [Google Scholar]
- Ellisen LW. 2005. Growth control under stress: mTOR regulation through the REDD1–TSC pathway. Cell Cycle 4: 1500–1502. 10.4161/cc.4.11.2139 [DOI] [PubMed] [Google Scholar]
- Engelking LJ, Cantoria MJ, Xu Y, Liang G. 2017. Developmental and extrahepatic physiological functions of SREBP pathway genes in mice. Semin Cell Dev Biol 81: 98–109. [DOI] [PMC free article] [PubMed] [Google Scholar]
- Fung MKL, Chan GC. 2017. Drug-induced amino acid deprivation as strategy for cancer therapy. J Hematol Oncol 10: 144 10.1186/s13045-017-0509-9 [DOI] [PMC free article] [PubMed] [Google Scholar]
- Gordon BS, Liu C, Steiner JL, Nader GA, Jefferson LS, Kimball SR. 2016a. Loss of REDD1 augments the rate of the overload-induced increase in muscle mass. Am J Physiol Regul Integr Comp Physiol 311: R545–R557. 10.1152/ajpregu.00159.2016 [DOI] [PMC free article] [PubMed] [Google Scholar]
- Gordon BS, Steiner JL, Williamson DL, Lang CH, Kimball SR. 2016b. Emerging role for regulated in development and DNA damage 1 (REDD1) in the regulation of skeletal muscle metabolism. Am J Physiol Endocrinol Metab 311: E157–E174. 10.1152/ajpendo.00059.2016 [DOI] [PMC free article] [PubMed] [Google Scholar]
- Harris IS, Treloar AE, Inoue S, Sasaki M, Gorrini C, Lee KC, Yung KY, Brenner D, Knobbe-Thomsen CB, Cox MA, et al. 2015. Glutathione and thioredoxin antioxidant pathways synergize to drive cancer initiation and progression. Cancer Cell 27: 211–222. 10.1016/j.ccell.2014.11.019 [DOI] [PubMed] [Google Scholar]
- Henne WM, Reese ML, Goodman JM. 2018. The assembly of lipid droplets and their roles in challenged cells. EMBO J 37 10.15252/embj.201898947 [DOI] [PMC free article] [PubMed] [Google Scholar]
- Hingorani SR, Petricoin EF, Maitra A, Rajapakse V, King C, Jacobetz MA, Ross S, Conrads TP, Veenstra TD, Hitt BA, et al. 2003. Preinvasive and invasive ductal pancreatic cancer and its early detection in the mouse. Cancer Cell 4: 437–450. 10.1016/S1535-6108(03)00309-X [DOI] [PubMed] [Google Scholar]
- Horak P, Crawford AR, Vadysirisack DD, Nash ZM, DeYoung MP, Sgroi D, Ellisen LW. 2010. Negative feedback control of HIF-1 through REDD1-regulated ROS suppresses tumorigenesis. Proc Natl Acad Sci 107: 4675–4680. 10.1073/pnas.0907705107 [DOI] [PMC free article] [PubMed] [Google Scholar]
- Huynh TG, Morales-Oyarvide V, Campo MJ, Gainor JF, Bozkurtlar E, Uruga H, Zhao L, Gomez-Caraballo M, Hata AN, Mark EJ, et al. 2016. Programmed cell death ligand 1 expression in resected lung adenocarcinomas: association with immune microenvironment. J Thorac Oncol 11: 1869–1878. 10.1016/j.jtho.2016.08.134 [DOI] [PubMed] [Google Scholar]
- Jackson EL, Willis N, Mercer K, Bronson RT, Crowley D, Montoya R, Jacks T, Tuveson DA. 2001. Analysis of lung tumor initiation and progression using conditional expression of oncogenic K-ras. Genes Dev 15: 3243–3248. 10.1101/gad.943001 [DOI] [PMC free article] [PubMed] [Google Scholar]
- Ji Cho M, Yoon SJ, Kim W, Park J, Lee J, Park JG, Cho YL, Hun Kim J, Jang H, Park YJ, et al. 2019. Oxidative stress-mediated TXNIP loss causes RPE dysfunction. Exp Mol Med 51: 1–13. 10.1038/s12276-019-0327-y [DOI] [PMC free article] [PubMed] [Google Scholar]
- Kamphorst JJ, Cross JR, Fan J, de Stanchina E, Mathew R, White EP, Thompson CB, Rabinowitz JD. 2013. Hypoxic and Ras-transformed cells support growth by scavenging unsaturated fatty acids from lysophospholipids. Proc Natl Acad Sci 110: 8882–8887. 10.1073/pnas.1307237110 [DOI] [PMC free article] [PubMed] [Google Scholar]
- Kirkpatrick DL, Powis G. 2017. Clinically evaluated cancer drugs inhibiting redox signaling. Antioxid Redox Signal 26: 262–273. 10.1089/ars.2016.6633 [DOI] [PMC free article] [PubMed] [Google Scholar]
- Kramer N, Walzl A, Unger C, Rosner M, Krupitza G, Hengstschläger M, Dolznig H. 2013. In vitro cell migration and invasion assays. Mutat Res 752: 10–24. 10.1016/j.mrrev.2012.08.001 [DOI] [PubMed] [Google Scholar]
- Krishnan J, Suter M, Windak R, Krebs T, Felley A, Montessuit C, Tokarska-Schlattner M, Aasum E, Bogdanova A, Perriard E, et al. 2009. Activation of a HIF1α–PPARγ axis underlies the integration of glycolytic and lipid anabolic pathways in pathologic cardiac hypertrophy. Cell Metab 9: 512–524. 10.1016/j.cmet.2009.05.005 [DOI] [PubMed] [Google Scholar]
- Ladanyi A, Mukherjee A, Kenny HA, Johnson A, Mitra AK, Sundaresan S, Nieman KM, Pascual G, Benitah SA, Montag A, et al. 2018. Adipocyte-induced CD36 expression drives ovarian cancer progression and metastasis. Oncogene 37: 2285–2301. 10.1038/s41388-017-0093-z [DOI] [PMC free article] [PubMed] [Google Scholar]
- Lipina C, Hundal HS. 2016. Is REDD1 a metabolic éminence grise? Trends Endocrinol Metab 27: 868–880. 10.1016/j.tem.2016.08.005 [DOI] [PMC free article] [PubMed] [Google Scholar]
- Mascanfroni ID, Takenaka MC, Yeste A, Patel B, Wu Y, Kenison JE, Siddiqui S, Basso AS, Otterbein LE, Pardoll DM, et al. 2015. Metabolic control of type 1 regulatory T cell differentiation by AHR and HIF1-α. Nat Med 21: 638–646. 10.1038/nm.3868 [DOI] [PMC free article] [PubMed] [Google Scholar]
- Nguyen LN, Ma D, Shui G, Wong P, Cazenave-Gassiot A, Zhang X, Wenk MR, Goh EL, Silver DL. 2014. Mfsd2a is a transporter for the essential omega-3 fatty acid docosahexaenoic acid. Nature 509: 503–506. 10.1038/nature13241 [DOI] [PubMed] [Google Scholar]
- Nieman KM, Kenny HA, Penicka CV, Ladanyi A, Buell-Gutbrod R, Zillhardt MR, Romero IL, Carey MS, Mills GB, Hotamisligil GS, et al. 2011. Adipocytes promote ovarian cancer metastasis and provide energy for rapid tumor growth. Nat Med 17: 1498–1503. 10.1038/nm.2492 [DOI] [PMC free article] [PubMed] [Google Scholar]
- Ota KT, Liu RJ, Voleti B, Maldonado-Aviles JG, Duric V, Iwata M, Dutheil S, Duman C, Boikess S, Lewis DA, et al. 2014. REDD1 is essential for stress-induced synaptic loss and depressive behavior. Nat Med 20: 531–535. 10.1038/nm.3513 [DOI] [PMC free article] [PubMed] [Google Scholar]
- Padanad MS, Konstantinidou G, Venkateswaran N, Melegari M, Rindhe S, Mitsche M, Yang C, Batten K, Huffman KE, Liu J, et al. 2016. Fatty acid oxidation mediated by acyl-CoA synthetase long chain 3 is required for mutant KRAS lung tumorigenesis. Cell Rep 16: 1614–1628. 10.1016/j.celrep.2016.07.009 [DOI] [PMC free article] [PubMed] [Google Scholar]
- Pascual G, Avgustinova A, Mejetta S, Martin M, Castellanos A, Attolini CS, Berenguer A, Prats N, Toll A, Hueto JA, et al. 2017. Targeting metastasis-initiating cells through the fatty acid receptor CD36. Nature 541: 41–45. 10.1038/nature20791 [DOI] [PubMed] [Google Scholar]
- Patra KC, Hay N. 2014. The pentose phosphate pathway and cancer. Trends Biochem Sci 39: 347–354. 10.1016/j.tibs.2014.06.005 [DOI] [PMC free article] [PubMed] [Google Scholar]
- Patra KC, Kato Y, Mizukami Y, Widholz S, Boukhali M, Revenco I, Grossman EA, Ji F, Sadreyev RI, Liss AS, et al. 2018. Mutant GNAS drives pancreatic tumourigenesis by inducing PKA-mediated SIK suppression and reprogramming lipid metabolism. Nat Cell Biol 20: 811–822. 10.1038/s41556-018-0122-3 [DOI] [PMC free article] [PubMed] [Google Scholar]
- Priolo C, Ricoult SJ, Khabibullin D, Filippakis H, Yu J, Manning BD, Clish C, Henske EP. 2015. Tuberous sclerosis complex 2 loss increases lysophosphatidylcholine synthesis in lymphangioleiomyomatosis. Am J Respir Cell Mol Biol 53: 33–41. 10.1165/rcmb.2014-0379RC [DOI] [PMC free article] [PubMed] [Google Scholar]
- Pylayeva-Gupta Y, Grabocka E, Bar-Sagi D. 2011. RAS oncogenes: weaving a tumorigenic web. Nat Rev Cancer 11: 761–774. 10.1038/nrc3106 [DOI] [PMC free article] [PubMed] [Google Scholar]
- Qiao S, Dennis M, Song X, Vadysirisack DD, Salunke D, Nash Z, Yang Z, Liesa M, Yoshioka J, Matsuzawa S, et al. 2015. A REDD1/TXNIP pro-oxidant complex regulates ATG4B activity to control stress-induced autophagy and sustain exercise capacity. Nat Commun 6: 7014 10.1038/ncomms8014 [DOI] [PMC free article] [PubMed] [Google Scholar]
- Reiling JH, Hafen E. 2004. The hypoxia-induced paralogs Scylla and Charybdis inhibit growth by down-regulating S6K activity upstream of TSC in Drosophila. Genes Dev 18: 2879–2892. 10.1101/gad.322704 [DOI] [PMC free article] [PubMed] [Google Scholar]
- Reuschel EL, Wang J, Shivers DK, Muthumani K, Weiner DB, Ma Z, Finkel TH. 2015. REDD1 is essential for optimal T cell proliferation and survival. PLoS One 10: e0136323 10.1371/journal.pone.0136323 [DOI] [PMC free article] [PubMed] [Google Scholar]
- Romero R, Sayin VI, Davidson SM, Bauer MR, Singh SX, LeBoeuf SE, Karakousi TR, Ellis DC, Bhutkar A, Sanchez-Rivera FJ, et al. 2017. Keap1 loss promotes Kras-driven lung cancer and results in dependence on glutaminolysis. Nat Med 23: 1362–1368. 10.1038/nm.4407 [DOI] [PMC free article] [PubMed] [Google Scholar]
- Shin D, Jeon JH, Jeong M, Suh HW, Kim S, Kim HC, Moon OS, Kim YS, Chung JW, Yoon SR, et al. 2008. VDUP1 mediates nuclear export of HIF1α via CRM1-dependent pathway. Biochim Biophys Acta 1783: 838–848. 10.1016/j.bbamcr.2007.10.012 [DOI] [PubMed] [Google Scholar]
- Singh A, Ruiz C, Bhalla K, Haley JA, Li QK, Acquaah-Mensah G, Montal E, Sudini KR, Skoulidis F, Wistuba II, et al. 2018. De novo lipogenesis represents a therapeutic target in mutant Kras non-small cell lung cancer. FASEB J 32: fj201800204 10.1096/fj.201800204 [DOI] [PMC free article] [PubMed] [Google Scholar]
- Sofer A, Lei K, Johannessen CM, Ellisen LW. 2005. Regulation of mTOR and cell growth in response to energy stress by REDD1. Mol Cell Biol 25: 5834–5845. 10.1128/MCB.25.14.5834-5845.2005 [DOI] [PMC free article] [PubMed] [Google Scholar]
- Son J, Lyssiotis CA, Ying H, Wang X, Hua S, Ligorio M, Perera RM, Ferrone CR, Mullarky E, Shyh-Chang N, et al. 2013. Glutamine supports pancreatic cancer growth through a KRAS-regulated metabolic pathway. Nature 496: 101–105. 10.1038/nature12040 [DOI] [PMC free article] [PubMed] [Google Scholar]
- Spandl J, White DJ, Peychl J, Thiele C. 2009. Live cell multicolor imaging of lipid droplets with a new dye, LD540. Traffic 10: 1579–1584. 10.1111/j.1600-0854.2009.00980.x [DOI] [PubMed] [Google Scholar]
- Spiegelman BM. 1998. PPAR-γ: adipogenic regulator and thiazolidinedione receptor. Diabetes 47: 507–514. 10.2337/diabetes.47.4.507 [DOI] [PubMed] [Google Scholar]
- Svensson RU, Parker SJ, Eichner LJ, Kolar MJ, Wallace M, Brun SN, Lombardo PS, Van Nostrand JL, Hutchins A, Vera L, et al. 2016. Inhibition of acetyl-CoA carboxylase suppresses fatty acid synthesis and tumor growth of non-small-cell lung cancer in preclinical models. Nat Med 22: 1108–1119. 10.1038/nm.4181 [DOI] [PMC free article] [PubMed] [Google Scholar]
- White E. 2013. Exploiting the bad eating habits of Ras-driven cancers. Genes Dev 27: 2065–2071. 10.1101/gad.228122.113 [DOI] [PMC free article] [PubMed] [Google Scholar]
- Ying H, Kimmelman AC, Lyssiotis CA, Hua S, Chu GC, Fletcher-Sananikone E, Locasale JW, Son J, Zhang H, Coloff JL, et al. 2012. Oncogenic Kras maintains pancreatic tumors through regulation of anabolic glucose metabolism. Cell 149: 656–670. 10.1016/j.cell.2012.01.058 [DOI] [PMC free article] [PubMed] [Google Scholar]
- Yoshida T, Mett I, Bhunia AK, Bowman J, Perez M, Zhang L, Gandjeva A, Zhen L, Chukwueke U, Mao T, et al. 2010. Rtp801, a suppressor of mTOR signaling, is an essential mediator of cigarette smoke-induced pulmonary injury and emphysema. Nat Med 16: 767–773. 10.1038/nm.2157 [DOI] [PMC free article] [PubMed] [Google Scholar]
Associated Data
This section collects any data citations, data availability statements, or supplementary materials included in this article.