

Abstract
Deciphering the interplay between chromatin accessibility and transcription factor (TF) binding is fundamental to understanding transcriptional regulation, control of cellular states, and the establishment of new phenotypes. Recent genome-wide chromatin accessibility profiling studies have provided catalogs of putative open regions, where TFs can recognize their motifs and regulate gene expression programs. Here, we present motif enrichment in differential elements of accessibility (MEDEA), a computational tool that analyzes high-throughput chromatin accessibility genomic data to identify cell-type-specific accessible regions and lineage-specific motifs associated with TF binding therein. To benchmark MEDEA, we used a panel of reference cell lines profiled by ENCODE and curated by the ENCODE Project Consortium for the ENCODE-DREAM Challenge. By comparing results with RNA-seq data, ChIP-seq peaks, and DNase-seq footprints, we show that MEDEA improves the detection of motifs associated with known lineage specifiers. We then applied MEDEA to 610 ENCODE DNase-seq data sets, where it revealed significant motifs even when absolute enrichment was low and where it identified novel regulators, such as NRF1 in kidney development. Finally, we show that MEDEA performs well on both bulk and single-cell ATAC-seq data. MEDEA is publicly available as part of our Glossary-GENRE suite for motif enrichment analysis.
In eukaryotic development, gene transcription happens in precise spatiotemporal patterns that require the specific binding of highly regulated transcription factors (TFs) to dynamically accessible cis-regulatory elements. The majority of the approximately 1500 TFs present in the human genome are up-regulated in a tissue-specific and cell-type-specific manner (Vaquerizas et al. 2009; Lambert et al. 2018). The ectopic expression of a combination of fewer than 10 TFs is often sufficient to drive differentiation and reprograming (Riddell et al. 2014). The precise identification of lineage specifiers, their regulators, and their binding sites is crucial for understanding how the genome encodes the regulation of gene expression programs and cellular functions.
Several sequencing-based techniques for genomic profiling of chromatin accessibility (e.g., DNase-seq [Song and Crawford 2010; John et al. 2013], FAIRE-seq [Nagy et al. 2003], ATAC-seq [Buenrostro et al. 2013]) or nucleosome occupancy (e.g., MNase-seq [Cui and Zhao 2012]) have been developed (for a comparative review, see Tsompana and Buck 2014). Some of them are widely used both by large consortia to map the human epigenome in a high-throughput manner (Thurman et al. 2012; Roadmap Epigenomics Consortium et al. 2015) and by an increasing number of laboratories to characterize chromatin accessibility in specific cell types and cellular conditions. Of these, ATAC-seq is currently the most versatile assay because it simultaneously identifies open chromatin regions and nucleosomes, is suitable for single-cell applications (Buenrostro et al. 2015), and requires both less input material (Buenrostro et al. 2013, 2015; Corces et al. 2018) and less sample handling. However, thus far, there are considerably fewer ATAC-seq data sets currently available than the extensive DNase-seq data sets produced by large consortia, such as ENCODE and the NIH Roadmap Epigenomics Mapping Consortium (The ENCODE Project Consortium 2012; Thurman et al. 2012; Roadmap Epigenomics Consortium et al. 2015). These DNase-seq data sets have enabled the cataloging of open chromatin regions in a wide variety of human cell types (Thurman et al. 2012; Roadmap Epigenomics Consortium et al. 2015). The ENCODE Project Consortium recently reanalyzed a subset of those data to provide highly curated DNase-seq data sets, together with RNA-seq and ChIP-seq data sets, for a DREAM Challenge to predict in vivo TF binding sites (TFBSs) (http://dreamchallenges.org/project/encode-dream-in-vivo-transcription-factor-binding-site-prediction-challenge/).
To identify TFBSs, DNase-seq data are often mined for digital footprints (DFPs), which are short (∼10 bp) sharp decreases of accessibility within open chromatin regions, suggesting the presence of bound proteins (i.e., TFs) that locally protect the DNA from DNase I cleavage (Hesselberth et al. 2009; Pique-Regi et al. 2011; Li et al. 2019). Although DFP analysis can indicate TFBSs (Neph et al. 2012b), several experimental and computational limitations impair its widespread use, including the need for greater sequencing depth compared with standard chromatin accessibility detection (Tsompana and Buck 2014). Experimentally, footprint detection is biased by the intrinsic sequence preference of DNase I, which can be adjusted computationally (He et al. 2014). Another bias originates from TFs with short residence time on DNA (Boyle et al. 2011; Pique-Regi et al. 2011; Buenrostro et al. 2013; Nakahashi et al. 2013; He et al. 2014; Sherwood et al. 2014; Sung et al. 2014), which can hinder footprint detection and cannot be corrected in silico. Computationally, DFP calling is challenging, time-consuming (e.g., requires between 31 and >7000 h of CPU time for a single human genome), and algorithm dependent (Gusmao et al. 2016), thus welcoming alternative methods to identify the most relevant TF motifs in a particular cell type or to prioritize which TF motifs to use for a DFP search. Moreover, the binding sites identified by a DFP analysis do not inform directly on whether the underlying motifs are associated with lineage-specific TFs versus general “housekeeping” TFs (e.g., SP1, CTCF, ZNF143) (Eisenberg and Levanon 2013) or on whether the identified motifs are significantly enriched in the regulatory elements of that cell type. Furthermore, to our knowledge, there is no comprehensive DFP database to aid in the analysis of motif enrichment across cell types.
In the main DNase-seq protocol adopted by ENCODE (John et al. 2013), the nuclear DNA is digested mildly and purified to select fragments <500 bp for sequencing. The resulting sequencing reads can be used to call narrow peaks of ∼150 bp, which potentially come from mononucleosomes displaced by TF binding (Neph et al. 2012b). Therefore, these peaks closely resemble TF ChIP-seq peaks, which are often used to test for the presence of lineage specifiers through the enrichment of their TF binding motifs (Wang et al. 2012; Mariani et al. 2017). The analysis of DNase-seq peaks for enriched motifs, which is easier and quicker than DFP calling, has rarely been performed separately from TF ChIP-seq peaks (He et al. 2012; Stergachis et al. 2013; Goode et al. 2016). Those studies, which focused on a few, well-characterized mammalian lineages and compared chromatin accessibility profiles obtained upon cellular differentiation or activation processes, showed that dynamically accessible regions can be used to identify the binding motifs of lineage-specific TFs. Similarly, clustering ATAC-seq peaks obtained from a large variety of cancer cells followed by motif enrichment analysis within each cluster revealed motifs associated with up-regulated TFs (Corces et al. 2018). However, such analyses are computationally demanding, may vary depending on the choice of clustering algorithm, and may not be feasible in uncharacterized cell types for which closely related cellular states are not available to distinguish cell-type-specific motif enrichment. Therefore, novel statistical methods are needed for the analysis of chromatin accessibility data to distinguish the motifs of lineage specifiers.
Despite the role of TF binding within accessible regulatory elements, many other processes can influence chromatin accessibility beyond cell-type-specific gene regulation (e.g., chromatin architecture, housekeeping processes, cell cycle), and very few bioinformatic tools have directly addressed the task of optimizing TF binding motif enrichment analysis of the accessible genome. MEME (McLeay and Bailey 2010) and HOMER (Heinz et al. 2010), two popular bioinformatic suites for the analysis and discovery of motifs, allow users to find enriched TF motifs in genomic data sets through a comparison with background sequences, either provided by the tool or by the users. When provided by the tool, the background sequences are not specific to the accessible genome, which may introduce compositional biases in the motif enrichment analysis. When provided by the users, it remains unclear what features should characterize an unbiased background, potentially leading to discrepant results. An alternative to MEME and HOMER is SeqUnwinder (Kakumanu et al. 2017), which can be used to leverage differences in chromatin accessibility profiles between cell types to improve the detection of enriched motifs associated with lineage specifiers. For the sake of flexibility, SeqUnwinder requires users to provide peak annotation as part of the input data, which here would require labeling the peaks that are differentially accessible in each cell type; how such labeling is performed could bias the inference of the enriched motifs. SeqUnwinder also performs a regularization step that requires parameter optimization and adds stochasticity to the results. The recently developed coTRaCTE tool (van Bömmel et al. 2018) infers cooperative TF pairs that co-occur in a cell-type-specific manner within accessible chromatin regions. coTRaCTE takes user-provided chromatin accessibility peak sets from many cell types, defines both the most cell-type-specific peaks and the most ubiquitous peaks, and performs a motif enrichment analysis between them. Despite directly sorting cell-type-specific peaks, coTRaCTE's analysis of each data set depends on the user-provided accompanying data sets, which may impair robustness and reproducibility of the results. To our knowledge, these computational tools have not been used extensively to allow evaluation of their accuracy in inferring motifs associated with lineage-specifying factors from genomic accessibility profiles.
Here, we present motif enrichment in differential elements of accessibility (MEDEA) as a novel method to analyze genome-wide chromatin accessibility data for TF binding by evaluating the enrichment of their motifs within the accessible regions. MEDEA combines (1) filtering for cell-type-specific accessibility peaks using a curated, high-quality reference ensemble of accessibility peaks (e.g., ENCODE-DREAM); (2) calculation of TF motif enrichment against genomic background regions with similar compositional features; and (3) statistical analysis of the typical enrichment levels of each motif to help the evaluation of users’ results. We benchmarked MEDEA on data obtained by using a variety of assays (i.e., DNase-seq, ATAC-seq, scATAC-seq, and FAIRE-seq) for the main ENCODE cell lines. We then compared MEDEA to bioinformatic tools that have similar goals, as well as to transcriptomic and epigenomic profiles. To reveal novel regulatory interactions, we also applied MEDEA to 610 ENCODE DNase-seq data sets spanning a wide variety of human cell types.
Results
Standard motif enrichment analysis of DNase-seq peaks does not yield enrichment of the motifs of several known lineage specifiers
We selected a panel of 12 human cell lines from ENCODE (Thurman et al. 2012) as a benchmark data set, comprising between 60,036 (H1-hES) and 291,130 (iPS) DNase-seq peaks representing accessible regions in each cell line, for identification of the binding motifs of lineage specifiers (Supplemental Table S1.1). In those DNase-seq peaks, we quantified TF motif enrichment by using the area under the receiver operating characteristic (AUROC) curve statistic, which is a well-established metric in these types of analysis (Gordan et al. 2009) and which we used to assess the presence of a TF motif among the 500 peaks with the highest signal (input set) compared with a background set of sequences (Methods) (Weirauch et al. 2013). For the AUROC implementation, we used two tools that we recently described for the analysis of TF ChIP-seq data: a TF-8mer glossary, representing the binding specificities of 671 metazoan TFs across all possible 8-bp sequences (8-mers), and GENRE for the construction of genomic background sets that are well matched for the sequence features of the input set (Mariani et al. 2017). In our benchmarking analysis of these DNase-seq peaks, we used 13 glossary modules that describe the specificities of TF families known to contain relevant developmental TFs for the selected cell types (Fig. 1A).
Figure 1.

TF motif enrichment in DNase-seq peaks partially infers lineage specifiers. (A) For a benchmarking set of 13 TF binding motifs, AUROC enrichment in a panel of 12 ENCODE cell lines was calculated using the Glossary motif enrichment tool with background sequences generated with GENRE software. Black boxes highlight three motifs (IRF, POU, GATA) expected to be enriched in the corresponding cell lines (GM12878, H1-hES, K562, respectively). (B) For each indicated cell type and TF family, TPM rank (y-axis) and TPM rank fold-change (x-axis) of the most up-regulated TF. Each TF's rank is determined according to RNA-seq TPM levels of all genes and serves as a measure of the TF's expression. The TPM rank fold-change of each TF is assessed by comparing the TF's rank in the indicated cell type to the TF's median rank across the remaining cell types as a measure of the TF's up-regulation. (Right insets) TPM rank and TPM rank fold-change evaluation of the TFs in the indicated families and cell types. The values and names of the most up-regulated TFs are colored in red. (C) Screenshot of the UCSC Genome Browser for the hemoglobin subunit beta (HBB) cluster locus (Chr 11: 5,220,000–5,320,000). Genomic profiles of five cell lines used in this study are from ENCODE. Three locations of constitutively accessible peaks are highlighted.
We observed cell-type-specific enrichment of several expected motifs (e.g., KLF in H1-hES and K562 cells [McConnell and Yang 2010], FOX in HepG2 and MCF-7 cells [Augello et al. 2011]) (Fig. 1A). However, several motifs associated with known lineage specifiers, such as GATA in K562 cells (Cantor and Orkin 2002), IRF in GM12878 (Taniguchi et al. 2001; Lu 2008), and POU in H1-hES cells (Young 2011), were not enriched (Fig. 1A, black boxes; Mariani et al. 2017). Moreover, we noticed systematic enrichment of certain motifs (KLF, ETS); such enrichment could originate from multiple sources, such as experimental artifacts in the chromatin accessibility assay, computational biases in the prediction of motifs, or the constitutive binding of genomic target sites by sequence-specific housekeeping TFs (e.g., KLF3/9, SP1, and CTCF for the KLF motif) (Eisenberg and Levanon 2013). These results were robust to increasing numbers of DNase-seq peaks analyzed and to the use of PWMs instead of k-mer motif models (Supplemental Fig. S1A,B; Supplemental Table S1.4).
As further evaluation, we inspected RNA-seq transcriptomic profiles provided by ENCODE-DREAM. For each cell line, we selected the most cell-type-specifically expressed member of each TF family (Fig. 1B; Supplemental Fig. S2). This analysis showed up-regulation of GATA1/2 in K562, IRF4/8 in GM12878, and POU5F1 in H1-hES cells (Fig. 1B, right insets), confirming the up-regulation of TFs whose motifs were expected, but did not appear, to be enriched in Figure 1A. The motifs of the pluripotency factors SOX, ZIC, and TEA in H1-hES and iPS cells were not enriched, despite the up-regulation of their family members SOX2, ZIC3, and TEAD3 (Supplemental Fig. S2).
To elucidate the origin of such discrepancies, we inspected the distribution of accessibility peaks and other genomic profiles in five representative loci that control genes known to be regulated in a cell-type-specific manner (HBB, IL6, ALB, IGF2, NANOG) (Fig. 1C; Supplemental Fig. S3). In the hemoglobin subunit beta (HBB) cluster locus, three chromatin accessibility peaks were shared across many different cell types, despite the fact that H3K4me1 and H3K27ac ChIP-seq peaks, RNA-seq transcripts, and 24 DNase-seq peaks were specific to K562 cells (Fig. 1C). We observed similar trends at the other loci, with constitutively accessible peaks always overlapping the ChIP-seq peaks of a variety of ubiquitous housekeeping chromatin factors (Eisenberg and Levanon 2013; Heidari et al. 2014), such as CTCF, ZNF143, TAF1, SIN3A, and SP1 (Supplemental Fig. S3). These results indicate that the most accessible chromatin regions in a particular cell type may not accurately represent the cell-type-specific cis-regulatory information.
MEDEA enhances the enrichment of TF binding motifs associated with lineage specifiers
We hypothesized that constitutively accessible regions can hinder the identification of enriched TF binding motifs of lineage specifiers. To avoid such bias, we developed a computational suite to detect TF motif enrichment in differential elements of accessibility (MEDEA), described below.
The first task of the suite, MEDEA filtering, categorizes the accessibility peaks specific to an input cell type by performing pairwise comparisons between the open regions of the input cell type and each cell type within a reference panel (Methods) (Fig. 2A). As the default reference panel for filtering, we equipped MEDEA with 12 highly curated DNase-seq data sets from ENCODE-DREAM (Supplemental Table S1.1), which encompass a wide range of lineages and allow the creation of a series of accessible peak subsets (“MEDEA peaks”) for any cell type of interest (e.g., subset 1: peaks in the input cell type but not in A549; subset 2: peaks in the input cell type but not in GM12878, etc.) (Supplemental Fig. S4). For each MEDEA peak series, we found that the top 500 peaks of the median MEDEA peak subset were still within the top 12% of peaks overall (Supplemental Table S2).
Figure 2.

Motif enrichment of differential elements of accessibility (MEDEA). (A) Schematic for MEDEA peak filtering. Chromatin accessibility peaks of a cell type of interest (Cell X) and of a reference cell type (e.g., Cell A) are compared. Overlapping peaks, which indicate constitutively accessible regions, are subtracted out, thus only selecting the peaks specific to the cell type of interest (X not in A) that are likely bound by lineage-specific TFs (TFx). (B–D) For the same TF binding motifs and cell lines of Figure 1A, analysis of motif enrichment obtained by using (B) MEDEA (filtering and AUROC), (C) Glossary's AUROC using ENCODE-DREAM DNase-seq data sets as background sequences for enrichment calculation, and (D) coTRaCTE. Boxes highlighting known lineage specifiers as in Figure 1A. (E) For the TF families and cell lines used to benchmark MEDEA, scatter plots to correlate transcriptomic up-regulation (x-axis values from Fig. 1B) and MEDEA AUROC (Fig. 2B). (F) Barplot of the correlation coefficients (Pearson's R) between TF up-regulation and motif enrichment obtained from different methods (in red; R from MEDEA, as in E). For additional scatterplots depicting correlations for other methods, see also Supplemental Figure S6.
The second task of the suite, MEDEA AUROC, separately assesses each MEDEA peak subset for motif enrichment by AUROC (Methods) (Supplemental Fig. S4) and then defines the enrichment of a motif in the input cell type by its median AUROC value across the series (Fig. 2B; Supplemental Fig. S4, green asterisks). Across the panel of selected cell types and motifs, the AUROC values were largely homogeneous within each series (Supplemental Fig. S4, right insets), suggesting the stability of the method. The use of the median AUROC (“MEDEA AUROC”) ensures robustness against outliers, which could appear when the input cell type is similar to a reference cell line. In the case of the pluripotent cell types H1-hES and iPS, their differential peaks relative to each other show no enrichment for motifs of pluripotency factors (e.g., POU), but enrichment of pluripotency motifs is identified nevertheless by the MEDEA AUROC because of the comparisons to other unrelated cell types in the reference panel (e.g., HepG2) (Supplemental Fig. S4).
The MEDEA AUROC values often highlighted different motifs than those enriched without MEDEA filtering (cf. Fig. 1A and Fig. 2B). In agreement with the high expression of IRF4/8 in GM12878 and GATA1/2 in K562 cells (Fig. 1B), MEDEA revealed enrichment of the IRF and GATA motifs in DNase-seq data from those cell lines, respectively, as quantified by AUROC values significantly higher than the “nonenrichment” value of 0.5, which had been seen before filtering (cf. Fig. 1A and Fig. 2B). Similarly, POU and other motifs (e.g., SOX, ZIC, TEA) associated to pluripotency and embryonic TFs (e.g., POU5F1/SOX2 [Young 2011], ZIC2/3 [Luo et al. 2015], and TEAD3/4 [Yagi et al. 2007]; Supplemental Fig. S2) marked H1-hES and iPS cells (Fig. 2B). In contrast to the enrichment patterns obtained without filtering, MEDEA did not systematically enrich for the KLF or ETS motifs across cell lines (cf. Fig. 1A and Fig. 2B). Furthermore, the MEDEA AUROC values were robust to the number of input peaks and TF motif model (i.e., k-mer models vs. PWMs) (Supplemental Fig. S1C,D).
To benchmark the performance of MEDEA against prior motif enrichment analysis tools, we compared the motif enrichment results obtained from applying various alternative tools to our benchmarking panel of DNase-seq data for 12 ENCODE cell lines and of 13 TF motifs. First, we tested AME from the MEME suite (McLeay and Bailey 2010) and findMotifsGenome.pl from the HOMER suite (Heinz et al. 2010), both of which quantify whether a particular motif set is enriched within a set of input sequences. When we used these tools’ default backgrounds (Supplemental Fig. S5A,B), we obtained two markedly distinct motif enrichment patterns, with limited motif enrichment of the expected lineage specifiers. We then asked whether using the ENCODE-DREAM data sets as the user-defined background sequences, and not as the comparative sequences for MEDEA filtering, could improve the detection of enriched motifs. To test this possibility, we used such data sets as background sequences both with the AUROC implementation (Fig. 2C; cf. with Fig. 1A) and with AME (Supplemental Fig. S5C; cf. with Supplemental Fig. S5A); in neither case did this improve the enrichment of the expected motifs. Finally, analysis of this reference panel using the recently proposed tool coTRaCTE (van Bömmel et al. 2018) resulted in constitutive enrichment of several lineage-specifying motifs (FOX, GATA, POU, SOX, TEA) across cell lines (Fig. 2D), which we interpreted as an artifact of comparing cell-type-specific peaks to ubiquitous peaks as opposed to peaks specific to another cell type.
To quantitatively compare the motif enrichment results obtained by these different methods, we again turned to RNA-seq data (Fig. 1B). Briefly, we correlated the up-regulation of TF families with the enrichment of their corresponding motifs in the various input sets, backgrounds, and software programs used (Fig. 2E; Supplemental Fig. S6). By using these correlation values as our metric, MEDEA outperformed all the other methods (Fig. 2F), thus confirming the overall improvement of motif enrichment obtained after an accurate filtering of accessibility peaks for cell-type specificity. We further validated that these correlation values were robust to the number of input peaks. Although the RNA-seq correlation for the unfiltered DNase-seq peaks slightly improved upon inclusion of more peaks, MEDEA is already correlated better with the top 500 peaks (Supplemental Fig. S7).
MEDEA selects for active regulatory regions and correlates with the recruitment of lineage specifiers
The recruitment of lineage-specific TFs in regulatory regions is often associated with the displacement of occluding nucleosomes and the deposition of active histone marks in the surrounding nucleosomes (Ghisletti et al. 2010; Heinz et al. 2010). Therefore, we examined the colocalization of accessibility peaks with ChIP-seq peaks for both histone marks H3K4me1, which has been associated with enhancers, and H3K27ac, which marks active enhancers (Fig. 3A, top), as well as the coactivator EP300 (Supplemental Fig. S8), which is also a mark of active enhancers (Calo and Wysocka 2013). These ChIP-seq peaks showed significantly higher overlap with the MEDEA-filtered DNase-seq peaks than with the unfiltered DNase-seq peaks. Concomitantly, we noticed that MEDEA-filtered peaks were depleted of CTCF (Fig. 3A, bottom) and other housekeeping chromatin binders (e.g., ZNF143, SIN3A, SP1, POLR2A, TAF1) (Supplemental Fig. S8). Altogether, these results indicate that MEDEA improves the detection of lineage-specific regulatory motifs by filtering for accessible regions that are associated to cell-type-specific active enhancers and dismissing peaks associated to common chromatin binders.
Figure 3.

MEDEA filtering selects accessible peaks associated with active enhancers and TF binding. (A) Percentages of either the unfiltered DNase-seq peaks (purple bars; from Fig. 1A) or the MEDEA-filtered DNase-seq peaks (pink bars; mean and SD in each MEDEA-filtered series is presented; from Fig. 2B) that overlap ChIP-seq peaks for the indicated chromatin marks (top) or CTCF (bottom) in the indicated cell types. Asterisks indicate where the overlap percentages for the MEDEA-filtered peaks are significantly different (P < 0.01) from those of the unfiltered peaks (red stars indicate higher; black stars, lower). (B) The fold-change between the percentage of MEDEA-filtered peaks and unfiltered DNase-seq peaks that overlap DNase-seq footprints (DFPs) of the indicated TF. ChIP-seq-validated footprints were obtained from the HINT algorithm (Li et al. 2019). TFs were ordered according to fold-change of DFP overlap upon MEDEA filtering (red labels highlight TFs with mean fold-change > 2).
To further corroborate that MEDEA-filtered peaks are enriched for regulatory regions recognized by cell-type-specific TFs, we inspected TF footprint data (DFPs). Briefly, for three of our benchmark cell lines (GM12878, K562, and H1-hES), we first identified a high-confidence set of DFPs that contained TF motifs supported by ChIP-seq data for the corresponding TFs (Li et al. 2019). Next, we evaluated these high-confidence DFPs for colocalization with both the MEDEA-filtered peaks and the unfiltered DNase-seq peaks, and we determined their fold-change (Fig. 3B). The TFs whose DFPs were more colocalized with MEDEA-filtered peaks were often associated to known lineage specifiers, such as POU5F1 in H1-hES, IRF4 and SPI1 in GM12878 (Wang et al. 2012), and GATA1 and TAL1 in K562 (Wadman et al. 1997). These results, which are in strong agreement with the enriched motifs detected by MEDEA AUROC (Fig. 2B), further indicate that MEDEA filtering selects accessible regions that regulate cell identity. This analysis also suggested a previously unappreciated pivotal role for TCF12 in embryonic stem cells, MEF2A and JUND in GM12878 B cells, and NR2F2 and JUND in K562 erythroleukemia cells. We evaluated these predictions by checking for the enrichment of these candidate motifs in their associated TF ChIP-seq peaks in factorbook (Wang et al. 2012). Analysis of ChIP-seq data for those TFs (TCF12, MEF2A, NR2F2, and JUND) showed significant enrichment and centering within the ChIP-seq peaks for their cognate motifs and for the motifs of lineage specifiers (POU5F1, GATA1, TAL1, IRF4, SPI1) in those cell lines (Supplemental Fig. S9), suggesting that the ChIPed TFs bind directly to DNA with cobinding of these lineage specifiers. Altogether, these results support the claim that MEDEA analysis of chromatin accessibility data can highlight lineage specifier motifs.
MEDEA analysis across 610 ENCODE DNase-seq data sets reveals known and novel regulatory interactions underlying lineage specification
To show the potential of MEDEA to reveal novel biological features, we applied MEDEA to more cell types represented in ENCODE. At first, we focused on the transition from ESCs through hematopoietic progenitors (HPs) to a variety of well-characterized committed lineages (B, Th1, Th2, and NK cells) (Supplemental Fig. S10A; Supplemental Table S1.3; Stergachis et al. 2013). We applied MEDEA with its default settings (i.e., filtering against a panel of 12 reference ENCODE-DREAM data sets and using median AUROC for scoring) to evaluate the enrichment of motifs for several well-characterized regulators of these cell types (e.g., EBF1, RUNX, NFIL3) (Zhu and Paul 2008; Kamizono et al. 2009; Ramírez et al. 2010). Similar to our previous results (Fig. 2B), MEDEA prevented the constitutive enrichment of certain motifs (e.g., KLF, ETS, NANOG) and revealed enriched motif signatures specific to each cell type, associated to the expected regulators (e.g., TCF3 and SPI1 in B cells [Ramírez et al. 2010] and NFIL3 in NK cells [Kamizono et al. 2009]) (Supplemental Fig. S10B,C).
To further expand MEDEA analysis to predict novel regulators in less-characterized cell types, we extended our analysis to 610 ENCODE DNase-seq data sets, comprising 188 cell types (Supplemental Table S1.2). To encompass the known repertoire of human TF binding motifs, we equipped the MEDEA suite with a curated collection of 207 TF specificity models that includes 99 PWMs (Jolma et al. 2013; Hume et al. 2015) and a published k-mer glossary for 108 TF binding specificity models (Mariani et al. 2017). We quantified the motif enrichment of this collection in each DNase-seq data set (i.e., 207 motif models × 610 DNase-seq data sets = 126,270 combinations) by MEDEA AUROC (Fig. 4A, y-axis in left panel; Supplemental Table S3.1). Because we observed large variability of the MEDEA AUROC values across these 126,270 combinations, we used the AUROC values obtained in the same DNase-seq data sets without MEDEA filtering as reference for the nonspecific motif enrichment variability (Fig. 4A, x-axis in left panel; Supplemental Table S3.1). We investigated the potential sources of this large variability to check for potential biases in the motif enrichment analysis. Here, we reasoned that AUROC values can be modulated both by genuine motif enrichment and by biases associated to particular motifs or cell types, such as the systematic enrichment we reported for KLF and ETS (Fig. 1A). We tested for both types of bias by using multivariate analysis of variance (MANOVA) of the AUROC distribution, which grouped the AUROC values by cell type or motif and tested whether the variability between groups was larger than the variability within groups. Although both tests were significant (F-statistic P < 0.001), this analysis revealed that biases owing to motifs were much stronger than biases owing to cell types (FMotifs = 640 vs. FCell Types = 4.2; Supplemental Methods). Therefore, to control for motif-associated biases, we stratified the AUROC values by motifs, which resulted in far less dispersed distributions (Fig. 4, cf. B and D), thus allowing for better discrimination of those DNase-seq data sets that are enriched for a particular motif.
Figure 4.

MEDEA analysis of 610 ENCODE DNA-seq data sets reveals known and novel enriched TF motifs. (A, left) Density distribution of the AUROC values obtained from the 207 TF specificity models (i.e., 99 PWMs and 108 k-mer models) in 610 ENCODE DNase-seq data sets (Supplemental Tables S1, S3). (Center, right) Merging the high (center) or low (right) pools for all the TF specificity models shows how the whole density distribution is formed by these two pools. The “high pool” refers to motif/cell type combinations whose MEDEA AUROC is above the motif's empirically derived threshold. Percentages refer to the motif/cell type combinations distinguished by the depicted AUROC threshold of 0.6 for the unfiltered DNase-seq peaks (black lines). (B) For the indicated specificity models, the subset of AUROC values from A. Each dot corresponds to the AUROC enrichments of the indicated motif in a particular cell type. For the most relevant MEDEA AUROC values, the underlying cell types are indicated. By setting a threshold at ∼3 SD away from the MEDEA AUROC median for each specificity model (green line) (Supplemental Table S3.2, Methods), the subsets were divided into high and low pools (red and blue points, respectively) (Supplemental Table S3.3). (C) A histogram of the 207 threshold values applied to all the motif-based subsets (Supplemental Table S3.2) to call high and low pools. The threshold values are highlighted in the scatterplots of B and of Supplemental Figures S11 and S12B. (D) For the indicated cell types, the subset of AUROC values from A. For the most relevant MEDEA AUROC values, the underlying TF specificity models are indicated. (E) For nine pairs of highly related cell types (Supplemental Methods), the TF specificity model classification in the “high pool” was used to calculate the F1 scores between either matched or unmatched cell types.
The third and final task of the MEDEA suite, MEDEA thresholding, leverages the fact that the motif-stratified AUROC distributions are typically characterized by a small pool of high MEDEA AUROC values (“high pool”) that lie above the bulk of the AUROC values (“low pool”) and are most likely to contain the cell types whose DNase-seq data are enriched for the particular motif (Fig. 4B; Supplemental Fig. S11). To distinguish between these two pools, we determined motif-specific thresholds (“MEDEA thresholds”; Methods) (Fig. 4B, green lines; Supplemental Figs. S11, S12B), which have an average value of 0.55 (±0.03) (Fig. 4C; Supplemental Table S3.2). Certain motifs can show a significant enrichment value even if their MEDEA AUROC is close to 0.5 (typically considered to indicate lack of enrichment).
We reasoned that the incorporation of these thresholds in MEDEA could help in evaluating whether the enrichment of a motif is significant, and thus could potentially reveal biologically relevant cis-regulatory motifs that might be missed by standard analyses. To explore this possibility, we first checked whether the cell types within each motif's high pools were similar to each other, which was often the case. The RFX high pool mostly contained cell types from the neuronal lineage (Fig. 4B, left), confirming previous findings on the essential role of RFX in sensory neuron differentiation (Swoboda et al. 2000). Despite the fact that the NF-kB and NFAT motifs are associated to two related families of Rel Homology Domain (RHD) TFs mostly known for their roles in B- and T-cell activation (Müller and Rao 2010; Siggers et al. 2012), the NF-kB high pool contained just lymphoid cells, as expected (Fig. 4B, center), whereas the NFAT high pool contained mostly muscle and a few endothelial cell types, in agreement with prior studies (Fig. 4B, right; Horsley and Pavlath 2002). Similarly, many other high pools were enriched for specific lineages (Supplemental Fig. S11), both confirming well-characterized regulatory functions (e.g., EBF1 in B cells [Boller et al. 2016], MEF2 TFs in the heart [Lin et al. 1997], HNF1 and HNF4 in kidney and intestinal tissues [Ryffel 2001], LIM TFs in the eye [Porter et al. 1997], TCF7 in immune cells [Wu et al. 2012], and TAL bHLH TFs such as ATONAL, NEURO TFs and OLIG TFs in the brain [Imayoshi and Kageyama 2014]) and supporting less-characterized ones (e.g., EBF1 in in vitro differentiated bipolar neurons [Garel et al. 1999], LIM TFs in neuroblastoma [Durbin et al. 2018], and KLF in gastrointestinal tissues [Katz et al. 2002]). Altogether, these examples show that the use of motif-specific MEDEA thresholds aids in identifying lineage specifiers.
We also checked for enrichment biases owing to motif similarities. In the case of KLF, its core consensus sequence is contained within the CTCF motif (Supplemental Fig. S12A); therefore, the constitutive enrichment of the KLF motif observed in unfiltered peaks (Fig. 1A) could come from constitutive open regions encompassing CTCF TFBSs (Fig. 1C). When we compared KLF and CTCF AUROC values across the 610 ENCODE data sets, we indeed noticed that the CTCF motif had a far less pronounced enrichment compared with the KLF motif (Supplemental Fig. S12B), despite a strong correlation both before and upon MEDEA filtering (Supplemental Fig. S12C). MEDEA decreases KLF motif enrichment substantially (Supplemental Fig. S12C, dashed line), likely because of the removal of CTCF TFBSs (Fig. 3A, bottom). Overall, these observations agree with our hypothesis that KLF motif enrichment is in part contaminated by overlapping CTCF motifs, but such bias is mitigated by MEDEA filtering.
The vast majority of the high pool enriched motifs would not have been discovered without MEDEA filtering of the DNase-seq peaks (Fig. 4B, x-axis). At an AUROC threshold of 0.6 across all motifs, the use of unfiltered DNase-seq peaks would have (1) missed 6352 (∼87%) of the high pool cases from being identified as enriched (Fig. 4A, center), and (2) misidentified 3445 (∼3%) of the low pool cases as enriched (Fig. 4A, right). Thus, accurate prefiltering of cell-type-specific accessible regions profoundly changed the identification of enriched motifs, which mostly agreed with prior reports on the regulatory roles of the corresponding TFs.
Clustering of motif enrichment data from MEDEA reveals novel regulatory principles underlying lineage specification
To explore how MEDEA will impact the inference of motif enrichment for single data sets submitted by users, we rearranged all the AUROC low and high pools according to cell type (Fig. 4D; Supplemental Fig. S13). To evaluate the accuracy of the enriched motifs, we selected nine matched pairs of similar cell types (e.g., “right lung” vs. “left lung” cells; Supplemental Methods) that we expected to share similar motif enrichment patterns. We found that the correlation between matched samples was much greater than that between dissimilar cell types (P-value << 0.01, Wilcoxon test) (Fig. 4E), thus confirming that MEDEA captures biologically relevant features of transcriptional regulatory programs. Inspection of the motif enrichment results confirms the accuracy of the MEDEA results (Fig. 4D; Supplemental Fig. S13). As examples, in spinal cord cells (Fig. 4D, left), MEDEA identified motifs that correspond to TFs known to play roles in neuronal differentiation (e.g., NFIX [Deneen et al. 2006], OLIG [Takebayashi et al. 2002], YY1 [He et al. 2007]), whereas SOX (Stolt et al. 2002) was the only motif shared with neuronal stem progenitor and pluripotent cells (e.g., NT2 D1) (Supplemental Fig. S13). As another example, MEDEA not only identified the expected RUNX/ETS motifs in T cells (Fig. 4D, center) but also revealed the relevant TCF7/NF-kB motifs despite their low MEDEA AUROC values, highlighting the power of MEDEA thresholding (Fig. 4C). In forelimb muscle cells (Fig. 4D, right), MEDEA highlighted both the known regulator NFIX (Messina et al. 2010) and also the NFAT, MYF, ZBTB18, and TAL/E2A/TCF3 motifs, whose roles in this cell type are less characterized but are partially shared with related tissues (e.g., “tongue” in Supplemental Fig. S13). In yet more cell types, MEDEA uncovered enriched motifs that confirmed well-characterized regulatory interactions (e.g., GATA/MEF2 TFs in cardiac tissues, LHX and other homeodomain factors in retinal development, GATA TFs in adrenal tissues), reinforced less characterized ones (e.g., estrogen receptor and Jun factors in adrenal tissues), and distinguished motifs between cell types from the same lineage (e.g., islet precursor and body of pancreas cells within the pancreatic lineage) (Supplemental Fig. S13).
To investigate how motif enrichment patterns reflect regulatory programs, we clustered the MEDEA AUROC values of the high pools by TF motifs and by cell types (Fig. 5; Supplemental Fig. S14; Supplemental Table S3.3). Cell types largely clustered according to their lineage class (Fig. 5, colored bars at the top), supporting the claim that the MEDEA AUROC values capture genuine features of cell fate specification. For example, the enriched motifs found in DNase-seq data from placenta and trophoblast cells clustered together tightly (Fig. 5). The GCM1 and AP2 motifs were enriched very specifically in this small cluster, in agreement with previous observations that GCM1 is involved in placental growth factor expression in human trophoblast-derived cells (Li and Roberson 2017) and TCFAP2C establishes the extraembryonic trophoblast maintenance program in murine embryos (Kuckenberg et al. 2010). The GRHL1 motif also shows enrichment in these two tissues, and its paralog GRHL2 (which recognizes a similar motif) is specifically expressed in the placenta, where it controls trophoblast branching morphogenesis in mice (Walentin et al. 2015).
Figure 5.
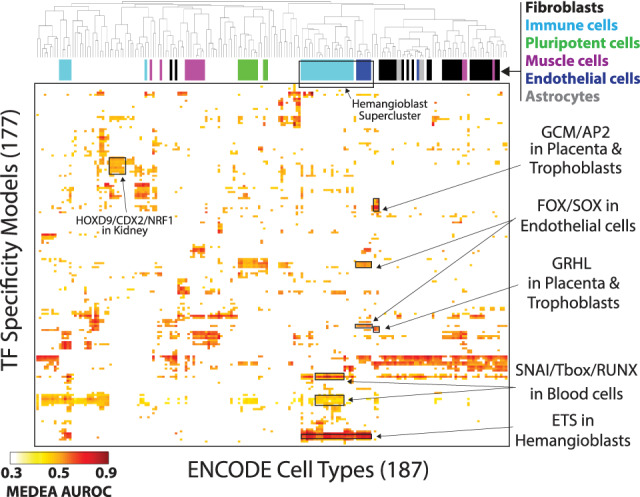
Clustering analysis of MEDEA enriched motifs in ENCODE data sets reveals the TF regulatory patterns behind cellular differentiation. 2D-hierarchical clustering of the MEDEA AUROC values for the high pool (Fig. 4A, center). Black frames within the heatmap outline examples of enriched motifs within the indicated phenotypes. Colored bars to the top of the heatmap show how six representative cell type classes (top right) are distributed upon clustering.
The compact clusters comprising the majority of tested hematopoietic cell samples (light blue bars in Fig. 5) and the majority of tested endothelial samples (dark blue) formed a supercluster (“hemangioblast supercluster”), potentially reflecting the embryonic derivation of both cell types from a common hemangioblast precursor. Motifs for FLI1 and other ETS domain TFs were strongly enriched throughout the supercluster, as expected because FLI1 is a known regulator of both hematopoiesis and angiogenesis in humans and other vertebrates (Smeets et al. 2013; Toyama et al. 2017; Wang et al. 2018). In contrast, motifs for SOX and FOX TFs were preferentially enriched in the endothelial cell cluster whereas the RUNX motif showed strong enrichment in blood but not endothelial cells, supporting results from a prior study that found differential expression of SOX and FOXC genes in hemangioblast-like cells and RUNX1 in the committed hematopoietic cells sorted from human-derived embryoid bodies (Garcia-Alegria et al. 2018). The hematopoietic cluster also showed preferential enrichment of SNAI motifs, potentially reflecting the well-characterized involvement of SNAI1 in epithelial-to-mesenchymal transitions, including the development of blood cell precursors from hemogenic endothelium (Goossens and Haigh 2012).
We observed a cluster containing most of the kidney-derived samples (Fig. 5), which showed enrichment for several very similar HOX motifs (e.g., HOXD9, CDX2), consistent with the known roles of these factors in kidney development. Hoxd9/Hoxd10 knockout mice show a severe reduction in kidney size (de la Cruz et al. 1999), and a CDX2-Cre construct drives expression in kidney (Reyes-Fernandez and Fleet 2016). This kidney cluster also showed enrichment of the motif for the metabolic regulator NRF1, which has been shown to be expressed at lower levels in clinical samples from chronic kidney disease (CKD) patients undergoing dialysis than in healthy controls (Zaza et al. 2013; Hashad et al. 2016). This observation was previously interpreted as evidence of a homeostatic response to oxidative stress secondary to dialysis; however, our results suggest the alternative possibility that lower levels of NRF1 expression may predispose people to the development of CKD. Consistent with this hypothesis, a study combining CKD GWAS with analysis of eQTLs in healthy kidney samples found that kidney eQTLs are significantly enriched in NRF1 binding sites described by ENCODE (Ko et al. 2017). Collectively these various examples show how MEDEA analysis of accessibility profiles can suggest hypotheses of clinically relevant regulatory interactions.
MEDEA can be applied to data from other chromatin accessibility profiling technologies
Next, we investigated whether application of MEDEA, without any modifications, can identify TF motif enrichment in data obtained from other types of genome-wide chromatin accessibility assays. For several of the ENCODE cell lines that we used to benchmark MEDEA, data sets obtained by ATAC-seq, scATAC-seq, or FAIRE-seq were publicly available. Motif enrichment analysis of those data sets without MEDEA filtering confirmed several results that we had obtained when analyzing the corresponding unfiltered DNase-seq peaks, such as a lack of strong enrichment for the POU motif in embryonic stem cells, the IRF motif in GM12878 cells, and the GATA motif in K562 cells (cf. Fig. 6A and Fig. 1A). We then used MEDEA filtering (i.e., the default 12 ENCODE-DREAM DNase-seq data sets) and MEDEA AUROC, which revealed the enrichment of several motifs (Fig. 6B), such as the ones mentioned above and also of pluripotency/embryonic factors (SOX, KLF, ZIC, TEA, and FOX) in hES cells.
Figure 6.

Generalization of MEDEA to other types of chromatin accessibility assays. (A,B) For the peaks obtained with the indicated chromatin accessibility assays in indicated cell lines, the AUROC enrichment of the 13 benchmarking motifs evaluated by using either (A) AUROC with GENRE background or (B) MEDEA. MEDEA-filtered peaks were obtained by contrasting the peaks in the indicated assays with the default panel of 12 ENCODE-DREAM DNase-seq data sets. Black boxes as in Figure 1A and Figure 2, B through D. (C) For the bulk ATAC-seq data sets, scatterplot to correlate the MEDEA AUROC (top panel in B) with the associated transcriptomic up-regulation (y-axis values from Fig. 1B). (D) Barplot to compare the correlation coefficients (Pearson's R) between TF up-regulation and motif enrichment obtained with the different assays, either by using (1) AUROC with GENRE background (purple bars) or (2) MEDEA AUROC (pink bars). For additional scatterplots depicting correlations for other assay/method combinations, see also Supplemental Figure S15.
Similar to our previous comparisons (Fig. 2E,F), we evaluated the AUROC motif enrichment of TFs by their correlation with the corresponding transcriptomic up-regulation from RNA-seq data (Fig. 6C; Supplemental Fig. S15). For all assays, we observed that this correlation was higher with MEDEA peaks than with unfiltered peaks (Fig. 6D, pink vs. purple bars), indicating that MEDEA improves motif enrichment analysis of accessibility data obtained from multiple different chromatin accessibility profiling technologies.
Discussion
MEDEA is a computational suite created to identify the motifs of lineage-specifying TFs that are enriched within the accessible chromatin regions in any cell type. To achieve this goal, MEDEA performs three main tasks: (1) filtering the accessible regions to identify relevant, cell-type-specific peaks; (2) assessing the filtered, accessible regions for enrichment of a large collection of human TF binding motifs; (3) imposing motif-specific thresholds on enrichment to identify lineage specifiers. To validate MEDEA, here we compared results from analysis of DNase-seq (Figs. 1, 2) and ATAC-seq (Fig. 6) data against RNA-seq and ChIP-seq data (Fig. 3) and characterized lineage specifier motifs solely by their enrichment in chromatin accessibility profiles (Figs. 4, 5).
The need for motif enrichment tools specifically designed for analysis of chromatin accessibility data as opposed to TF ChIP-seq data is a problem that previously had not been addressed sufficiently. In TF ChIP-seq data, for a TF that binds DNA directly through its own DNA binding domain, its cognate motif is typically anticipated to be enriched and centered within the ChIP-seq peaks. In contrast, there is no expectation of motif centering within chromatin accessibility peaks, which merge the influence of nucleosome organization and the many TFs active in a given cell type. Although these aspects challenge the identification of the most relevant TF binding motifs in a given cell type, chromatin accessibility assays, in principle, allow a much broader exploration of potential cis-regulatory motifs within a cell type. Thus, because multiple lineage-specific TFs may be active in any one cell type (Fig. 4D,E), it is not surprising that their corresponding motifs may show relatively low (0.55 on average) (Fig. 4C) enrichment scores (MEDEA AUROC values) in a particular cell type's chromatin accessibility data set (Fig. 4D).
Our finding that MEDEA filtering selects for regulatory regions without requiring any additional information on other epigenetic features (e.g., histone marks, TF binding) supports a recent study of murine tissue-specific enhancers (Fu et al. 2018) in which detection of active enhancers was improved by restricting to DNase-seq or H3K27ac ChIP-seq peaks that differed between phenotypically distant tissues. Although the incorporation of additional epigenomic information (e.g., ChIP-seq profiles of binding factors or histone marks) could potentially improve the power of MEDEA in identifying enriched motifs associated with regulatory elements, MEDEA requires only chromatin accessibility data; moreover in many research and clinical applications, it may be too costly or tissue samples may be too limiting to be able to generate additional epigenomic data sets (e.g., TF ChIP-seq).
MEDEA outperformed other state-of-the-art tools, as evaluated by the correlation of motif enrichment in open chromatin with the up-regulation of the cognate TFs. Two features of MEDEA are likely major contributors to its improved performance. First, instead of constructing the background for the motif enrichment analysis from genomic regions open in other cell types (as in AME with user-supplied background) or from regions open across cell types (as in coTRaCTE), for any particular cell type, MEDEA identifies chromatin accessibility peaks specific to that cell type compared individually with a panel of reference cell types before any enrichment analysis is performed. Second, MEDEA performs motif enrichment analysis using compositionally matched genomic regions as background sequences. Incorporation of either or both of these approaches might improve the performance of other tools used for analysis of chromatin accessibility data.
MEDEA is also the only available tool equipped with a highly curated reference chromatin accessibility data set; this reference panel is essential for its robustness, flexibility, and reproducibility, as well as for its integration with other tools such as SeqUnwinder. Because SeqUnwinder requires prelabeled open regions to determine cell-type-specific enriched motifs, MEDEA filtering can be used to generate such labels by categorizing open regions according to their specific presence in MEDEA reference sets. As SeqUnwinder identifies de novo motifs using MEME, it would be interesting to compare those motifs with the known motifs found enriched within the MEDEA collection. Overall, MEDEA offers a middle ground among the other methods: It takes user-defined peaks and defines cell-type-specific labels itself and independently from other data sets.
MEDEA analyzes chromatin accessibility peaks to quickly provide a genome-wide characterization of overrepresented motifs, allowing users to infer the lineage-specifying TFs that may be particularly important for gene regulatory programs in a given cell type. MEDEA is an orthogonal approach to the identification of DFP, which requires higher read coverage compared with standard peak calling in order to identify specific sites of TF occupancy within chromatin accessibility data (Tsompana and Buck 2014). The bias observed in DFP calls against TFs with short residence times on DNA (Sung et al. 2014) does not apply to the data used by MEDEA, as long as the regions containing such a TF's binding sites remain accessible when the TF is transiently released. In contrast to DFP algorithms, which limit the analysis to single accessibility profiles (Gusmao et al. 2016) or to time series data across cellular differentiation (Sherwood et al. 2014), MEDEA is empowered by integrating data from a wide reference panel of cell types to identify genomic regions that are accessible in a cell-type-specific manner.
By using highly curated chromatin accessibility data (e.g., DNase-seq data from ENCODE-DREAM), we showed that MEDEA can filter cell-type-specific peaks obtained from ATAC-seq, scATAC-seq, or FAIRE-seq. This ability to integrate information from different chromatin accessibility assays is crucial, as it obviates the need to generate additional assay-specific reference panel data sets for each new technology that may be developed in the future for profiling accessible regions of the genome. Indeed, MEDEA may serve as a useful computational validation tool to assess the quality of chromatin accessibility data resulting from novel assays.
Methods
Public data accession and preprocessing
All analyzed data used in this study were previously published and their file accessions are provided in Supplemental Table S1. We used replicate data sets when available. Data were downloaded from ENCODE, ENCODE-DREAM (http://dreamchallenges.org/project/encode-dream-in-vivo-transcription-factor-binding-site-prediction-challenge/), and the NCBI Gene Expression Omnibus (GEO). We omitted data sets from ENCODE that had red flags or multiple yellow flags indicating concerns about data quality. For DNase-seq and ATAC-seq data sets, we considered just 150-bp peaks that were present in both replicates according to a reciprocal overlap of 50% (command “intersectBed” in BEDTools) (Neph et al. 2012a). The overlapping peaks were merged, trimmed at 150 bp, and assigned an average signal intensity value. For scATAC-seq data sets, we considered single replicate count matrices of the top 50,000 peaks, we ranked the peaks by the percentage of associated cells, and we trimmed the peaks to 150 bp. FAIRE-seq data were already merged, so we only trimmed to 150 bp. For ChIP-seq data, we collected all the ENCODE data sets specific to the 12 benchmarking cell lines as narrowPeaks for a variety of constitutive chromatin binding factors (Fig. 3A, bottom; Supplemental Fig. S8) and as broadPeaks for two histone marks (Fig. 3A, top); they were used without further postprocessing.
For TF DFPs, we used published data for H1-hES, K562, and GM12878 cells (Li et al. 2019). These DFPs were based on DNase-seq data, computed using HINT, and validated by the copresence of ChIP-seq peaks for the associated TFs. The true TF labels per footprint were provided by the Costa laboratory, and we used them without further postprocessing.
For the RNA-seq files, we collected all the ENCODE-DREAM data sets specific to the 12 benchmarking cell lines in TPM format and converted their Gene IDs to gene symbols via GENCODE v19 annotations; they were used without further postprocessing.
See also Supplemental Methods (Public Data Used in this Study and Data Preprocessing) and Supplemental Code.
Motif enrichment
AUROC
Motif enrichment was evaluated by AUROC for the presence of a motif in a foreground set of DNA sequences (e.g., DNase-seq peaks) compared with a background set. Similarly to our previously described method (Mariani et al. 2017), we calculated the AUROC by using the Glossary-GENRE suite with motif representations from both PWMs (Supplemental Table S1.4) and k-mer modules from a published glossary based on PBM data.
AME
We used AME from MEME suite version 5.0.3 (McLeay and Bailey 2010) and the PWM representation of the 13 benchmarking motifs (Supplemental Table S1.4) converted to MEME format. We requested an ‐‐evalue-report-threshold of 20 to ensure all motifs were reported. We used as background both the default dinucleotide shuffled sequences (Supplemental Fig. S5A) or the ENCODE-DREAM pairwise subtraction peak sets through the ‐‐control argument (Supplemental Fig. S5C).
HOMER
We used the program findMotifsGenome.pl from HOMER 4.10.3 (Heinz et al. 2010) and the PWM representations of the 13 benchmarking motifs to analyze the sequences of the top 500 peaks from the benchmarking ENCODE DNase-seq data sets used in Figure 1A (Supplemental Fig. S5B).
coTRaCTE
coTRaCTE scripts were downloaded from GitHub at https://github.molgen.mpg.de/Alena/coTRaCTE. BAM files corresponding to the benchmarking ENCODE DNase-seq peaks used in Figure 1A were downloaded from ENCODE (Supplemental Table S1.1). We adapted the coTRaCTE 200-bp window file to 150 bp for consistency with Figure 1A; read coverage for each BAM file was calculated over these windows using BEDOPS (Neph et al. 2012a) “bam2bed” and “bedmap.” We then used coTRaCTE to (1) determine cell-type-specific and ubiquitous accessible regions, (2) calculate affinity measurements for those sets of sequences with 13 benchmark PWMs (in JASPAR format), (3) evaluate the enrichment of a motif in cell-type-specific versus ubiquitous accessible regions, and (4) use the Benjamini–Hochberg method to correct those P-values for multiple hypothesis testing. For HOMER, AME, and coTRaCTE, the −log10 (P-values) were normalized to the maximum value for display purposes.
For more details on these methods, see Motif Enrichment Analysis in the Supplemental Methods and Supplemental Code.
MEDEA suite
MEDEA filtering
As our DNase-seq reference set, we used relaxed peaks curated by the ENCODE-DREAM Challenge (Supplemental Table S1.1). To pairwise subtract the accessibility peaks of each reference data set from the 12 benchmarking data sets, we used the command subtractBed with the -A option, which furnished the most cell-type-specific peaks of the input sets. Because we did not subtract out the same cell type, each benchmarking data set resulted in a series of 11 MEDEA-filtered peak subsets (Supplemental Fig. S4), which we sorted by signal value to filter for the top 500 peaks for the subsequent MEDEA AUROC analysis. See also MEDEA Filtering: Step 1 of the MEDEA suite in the Supplemental Methods.
MEDEA AUROC
To calculate the motif enrichment statistics of each pairwise comparison between the input data set and the reference sets in the top 500 MEDEA-filtered peaks, MEDEA uses the Glossary-GENRE suite to compute AUROC values, which it aggregates by taking the median (i.e., MEDEA AUROC). The use of the median ensures robustness to outlier values coming from cell types that may be too similar to a cell types in the reference set (Supplemental Fig. S4). See also Motif Enrichment Analysis in the Supplemental Methods.
MEDEA thresholding, high and low pools
To determine the high pools of MEDEA values, we organized the AUROC values from Supplemental Table S3.1 by a TF specificity model (e.g., Fig. 4B). For each model, we computed a threshold for the MEDEA AUROC values through the following iterative steps: (1) evaluation of the MEDEA AUROC median values, (2) quantification of the deviation between the AUROC distribution for the DNase-seq peaks (x-axis in Fig. 4B) and for the MEDEA-filtered peaks (y-axis in Fig. 4B), and (3) setting of a Preliminary MEDEA Threshold at three deviations above the median. We used the Preliminary Threshold to create preliminary high and low pools of cell types (i.e., the preliminary “low pool” contains cell types with MEDEA AUROC values below the Preliminary MEDEA Threshold). We ensured convergence of the method by reiterating the steps (1–3) on the preliminary “low pool” until the difference between two consecutive Preliminary MEDEA Thresholds was less than 0.005. The final Preliminary MEDEA Threshold defined the value of the MEDEA Threshold collected in Supplemental Table S3.2, as well as the high pool collected in Supplemental Table S3.3. See also Analysis of 610 ENCODE DNase-seq Data Sets with MEDEA in the Supplemental Methods and Supplemental Code.
Analysis of TF up-regulation
For each gene in each cell line, transcripts per million (TPM) values were averaged between replicates, and the resulting mean TPM values were used for ranking the genome (TPM Rank in y-axis of Supplemental Fig. S2). Moreover, we assigned to each gene the fold-change between the TPM Rank in that cell type over the median TPM Rank in the other 11 cell types (TPM Rank Fold-Change in x-axis of Supplemental Fig. S2). For the 13 benchmarking TF families, we compiled a corresponding list of member TFs. For each TF family in each cell type, we selected the TF member with the highest TPM Rank Fold-Change to represent its family (Fig. 1B, red points for values above two, see Supplemental Fig. S2). See also RNA-seq Transcript Analysis in the Supplemental Methods.
DNase-seq and MEDEA peak overlap analysis with ChIP-seq and DFP data
For each ChIP-seq or DFP data set, we collected the top 500 unfiltered DNase-seq peaks (as in Fig. 1A) and the series of top 500 MEDEA-filtered peaks (as in Supplemental Fig. S4) in the corresponding cell line and used the BEDTools command “intersectBed” (Quinlan 2014) to measure the percentage of peaks that overlapped with some element of the data set (Fig. 3; Supplemental Fig. S8). For H3K27ac and H3K4me1 ChIP-seq data sets, we ensured the presence of both histone marks by using the intersectBed's option for two -b data sets (one per histone mark). For each MEDEA series, we obtained 11 overlap percentages. For ChIP-seq data, we represented each series as mean and standard deviation (Fig. 3; Supplemental Fig. S8) and bootstrapped its values to evaluate whether it differed significantly from the percentage obtained by using unfiltered DNase-seq peaks. For DFPs, we quantified the log2 fold-change of their overlap in the MEDEA series versus unfiltered DNase-seq peaks. To avoid large fluctuations owing to low values of DFP overlap with peaks, we added a pseudocount of 10 peaks to both terms. See also DNase-seq and MEDEA Peak Overlap Analysis with ChIP-seq and DFP data in the Supplemental Methods and Supplemental Code.
Clustering analysis
We merged all the high pools obtained by applying the MEDEA thresholds (Supplemental Table S3.2) to the MEDEA AUROC data from Supplemental Table S3.1 (Supplemental Table S3.3). For the low pools, we adjusted all the MEDEA AUROC values to the same “nonenrichment” value of 0.3 and eliminated 29 specificity models and one cell type (“uterus”) that were entirely contained in the low pool. By combining the high pools and the adjusted low pools, we obtained a 2D distribution of adjusted MEDEA AUROC values for 177 specificity models and 187 cell types. We independently clustered this distribution by specificity models (Supplemental Fig. S14, columns) and cell types (Supplemental Fig. S14, rows) by using Pearson's correlations as distance and hierarchical agglomerative complete-linkage as ordering method (“hclust” function in R) (R Core Team 2018). See also Supplemental Code.
Software availability
The scripts developed to implement analyses described here are provided as Supplemental Code. MEDEA software can be found on the Bulyk laboratory GitHub website (https://github.com/BulykLab/MEDEA). We have integrated MEDEA into our publicly available Glossary-GENRE suite for motif enrichment analysis (Mariani et al. 2017). MEDEA can be run either by using the ENCODE-DREAM DNase-seq data as the included default reference panel or by providing user-defined reference data sets.
Competing interest statement
The authors declare no competing interests.
Supplementary Material
Acknowledgments
This project was supported by National Institutes of Health (NIH) grant R21 HG009268 to M.L.B. K.W. was supported in part by the NIH Bioinformatics and Integrative Genomics training grant T32 HG002295. We thank Anshul Kundaje (Stanford University), the ENCODE-DREAM Challenge Organizers, and the following ENCODE data production centers (Snyder laboratory, Myers laboratory, Stamatoyannopoulos laboratory) for the production of the ENCODE-DREAM DNase-seq data sets that we used as our reference sets as well as the RNA-seq data we used as part of our validation. We thank Sai Ma and Jason Buenrostro (Harvard University), who performed narrowPeak calling on previously published ATAC-seq data in GM12878 cells (Buenrostro et al. 2013) and provided counts matrices for previously published scATAC-seq data (Buenrostro et al. 2015). We thank Zhijian Li and Ivan Costa (RWTH University Hospital) for providing HINT DFP data with TF ChIP-seq support categorized by TF, especially for the extra TFs we asked for in addition to those previously published. We thank Alena van Bömmel and Martin Vingron (Max Planck Institute) for help with coTRaCTE. We thank the members of the Bulyk laboratory for discussions and suggestions. We share copyrights for the TF-8mer glossary and GENRE background construction software that is used by MEDEA for motif enrichment analysis.
Author contributions: L.M. designed the study; K.W. and L.M. performed data analysis; K.W. and L.M. developed the MEDEA software; K.W. and S.S.G. benchmarked the software; L.M. and M.L.B. supervised research; and L.M., K.W., S.S.G., and M.L.B. interpreted the data and wrote the manuscript. All the authors have approved the submitted version and have agreed to be personally accountable both for their own contributions and for the accuracy or integrity of any part of the study.
Footnotes
[Supplemental material is available for this article.]
Article published online before print. Article, supplemental material, and publication date are at http://www.genome.org/cgi/doi/10.1101/gr.260877.120.
References
- Augello MA, Hickey TE, Knudsen KE. 2011. FOXA1: master of steroid receptor function in cancer. EMBO J 30: 3885–3894. 10.1038/emboj.2011.340 [DOI] [PMC free article] [PubMed] [Google Scholar]
- Boller S, Ramamoorthy S, Akbas D, Nechanitzky R, Burger L, Murr R, Schübeler D, Grosschedl R. 2016. Pioneering activity of the C-terminal domain of EBF1 shapes the chromatin landscape for B cell programming. Immunity 44: 527–541. 10.1016/j.immuni.2016.02.021 [DOI] [PubMed] [Google Scholar]
- Boyle AP, Song L, Lee BK, London D, Keefe D, Birney E, Iyer VR, Crawford GE, Furey TS. 2011. High-resolution genome-wide in vivo footprinting of diverse transcription factors in human cells. Genome Res 21: 456–464. 10.1101/gr.112656.110 [DOI] [PMC free article] [PubMed] [Google Scholar]
- Buenrostro JD, Giresi PG, Zaba LC, Chang HY, Greenleaf WJ. 2013. Transposition of native chromatin for fast and sensitive epigenomic profiling of open chromatin, DNA-binding proteins and nucleosome position. Nat Methods 10: 1213–1218. 10.1038/nmeth.2688 [DOI] [PMC free article] [PubMed] [Google Scholar]
- Buenrostro JD, Wu B, Litzenburger UM, Ruff D, Gonzales ML, Snyder MP, Chang HY, Greenleaf WJ. 2015. Single-cell chromatin accessibility reveals principles of regulatory variation. Nature 523: 486–490. 10.1038/nature14590 [DOI] [PMC free article] [PubMed] [Google Scholar]
- Calo E, Wysocka J. 2013. Modification of enhancer chromatin: what, how, and why? Mol Cell 49: 825–837. 10.1016/j.molcel.2013.01.038 [DOI] [PMC free article] [PubMed] [Google Scholar]
- Cantor AB, Orkin SH. 2002. Transcriptional regulation of erythropoiesis: an affair involving multiple partners. Oncogene 21: 3368–3376. 10.1038/sj.onc.1205326 [DOI] [PubMed] [Google Scholar]
- Corces MR, Granja JM, Shams S, Louie BH, Seoane JA, Zhou W, Silva TC, Groeneveld C, Wong CK, Cho SW, et al. 2018. The chromatin accessibility landscape of primary human cancers. Science 362: eaav1898 10.1126/science.aav1898 [DOI] [PMC free article] [PubMed] [Google Scholar]
- Cui K, Zhao K. 2012. Genome-wide approaches to determining nucleosome occupancy in metazoans using MNase-Seq. Methods Mol Biol 833: 413–419. 10.1007/978-1-61779-477-3_24 [DOI] [PMC free article] [PubMed] [Google Scholar]
- de la Cruz CC, Der-Avakian A, Spyropoulos DD, Tieu DD, Carpenter EM. 1999. Targeted disruption of Hoxd9 and Hoxd10 alters locomotor behavior, vertebral identity, and peripheral nervous system development. Dev Biol 216: 595–610. 10.1006/dbio.1999.9528 [DOI] [PubMed] [Google Scholar]
- Deneen B, Ho R, Lukaszewicz A, Hochstim CJ, Gronostajski RM, Anderson DJ. 2006. The transcription factor NFIA controls the onset of gliogenesis in the developing spinal cord. Neuron 52: 953–968. 10.1016/j.neuron.2006.11.019 [DOI] [PubMed] [Google Scholar]
- Durbin AD, Zimmerman MW, Dharia NV, Abraham BJ, Iniguez AB, Weichert-Leahey N, He S, Krill-Burger JM, Root DE, Vazquez F, et al. 2018. Selective gene dependencies in MYCN-amplified neuroblastoma include the core transcriptional regulatory circuitry. Nat Genet 50: 1240–1246. 10.1038/s41588-018-0191-z [DOI] [PMC free article] [PubMed] [Google Scholar]
- Eisenberg E, Levanon EY. 2013. Human housekeeping genes, revisited. Trends Genet 29: 569–574. 10.1016/j.tig.2013.05.010 [DOI] [PubMed] [Google Scholar]
- The ENCODE Project Consortium. 2012. An integrated encyclopedia of DNA elements in the human genome. Nature 489: 57–74. 10.1038/nature11247 [DOI] [PMC free article] [PubMed] [Google Scholar]
- Fu S, Wang Q, Moore JE, Purcaro MJ, Pratt HE, Fan K, Gu C, Jiang C, Zhu R, Kundaje A, et al. 2018. Differential analysis of chromatin accessibility and histone modifications for predicting mouse developmental enhancers. Nucleic Acids Res 46: 11184–11201. 10.1093/nar/gky753 [DOI] [PMC free article] [PubMed] [Google Scholar]
- Garcia-Alegria E, Menegatti S, Fadlullah MZH, Menendez P, Lacaud G, Kouskoff V. 2018. Early human hemogenic endothelium generates primitive and definitive hematopoiesis in vitro. Stem Cell Reports 11: 1061–1074. 10.1016/j.stemcr.2018.09.013 [DOI] [PMC free article] [PubMed] [Google Scholar]
- Garel S, Marin F, Grosschedl R, Charnay P. 1999. Ebf1 controls early cell differentiation in the embryonic striatum. Development 126: 5285–5294. [DOI] [PubMed] [Google Scholar]
- Ghisletti S, Barozzi I, Mietton F, Polletti S, De Santa F, Venturini E, Gregory L, Lonie L, Chew A, Wei C-L, et al. 2010. Identification and characterization of enhancers controlling the inflammatory gene expression program in macrophages. Immunity 32: 317–328. 10.1016/j.immuni.2010.02.008 [DOI] [PubMed] [Google Scholar]
- Goode DK, Obier N, Vijayabaskar MS, Lie ALM, Lilly AJ, Hannah R, Lichtinger M, Batta K, Florkowska M, Patel R, et al. 2016. Dynamic gene regulatory networks drive hematopoietic specification and differentiation. Dev Cell 36: 572–587. 10.1016/j.devcel.2016.01.024 [DOI] [PMC free article] [PubMed] [Google Scholar]
- Goossens S, Haigh JJ. 2012. The role of EMT modulators in hematopoiesis and leukemic transformation. In Hematology: science and practice. (ed. Lawrie CH). IntechOpen, London; 10.5772/34816 [DOI] [Google Scholar]
- Gordan R, Hartemink AJ, Bulyk ML. 2009. Distinguishing direct versus indirect transcription factor–DNA interactions. Genome Res 19: 2090–2100. 10.1101/gr.094144.109 [DOI] [PMC free article] [PubMed] [Google Scholar]
- Gusmao EG, Allhoff M, Zenke M, Costa IG. 2016. Analysis of computational footprinting methods for DNase sequencing experiments. Nat Methods 13: 303–309. 10.1038/nmeth.3772 [DOI] [PubMed] [Google Scholar]
- Hashad D, Elgohry I, Dwedar F. 2016. Nuclear respiratory factor-1 (NRF-1) gene expression in chronic kidney disease patients undergoing hemodialysis and mitochondrial oxidative dysregulation. Clin Lab 62: 2149–2154. 10.7754/Clin.Lab.2016.160329 [DOI] [PubMed] [Google Scholar]
- He Y, Dupree J, Wang J, Sandoval J, Li J, Liu H, Shi Y, Nave KA, Casaccia-Bonnefil P. 2007. The transcription factor Yin Yang 1 is essential for oligodendrocyte progenitor differentiation. Neuron 55: 217–230. 10.1016/j.neuron.2007.06.029 [DOI] [PMC free article] [PubMed] [Google Scholar]
- He HH, Meyer CA, Chen MW, Jordan VC, Brown M, Liu XS. 2012. Differential DNase I hypersensitivity reveals factor-dependent chromatin dynamics. Genome Res 22: 1015–1025. 10.1101/gr.133280.111 [DOI] [PMC free article] [PubMed] [Google Scholar]
- He HH, Meyer CA, Hu SS, Chen MW, Zang C, Liu Y, Rao PK, Fei T, Xu H, Long H, et al. 2014. Refined DNase-seq protocol and data analysis reveals intrinsic bias in transcription factor footprint identification. Nat Methods 11: 73–78. 10.1038/nmeth.2762 [DOI] [PMC free article] [PubMed] [Google Scholar]
- Heidari N, Phanstiel DH, He C, Grubert F, Jahanbani F, Kasowski M, Zhang MQ, Snyder MP. 2014. Genome-wide map of regulatory interactions in the human genome. Genome Res 24: 1905–1917. 10.1101/gr.176586.114 [DOI] [PMC free article] [PubMed] [Google Scholar]
- Heinz S, Benner C, Spann N, Bertolino E, Lin YC, Laslo P, Cheng JX, Murre C, Singh H, Glass CK. 2010. Simple combinations of lineage-determining transcription factors prime cis-regulatory elements required for macrophage and B cell identities. Mol Cell 38: 576–589. 10.1016/j.molcel.2010.05.004 [DOI] [PMC free article] [PubMed] [Google Scholar]
- Hesselberth JR, Chen X, Zhang Z, Sabo PJ, Sandstrom R, Reynolds AP, Thurman RE, Neph S, Kuehn MS, Noble WS, et al. 2009. Global mapping of protein-DNA interactions in vivo by digital genomic footprinting. Nat Methods 6: 283–289. 10.1038/nmeth.1313 [DOI] [PMC free article] [PubMed] [Google Scholar]
- Horsley V, Pavlath GK. 2002. NFAT: ubiquitous regulator of cell differentiation and adaptation. J Cell Biol 156: 771–774. 10.1083/jcb.200111073 [DOI] [PMC free article] [PubMed] [Google Scholar]
- Hume MA, Barrera LA, Gisselbrecht SS, Bulyk ML. 2015. UniPROBE, update 2015: new tools and content for the online database of protein-binding microarray data on protein–DNA interactions. Nucleic Acids Res 43: D117–D122. 10.1093/nar/gku1045 [DOI] [PMC free article] [PubMed] [Google Scholar]
- Imayoshi I, Kageyama R. 2014. bHLH factors in self-renewal, multipotency, and fate choice of neural progenitor cells. Neuron 82: 9–23. 10.1016/j.neuron.2014.03.018 [DOI] [PubMed] [Google Scholar]
- John S, Sabo PJ, Canfield TK, Lee K, Vong S, Weaver M, Wang H, Vierstra J, Reynolds AP, Thurman RE, et al. 2013. Genome-scale mapping of DNase I hypersensitivity. Curr Protoc Mol Biol Chapter 27: Unit 21.27 10.1002/0471142727.mb2127s103 [DOI] [PMC free article] [PubMed] [Google Scholar]
- Jolma A, Yan J, Whitington T, Toivonen J, Nitta KR, Rastas P, Morgunova E, Enge M, Taipale M, Wei G, et al. 2013. DNA-binding specificities of human transcription factors. Cell 152: 327–339. 10.1016/j.cell.2012.12.009 [DOI] [PubMed] [Google Scholar]
- Kakumanu A, Velasco S, Mazzoni E, Mahony S. 2017. Deconvolving sequence features that discriminate between overlapping regulatory annotations. PLoS Comput Biol 13: e1005795 10.1371/journal.pcbi.1005795 [DOI] [PMC free article] [PubMed] [Google Scholar]
- Kamizono S, Duncan GS, Seidel MG, Morimoto A, Hamada K, Grosveld G, Akashi K, Lind EF, Haight JP, Ohashi PS, et al. 2009. Nfil3/E4bp4 is required for the development and maturation of NK cells in vivo. J Exp Med 206: 2977–2986. 10.1084/jem.20092176 [DOI] [PMC free article] [PubMed] [Google Scholar]
- Katz JP, Perreault N, Goldstein BG, Lee CS, Labosky PA, Yang VW, Kaestner KH. 2002. The zinc-finger transcription factor Klf4 is required for terminal differentiation of goblet cells in the colon. Development 129: 2619–2628. [DOI] [PMC free article] [PubMed] [Google Scholar]
- Ko YA, Yi H, Qiu C, Huang S, Park J, Ledo N, Kottgen A, Li H, Rader DJ, Pack MA, et al. 2017. Genetic-variation-driven gene-expression changes highlight genes with important functions for kidney disease. Am J Hum Genet 100: 940–953. 10.1016/j.ajhg.2017.05.004 [DOI] [PMC free article] [PubMed] [Google Scholar]
- Kuckenberg P, Buhl S, Woynecki T, van Fürden B, Tolkunova E, Seiffe F, Moser M, Tomilin A, Winterhager E, Schorle H. 2010. The transcription factor TCFAP2C/AP-2γ cooperates with CDX2 to maintain trophectoderm formation. Mol Cell Biol 30: 3310–3320. 10.1128/MCB.01215-09 [DOI] [PMC free article] [PubMed] [Google Scholar]
- Lambert SA, Jolma A, Campitelli LF, Das PK, Yin Y, Albu M, Chen X, Taipale J, Hughes TR, Weirauch MT. 2018. The human transcription factors. Cell 175: 598–599. 10.1016/j.cell.2018.09.045 [DOI] [PubMed] [Google Scholar]
- Li S, Roberson MS. 2017. Dlx3 and GCM-1 functionally coordinate the regulation of placental growth factor in human trophoblast-derived cells. J Cell Physiol 232: 2900–2914. 10.1002/jcp.25752 [DOI] [PubMed] [Google Scholar]
- Li Z, Schulz MH, Look T, Begemann M, Zenke M, Costa IG. 2019. Identification of transcription factor binding sites using ATAC-seq. Genome Biol 20: 45 10.1186/s13059-019-1642-2 [DOI] [PMC free article] [PubMed] [Google Scholar]
- Lin Q, Schwarz J, Bucana C, Olson EN. 1997. Control of mouse cardiac morphogenesis and myogenesis by transcription factor MEF2C. Science 276: 1404–1407. 10.1126/science.276.5317.1404 [DOI] [PMC free article] [PubMed] [Google Scholar]
- Lu R. 2008. Interferon regulatory factor 4 and 8 in B-cell development. Trends Immunol 29: 487–492. 10.1016/j.it.2008.07.006 [DOI] [PMC free article] [PubMed] [Google Scholar]
- Luo Z, Gao X, Lin C, Smith ER, Marshall SA, Swanson SK, Florens L, Washburn MP, Shilatifard A. 2015. Zic2 is an enhancer-binding factor required for embryonic stem cell specification. Mol Cell 57: 685–694. 10.1016/j.molcel.2015.01.007 [DOI] [PMC free article] [PubMed] [Google Scholar]
- Mariani L, Weinand K, Vedenko A, Barrera LA, Bulyk ML. 2017. Identification of human lineage-specific transcriptional coregulators enabled by a glossary of binding modules and tunable genomic backgrounds. Cell Syst 5: 654 10.1016/j.cels.2017.12.011 [DOI] [PMC free article] [PubMed] [Google Scholar]
- McConnell BB, Yang VW. 2010. Mammalian Krüppel-like factors in health and diseases. Physiol Rev 90: 1337–1381. 10.1152/physrev.00058.2009 [DOI] [PMC free article] [PubMed] [Google Scholar]
- McLeay RC, Bailey TL. 2010. Motif enrichment analysis: a unified framework and an evaluation on ChIP data. BMC Bioinformatics 11: 165 10.1186/1471-2105-11-165 [DOI] [PMC free article] [PubMed] [Google Scholar]
- Messina G, Biressi S, Monteverde S, Magli A, Cassano M, Perani L, Roncaglia E, Tagliafico E, Starnes L, Campbell CE, et al. 2010. Nfix regulates fetal-specific transcription in developing skeletal muscle. Cell 140: 554–566. 10.1016/j.cell.2010.01.027 [DOI] [PubMed] [Google Scholar]
- Müller MR, Rao A. 2010. NFAT, immunity and cancer: a transcription factor comes of age. Nat Rev Immunol 10: 645–656. 10.1038/nri2818 [DOI] [PubMed] [Google Scholar]
- Nagy PL, Cleary ML, Brown PO, Lieb JD. 2003. Genomewide demarcation of RNA polymerase II transcription units revealed by physical fractionation of chromatin. Proc Natl Acad Sci 100: 6364–6369. 10.1073/pnas.1131966100 [DOI] [PMC free article] [PubMed] [Google Scholar]
- Nakahashi H, Kieffer Kwon KR, Resch W, Vian L, Dose M, Stavreva D, Hakim O, Pruett N, Nelson S, Yamane A, et al. 2013. A genome-wide map of CTCF multivalency redefines the CTCF code. Cell Rep 3: 1678–1689. 10.1016/j.celrep.2013.04.024 [DOI] [PMC free article] [PubMed] [Google Scholar]
- Neph S, Kuehn MS, Reynolds AP, Haugen E, Thurman RE, Johnson AK, Rynes E, Maurano MT, Vierstra J, Thomas S, et al. 2012a. BEDOPS: high-performance genomic feature operations. Bioinformatics 28: 1919–1920. 10.1093/bioinformatics/bts277 [DOI] [PMC free article] [PubMed] [Google Scholar]
- Neph S, Vierstra J, Stergachis AB, Reynolds AP, Haugen E, Vernot B, Thurman RE, John S, Sandstrom R, Johnson AK, et al. 2012b. An expansive human regulatory lexicon encoded in transcription factor footprints. Nature 489: 83–90. 10.1038/nature11212 [DOI] [PMC free article] [PubMed] [Google Scholar]
- Pique-Regi R, Degner JF, Pai AA, Gaffney DJ, Gilad Y, Pritchard JK. 2011. Accurate inference of transcription factor binding from DNA sequence and chromatin accessibility data. Genome Res 21: 447–455. 10.1101/gr.112623.110 [DOI] [PMC free article] [PubMed] [Google Scholar]
- Porter FD, Drago J, Xu Y, Cheema SS, Wassif C, Huang SP, Lee E, Grinberg A, Massalas JS, Bodine D, et al. 1997. Lhx2, a LIM homeobox gene, is required for eye, forebrain, and definitive erythrocyte development. Development 124: 2935–2944. [DOI] [PubMed] [Google Scholar]
- Quinlan AR. 2014. BEDTools: the Swiss-Army tool for genome feature analysis. Curr Protoc Bioinformatics 47: 11.12.1–11.12.34. 10.1002/0471250953.bi1112s47 [DOI] [PMC free article] [PubMed] [Google Scholar]
- Ramírez J, Lukin K, Hagman J. 2010. From hematopoietic progenitors to B cells: mechanisms of lineage restriction and commitment. Curr Opin Immunol 22: 177–184. 10.1016/j.coi.2010.02.003 [DOI] [PMC free article] [PubMed] [Google Scholar]
- R Core Team. 2018. R: a language and environment for statistical computing. R Foundation for Statistical Computing, Vienna: https://www.R-project.org/. [Google Scholar]
- Reyes-Fernandez PC, Fleet JC. 2016. Compensatory changes in calcium metabolism accompany the loss of vitamin D receptor (VDR) from the distal intestine and kidney of mice. J Bone Miner Res 31: 143–151. 10.1002/jbmr.2600 [DOI] [PMC free article] [PubMed] [Google Scholar]
- Riddell J, Gazit R, Garrison BS, Guo G, Saadatpour A, Mandal PK, Ebina W, Volchkov P, Yuan GC, Orkin SH, et al. 2014. Reprogramming committed murine blood cells to induced hematopoietic stem cells with defined factors. Cell 157: 549–564. 10.1016/j.cell.2014.04.006 [DOI] [PMC free article] [PubMed] [Google Scholar]
- Roadmap Epigenomics Consortium, Kundaje A, Meuleman W, Ernst J, Bilenky M, Yen A, Heravi-Moussavi A, Kheradpour P, Zhang Z, Wang J, et al. 2015. Integrative analysis of 111 reference human epigenomes. Nature 518: 317–330. 10.1038/nature14248 [DOI] [PMC free article] [PubMed] [Google Scholar]
- Ryffel GU. 2001. Mutations in the human genes encoding the transcription factors of the hepatocyte nuclear factor (HNF)1 and HNF4 families: functional and pathological consequences. J Mol Endocrinol 27: 11–29. 10.1677/jme.0.0270011 [DOI] [PubMed] [Google Scholar]
- Sherwood RI, Hashimoto T, O'Donnell CW, Lewis S, Barkal AA, van Hoff JP, Karun V, Jaakkola T, Gifford DK. 2014. Discovery of directional and nondirectional pioneer transcription factors by modeling DNase profile magnitude and shape. Nat Biotechnol 32: 171–178. 10.1038/nbt.2798 [DOI] [PMC free article] [PubMed] [Google Scholar]
- Siggers T, Chang AB, Teixeira A, Wong D, Williams KJ, Ahmed B, Ragoussis J, Udalova IA, Smale ST, Bulyk ML. 2012. Principles of dimer-specific gene regulation revealed by a comprehensive characterization of NF-κB family DNA binding. Nat Immunol 13: 95–102. 10.1038/ni.2151 [DOI] [PMC free article] [PubMed] [Google Scholar]
- Smeets MF, Chan AC, Dagger S, Bradley CK, Wei A, Izon DJ. 2013. Fli-1 overexpression in hematopoietic progenitors deregulates T cell development and induces pre-T cell lymphoblastic leukaemia/lymphoma. PLoS One 8: e62346 10.1371/journal.pone.0062346 [DOI] [PMC free article] [PubMed] [Google Scholar]
- Song L, Crawford GE. 2010. DNase-seq: a high-resolution technique for mapping active gene regulatory elements across the genome from mammalian cells. Cold Spring Harb Protoc 2010: pdb.prot5384 10.1101/pdb.prot5384 [DOI] [PMC free article] [PubMed] [Google Scholar]
- Stergachis AB, Neph S, Reynolds A, Humbert R, Miller B, Paige SL, Vernot B, Cheng JB, Thurman RE, Sandstrom R, et al. 2013. Developmental fate and cellular maturity encoded in human regulatory DNA landscapes. Cell 154: 888–903. 10.1016/j.cell.2013.07.020 [DOI] [PMC free article] [PubMed] [Google Scholar]
- Stolt CC, Rehberg S, Ader M, Lommes P, Riethmacher D, Schachner M, Bartsch U, Wegner M. 2002. Terminal differentiation of myelin-forming oligodendrocytes depends on the transcription factor Sox10. Genes Dev 16: 165–170. 10.1101/gad.215802 [DOI] [PMC free article] [PubMed] [Google Scholar]
- Sung MH, Guertin MJ, Baek S, Hager GL. 2014. DNase footprint signatures are dictated by factor dynamics and DNA sequence. Mol Cell 56: 275–285. 10.1016/j.molcel.2014.08.016 [DOI] [PMC free article] [PubMed] [Google Scholar]
- Swoboda P, Adler HT, Thomas JH. 2000. The RFX-type transcription factor DAF-19 regulates sensory neuron cilium formation in C. elegans. Mol Cell 5: 411–421. 10.1016/S1097-2765(00)80436-0 [DOI] [PubMed] [Google Scholar]
- Takebayashi H, Nabeshima Y, Yoshida S, Chisaka O, Ikenaka K, Nabeshima Y. 2002. The basic helix-loop-helix factor Olig2 is essential for the development of motoneuron and oligodendrocyte lineages. Curr Biol 12: 1157–1163. 10.1016/S0960-9822(02)00926-0 [DOI] [PubMed] [Google Scholar]
- Taniguchi T, Ogasawara K, Takaoka A, Tanaka N. 2001. IRF family of transcription factors as regulators of host defense. Annu Rev Immunol 19: 623–655. 10.1146/annurev.immunol.19.1.623 [DOI] [PubMed] [Google Scholar]
- Thurman RE, Rynes E, Humbert R, Vierstra J, Maurano MT, Haugen E, Sheffield NC, Stergachis AB, Wang H, Vernot B, et al. 2012. The accessible chromatin landscape of the human genome. Nature 489: 75–82. 10.1038/nature11232 [DOI] [PMC free article] [PubMed] [Google Scholar]
- Toyama T, Asano Y, Miyagawa T, Nakamura K, Hirabayashi M, Yamashita T, Saigusa R, Miura S, Ichimura Y, Takahashi T, et al. 2017. The impact of transcription factor Fli1 deficiency on the regulation of angiogenesis. Exp Dermatol 26: 912–918. 10.1111/exd.13341 [DOI] [PubMed] [Google Scholar]
- Tsompana M, Buck MJ. 2014. Chromatin accessibility: a window into the genome. Epigenetics Chromatin 7: 33 10.1186/1756-8935-7-33 [DOI] [PMC free article] [PubMed] [Google Scholar]
- van Bömmel A, Love MI, Chung HR, Vingron M. 2018. coTRaCTE predicts co-occurring transcription factors within cell-type specific enhancers. PLoS Comput Biol 14: e1006372 10.1371/journal.pcbi.1006372 [DOI] [PMC free article] [PubMed] [Google Scholar]
- Vaquerizas JM, Kummerfeld SK, Teichmann SA, Luscombe NM. 2009. A census of human transcription factors: function, expression and evolution. Nat Rev Genet 10: 252–263. 10.1038/nrg2538 [DOI] [PubMed] [Google Scholar]
- Wadman IA, Osada H, Grutz GG, Agulnick AD, Westphal H, Forster A, Rabbitts TH. 1997. The LIM-only protein Lmo2 is a bridging molecule assembling an erythroid, DNA-binding complex which includes the TAL1, E47, GATA-1 and Ldb1/NLI proteins. EMBO J 16: 3145–3157. 10.1093/emboj/16.11.3145 [DOI] [PMC free article] [PubMed] [Google Scholar]
- Walentin K, Hinze C, Werth M, Haase N, Varma S, Morell R, Aue A, Potschke E, Warburton D, Qiu A, et al. 2015. A Grhl2-dependent gene network controls trophoblast branching morphogenesis. Development 142: 1125–1136. 10.1242/dev.113829 [DOI] [PMC free article] [PubMed] [Google Scholar]
- Wang J, Zhuang J, Iyer S, Lin X, Whitfield TW, Greven MC, Pierce BG, Dong X, Kundaje A, Cheng Y, et al. 2012. Sequence features and chromatin structure around the genomic regions bound by 119 human transcription factors. Genome Res 22: 1798–1812. 10.1101/gr.139105.112 [DOI] [PMC free article] [PubMed] [Google Scholar]
- Wang X, Li J, Yang Z, Wang L, Li L, Deng W, Zhou J, Wang L, Xu C, Chen Q, et al. 2018. phlda3 overexpression impairs specification of hemangioblasts and vascular development. FEBS J 285: 4071–4081. 10.1111/febs.14653 [DOI] [PMC free article] [PubMed] [Google Scholar]
- Weirauch MT, Cote A, Norel R, Annala M, Zhao Y, Riley TR, Saez-Rodriguez J, Cokelaer T, Vedenko A, Talukder S, et al. 2013. Evaluation of methods for modeling transcription factor sequence specificity. Nat Biotechnol 31: 126–134. 10.1038/nbt.2486 [DOI] [PMC free article] [PubMed] [Google Scholar]
- Wu JQ, Seay M, Schulz VP, Hariharan M, Tuck D, Lian J, Du J, Shi M, Ye Z, Gerstein M, et al. 2012. Tcf7 is an important regulator of the switch of self-renewal and differentiation in a multipotential hematopoietic cell line. PLoS Genet 8: e1002565 10.1371/journal.pgen.1002565 [DOI] [PMC free article] [PubMed] [Google Scholar]
- Yagi R, Kohn MJ, Karavanova I, Kaneko KJ, Vullhorst D, DePamphilis ML, Buonanno A. 2007. Transcription factor TEAD4 specifies the trophectoderm lineage at the beginning of mammalian development. Development 134: 3827–3836. 10.1242/dev.010223 [DOI] [PubMed] [Google Scholar]
- Young RA. 2011. Control of the embryonic stem cell state. Cell 144: 940–954. 10.1016/j.cell.2011.01.032 [DOI] [PMC free article] [PubMed] [Google Scholar]
- Zaza G, Granata S, Masola V, Rugiu C, Fantin F, Gesualdo L, Schena FP, Lupo A. 2013. Downregulation of nuclear-encoded genes of oxidative metabolism in dialyzed chronic kidney disease patients. PLoS One 8: e77847 10.1371/journal.pone.0077847 [DOI] [PMC free article] [PubMed] [Google Scholar]
- Zhu J, Paul WE. 2008. CD4 T cells: fates, functions, and faults. Blood 112: 1557–1569. 10.1182/blood-2008-05-078154 [DOI] [PMC free article] [PubMed] [Google Scholar]
Associated Data
This section collects any data citations, data availability statements, or supplementary materials included in this article.