

Abstract
Simultaneous measurements of glucose, lactate, and neurotransmitters (e.g., glutamate) in cell culture over hours and days can provide a more dynamic and longitudinal perspective on ways neural cells respond to various drugs and environmental cues. Compared with conventional microfabrication techniques, direct writing of conductive ink is cheaper, faster, and customizable, which allows rapid iteration for different applications. Using a simple direct writing technique, we printed biosensor arrays onto cell culture dishes, flexible laminate, and glass to enable multianalyte monitoring. The ink was a composite of PEDOT:PSS conductive polymer, silicone, activated carbon, and Pt microparticles. We applied 0.5% Nafion to the biosensors for selectivity and functionalized them with oxidase enzymes. We characterized biosensors in phosphate-buffered saline and in cell culture medium supplemented with fetal bovine serum. The biosensor arrays measured glucose, lactate, and glutamate simultaneously and continued to function after incubation in cell culture at 37 °C for up to 2 days. We cultured primary human astrocytes on top of the biosensor arrays and placed arrays into astrocyte cultures. The biosensors simultaneously measured glucose, glutamate, and lactate from astrocyte cultures. Direct writing can be integrated with microfluidic organ-on-a-chip platforms or as part of a smart culture dish system. Because we print extrudable and flexible components, sensing elements can be printed on any 3D or flexible substrate.
Keywords: self-referencing, lactate, glucose, glutamate, MEA
Introduction
Astrocytes are glial neural cells that play important support, homeostatic, and repair roles in the brain.1,2 Astrocytes reuptake glutamate from the synaptic cleft and recycle it back to neurons via glutamine.2 According to the lactate shuffle model, glutamate reuptake stimulates astrocytic glucose uptake and lactate production from glucose (glycolysis). Then, astrocytes secrete lactate into the extracellular space. It is thought that neurons use lactate from astrocytes as a fuel for supporting synaptic transmission.2,3 Beyond the brain, glucose and lactate are key biomarkers for investigating metabolism generally. They can be used to infer rates of aerobic versus anaerobic respiration, hence mitochondrial dysfunction (chemical toxicity),4,5 the Warburg effect (dominant phenotype of cancer cells), and lactic acidosis (common among solid tumors).6 A low-cost multianalyte biosensor array compatible with conventional cell culture systems would be a useful tool for continuously measuring metabolites (e.g., glucose and lactate) and other species of interest, such as neurotransmitters (e.g., glutamate) from cell cultures for biological research and drug screening.5,7,8
Enzyme-based biosensors are attractive because they are relatively easy to fabricate, can sense a myriad of chemical species with high specificity, respond on a second or sub-second scale, are amenable to miniaturization, and work without genetically modifying, dying, or staining cell samples.9 Several groups have used enzyme-based multianalyte biosensors for measurements in vivo,10–13 on-line,14 off-line,15–17 and in vitro.18–32 However, their use with organ-on-a-chip platform5,33 or in cell cultures34 is not widespread. Bavli et al.5 and Misun et al.33 have integrated glucose and lactate sensors into custom microfluidic systems for organ-on-a-chip. Microfluidic systems can replace complex media with phosphate-buffered saline (PBS) temporarily during measurement. In addition, microfluidic systems reduce sample volumes, so analyte concentrations change faster for the same number of cells. As for conventional cell culture systems, Pemberton et al.35 have used microelectromechanical systems (MEMS) fabrication to make an array for measuring glucose, lactate, pH, O2, and temperature, but they only demonstrated in situ measurement of glucose from cell cultures. Enzyme stability, interference from components of cell culture medium, and biofouling are challenges to using enzyme-based biosensors for measuring cell cultures long-term.25,36
Researchers often measure cell cultures in PBS to avoid the problems of interference and biofouling.5,37–39 However, this limits how long one can measure because cells lose adherence to their substrate past a couple of hours.37,38,40 Cell cultures are typically grown in medium over days, so it would be useful to monitor them over that period, not only for short intervals. Implanted (in vivo) enzymatic biosensors also suffer from biofouling.41 Physical,42–44 chemical,45,46 and biological47 approaches all have the potential to reduce biofouling and improve biosensor stability during chronic measurement in complex fluids.
Direct writing refers to printing a material with controlled architecture and composition from a nozzle on a computer-controlled translation stage.48 Compared with conventional microelectromechanical systems (MEMS) fabrication, direct writing is cheaper, faster, and more customizable. By direct writing, it is possible to print devices onto almost any 3D or flexible surface.49,50 Therefore, instead of fabricating entirely new platforms, sensor systems can be printed onto existing devices, such as cell culture plates. Moreover, the low-cost customization of direct writing is advantageous when moving from one biological model system to another. Biological phenomena occur over a wide range of spatial and time scales.51 Depending on the analyte of interest and biological model system, the device geometry needed to capture biophysical responses of interest may change.
In this work, we used direct writing to make multianalyte biosensor arrays, which we used to measure lactate, glutamate, and glucose from 2D human astrocytes in a conventional cell culture setup. To our knowledge, our work represents the first attempt to use direct writing for this purpose. We printed biosensor arrays onto cell culture plates, sheets of flexible laminate, and glass slides. Human astrocyte cultures could be grown on top of biosensor arrays, and biosensor arrays could be placed into cell culture plate wells for in vitro measurement. We applied 0.5% Nafion to biosensors to improve their selectivity and functionalized them with oxidase enzymes. We measured lactate, glutamate, and glucose from cultures of human astrocytes in serum-supplemented Dulbecco’s modified Eagle’s medium (DMEM) for more than 6 h. Control electrodes, also known as sentinel electrodes,52 were used to account for interference and sensor drift by self-referencing. Finally, we tested sensor stability as a function of time in cell culture medium at 37 °C. This work is an important step toward making a low-cost smart cell culture system and flexible multianalyte biosensors to enable future in vitro and in vivo studies.
Materials and Methods
Materials
We purchased 27-gauge chamfer needles (part 7015236) and 32-gauge needles (part 7018462) from Nordson EFD (East Providence, RI). Plain microscope slides (25 × 75 × 1 mm), C-Pt paste (10% Pt), DMSO, 0.1 M PBS (pH 7.4), L-glutamic acid (glutamate), D(+)-glucose, glucose-free DMEM (cat. 11966025), and Dulbecco’s PBS (no Ca2+, no Mg2+, pH 7.4) came from Thermo Fisher Scientific (Waltham, MA). Poly(3,4-ehtylenedioxythiophene)-poly (styrenesulfonate) (PEDOT:PSS; 5 wt%; conductive screen-printable ink), Pt nanoparticles (<50 nm particle size), Nafion 117 solution (5 wt%), glutaraldehyde (grade II; 25% in H2O), bovine serum albumin (BSA; cat. A3059), hydrogen peroxide, and sodium DL-lactate (60 wt%) came from Sigma Aldrich (St. Louis, MO). We got Ecoflex 00–30 silicone elastomer from Smooth-On (Macungie, PA); XT/duroid 8000 12 × 9 SH/SH 0020 ± 00025/DI thermoplastic laminate from Rogers Corporation (Chandler, AZ); elastomeric polydimethylsiloxane (PDMS; Sylgard, 184) from Dow Corning (Midland, MI); carboxylic-acid functionalized multiwalled carbon nanotubes (MWCNTs) from Cheap Tubes, Inc. (Grafton, VT); 8057 magnet wire, no. 34 from Belden, Inc. (St. Louis, MO); Norland Optical Adhesive (NOA) 61 from Norland Products, Inc. (Cranbury, NJ); lactate oxidase from Sekisui Diagnostics (Lexington, MA); glutamate oxidase from Streptomyces from Cosmo Bio USA (Carlsbad, CA); glucose oxidase from MP Biomedicals, LLC (Solon, OH); Ag/AgCl (3 M NaCl) reference electrode from BASi (West Lafayette, IN); Eisco Labs carbon rod electrodes from Amazon (Seattle, WA); and six-well cell culture plates from Eppendorf (Eppendorf, Germany). Engineered Conductive Materials, Inc. (Delaware, OH) generously donated Ag ink (CI-1001).
We purchased human cerebral cortex astrocytes, astrocyte medium, astrocyte growth supplement (cat. 1852), cell freezing medium, fetal bovine serum (FBS; cat. 0010), and penicillin/streptomycin solution (P/S; cat. 0503) from ScienCell Research Laboratories (Carlsbad, CA). Astrocyte medium contained 500 mL of basal medium, 10 mL of FBS, 5 mL of astrocyte growth supplement, and 5 mL of P/S. Unless stated otherwise, water refers to 18.2 MΩ of ultrapure water. We used a reference 600 potentiostat (Gamry Instruments, Warminster, PA) for amperometry.
Rheology
We performed shear/flow and oscillatory tests with a TA AR G2 at room temperature (22 °C). We used a 20 mm 1° cone geometry with a 29 μm gap. Tests were run in triplicate on both inks used to make biosensor arrays, the PtNP nanocomposite ink, and the activated C/Pt microparticle composite. Shear tests consisted of shear-rated controlled flow ramps (44 points) from 0.01 s–1 to 200 s–1. Oscillatory tests consisted of strain-controlled amplitude sweeps from 0.01% to 150% strain at 0.5 Hz.
Biosensor Array Fabrication
We made biosensor arrays similarly to how we previously described.49,53 Using an automated microfluidic dispensing system (Pro EV3, Nordson EFD, East Providence, RI), we printed the biosensor array directly onto flexible 50 μXT/duroid 8000 thermoplastic laminate, cell culture plate wells, and glass microscope slides (Fig. 1D–G). We obtained XT/duroid 8000 laminate with a copper film that we etched away before use. Then we cut the large sheet of laminate to the desired dimensions with scissors. We treated glass with plasma oxygen (AP-300, Nordson March, Concord, CA) to prevent de-wetting of the NOA 61 passivation layer. We printed conductive lines with a PtNP nanocomposite ink with a 32-gauge needle at 50 psi and 2 mm/s. PtNP nanocomposite ink consisted of PEDOT:PSS ink, Ecoflex 00–30 silicone elastomer, carboxylic acid-functionalized MWCNTs, and platinum nanoparticles (<50 nm).49
Figure 1.
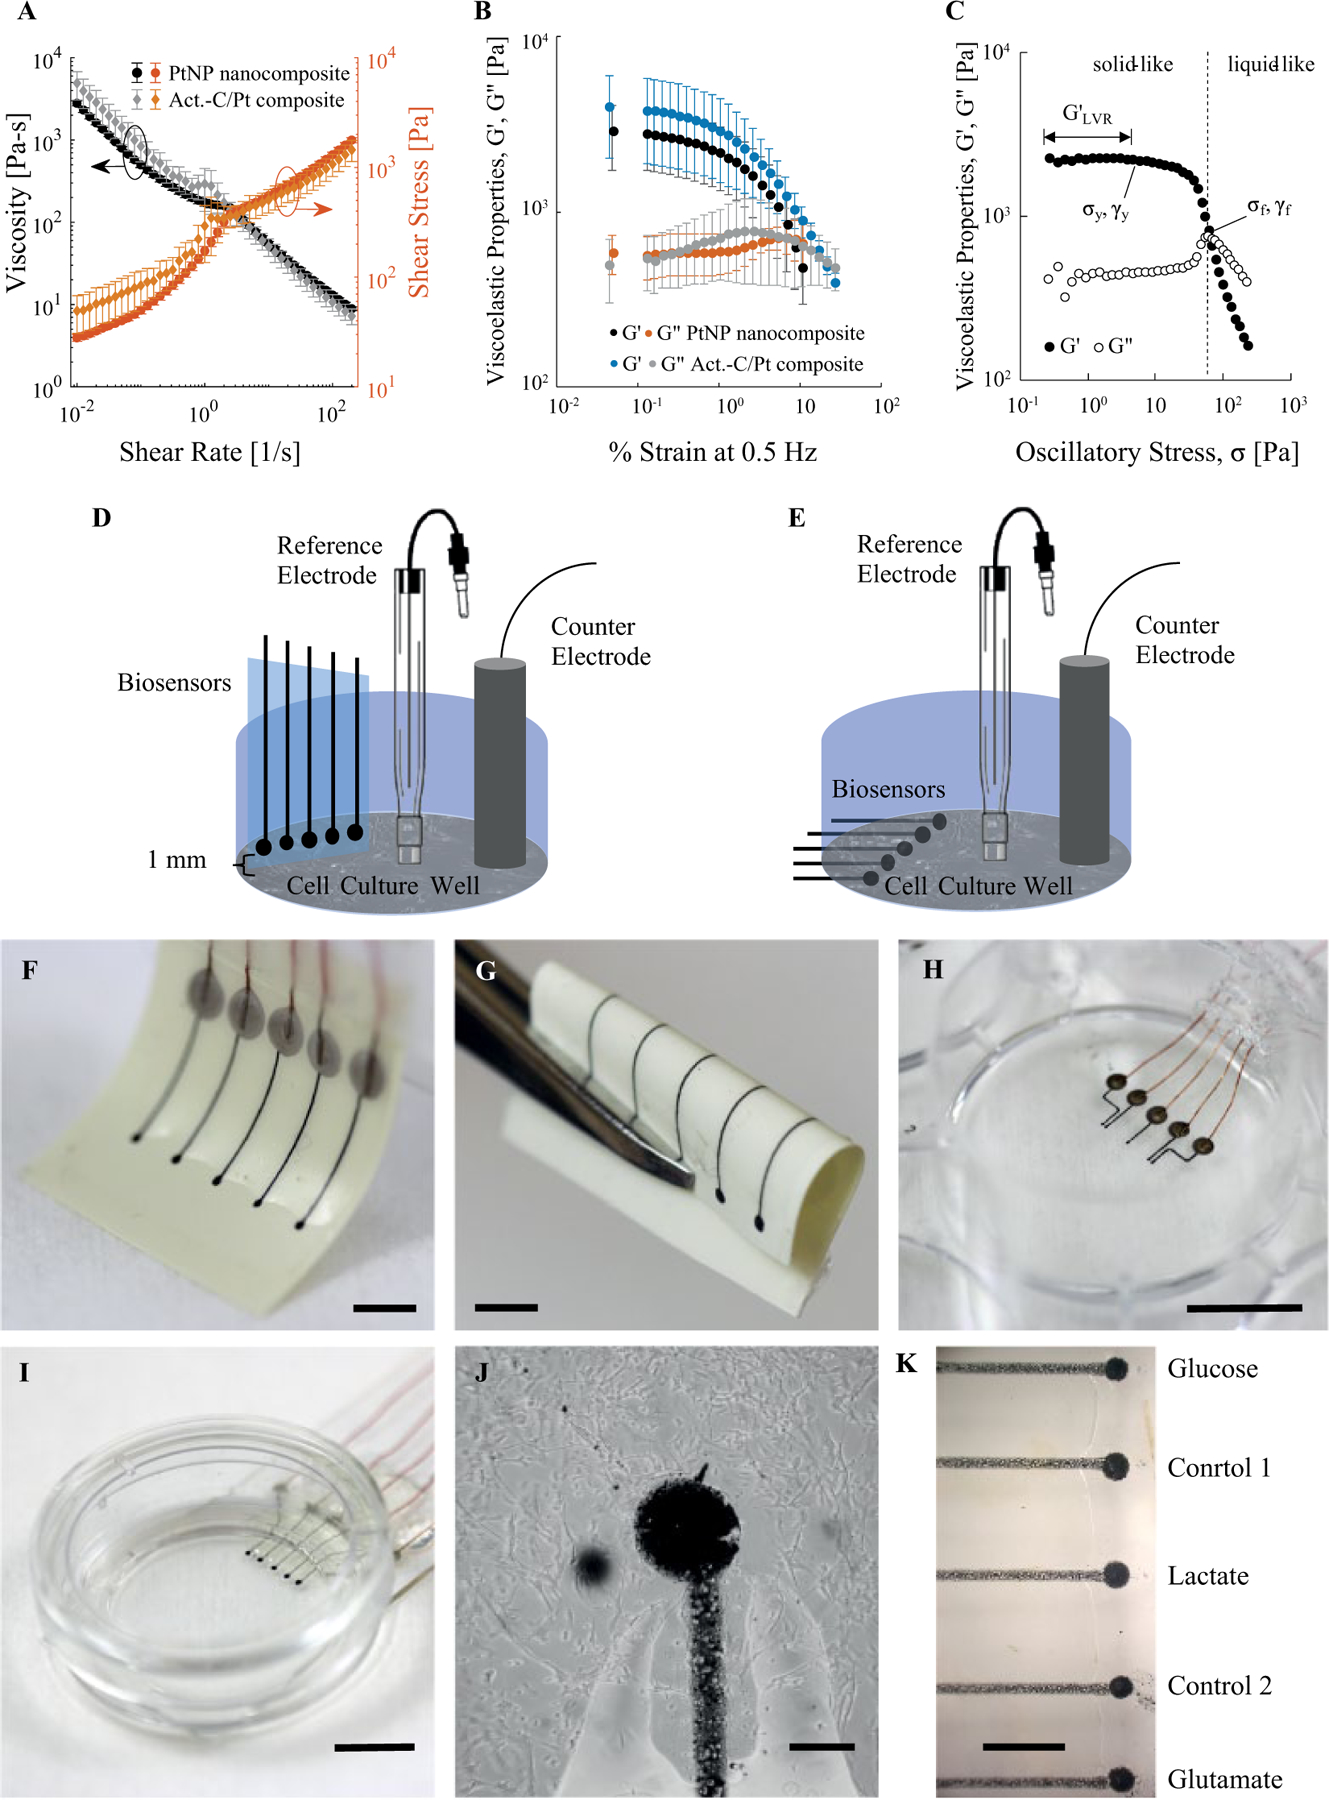
Rheology of inks, schematics, and images of biosensor arrays made by direct writing. (A) Viscosity and shear stress of PtNP nanocomposite and activated C/Pt microparticle composite inks as functions of shear rate. (B) Storage modulus G′ and loss modulus G′′ of both inks as a function of percent strain at 0.5 Hz during an oscillatory amplitude sweep. The error bars in (A) and (B) correspond to standard deviation (n = 3). (C) Representative plot of G′ and G′′ of composite ink as functions of oscillatory stress. Important rheological parameters and material behaviors are labeled. (D) Schematic of biosensor array placed vertically into a cell culture well. (E) Schematic of biosensor array printed onto the bottom of a well with a cell culture growing on top. (F) Biosensor array printed onto a piece of flexible XT/duroid 8000 laminate. Scale bar = 2.5 mm. (G) Biosensor arrays on flexible laminate withstand bending with a small inside radius. Scale bar = 2.5 mm. In addition to flexible substrates, we can print biosensors (H) into a cell culture plate well (scale bar = 1 cm) and (I) onto a glass slide with a bottomless 35 mm cell culture dish mounted on top (scale bar = 1 cm). (J) Human astrocytes grown around and on top of an electrode. Scale bar = 100 μm. (K) Position of biosensors on arrays used for calibration and measurements. Scale bar = 500 μm.
After printing conductive lines, we printed biosensor electrodes as 450 ± 26 μm diameter (0.160 ± 0.018 mm2) dots with an activated C/Pt microparticle composite with a 27-gauge chamfer needle, 20 psi, and 5-inch H2O vacuum between dot dispensing. The activated C/Pt microparticle composite consisted of PEDOT:PSS and C-Pt paste (10% Pt).53 We mixed 400 mg of PEDOT:PSS with 100 mg of C-Pt paste using a planetary centrifugal mixer (ARE-310, Thinky U.S.A., Inc., Laguna Hills, CA) for 30 min and then degassed the mixture for 10 min. Once we printed the conductive lines and biosensor electrodes, we left the inks to dry at room temperature overnight. We either printed electrodes 1 mm from the end of the microscope slide or, using a diamond point scribe, cut the microscope slide 1 mm from the electrodes.
Next, we added magnet wire as leads to the end of the conductive lines with Ag ink, leaving the ink to dry at room temperature for several hours. Then, we covered conductive traces with elastomeric PDMS (for arrays on flexible laminate sheets and cell culture plate wells) or NOA 61 (for arrays on glass slides). Baking at 70 °C accelerated the crosslinking of PDMS. We crosslinked NOA 61 with 254 nm of ultraviolet (UV) radiation for 1 h and baked at it 50 °C for 12 h to promote chemical bonding to the glass substrate. Culture wells were made from 35 mm FluoroDish cell culture dishes. We removed the glass bottoms and adhered the dish to on top of the biosensor array with PDMS. We sterilized devices with UV light for 15–60 min before use with cell cultures.
Immobilization of Perm-Selective Membrane and Enzymes
We drop-casted 1 μL of 0.5 wt% Nafion onto all electrodes, which we dried for 1 h at room temperature to create a perm-selective membrane. We immobilized enzymes onto biosensor electrodes by drop-casting a solution of glutaraldehyde, BSA, and oxidase enzyme in water. With a 10 μL micropipette, we placed 0.5 μL of solution onto an electrode and then immediately aspirated it back off the electrode. This was repeated three times for each electrode with 1 min intervals. Our solution for lactate sensors was 0.1% glutaraldehyde, 0.8% BSA, and 0.8 U/μL lactate oxidase; for glutamate sensors, 0.4% glutaraldehyde, 2.5% BSA, and 0.1 U/μL glutamate oxidase; for glucose sensors, 0.1% glutaraldehyde, 0.8% BSA, and 0.2 U/μL glucose oxidase; and for control sensors, 0.1% glutaraldehyde, 0.8% BSA, and no oxidase enzyme. After drop-casting, we left the solutions to crosslink at room temperature for at least 2 days.
Microscopy
We captured the image appearing as Figure 1J with a digital microscope (Hirox KH-8700, Tokyo, Japan). We used an Olympus microscope with 40× magnification and a digital camera with ToupView software to take the images of cell cultures.
Calibration
We used amperometry with a three-electrode setup, including a Ag/AgCl (3 M NaCl) reference electrode and graphite rod counterelectrode, for calibration of biosensor arrays and measurements from cell cultures. All biosensors on an array were calibrated simultaneously in mixed solution, which means they were each calibrated in one recording in the same solution. We applied 0.5 V versus Ag/AgCl to all biosensors in an array (lactate, glutamate, glucose, and control), using one reference and counterelectrode for all four sensors. At least 30 min was given after biasing the electrodes before beginning calibration. We sampled every 0.2 s. A 1 × 5 mm magnetic stir bar was used to stir the solution at 300 rpm. We calibrated biosensor arrays in 0.01 M PBS (pH 7.4) and in glucose-free DMEM + 2% FBS + 100 U/mL P/S (GFDMEM).
In 0.01 M PBS, lactate and glutamate sensor calibrations comprised 0.01, 0.3, 0.05, 0.1, 0.3, 0.5, and 1 mM, and glucose sensor calibrations comprised the same concentrations plus 3, 5, and 10 mM. These calibrations occurred in 20 mL of 0.01 M PBS. In GFDMEM, calibrations comprised 0.05, 0.1, and 0.5 mM for lactate; 0.05, 0.1, and 0.15 mM for glutamate; and 0.5, 2.5, and 5.5 mM for glucose. We chose the concentrations for GFDMEM based on expected ranges from cell cultures and the concentration of glucose in human astrocyte medium (5.5 mM). All analyte additions were separated by 100 s intervals. These calibrations occurred in 5 mL of GFDMEM in a well of a six-well cell culture plate in a humidified incubator set to 37 °C and 5% CO2. The incubator was only opened briefly (<10 s) at 100 s intervals to add lactate, glutamate, or glucose.
For calibrations and measurements in six-well cell culture plates, we inserted the biosensor array, reference electrode, and counterelectrode through slots cut out of cell culture plate covers, so each were normal to the bottom of the well. Each electrode had also been inserted through a thin rubber sheet with slightly smaller slots, placed over the plastic cover with tape, to hold the array and electrodes securely in place. After calibration in GFDMEM, we gently rinsed biosensor arrays with fresh GFDMEM and removed excess solution without them drying completely before using them immediately for measurements from cell cultures. The fresh GFDMEM used for washing was placed in a half-open centrifuge tube in the incubator before calibration to get the GFDMEM to pH 7.4.
Cell Culture
Human cerebral cortex astrocytes were obtained from ScienCell and cryopreserved at passage 1. Astrocytes were expanded and maintained per ScienCell’s protocol. Astrocytes were cultured in astrocyte medium in six-well, tissue culture-treated plates, with 3 × 10⁵ cells seeded per well. These cultures were then incubated until confluent in a humidified incubator at 37 °C and 5% CO2. We replaced the astrocyte medium 1 day after seeding. Unless otherwise stated, all incubation in this work occurred in a humidified incubator at 37 °C and 5% CO2.
Measuring from Cell Culture
We calibrated all biosensor arrays in GFDMEM immediately before using them in cell cultures. We washed cell cultures twice with Dulbecco’s PBS (pH 7.4) and then added 3 mL of GFDMEM. Next, we placed the plastic cover with the biosensor array, Ag/AgCl (3 M NaCl) reference electrode, and graphite rod counterelectrode, described in the section on calibration, on top of the cell culture well, and then placed everything in a humidified incubator (37 °C, 5% CO2). As for calibrations, we biased the biosensors at 0.5 V versus Ag/AgCl and sampled every 0.2 s. We left the biosensors to settle for 1 h before adding 5.5 mM glucose by a 174.6 μL bolus of 100 mM glucose. After another hour, we added 150 μM glutamate by a 123.7 μL bolus of 4 mM glutamate, and a half-hour after that we added 150 μM glutamate a second time (133.7 μL bolus of 4 mM glutamate). During each addition, we opened the incubator for less than 10 s. We continued to measure for another 4 h, so the total recording time was 6.5 h or 23,400 s.
Testing Biosensor Performance after Storage in Cell Culture Medium
We calibrated new glucose biosensors in 0.01 M PBS (pH 7.4) to glucose the same way as described in the section on calibration but to 0.5, 2, 5, 7.5, and 10 mM glucose. Following calibration, glucose biosensors were rinsed with water, dried with N2, and placed in astrocyte medium + 10% FBS + 100 U/mL P/S. We incubated the biosensors in a humidified incubator at 37 °C and 5% CO2 for at least 2 days. Every day, we removed glucose biosensors from astrocyte medium, gently rinsed them with PBS, and recalibrated them. Finally, we rinsed biosensors with ultrapure water, dried them with N2, and returned them to astrocyte medium for further incubation.
Data Analysis
We converted current data from amperometry to current density (μA/mm2 or nA/mm2). For calibration, we adjusted the baseline currents from all biosensors by subtracting the mean current during the 5 s prior to the first addition of lactate. For calculating sensitivity, we subtracted the current at zero analyte concentration from the currents at all other concentrations. The current at each concentration was calculated by taking the mean after a 90% response. Sensitivity was calculated as the slope of the linear regression through the linear range of the biosensor. The y intercept of these linear regressions was not set to zero.
The concentration of lactate, glutamate, and glucose during measurements in astrocyte cultures was calculated as follows. First, we converted current data to current density as previously described. Then, we subtracted the control sensor’s current as a function of time from that of the lactate, glutamate, and glucose sensors. To calculate the glutamate concentration, we divided by sensitivity found by calibration. To calculate the lactate and glucose concentration, we used second-order polynomial fits of calibrations if measurements fell outside the linear range. Finally, we subtracted the current of each biosensor at 1 h, immediately before adding 5.5 mM glucose, from its current as a function of time. This assumes that the concentration of lactate, glutamate, and glucose was zero before glucose and glutamate were added. These data and calibration data were filtered with a low-pass filter.
Results and Discussion
Rheological Characterization of Ink
We evaluated the printability of both inks used in printing biosensor arrays with shear and oscillatory rheology. Figure 1A shows the viscosity and shear stress τ of the PtNP nanocomposite and activated C/Pt microparticle composite as functions of shear rate Both inks have a shear-thinning behavior that can be fitted to the power-law equation . Shear-thinning behavior is a requirement for printable inks.54 The slight change in slope or double yield of the inks around 1 s–1 is likely due to the ink slipping from the smooth rheometer cone and plate walls (wall depletion).55 This can be eliminated by roughening both plates of a parallel plate configuration.55
Amplitude sweeps from 0.01% to 150% strain at 0.5 Hz were used to quantify inner structure and breakdown processes. Both inks have similar viscoelastic properties (storage modulus G′ and loss modulus G′′) as functions of shear (Fig. 1B). We converted oscillatory stress σ to obtain useful parameters for evaluating printability: network stiffness G′LVR, flow stress σf, and the flow transition index (FTI).54 Figure 1C shows only one representative plot from PtNP nanocomposite ink for clarity. The other samples and ink had the same qualitative behavior. At low σ, G′ > G′′, indicating a gel-like/solid-like structure. Within the linear viscoelastic region (LVR), G′ is constant with respect to σ. This value of G′, G′LVR, represents the ink’s stiffness at rest. The ink’s structure begins to break down and yields at the yield stress σy. Then, at the flow point/flow stress σf, G′ = G′′. Beyond this point, viscous behavior dominates and the ink flows. The FTI is the ratio of σf to σy. Materials with low FTI approaching 1 are brittle.54 The mean values ± standard deviation (n = 3) of G′LVR, σf, and FTI for the PtNP nanocomposite are 2900 ± 1200 Pa, 77 ± 34 Pa, and 13 ± 1.3, respectively, For the activated C/Pt microparticle composite, the same parameters are 4000 ± 2000 Pa, 152 ± 17 Pa, and 10 ± 0.7. Based on these values, both inks fall within the threshold of having established networks required for printing features that maintain their shape with high resolution.54 In other words, G′LVR and σ are great enough and FTI falls toward the middle of the printability map published by Corker et al.54
Direct Writing Biosensor Arrays
We made biosensor arrays for use in one of two configurations (Fig. 1D,E). We either made stand-alone biosensor arrays that we placed into cell cultures, 1 mm above the cells (Fig. 1D), or added wells on top of biosensor arrays (Fig. 1E). Stand-alone biosensors are easier to calibrate and do not necessarily need to withstand 1 or more days of incubation in cell culture medium at 37 °C. For these reasons, other groups have separated biosensor arrays and culturing platforms until the time of measurement.33,37,38 On the other hand, it may be advantageous to grow cells directly on top of a biosensor array, so the biosensors are in close contact with cells. Others have shown that cells generate gradients in static medium on a submillimeter scale.37,38,56,57
Direct writing can be used to print multianalyte arrays onto flexible substrates such as XT/duroid laminate (Fig. 1F,G). Such a device could be placed directly into standard cell culture plates for bulk concentration measurement. The devices in Figure 1H,I are two options for growing cells on top of biosensor arrays. For Figure 1H, we printed an array inside a cell culture well, and for Figure 1I, we printed an array on a glass slide and then mounted a bottomless cell culture dish on top. The latter option is easier to passivate. Figure 1J shows human astrocytes grown on top of a biosensor sensor electrode over 2 days, which suggests that the biosensor electrodes are stable in cell culture medium over several days and are not acutely toxic to cells. In the past, we have used direct writing to print pseudo-Ag/AgCl reference electrodes and counterelectrodes, which we can likewise add to this device.49 Figure 1K shows the placement of lactate, glutamate, glucose, and control sensors on a biosensor array. The supplemental material includes experimental parameters and the results of cyclic voltammetric characterization of biosensor electrodes (Suppl. Fig. S1). The remainder of electrochemical analysis in this work is amperometry, as detailed in the Materials and Methods.
Biosensor Calibration
We calibrated biosensor arrays in 0.01 M PBS (pH 7.4) as a reference for evaluating their performance in cell culture medium. We tested the effect of bending on biosensor performance, particularly sensitivity. We calibrated flexible single-analyte arrays of lactate, glutamate, and glucose sensors, first straight and then bent as shown in Figure 2A,B. Biosensors were bent, so the electrodes sit at the bottom of the stirred solution dish at 90° to the wired ends attached to glass slides. The resulting calibration curves from triplicate measurement appear in Figure 2C–E. Bending the biosensors in this way increased the sensitivity of lactate, glutamate, and glucose sensors by less than 10%. Figure 2F shows a representative simultaneous calibration of lactate, glutamate, and glucose sensors on the same array with a control sensor. We calibrated lactate and glutamate sensors up to 1 mM and glucose sensors up to 10 mM. The subsection on calibration in Materials and Methods includes a list of calibration concentrations. We calculated calibration curves (Fig. 2G–I) from triplicate amperometric responses, as shown in Figure 2F. Table 1 compares sensor performance parameters for biosensors calibrated in PBS to other enzyme-based biosensors in literature.5,23,58–61 The upper limit of the linear range of lactate sensors on glass slides is low compared with similar lactate sensors on flexible laminate. Variation in enzyme functionalization may have been the cause. The linear range of enzymatic biosensors can be extended by optimizing the amount of enzyme used or applying membranes of polyurethane, catalase/BSA/glutaraldehyde, or BSA/glutaraldehyde on top of the sensor.59,62,63 Without a diffusive barrier coating, the linear range of the lactate sensor will be limited by the Michaelis constant of lactate oxidase (0.7 mM).
Figure 2.
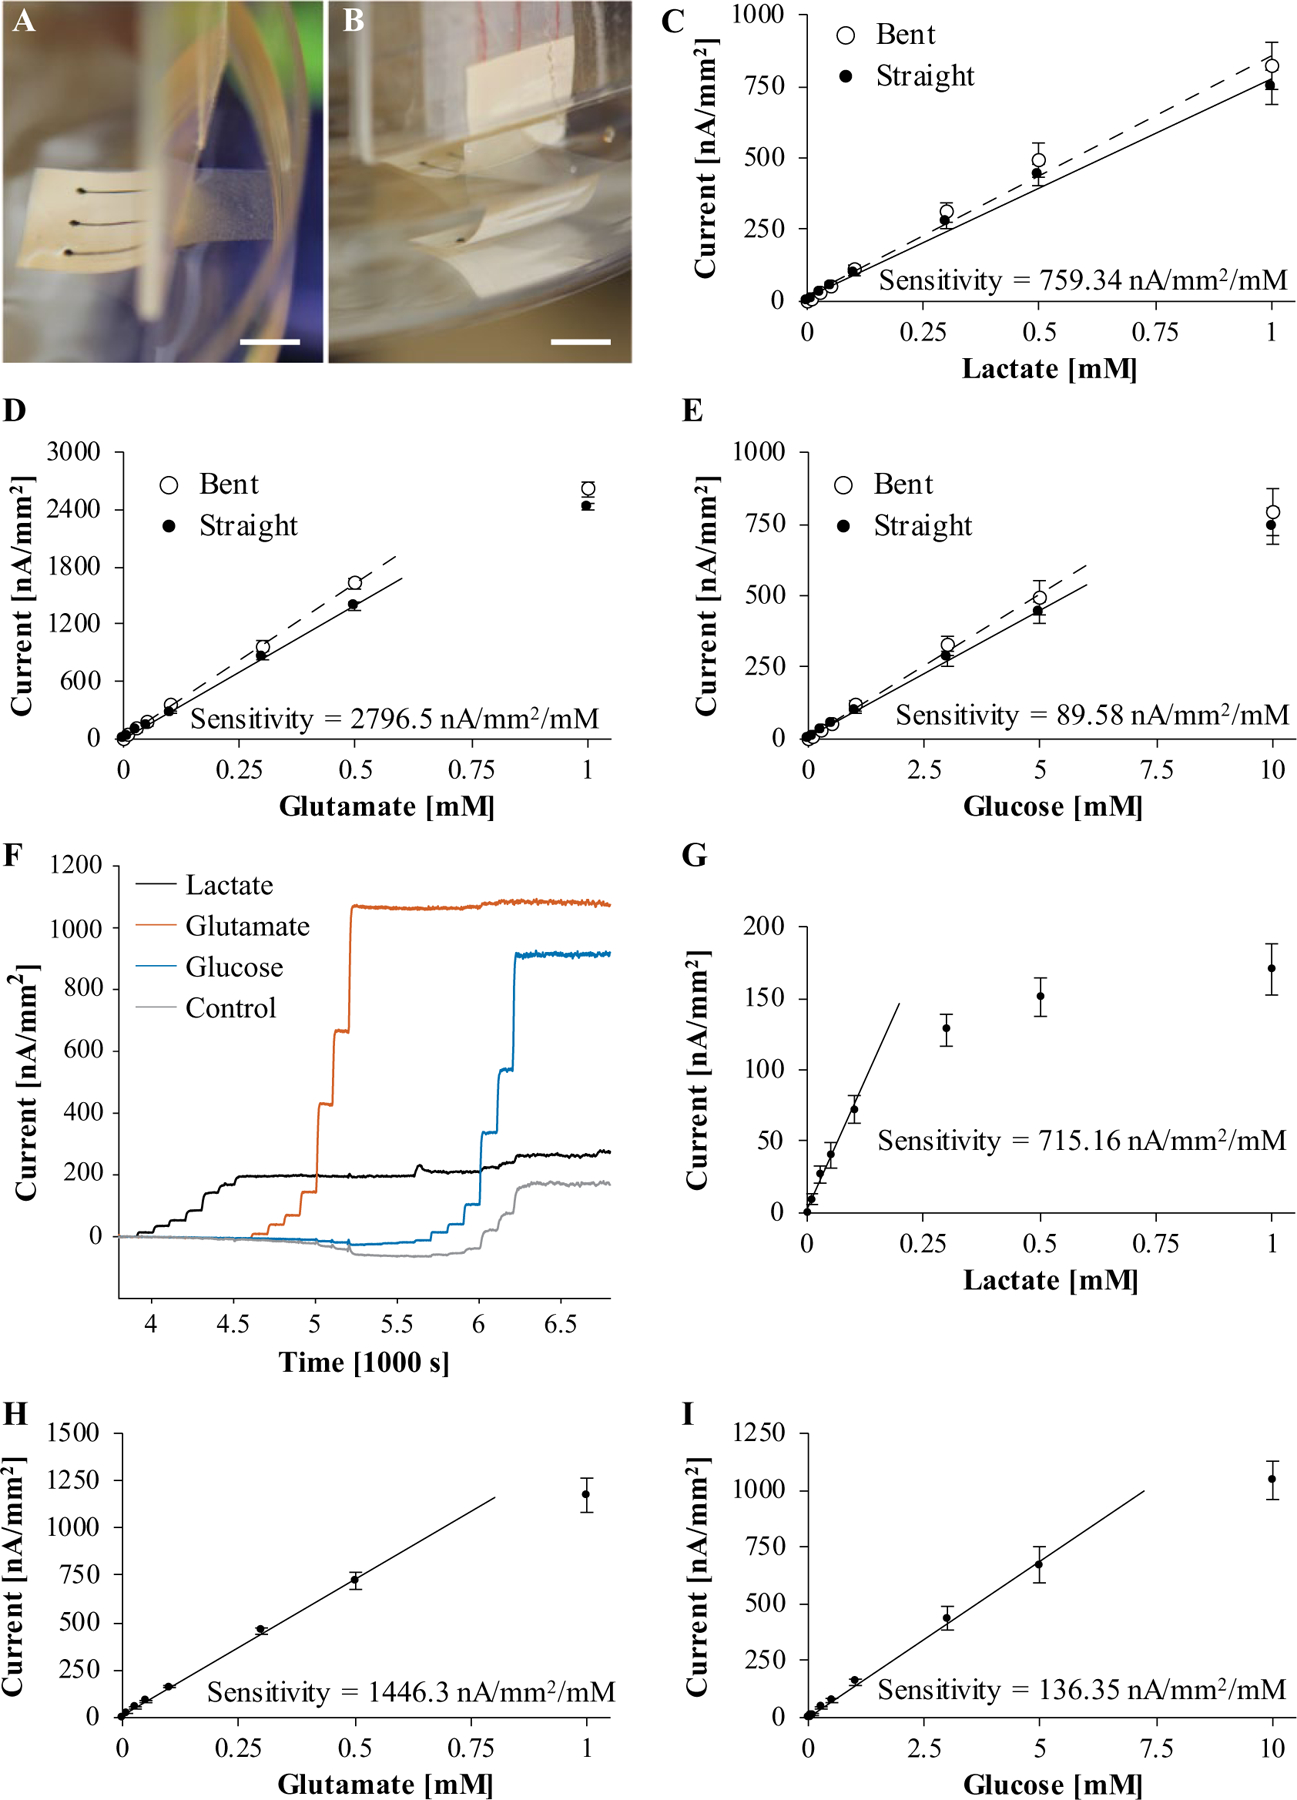
Calibration of biosensor arrays in 0.01 M PBS (pH 7.4). (A,B) Biosensors on flexible laminate were calibrated while straight (A) and then while bent (B) to test whether bending affected performance. (C-E) Calibration curve for bent and straight biosensors for each analyte in PBS: lactate (C), glutamate (D), and glucose (E). The error bars correspond to standard deviations (n = 3). Bending the biosensors as shown in (A,B) increased the sensitivity of biosensors by less than 10%. (F) Representative plot of currentas a function of time during a simultaneous calibration of lactate, glutamate, glucose, and control sensors on a biosensor array. (G-I) Calibration curve for each analyte in PBS: lactate (B), glutamate (C), and glucose (D). The error bars correspond to standard deviations (n = 3).
Table 1.
Comparison of Biosensor Arrays on Glass and Flexible Laminate in 0.01 M PBS (pH 7.4) to Similar Biosensor Arrays and Glutamate Biosensors in the Literature.
| Reference | Biosensors (Lactate/Glutamate/Glucose/Other) | Electrode Material | Area [mm2] | Sensitivity [nA/mm2/mM] | Detection Limit [μM] | Linear Range [mM] |
|---|---|---|---|---|---|---|
| Weltin et al.58 | Lactate | Pt | 0.126 | 2.6 | 90 | 0.09–3 |
| Glucose | Pt | 3.3 | 75 | 0.075–10 | ||
| O2, pH | Pt, IrO2 | −7350, −61.4 mV/pH | — | 0–0.2, pH 4–10 | ||
| Misun et al.59 | Lactate | Pt | 0.126 | 443 | 7.07 | 0.01–2 |
| Glucose | 322 | <10 | 0.007–1 | |||
| Bavli et al.5 | Lactate | Pt | ~9 | ~2 | 500 | 0.5–20 |
| Glucose | ~3 | 500 | 0.5–30 | |||
| Tseng and Monbouquette60 | Glutamate | Polypyrrole/Pt | 1260 | 2.1 | 0.002–0.63 | |
| Dopamine | 3.25 × 10⁻⁴ | 0.062 | 6.2 × 10⁻⁵–0.04 | |||
| Abe et al.23 | Glutamate | Horseradish peroxidase/osmium bipyridine/Au | 147 | 1 | 0.001–0.06 | |
| Dopamine | 197 | 1 | 0.001–0.1 | |||
| Belle et al.61 | Glutamate | Pt | 3 × 10⁻⁴ | 7500 | 2 | 0.002–0.5 |
| 0.49 | 1600 | |||||
| Nguyen et al.49 | Glutamate | PtNP/MWCNT/PEDOT:PSS | 0.031 | 2600 | 0.5 | 0.001–0.8 |
| This work (arrays on glass) | Lactate | Pt/activated C/PEDOT:PSS | 0.16 | 715 | 2.30 | 0.002–0.1 |
| Glutamate | 1446 | 1.66 | 0.002–0.5 | |||
| Glucose | 136 | 12.66 | 0.013–5 | |||
| This work (arrays on flexible laminate) | Lactate | Pt/activated C/PEDOT:PSS | 0.16 | 759 | 2.2 | 0.002–1 |
| Glutamate | 2797 | 0.9 | 9 × 10⁻⁴–0.5 | |||
| Glucose | 90 | 19 | 0.019–5 |
Lactate did not interfere with the other glutamate, glucose, or control sensors. However, there was crosstalk interference from glutamate and glucose. Glutamate above 50 μM decreased the current of nonglutamate sensors. Cordeiro et al. found that lactate below 8 mM had a similar effect on their pyruvate sensor.13 On the other hand, glucose increased the current of nonglucose sensors. This type of crosstalk is common between enzyme-based biosensors on a multianalyte array.64,65 The most likely cause is the excess H2O2 from glucose oxidase that escapes from the glucose sensor electrode into the bulk PBS. Adding a layer of catalase on top of the enzyme/BSA/glutaradehyde matrix is one way to prevent crosstalk from excess H2O2.15,33 Another way is by self-referencing.25,52
We addressed crosstalk and other interferences by self-referencing. We included control, or sentinel, electrodes on our biosensor arrays, which we functionalized with only Nafion and a BSA/glutaraldehyde matrix. Signal from the control electrode can be subtracted from biosensor signals to remove interference and drift. We assumed that interference and drift are constant among control and biosensor electrodes. Unexpectedly, in PBS, crosstalk from glucose sensors was not uniform across lactate, glutamate, and control sensors. In fact, crosstalk affects control sensors the worst and glutamate sensors the least. This may be due to differences in enzyme/BSA/glutaraldehyde matrix composition across biosensors. More BSA (2.5%) was applied to glutamate sensors than to the others (0.8%). Alternatively, interference from glutamate and excess H2O2 may depend in part on total current, so interference may be reduced when biosensor currents are near saturation.
Based on crosstalk interference, we calculated the selectivity of biosensors to glutamate and glucose when applicable. Lactate and glutamate sensors respond to their respective analytes over 100 times more than to crosstalk from glucose sensors (103:1 and 712:1). Nonetheless, we calibrated glucose to 10 mM, and interference becomes apparent around 5 mM glucose. On the other hand, glucose sensors were much less selective against glutamate (17:1), yet we calibrated and measured glutamate over a smaller range, 0.01–1 mM.
Characterization in Cell Culture Medium
Although PBS is an optimal electrolyte for the biosensors, it is poorly suited for maintaining human astrocytes long-term. Within only 2 h of being in PBS at room temperature, the morphology of human astrocytes changes drastically (Fig. 3A,B). Rivera et al. found that although human astrocytes in PBS for 2 h is viable,38 they had largely lost their processes and adherence to the culture plate. Magnesium and calcium ions are needed for cells to adhere to substrate after incubation with serum proteins or cellular products.40 Even using Dulbecco’s PBS, which contains these cations, would be inadequate for measurement over many hours because it lacks amino acids, vitamins, and growth factors.
Figure 3.
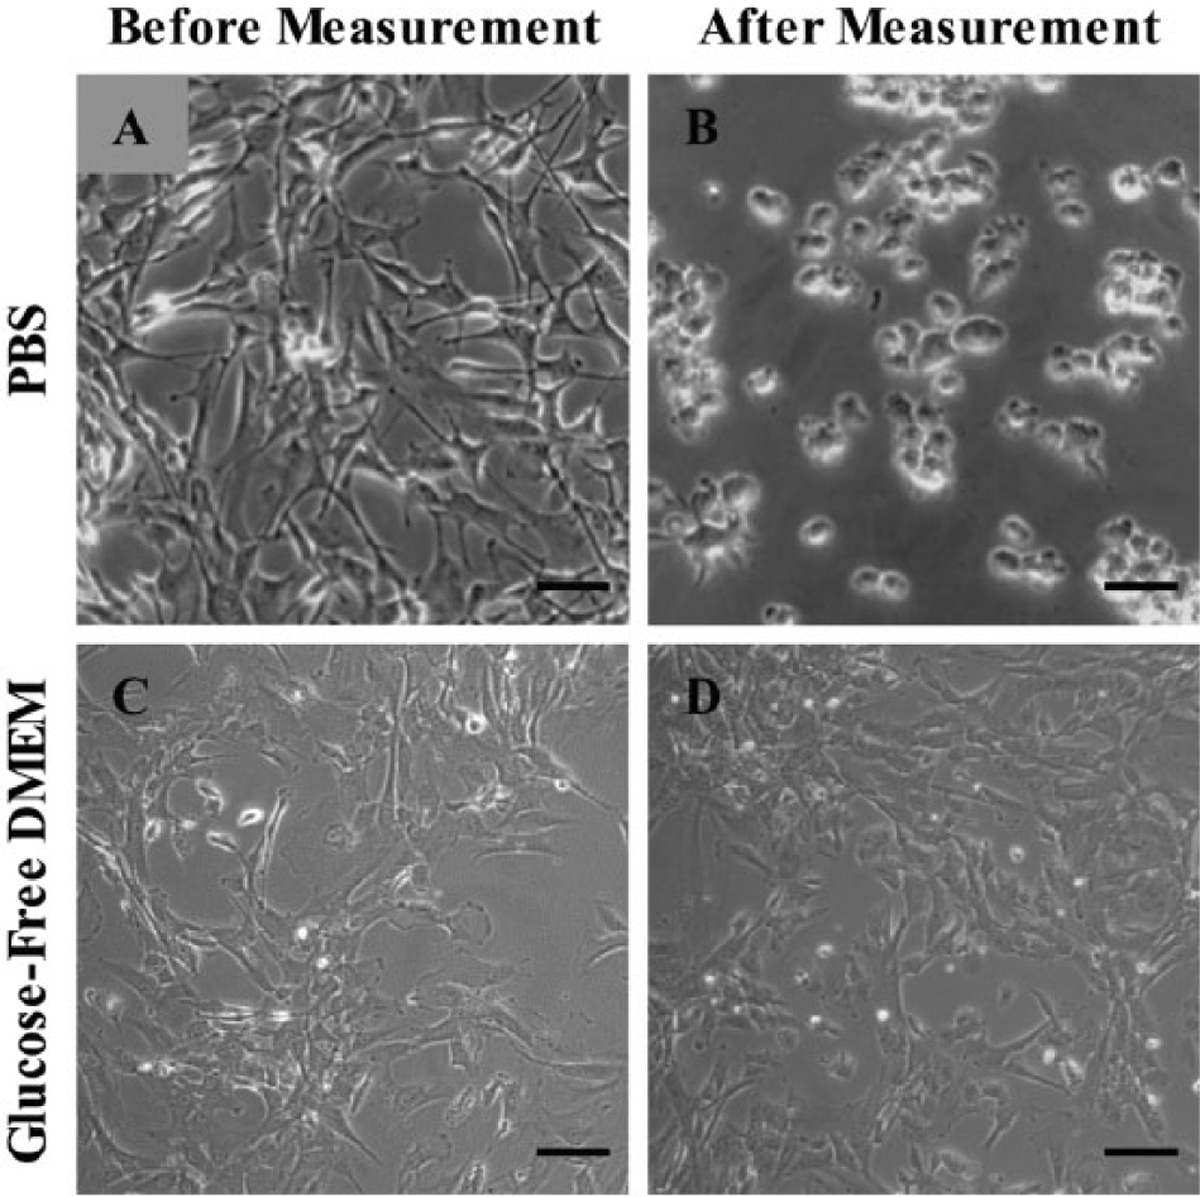
Human astrocytes. Scale bar = 50 μm. (A,C) Astrocytes in astrocyte medium before measurement. (B) Astrocytes from (A) after 2 h in 0.01 M PBS (pH 7.4) at room temperature. (D) Astrocytes from (C) after the 6.5 h biosensor array measurement in GFDMEM in a humidified incubator at37 °C and 5% CO2. Note that astrocytes in PBS for 2 h have lost their processes, which corresponds to losing adherence, whereas astrocytes in GFDMEM look the same after 6.5 h.
Therefore, we decided to measure lactate, glutamate, and glucose from astrocytes in cell culture medium. Astrocyte medium contains 5.5 mM glucose, so we used glucose-free DMEM + 2% FBS + 100 U/mL penicillin/streptomycin (GFDMEM). In contrast to astrocytes in PBS (Fig. 3A,B), astrocytes in GFDMEM in a humidified incubator at 37 °C and 5% CO2 maintain the same morphology after a 6.5 h measurement (Fig. 3C,D).
We calibrated each biosensor array in GFDMEM prior to measuring from astrocytes. Figure 4A shows a representative plot of current density as a function of time for each biosensor and control sensor on the same array. We chose calibration concentration points based on expected concentrations during measurement from astrocytes. As with calibrations in PBS, glutamate reduced the current of all other biosensors. On the other hand, glucose did not increase the current of other biosensors, whether directly or indirectly via H2O2. Glucose apparently interfered in a similar way to glutamate. This suggests that in DMEM there is little crosstalk from excess H2O2 from the glucose sensor. Similarly, Ward et al. saw crosstalk from glucose sensor H2O2 during calibration in aqueous buffer, which disappeared during subcutaneous in vivo measurement.10 Ward et al. attributed this phenomenon to not stirring in vivo, reducing the flow velocity of H2O2. We did stir during calibrations in GFDMEM, so hydrodynamics cannot entirely explain our observations. Serum proteins and vitamins in GFDMEM may have oxidized excess H2O2 before it accumulated enough to cause crosstalk. In contrast to calibrations in PBS, glutamate and glucose interfered equally across the other biosensors. Therefore, we were able to eliminate crosstalk from lactate, glutamate, and glucose measurements by subtracting control sensor signal as intended.
Figure 4.
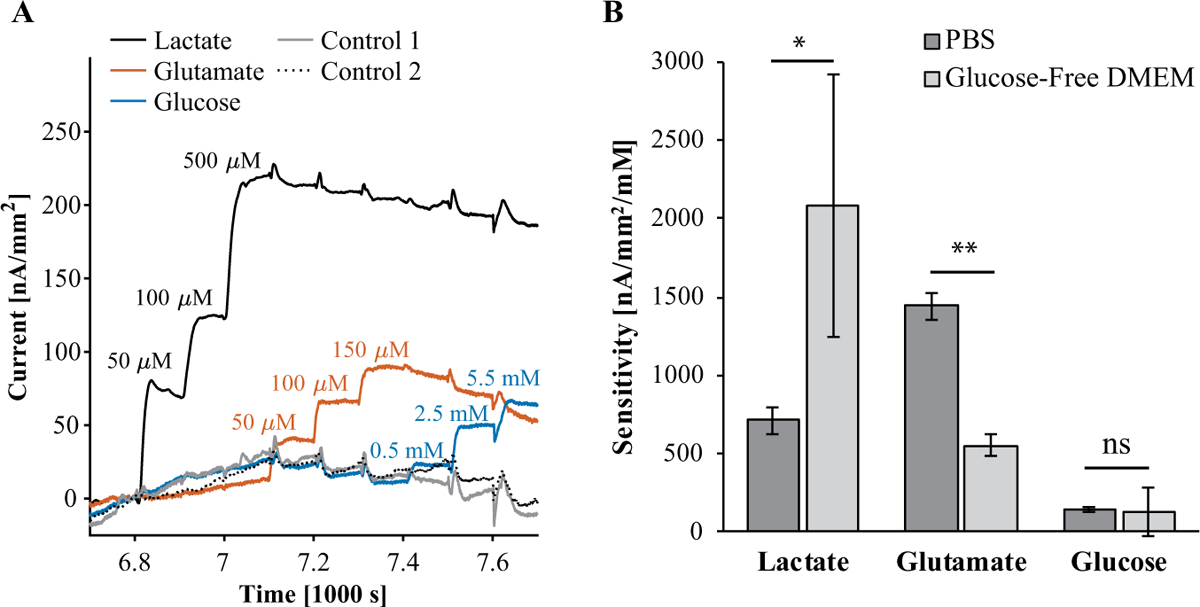
Calibration of biosensor arrays in GFDMEM and comparison of sensitivity to biosensors in 0.01 M PBS (pH 7.4). (A) Representative plot of current as a function of time during a simultaneous calibration of lactate, glutamate, and glucose sensors on a biosensor array in GFDMEM in a humidified incubator at 37 °C and 5% CO2. Biosensors in GFDMEM were calibrated at fewer points than in PBS. (B) Comparison of biosensor sensitivity in PBS (Fig. 3) to sensitivity in GFDMEM. The error bars correspond to standard deviations (n = 3). *p < 0.05, **p < 0.001.
Figure 4B compares the sensitivity of lactate, glutamate, and glucose sensors in PBS to the sensitivity in GFDMEM from triplicate calibrations. The sensitivity of glutamate sensors significantly decreased from PBS to GFDMEM (t test, p < 0.001). Surprisingly, lactate sensors were more sensitive in GFDMEM than in PBS (t test, p < 0.05), and the mean glucose sensor sensitivity did not change from PBS to GFDMEM. There was more variability in sensitivity among lactate and glucose sensors in GFDMEM than those in PBS. We had not expected the sensitivity of any biosensor to increase from PBS to GFDMEM. The increase in lactate sensitivity is more likely due to variability between enzyme functionalization. Whereas all biosensors calibrated in PBS were functionalized simultaneously, biosensors calibrated in DMEM and used for measuring cells were functionalized separately on different days. This may also explain the greater variability in sensitivity in GFDMEM versus PBS.
Multianalyte Measurement from Human Astrocytes
Once we calibrated biosensor arrays in GFDMEM (Fig. 4), we measured lactate, glutamate, and glucose 1 mm above confluent astrocyte cultures in fresh GFDMEM during 6.5 h. Figure 5 shows measurements of lactate, glutamate, and glucose as a function of time. We assumed that the concentrations of glucose, glutamate, and lactate were zero until we added 5.5 mM glucose. Others have shown that lactate secretion approaches zero in the absence of glucose.33 As expected, the glucose and glutamate concentrations increased soon after we added 5.5 mM glucose and 150 μM glutamate, respectively. Lactate monotonically increased throughout the measurement. We have included raw current as a function of time data and two other measurements in the supplemental material (Suppl. Fig. S2).
Figure 5.
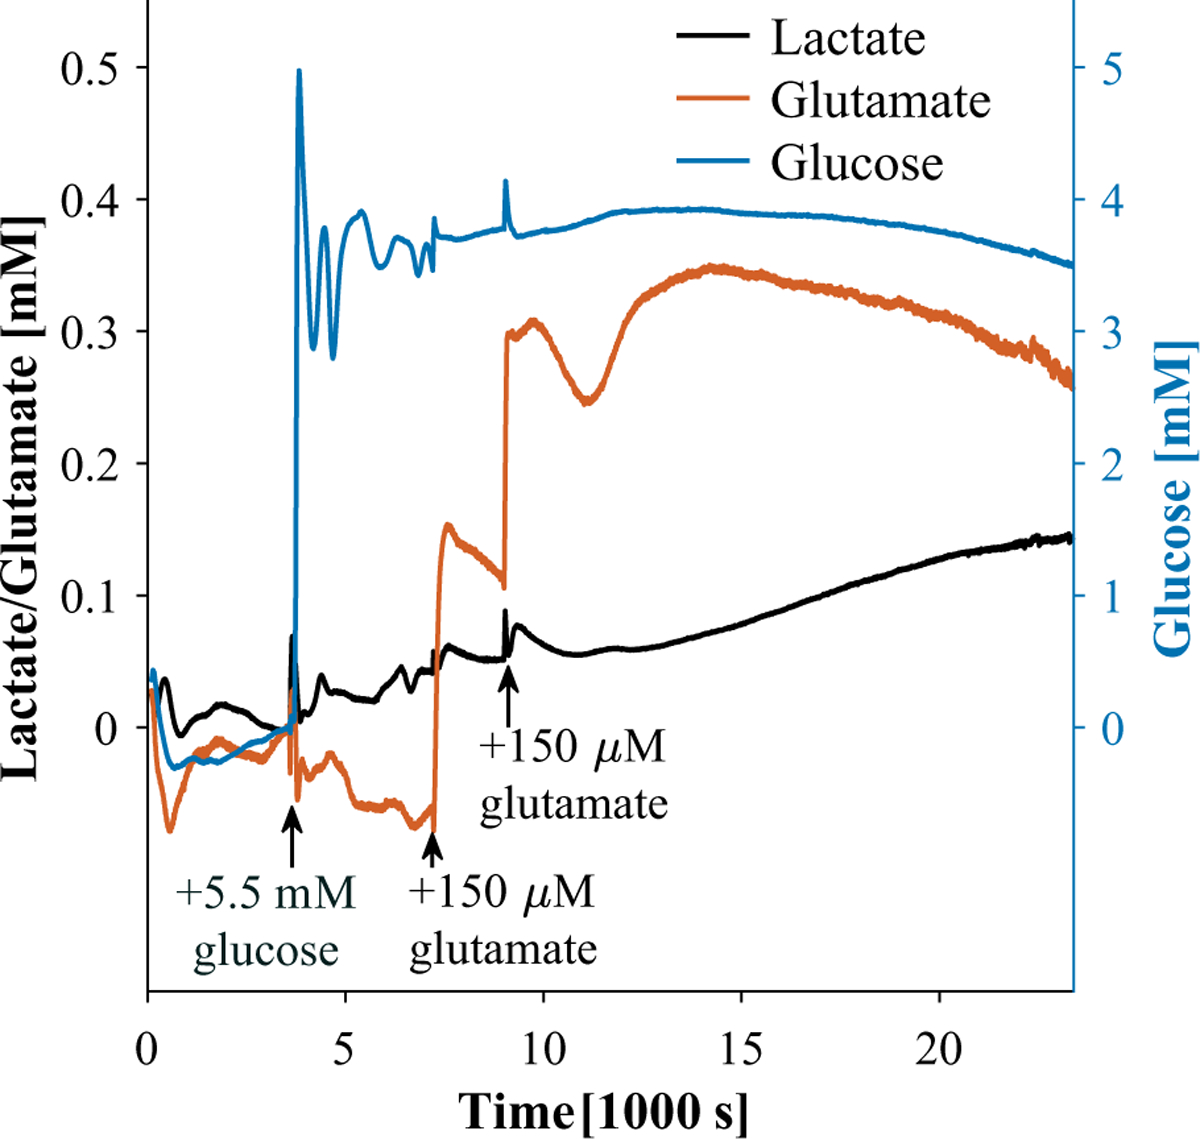
Lactate, glucose, and glutamate as a function of time 1 mm above human astrocyte culture in GFDMEM ina humidified incubator at 37 °C and 5% CO2. Note that the glucose response is significantly larger due to the larger glucose dosage to reflect a physiologically relevant concentration.
From 1 to 2 h, we measured an average of 3.6 mM glucose, 65% of the expected concentration, 5.5 mM. Sensor degradation between measurements may have contributed to this discrepancy, which we could address in the future with in situ calibration.37 Oscillations in observed glucose may be due to convective mixing. The response time during measurement appears slower because we did not stir as we did during calibration. By 6.5 h, we measured 3.5 mM, a 3% decrease from 1 to 2 h. Assuming we measured the bulk concentration, the observed glucose consumption was 20 μM/h, or 5 pM/cell/s, assuming 1.2 × 10⁶ cells at confluency. Despite our assumption of measuring the bulk concentration, we expect that transport limitations affected the observed consumption rate.37,38,57 We would expect to observe a higher consumption rate from the same number of cells in a shallower well or in a stirred well.
As for glutamate, we measured 0.153 mM 6.5 min after adding 0.15 mM, 102% of expected. After another 30 min, we added 0.15 mM glutamate more and measured an increase of 0.186 mM (from 0.113 to 0.3 mM) within 2 min, so 124% recovery. Both times we added glutamate, it decreased largely linearly for about 30 min. Glutamate consumption after adding 0.15 mM was 80 μM/h or 19 pM/cell/s. Consumption after adding another 0.15 mM was 53 μM/h or 12 pM/cell/s. Then, at around 11.2 h, glutamate unexpectedly increases again. The standard deviation of glutamate measurements was large compared with those of lactate and glucose because the glutamate bolus took longer to mix throughout our system during some measurements. We could solve this problem by delivering glucose and glutamate with syringe pumps.66
Lactate was the one analyte we did not add to the system. Lactate increased by 0.144 mM from adding 5.5 mM glucose at 1 h to the end of the measurement at 6.5 h. Assuming we measured bulk solution lactate at each time point, cells secreted lactate at a rate of 26.2 μM/h over 5.5 h, or 6 pM/cell/s. Therefore, the lactate-to-glucose ratio is 1.2. The upper limit of the lactate-to-glucose ratio is 2 because anaerobic glycolysis produces 2 mol lactate from 1 mol glucose. A higher lactate-to-glucose ratio in the presence of oxygen suggests the Warburg effect, a phenotype of cancer cells. At the other end, cells undergoing lactate acidosis, common among solid tumors, would have negligible lactate production and a low lactate-to-glucose ratio. We suspect that convection after adding 5.5 mM glucose caused transients in lactate, glutamate, and glucose measurements between 1 and 2 h. It is possible that our measurements overestimate glucose and glutamate consumption and underestimate lactate secretion since enzymatic biosensor sensitivities are expected to decrease over time during continuous measurement. We tested the lactate sensor’s response after measurement (Suppl. Fig. S3).
Biosensor Stability
Eventually, we will measure lactate, glutamate, and glucose from astrocytes and other cells by growing cells on top of the biosensor array (Fig. 1E), with devices shown in Figure 1H,I. We expect this configuration to give us more local measurements closer to cell surface concentrations than to bulk concentrations. Biosensor stability in cell culture medium at 37 °C over days of cell growth is a potential challenge in moving from a “biosensor-on-top” configuration (Fig. 1D) to a “cells-on-top” configuration (Fig. 1E). Therefore, we measured the sensitivity of biosensors over 2 days in astrocyte medium in a humidified incubator at 37 °C and 5% CO2 (Fig. 6). Figure 6A shows current as a function of time during calibrations of a glucose sensor before incubation, after 1 day of incubation, and after 2 days of incubation. The glucose sensor loses sensitivity after each day of incubation, yet it continues to function. The sensitivity decreases by 17.7% ± 8.9% per day over triplicate measurements. After 2 days in astrocyte medium, glucose biosensors maintained 56.7% ± 12.4% of their original sensitivity. By day 3, the glucose sensors’ passivation layer had failed, which kept cell culture medium from conductive lines, Ag ink connections, and stripped magnet wire.
Figure 6.
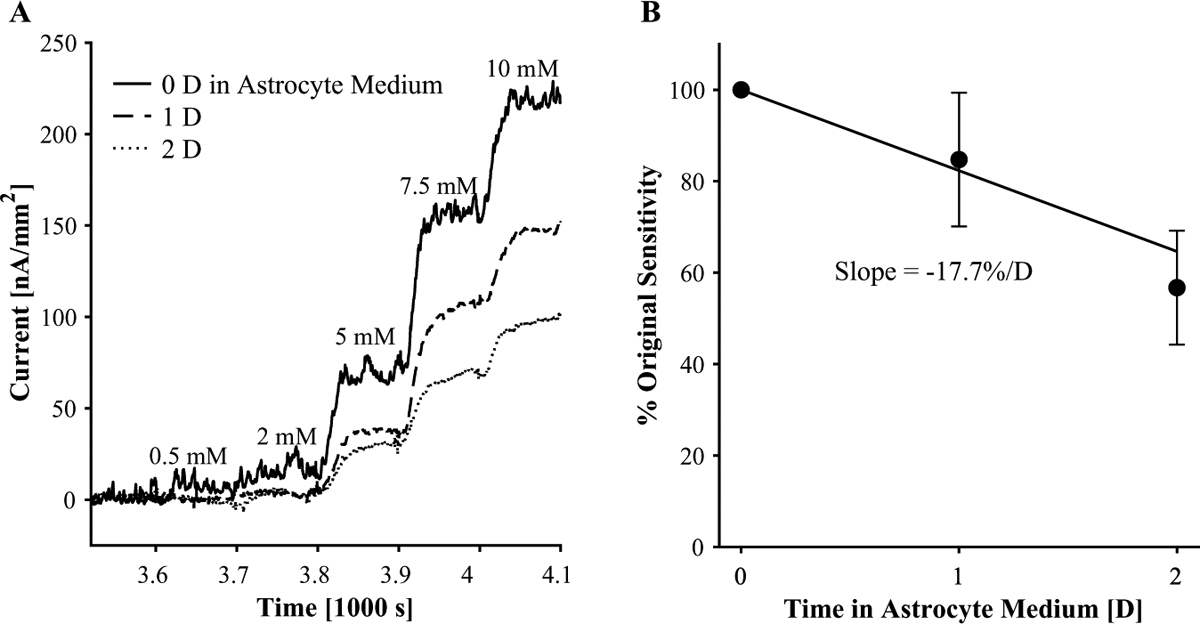
Glucose biosensor performance over 2 days of incubation (humidified, 37 °C, 5% CO2) in astrocyte medium. (A) Representative plot of current as a function of time during a calibration of a glucose sensor and then after 1 and 2 days of incubation in astrocyte medium. Corresponding glucose concentrations appear above each step. (B) Ratio of glucose sensor sensitivity to original sensitivity as a function of incubation time in astrocyte medium. The error bars correspond to standard deviations (n = 3).
The rate of glucose sensors’ degradation was similar to that of other enzyme-based biosensors.67 For example, glutamate sensors made by Ganesana et al. (2019) lost about 20% sensitivity after 1 day and 30% after 2 days of dry storage at 4 °C. Ganesana et al. also found that the same glutamate sensors measured every day for 7 days had lost 40% sensitivity, while glutamate sensors measured after only 7 days had lost only 5% sensitivity. Likewise, repeated calibrations before incubation, at days 1 and 2, probably contributed to sensitivity lost by our glucose sensors. In that case, −17% sensitivity per day in medium (humidified, 37 °C, 5% CO2) would be an overestimation. We need to further evaluate the impact of incubation on sensitivity during repeated measurement to decouple these two variables.
In addition, we will study the stability of lactate and glutamate sensors. Because astrocyte medium contains 5.5 mM glucose, it is possible that glucose sensors would degrade the fastest. In contrast to lactate oxidase and glutamate oxidase, glucose oxidase in the presence of 5.5 mM glucose would continuously produce H2O2, which would accumulate unless the biosensor is biased to 0.5 V versus Ag/AgCl. H2O2 deactivates the Pt electrodes over time.68 This would be an issue if one waited days for cells to grow on top of a biosensor array before measurement. On the other hand, one may want to continuously measure glucose, lactate, and glutamate during cell growth.
In this work, we have demonstrated the usefulness of direct writing for low-cost rapid prototyping of electrochemical biosensor arrays. Direct writing can complement other printing techniques, such as inkjet maskless lithography.69 Compared with inkjet printing, direct writing involves printing higher-viscosity materials omnidirectionally. Depending on the material, direct writing can create spanning structures in air.70 Besides rapid prototyping, an advantage of our multianalyte biosensor system is the ease of integration or direct use with conventional, commercially available cell culture systems: tissue culture plates and standard incubators. One remaining limitation of our approach is the potentiostat system. In this work, we used five individual potentiostats wired through the back of an incubator. A potentiostat with at least four channels could have been used likewise. A small, wireless multichannel potentiostat, similar to recently developed devices,71,72 into which we could simply plug devices would make our system more accessible and bring it closer to being a “smart petri dish.”
This work expands the function of biosensors arrays made by direct ink writing. Because we print extrudable and flexible components, sensing elements can be printed on any 3D or flexible substrate. We have shown here that printed enzyme-based multianalyte biosensor arrays function in a complex cell culture medium, which is a promising step toward implanting similar devices for in vivo measurements.
Supplementary Material
Acknowledgments
We thank Dr. David B. Janes, Dr. Jenna L. Rickus, Dr. Siddarth V. Sridharan, and Dr. Jose F. Rivera for their helpful discussion. We thank Dr. Jenna L. Rickus for also providing lactate oxidase and astrocytes. We also thank Dr. Sarah Calve and Mazin Hakim for their help with rheological tests. Finally, we thank L. Garrett Bangert and Barnabas T. Obeng-Gyasi for assistance during flexible biosensor calibrations.
Funding
The authors disclosed receipt of the following financial support for the research, authorship, and/or publication of this article: Division of Computer and Network Systems (grant/award no. CNS-1726865).
Footnotes
Declaration of Conflicting Interests
The authors declared no potential conflicts of interest with respect to the research, authorship, and/or publication of this article.
References
- 1.Sofroniew MV; Vinters HV Astrocytes: Biology and Pathology. Acta Neuropathol. 2010, 119, 7–35. [DOI] [PMC free article] [PubMed] [Google Scholar]
- 2.Allaman I; Bélanger M; Magistretti PJ Astrocyte–Neuron Metabolic Relationships: For Better and for Worse. Trends Neurosci. 2011, 34, 76–87. [DOI] [PubMed] [Google Scholar]
- 3.Magistretti PJ Neuron-Glia Metabolic Coupling and Plasticity. J. Exp. Biol 2006, 209 (Pt 12), 2304–2311. [DOI] [PubMed] [Google Scholar]
- 4.Vinken M Adverse Outcome Pathways and Drug-Induced Liver Injury Testing. Chem. Res. Toxicol 2015, 28, 1391–1397. [DOI] [PMC free article] [PubMed] [Google Scholar]
- 5.Bavli D; Prill S; Ezra E; et al. Real-Time Monitoring of Metabolic Function in Liver-on-Chip Microdevices Tracks the Dynamics of Mitochondrial Dysfunction. Proc. Natl. Acad. Sci. U.S.A 2016, 113, E2231–E2240. [DOI] [PMC free article] [PubMed] [Google Scholar]
- 6.Xie J; Wu H; Dai C; et al. Beyond Warburg Effect—Dual Metabolic Nature of Cancer Cells. Sci. Rep 2014, 4, 4927. [DOI] [PMC free article] [PubMed] [Google Scholar]
- 7.Yu D; Blankert B; Viré J; et al. Biosensors in Drug Discovery and Drug Analysis. Anal. Lett 2005, 38, 1687–1701. [Google Scholar]
- 8.Zhang YS; Aleman J; Shin SR; et al. Multisensor-Integrated Organs-on-Chips Platform for Automated and Continual In Situ Monitoring of Organoid Behaviors. Proc. Natl. Acad. Sci. U.S.A 2017, 114, E2293–E2302. [DOI] [PMC free article] [PubMed] [Google Scholar]
- 9.Luong JHT; Male KB; Glennon JD Biosensor Technology: Technology Push versus Market Pull. Biotechnol. Adv 2008, 26, 492–500. [DOI] [PubMed] [Google Scholar]
- 10.Ward WK; House JL; Birck J; et al. A Wire-Based Dual-Analyte Sensor for Glucose and Lactate: In Vitro and In Vivo Evaluation. Diabetes Technol. Ther 2004, 6, 389–401. [DOI] [PubMed] [Google Scholar]
- 11.Gao W; Emaminejad S; Nyein HYY; et al. Fully Integrated Wearable Sensor Arrays for Multiplexed In Situ Perspiration Analysis. Nature 2016, 529, 509–514. [DOI] [PMC free article] [PubMed] [Google Scholar]
- 12.Burmeister JJ; Coates TD; Gerhardt GA Multisite Microelectrode Arrays for Measurements of Multiple Neurochemicals In The 26th Annual International Conference of the IEEE Engineering in Medicine and Biology Society; IEEE: Piscataway, NJ, 2004; Vol. 4, pp 5348–5351. [DOI] [PubMed] [Google Scholar]
- 13.Cordeiro CA; de Vries MG; Ngabi W; et al. In Vivo Continuous and Simultaneous Monitoring of Brain Energy Substrates with a Multiplex Amperometric Enzyme-Based Biosensor Device. Biosens. Bioelectron 2015, 67, 677–686. [DOI] [PubMed] [Google Scholar]
- 14.Kurita R; Hayashi K; Fan X; et al. Microfluidic Device Integrated with Pre-Reactor and Dual Enzyme-Modified Microelectrodes for Monitoring In Vivo Glucose and Lactate. Sens. Actuators B Chem 2002, 87, 296–303. [Google Scholar]
- 15.Jobst G; Moser I; Varahram M; et al. Thin-Film Microbiosensors for Glucose–Lactate Monitoring. Anal. Chem 1996, 68, 3173–3179. [DOI] [PubMed] [Google Scholar]
- 16.Li C; Shutter LA; Wu P-M; et al. Potential of a Simple Lab-on-a-Tube for Point-of-Care Measurements of Multiple Analytes. Lab Chip 2010, 10, 1476. [DOI] [PubMed] [Google Scholar]
- 17.Kost GJ; Nguyen TH; Tang Z Whole-Blood Glucose and Lactate: Trilayer Biosensors, Drug Interference, Metabolism, and Practice Guidelines. Arch. Pathol. Lab. Med 2000, 124, 1128–1134. [DOI] [PubMed] [Google Scholar]
- 18.Yan J; Pedrosa VA; Simonian AL; et al. Immobilizing Enzymes onto Electrode Arrays by Hydrogel Photolithography to Fabricate Multi-Analyte Electrochemical Biosensors. ACS Appl. Mater. Interfaces 2010, 2, 748–755. [DOI] [PMC free article] [PubMed] [Google Scholar]
- 19.Revzin AF; Sirkar K; Simonian A; et al. Glucose, Lactate, and Pyruvate Biosensor Arrays Based on Redox Polymer/Oxidoreductase Nanocomposite Thin-Films Deposited on Photolithographically Patterned Gold Microelectrodes. Sens. Actuators B Chem 2002, 81, 359–368. [Google Scholar]
- 20.White SF; Turner APF; Bilitewski U; et al. Lactate, Glutamate and Glutamine Biosensors Based on Rhodinised Carbon Electrodes. Anal. Chim. Acta 1994, 295, 243–251. [Google Scholar]
- 21.Xie B; Danielsson B An Integrated Thermal Biosensor Array for Multianalyte Determination Demonstrated with Glucose, Urea and Penicillin. Anal. Lett 1996, 29, 1921–1932. [Google Scholar]
- 22.Li X; Zang J; Liu Y; et al. Simultaneous Detection of Lactate and Glucose by Integrated Printed Circuit Board Based Array Sensing Chip. Anal. Chim. Acta 2013, 771, 102–107. [DOI] [PubMed] [Google Scholar]
- 23.Abe H; Iwama T; Yabu H; et al. Simultaneous and Selective Imaging of Dopamine and Glutamate Using an Enzyme-Modified Large-Scale Integration (LSI)-Based Amperometric Electrochemical Device. Electroanalysis 2018, 30, 2841–2846. [Google Scholar]
- 24.Marquette CA; Degiuli A; Blum LJ Electroche-miluminescent Biosensors Array for the Concomitant Detection of Choline, Glucose, Glutamate, Lactate, Lysine and Urate. Biosens. Bioelectron 2003, 19, 433–439. [DOI] [PubMed] [Google Scholar]
- 25.Moser I; Jobst G; Urban GA Biosensor Arrays for Simultaneous Measurement of Glucose, Lactate, Glutamate, and Glutamine. Biosens. Bioelectron 2002, 17, 297–302. [DOI] [PubMed] [Google Scholar]
- 26.Palmisano F; Rizzi R; Centonze D; et al. Simultaneous Monitoring of Glucose and Lactate by an Interference and Cross-Talk Free Dual Electrode Amperometric Biosensor Based on Electropolymerized Thin Films. Biosens. Bioelectron 2000, 15, 531–539. [DOI] [PubMed] [Google Scholar]
- 27.Frebel H; Chemnitius GC; Cammann K; et al. Multianalyte Sensor for the Simultaneous Determination of Glucose, L-Lactate and Uric Acid Based on a Microelectrode Array. Sens. Actuators B Chem 1997, 43, 87–93. [Google Scholar]
- 28.Rothe J; Lewandowska MK; Heer F; et al. Multi-Target Electrochemical Biosensing Enabled by Integrated CMOS Electronics. J. Micromech. Microeng 2011, 21, 054010. [Google Scholar]
- 29.Perdomo J; Hinkers H; Sundermeier C; et al. Miniaturized Real-Time Monitoring System for L-Lactate and Glucose Using Microfabricated Multi-Enzyme Sensors. Biosens. Bioelectron 2000, 15, 515–522. [DOI] [PubMed] [Google Scholar]
- 30.Labroo P; Cui Y Graphene Nano-Ink Biosensor Arrays on a Microfluidic Paper for Multiplexed Detection of Metabolites. Anal. Chim. Acta 2014, 813, 90–96. [DOI] [PubMed] [Google Scholar]
- 31.Xiao Y; Xu L; Qi L-W Electrochemiluminescence Bipolar Electrode Array for the Multiplexed Detection of Glucose, Lactate and Choline Based on a Versatile Enzymatic Approach. Talanta 2017, 165, 577–583. [DOI] [PubMed] [Google Scholar]
- 32.Miller PR; Skoog SA; Edwards TL; et al. Multiplexed Microneedle-Based Biosensor Array for Characterization of Metabolic Acidosis. Talanta 2012, 88, 739–742. [DOI] [PMC free article] [PubMed] [Google Scholar]
- 33.Misun PM; Rothe J; Schmid YRF; et al. Multi-Analyte Biosensor Interface for Real-Time Monitoring of 3D Microtissue Spheroids in Hanging-Drop Networks. Microsyst. Nanoeng 2016, 2, 16022. [DOI] [PMC free article] [PubMed] [Google Scholar]
- 34.Eklund SE; Taylor D; Kozlov E; et al. A Microphysiometer for Simultaneous Measurement of Changes in Extracellular Glucose, Lactate, Oxygen, and Acidification Rate. Anal. Chem 2003, 76, 519–527. [DOI] [PubMed] [Google Scholar]
- 35.Pemberton R; Cox T; Tuffin R; et al. Fabrication and Evaluation of a Micro(Bio)Sensor Array Chip for Multiple Parallel Measurements of Important Cell Biomarkers. Sensors 2014, 14, 20519–20532. [DOI] [PMC free article] [PubMed] [Google Scholar]
- 36.Marinesco S, , Dale N, Eds. Microelectrode Biosensors; Humana Press: Totowa, NJ, 2013; Vol. 80. [Google Scholar]
- 37.Sridharan SV; Rivera JF; Nolan JK; et al. On-Chip Microelectrode Array and In Situ Transient Calibration for Measurement of Transient Concentration Gradients Near Surfaces of 2D Cell Cultures. Sens. Actuators B Chem 2018, 260, 519–528. [Google Scholar]
- 38.Rivera JF; Sridharan SV; Nolan JK; et al. Real-Time Characterization of Uptake Kinetics of Glioblastoma vs. Astrocytes in 2D Cell Culture Using Microelectrode Array. Analyst 2018, 143, 4954–4966. [DOI] [PubMed] [Google Scholar]
- 39.Rocchitta G; Spanu A; Babudieri S; et al. Enzyme Biosensors for Biomedical Applications: Strategies for Safeguarding Analytical Performances in Biological Fluids. Sensors 2016, 16, 780. [DOI] [PMC free article] [PubMed] [Google Scholar]
- 40.Takeichi M; Okada TS Roles of Magnesium and Calcium Ions in Cell-to-Substrate Adhesion. Exp. Cell Res 1972, 74, 51–60. [DOI] [PubMed] [Google Scholar]
- 41.Bixler GD; Bhushan B Biofouling: Lessons from Nature. Philos. Trans. R. Soc. A Math. Phys. Eng. Sci 2012, 370, 2381–2417. [DOI] [PubMed] [Google Scholar]
- 42.Carman ML; Estes TG; Feinberg AW; et al. Engineered Antifouling Microtopographies—Correlating Wettability with Cell Attachment. Biofouling 2006, 22, 11–21. [DOI] [PubMed] [Google Scholar]
- 43.Yang Q; Park H; Nguyen TNH; et al. Anti-Biofouling Implantable Catheter Using Thin-Film Magnetic Microactuators. Sens. Actuators B Chem 2018, 273, 1694–1704. [DOI] [PMC free article] [PubMed] [Google Scholar]
- 44.Park H; Raffiee AH; John SWM; et al. Towards Smart Self-Clearing Glaucoma Drainage Device. Microsyst. Nanoeng 2018, 4, 35. [DOI] [PMC free article] [PubMed] [Google Scholar]
- 45.Hellio C; Yebra D Advances in Marine Antifouling Coatings and Technologies; Woodhead: Cambridge, UK, 2009. [Google Scholar]
- 46.Cao B; Li L; Tang Q; et al. The Impact of Structure on Elasticity, Switchability, Stability and Functionality of an All-in-One Carboxybetaine Elastomer. Biomaterials 2013, 34, 7592–7600. [DOI] [PubMed] [Google Scholar]
- 47.Shen W; Das S; Vitale F; et al. Microfabricated Intracortical Extracellular Matrix-Microelectrodes for Improving Neural Interfaces. Microsyst. Nanoeng 2018, 4, 30. [DOI] [PMC free article] [PubMed] [Google Scholar]
- 48.Lewis JA Direct Ink Writing of 3D Functional Materials. Adv. Funct. Mater 2006, 16, 2193–2204. [Google Scholar]
- 49.Nguyen TNH; Nolan JK; Park H; et al. Facile Fabrication of Flexible Glutamate Biosensor Using Direct Writing of Platinum Nanoparticle-Based Nanocomposite Ink. Biosens. Bioelectron 2019, 131, 257–266. [DOI] [PMC free article] [PubMed] [Google Scholar]
- 50.Hon KKB; Li L; Hutchings IM Direct Writing Technology—Advances and Developments. CIRP Ann 2008, 57, 601–620. [Google Scholar]
- 51.Ganesan A; Zhang J How Cells Process Information: Quantification of Spatiotemporal Signaling Dynamics. Protein Sci 2012, 21, 918–928. [DOI] [PMC free article] [PubMed] [Google Scholar]
- 52.Burmeister JJ; Gerhardt GA Self-Referencing Ceramic-Based Multisite Microelectrodes for the Detection and Elimination of Interferences from the Measurement of L-Glutamate and Other Analytes. Anal. Chem 2001, 73, 1037–1042. [DOI] [PubMed] [Google Scholar]
- 53.Nguyen T; Lam S; Park H; et al. Development of Flexible Glutamate Biosensor Using Activated Carbon-Pt Microparticle Composite Ink In 2018 IEEE Sensors; IEEE: Piscataway, NJ, 2018; pp 1–4. [Google Scholar]
- 54.Corker A; Ng HC-H; Poole RJ; et al. 3D Printing with 2D Colloids: Designing Rheology Protocols to Predict ‘Printability’ of Soft-Materials. Soft Matter 2019, 15, 1444–1456. [DOI] [PubMed] [Google Scholar]
- 55.Barnes HA A Review of the Slip (Wall Depletion) of Polymer Solutions, Emulsions and Particle Suspensions in Viscometers: Its Cause, Character, and Cure. J. Nonnewton. Fluid Mech 1995, 56, 221–251. [Google Scholar]
- 56.McLamore ES; Mohanty S; Shi J; et al. A Self-Referencing Glutamate Biosensor for Measuring Real Time Neuronal Glutamate Flux. J. Neurosci. Methods 2010, 189, 14–22. [DOI] [PubMed] [Google Scholar]
- 57.Ciobanu M; Taylor DE Jr.; Wilburn JP; et al. Glucose and Lactate Biosensors for Scanning Electrochemical Microscopy Imaging of Single Live Cells. Anal. Chem 2008, 80, 2717–2727. [DOI] [PMC free article] [PubMed] [Google Scholar]
- 58.Weltin A; Slotwinski K; Kieninger J; et al. Cell Culture Monitoring for Drug Screening and Cancer Research: A Transparent, Microfluidic, Multi-Sensor Microsystem. Lab Chip 2014, 14, 138–146. [DOI] [PubMed] [Google Scholar]
- 59.Misun PM; Rothe J; Hierlemann A; et al. Real-Time Multi-Analyte Online Monitoring of 3D Cell Cultures by Integrated Enzyme-Based Biosensors in Hanging Drop Networks In 2015 Transducers—2015 18th International Conference on Solid-State Sensors, Actuators and Microsystems (TRANSDUCERS); IEEE: Piscataway, NJ, 2015; pp 1625–1628. [Google Scholar]
- 60.Tseng TT-C; Monbouquette HG Implantable Microprobe with Arrayed Microsensors for Combined Amperometric Monitoring of the Neurotransmitters, Glutamate and Dopamine. J. Electroanal. Chem 2012, 682, 141–146. [DOI] [PMC free article] [PubMed] [Google Scholar]
- 61.Belle AM; Enright HA; Mukerjee EV; et al. Measurement of Glutamate in Dorsal Root Ganglion Cell Culture with Integrated Electrochemical Biosensors In 2017 IEEE International Symposium on Medical Measurements and Applications (MeMeA); IEEE: Piscataway, NJ, 2017; pp 453–457. [Google Scholar]
- 62.Rong Z; Leitao E; Popplewell J; et al. Needle Enzyme Electrode for Lactate Measurement In Vivo. IEEE Sens. J 2008, 8, 113–120. [Google Scholar]
- 63.Schuvailo OM; Soldatkin OO; Lefebvre A; et al. Highly Selective Microbiosensors for In Vivo Measurement of Glucose, Lactate and Glutamate. Anal. Chim. Acta 2006, 573–574, 110–116. [DOI] [PubMed] [Google Scholar]
- 64.Min RW; Rajendran V; Larsson N; et al. Simultaneous Monitoring of Glucose and L-Lactic Acid during a Fermentation Process in an Aqueous Two-Phase System by On-Line FIA with Microdialysis Sampling and Dual Biosensor Detection. Anal. Chim. Acta 1998, 366, 127–135. [Google Scholar]
- 65.Yang Q; Atanasov P; Wilkins E An Integrated Needle-Type Biosensor for Intravascular Glucose and Lactate Monitoring. Electroanalysis 1998, 10, 752–757. [Google Scholar]
- 66.Scoggin JL; Tan C; Nguyen NH; et al. An Enzyme-Based Electrochemical Biosensor Probe with Sensitivity to Detect Astrocytic versus Glioma Uptake of Glutamate in Real Time in Vitro. Biosens. Bioelectron 2019, 126, 751–757. [DOI] [PubMed] [Google Scholar]
- 67.Ganesana M; Trikantzopoulos E; Maniar Y; et al. Development of a Novel Micro Biosensor for In Vivo Monitoring of Glutamate Release in the Brain. Biosens. Bioelectron 2019, 130, 103–109. [DOI] [PMC free article] [PubMed] [Google Scholar]
- 68.You T; Niwa O; Tomita M; et al. Characterization of Platinum Nanoparticle-Embedded Carbon Film Electrode and Its Detection of Hydrogen Peroxide. Anal. Chem 2003, 75, 2080–2085. [DOI] [PubMed] [Google Scholar]
- 69.Hondred JA; Stromberg LR; Mosher CL; et al. High-Resolution Graphene Films for Electrochemical Sensing via Inkjet Maskless Lithography. ACS Nano 2017, 11, 9836–9845. [DOI] [PubMed] [Google Scholar]
- 70.Ahn BY; Duoss EB; Motala MJ; et al. Omnidirectional Printing of Flexible, Stretchable, and Spanning Silver Microelectrodes. Science 2009, 323, 1590–1593. [DOI] [PubMed] [Google Scholar]
- 71.Lopin P; Lopin KV PSoC-Stat: A Single Chip Open Source Potentiostat Based on a Programmable System on a Chip. PLoS One 2018, 13, e0201353. [DOI] [PMC free article] [PubMed] [Google Scholar]
- 72.Jenkins DM; Lee BE; Jun S; et al. ABE-Stat, a Fully Open-Source and Versatile Wireless Potentiostat Project Including Electrochemical Impedance Spectroscopy. J. Electrochem. Soc 2019, 166, B3056–B3065. [Google Scholar]
Associated Data
This section collects any data citations, data availability statements, or supplementary materials included in this article.