Abstract
Background
Upper extremity MRI and proton MR spectroscopy are increasingly considered to be outcome measures in Duchenne muscular dystrophy (DMD) clinical trials.
Purpose
To demonstrate the feasibility of acquiring upper extremity MRI and proton (1H) MR spectroscopy measures of T2 and fat fraction in a large, multicenter cohort (ImagingDMD) of ambulatory and nonambulatory individuals with DMD; compare upper and lower extremity muscles by using MRI and 1H MR spectroscopy; and correlate upper extremity MRI and 1H MR spectroscopy measures to function.
Materials and Methods
In this prospective cross-sectional study, MRI and 1H MR spectroscopy and functional assessment data were acquired from participants with DMD and unaffected control participants at three centers (from January 28, 2016, to April 24, 2018). T2 maps of the shoulder, upper arm, forearm, thigh, and calf were generated from a spin-echo sequence (repetition time msec/echo time msec, 3000/20–320). Fat fraction maps were generated from chemical shift-encoded imaging (eight echo times). Fat fraction and 1H2O T2 in the deltoid and biceps brachii were measured from single-voxel 1H MR spectroscopy (9000/11–243). Groups were compared by using Mann-Whitney test, and relationships between MRI and 1H MR spectroscopy and arm function were assessed by using Spearman correlation.
Results
This study evaluated 119 male participants with DMD (mean age, 12 years ± 3 [standard deviation]) and 38 unaffected male control participants (mean age, 12 years ± 3). Deltoid and biceps brachii muscles were different in participants with DMD versus control participants in all age groups by using quantitative T2 MRI (P < .001) and 1H MR spectroscopy fat fraction (P < .05). The deltoid, biceps brachii, and triceps brachii were affected to the same extent (P > .05) as the soleus and medial gastrocnemius. Negative correlations were observed between arm function and MRI (T2: range among muscles, ρ = −0.53 to −0.73 [P < .01]; fat fraction, ρ = −0.49 to −0.70 [P < .01]) and 1H MR spectroscopy fat fraction (ρ = −0.64 to −0.71; P < .01).
Conclusion
This multicenter study demonstrated early and progressive involvement of upper extremity muscles in Duchenne muscular dystrophy (DMD) and showed the feasibility of MRI and 1H MR spectroscopy to track disease progression over a wide range of ages in participants with DMD.
© RSNA, 2020
Summary
In a multicenter study, MRI and proton MR spectroscopy demonstrated early and progressive muscle involvement of the upper extremities in participants with Duchenne muscular dystrophy.
Key Results
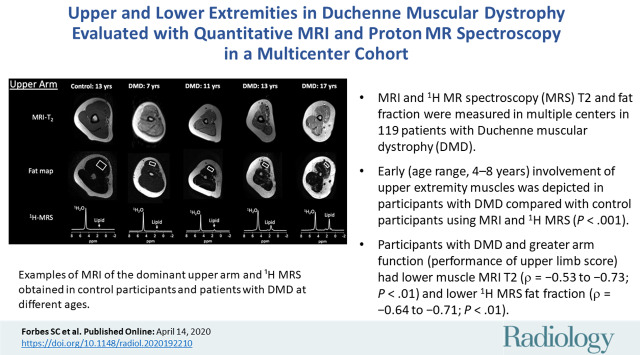
■ MRI and proton (1H) MR spectroscopy T2 and fat fraction was measured in multiple centers in 119 patients with Duchenne muscular dystrophy (DMD).
■ Early (age range, 4–8 years) involvement of upper extremity muscles was depicted in participants with DMD compared with control participants by using MRI and 1H MR spectroscopy (P < .001).
■ Participants with DMD and greater arm function (performance of upper limb score) had lower muscle MRI T2 (ρ = −0.53 to −0.73; P < .01) and lower 1H MR spectroscopy fat fraction (ρ = −0.64 to −0.71; P < .01).
Introduction
Skeletal muscle markers of disease involvement in Duchenne muscular dystrophy (DMD) by using MRI and proton (1H) MR spectroscopy are increasingly considered to be end points to evaluate potential therapeutic interventions in clinical trials (1,2). To exploit the full capabilities of MRI and 1H MR spectroscopy to track disease progression, an understanding of the natural disease course needs to be determined in a range of muscles. Considerable work has focused on lower extremity muscles in DMD (3–8) with recent interest expanding to upper extremity muscles (9–12). Validating MRI and 1H MR spectroscopy measures that can monitor disease progression in upper extremity muscles that play an important functional role (eg, eating, hygiene care, writing, and use of computer) and affect quality of life may potentially enable the inclusion of a greater number of individuals with DMD who are late ambulatory and nonambulatory in clinical trials.
Initial studies that used quantitative MRI and 1H MR spectroscopy in the upper extremities in DMD primarily focused on forearm muscles (9,13), and recent smaller studies (11,12) extended these measures to evaluate muscles in the upper arm and shoulder region. In the deltoid and biceps brachii in DMD, water T2 measured with single voxel 1H MR spectroscopy was elevated, an indicator of inflammation and/or edema (12). In a range of shoulder (deltoid, infraspinatus, and supraspinatus) (12) and upper arm muscles (biceps brachii and triceps brachii), fat fraction measured with chemical shift-encoded imaging or 1H MR spectroscopy and quantitative T2 measured with T2-weighted MRI (hereafter, MRI T2), which is also influenced by fat accumulation, were elevated (10,12). In addition, significant correlations between arm MRI and 1H MR spectroscopy measures and upper extremity functional tests (eg, performance of upper limb [PUL] and grip strength) have been observed in a small cohort (12). Overall, upper extremity MRI and 1H MR spectroscopy measures have shown considerable promise in DMD and have the potential to influence clinical trial design.
The hypothesis of our study was that MRI and 1H MR spectroscopy is a valuable tool to depict disease involvement in upper extremity muscles of DMD over a wide range of ages. The purpose of this study was to demonstrate the feasibility of acquiring upper extremity MRI and 1H MR spectroscopy measures of T2 constant and fat fraction in a large cohort of ambulatory and nonambulatory individuals with DMD across multiple centers, compare upper and lower extremity muscles by using MRI and 1H MR spectroscopy, and correlate upper extremity MRI and 1H MR spectroscopy measures to function.
Materials and Methods
The data from our prospective study were collected as part of the multicenter study, known as ImagingDMD (6–8,14,15). Our study was approved by the institutional review boards at the University of Florida, Oregon Health and Science University, and Children’s Hospital of Philadelphia. Our study complied with the Health Insurance Portability and Accountability Act, and an informed written assent and consent were both obtained from the participants and guardian before participation in the study.
Participant Recruitment
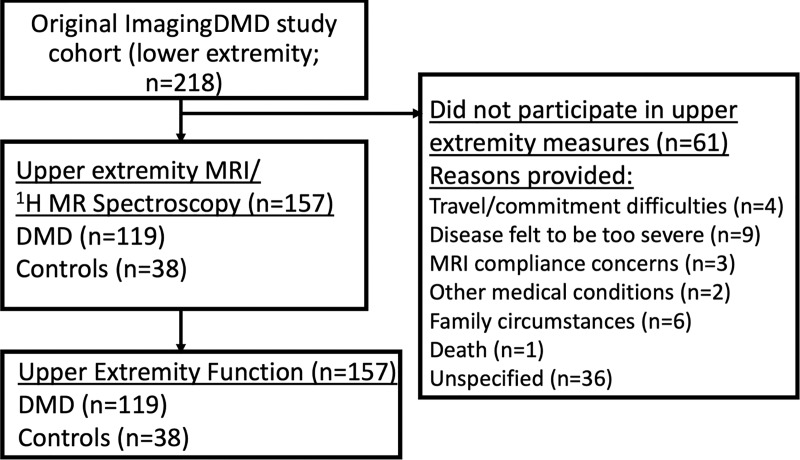
MRI and 1H MR spectroscopy and functional assessment data were acquired from 119 male participants with DMD and 38 unaffected male control participants aged 4–19 years. Lower extremity MRI data from the participants used in this cohort have been previously reported (6–8,14,15); however, our study focused on upper extremity muscle MRI measures in a large cohort at multiple centers. Five of the participants in our study also participated in a pilot upper extremity study (12). All participants were asked to avoid any excessive physical activity for 3 days before the study. Participants with DMD had genetically confirmed diagnoses or clinical symptoms before age 5 years. Participants were recruited from the United States and Canada (Fig 1), and data were acquired between Jan 28, 2016, and April 24, 2018. Participants were excluded if they had the following: contraindications to MRI, unstable medical issues, cognitive problems that would make it difficult to follow directions and participate in testing, or secondary conditions that affect muscle metabolism and/or function.
Figure 1:
Flowchart shows the recruitment of participants with Duchenne muscular dystrophy (DMD) and unaffected male control participants from the ImagingDMD cohort who had previously participated in lower extremity MRI and proton MR spectroscopy acquisitions. Reasons provided by the family for not participating in this study are included when available.
MRI and 1H MR Spectroscopy Acquisition and Functional Testing
MRI and 1H MR spectroscopy data were acquired by using a 3.0-T MRI system (Achieva Quasar Dual MRI, Philips, Best, the Netherlands; Magnetom TIM Trio, Siemens, Erlangen, Germany; Prisma Fit, Siemens; or Magnetom Verio, Siemens) without sedation from the shoulder, upper arm, forearm, thighs, and lower legs at three centers. Participants were imaged supine with their dominant arm or leg secured in standardized positions (8,12). T2-weighted multislice spin-echo axial images from MRI were acquired in each region (repetition time msec/16 echo times msec, 3000/20–320; evenly spaced). Multipolar gradient-echo images were acquired in two sets of four different echo times (repetition time msec, 430; Philips MRI system: initial echo times msec, 3.54 and 4.6, delta 4.6 msec; Siemens: initial echo time msec, 3.59 and 4.78, delta 4.78 msec). Single-voxel 1H MR spectroscopy data were acquired to measure fat fraction and water (1H2O) T2 by using stimulated-echo acquisition mode from the deltoid and biceps brachii (9000/11–243) (8). 1H MR spectroscopy voxel size was optimized for the muscle size of each participant, and therefore varied among participants (biceps brachii, 2340 mm3 ± 1266 [standard deviation]; deltoid, 4689 mm3 ± 2625). After the MRI was complete, participants performed upper extremity functional evaluation tests of the dominant arm consisting of the PUL, version 2.0 (11,16,17), the Brooke Upper Extremity Scale (18), and strength testing using MyoGrip and MyoPinch (Institute of Myology, Ateliers Laumonier, France) (19). Additional MRI and 1H MR spectroscopy and functional tests details can be found in Appendix E1 (online).
MRI Analysis
MRI and 1H MR spectroscopy data were analyzed at a single center. 1H MR spectroscopy measures of fat fraction and T2 were determined by using automated processing of spectra. Fat fraction was assessed by using area integration of the phase-corrected spectra from the lipid (0.5–2.75 parts per million) and 1H2O (4.3–5.10 parts per million) region of the spectrum by using custom written software (IDL; Exelis VIS, Herndon, Va). 1H2O and lipid signals were corrected for relaxation as previously described (20). The spectroscopic 1H2O T2 values were derived by using the amplitude of the 1H2O signal at nonlinear spaced echo times by using complex principal component analysis (21). T2 was determined by a nonlinear curve fit to the decay in water signal as a function of echo time by using a monoexponential model.
MRI-based T2 values and fat fraction values were measured for the deltoid, biceps brachii, triceps brachii, anterior forearm, posterior forearm, tibialis anterior, tibialis posterior, peroneus longus and brevis (peroneals), soleus, medial gastrocnemius, biceps femoris long head, vastus lateralis, and gracilis. T2 maps were calculated by voxel-wise estimation of T2 by fitting a single exponential equation generated by using custom-written software (IDL; Exelis VIS) with blood-flow artifact regions. For chemical shift-encoded imaging analysis, regions of interest were traced on the water map and applied to a pixel-by-pixel fat fraction map with T2* correction (22). Imaging analysis personnel had 1–22 years of experience with MRI studies (H.A., with 7 years of experience; K.V., with 22 years of experience; R.J.W., with 10 years of experience; S.C.F., with 14 years of experience; and W.T.T., with 11 years of experience; and three personnel with 3, 2, and 1 years of experience, respectively).
Statistical Analysis
Comparisons between participants with DMD and control participants were made by using Mann-Whitney test with Bonferroni correction for the four age groups (Prism Software version 8.1; GraphPad, La Jolla, Calif). Comparisons among age groups within participants with DMD or control participants were performed by using a nonparametric Kruskal-Wallis test, and when a significant difference among ages was observed, then specific age groups were compared by using a Mann-Whitney test with a Bonferroni correction. The relationship between MRI and 1H MR spectroscopy measures and function or strength in DMD were evaluated by using Spearman correlation coefficient. Statistical significance was indicated from a P value less than or equal to the Bonferroni corrected P value of .05. Statistical analyses were performed by two authors (S.C.F. and M.J.D., with >20 years of statistical analyses experience working with data sets in multicenter studies).
Results
Participant Characteristics
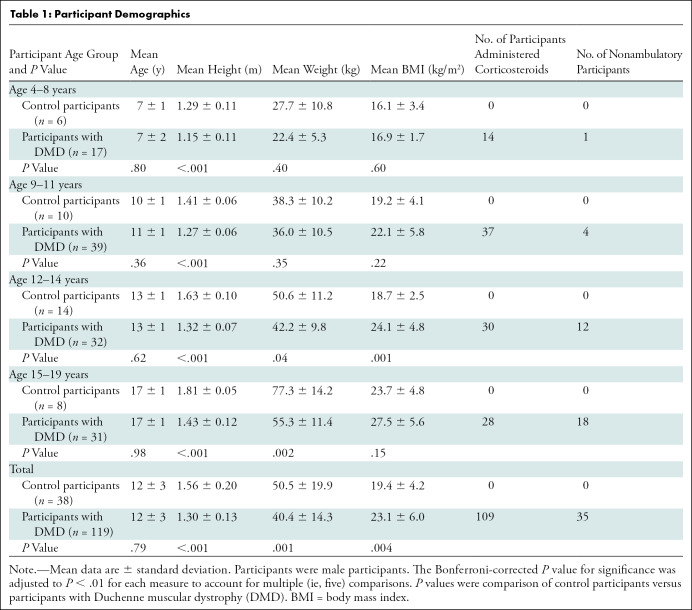
We evaluated 119 male participants with DMD (mean age, 12 years ± 3) and 38 unaffected male control participants (mean age, 12 years ± 3). In the participants with DMD, 91.6% (109 of 119) were taking corticosteroids and 29.4% (35 of 119) were nonambulatory (Table 1). Upper extremity measurements acquired with MRI and 1H MR spectroscopy were performed in all participants (Fig 2) and 82.0% (1820 of 2219) were deemed to be valid. There was similar success between participants with DMD (81.8%; 1380 of 1687) and control participants (82.7%; 440 of 532). Reasons for invalid data (18.0%; 399 of 2219) were related to motion artifacts, image inhomogeneity, poor signal-to-noise ratio, uncomfortable positioning in the magnet, and inadequate prescribed field of view or voxel placement.
Table 1:
Participant Demographics
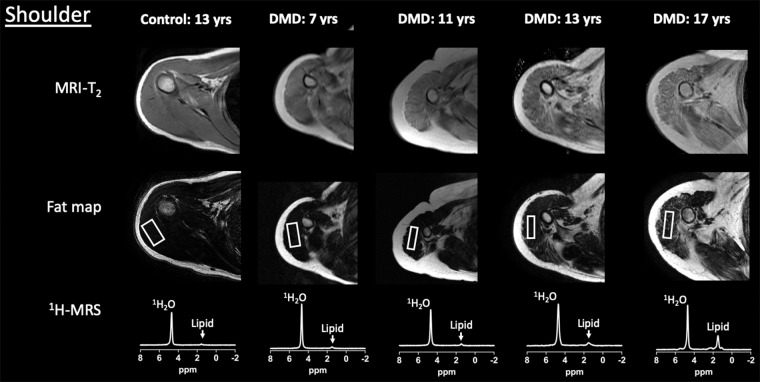
Figure 2a:
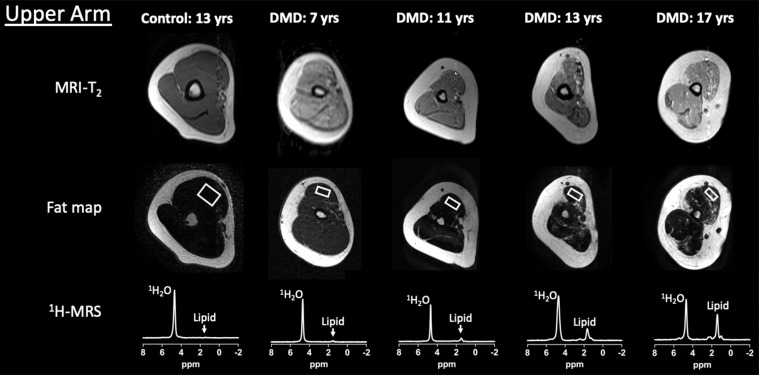
Example upper extremity MRI and proton (1H) MR spectroscopy (MRS) data acquired from the dominant (a) shoulder and (b) upper arm in control participants and participants with Duchenne muscular dystrophy (DMD) at different ages. Single voxel stimulated-echo acquisition mode 1H MR spectroscopy spectra were acquired at echo time of 27 msec from the deltoid (a) and biceps brachii (b).
Figure 2b:
Example upper extremity MRI and proton (1H) MR spectroscopy (MRS) data acquired from the dominant (a) shoulder and (b) upper arm in control participants and participants with Duchenne muscular dystrophy (DMD) at different ages. Single voxel stimulated-echo acquisition mode 1H MR spectroscopy spectra were acquired at echo time of 27 msec from the deltoid (a) and biceps brachii (b).
MRI and 1H MR Spectroscopy Comparison of Upper Extremity Muscles in Control Participants versus Participants with DMD
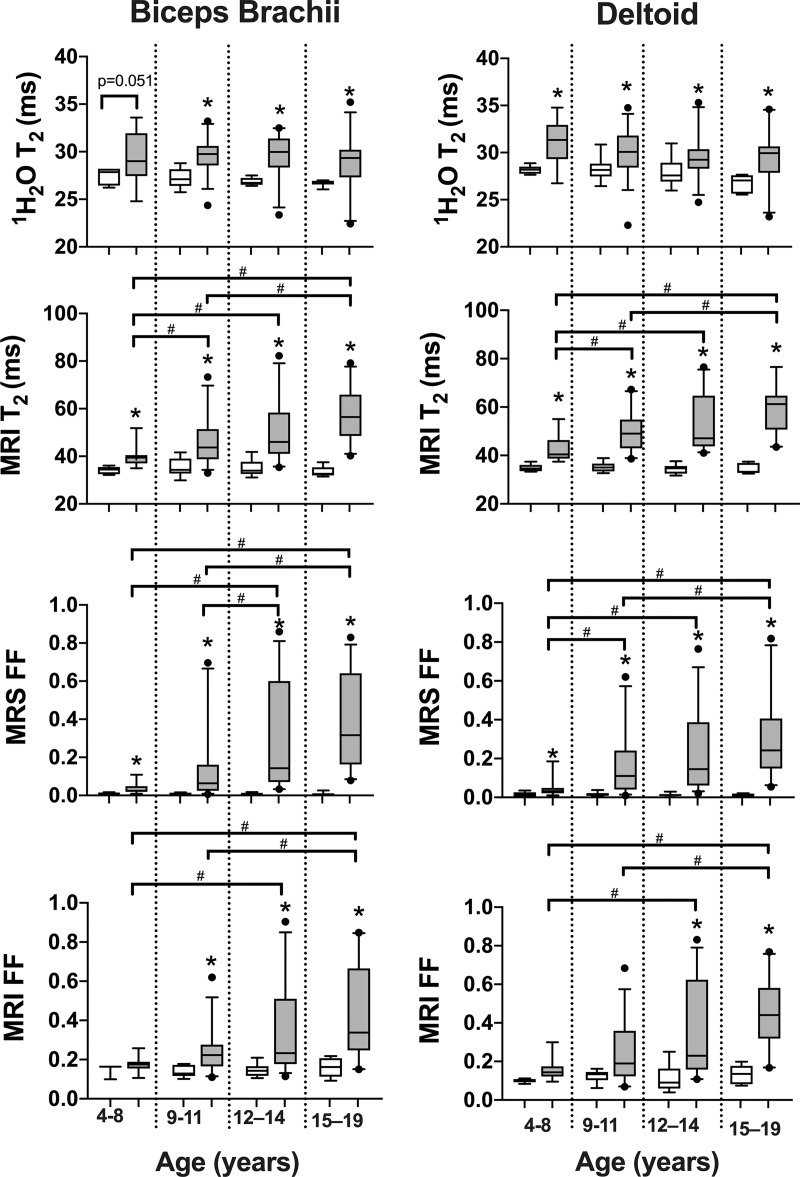
MRI T2, 1H2O T2, and fat fraction measured by using 1H MR spectroscopy and chemical shift-encoded imaging robustly distinguished control participants and participants with DMD in both the deltoid and biceps brachii across a wide range of age groups (Fig 3). Specifically, in the deltoid, MRI T2 was greater in participants with DMD compared with control participants in each age group (4–8 years, 42.7 msec ± 5.3 vs 34.9 msec ± 1.5 [P < .001]; 9–11 years, 49.7 msec ± 7.9 vs 35.2 msec ± 2.1 [P < .001]; 12–14 years, 52.8 msec ± 11.1 vs 34.4 msec ± 1.8 [P < .001]; and 15–19 years, 58.9 msec ± 10.2 vs 34.5 msec ± 2.2 [P < .001], respectively; Fig 3). Similarly, 1H MR spectroscopy 1H2O T2 was greater in participants with DMD than in control participants in each age group (4–8 years, 31.0 msec ± 2.3 vs 28.2 msec ± 0.4 [P = .01]; 9–11 years, 30.0 msec ± 2.4 vs 28.2 msec ± 1.2 [P = .004]; 12–14 years, 29.4 msec ± 2.2 vs 27.9 msec ± 1.4 [P = .01]; and 15–19 years, 29.3 msec ± 2.7 vs 26.8 msec ± 0.9 [P = .006], respectively). Also, 1H MR spectroscopy fat fraction was greater in participants with DMD than in control participants in each age group (4–8 years, 0.05 ± 0.05 vs 0.01 ± 0.01 [P = .01]; 9–11 years, 0.16 ± 0.16 vs 0.02 ± 0.01 [P < .001]; 12–14 years, 0.23 ± 0.21 vs 0.01 ± 0.01 [P < .001]; and 15–19 years, 0.30 ± 0.21 vs 0.01 ± 0.01 [P < .001], respectively). Fat fraction measured with chemical shift-encoded imaging distinguished participants with DMD and control participants in the older age groups (9–11 years, 0.25 ± 0.18 and 0.11 ± 0.04 [P = .01]; 12–14 years, 0.31 ± 0.19 vs 0.08 ± 0.04 [P < .001]; 15–19 years, 0.42 ± 0.21 and 0.13 ± 0.05 [P < .001], respectively), but not in the youngest age group (4–8 years, 0.15 ± 0.03 and 0.10 ± 0.01, respectively [P = .09]).
Figure 3:
Box and whisker plots show proton (1H) MR spectroscopy (MRS) 1H2O T2 (msec), MRI T2 (msec), MR spectroscopy fat fraction (MRS FF), and chemical shift-encoded imaging fat fraction (MRI FF) of the biceps brachii and deltoid in control participants and participants with Duchenne muscular dystrophy (DMD) in different age groups. Statistical significance was defined as a P value less than the Bonferroni-corrected P value. No differences were observed among age groups in control participants. Whisker bars represent 5th and 95th percentiles and dots are shown for outliers. * Significantly different than controls. # Significantly different between age groups in participants with DMD.
Comparison of DMD Participants across Age Groups
In control participants, no differences (P > .05) were observed in MRI T2, 1H2O T2, and fat fraction across the age groups (Fig 3). For example, in the deltoid of the control participants, MRI T2 was similar (P = .84) among age groups (4–8 years, 34.9 msec ± 1.5; 9–11 years, 35.2 msec ± 2.1; 12–14 years, 34.4 msec ± 1.8; and 15–19 years, 34.5 msec ± 2.2). However, in the deltoid of participants with DMD, MRI T2 increased with older age groups, and values were greater in the oldest age group (15–19 years, 58.9 msec ± 10.2) compared with the younger age groups (4–8 years, 42.7 msec ± 5.3 [P < .001]; and 9–11 years, 49.7 msec ± 7.9 [P = .001]). Differences between the 15–19 age group (participants with DMD, 58.8 msec ± 11.2) and the younger age groups in participants with DMD were also observed in the biceps brachii with MRI T2 (4–8 years, 40.0 msec ± 2.8 [P < .001]; and 9–11 years, 47.8 msec ± 9.9 [P < .001]). Similar to MRI T2, fat fraction measured at chemical shift-encoded imaging and 1H MR spectroscopy for both the deltoid and biceps brachii depicted differences among age groups (Fig 3). However, whereas 1H2O T2 was consistently elevated in participants with DMD compared with control participants, it was not different (P = .06) among age groups with DMD in the deltoid (4–8 years, 31.0 msec ± 2.3; 9–11 years, 30.0 msec ± 2.4; 12–14 years, 29.4 msec ± 2.2; and 15–19 years, 29.3 msec ± 2.7) or biceps brachii (P = .737; 4–8 years, 29.5 msec ± 2.7; 9–11 years, 29.6 msec ± 1.8; 12–14 years, 29.5 msec ± 2.4; and 15–19 years, 29.0 msec ± 3.0; Fig 3).
Comparison among Muscles in Participants with DMD
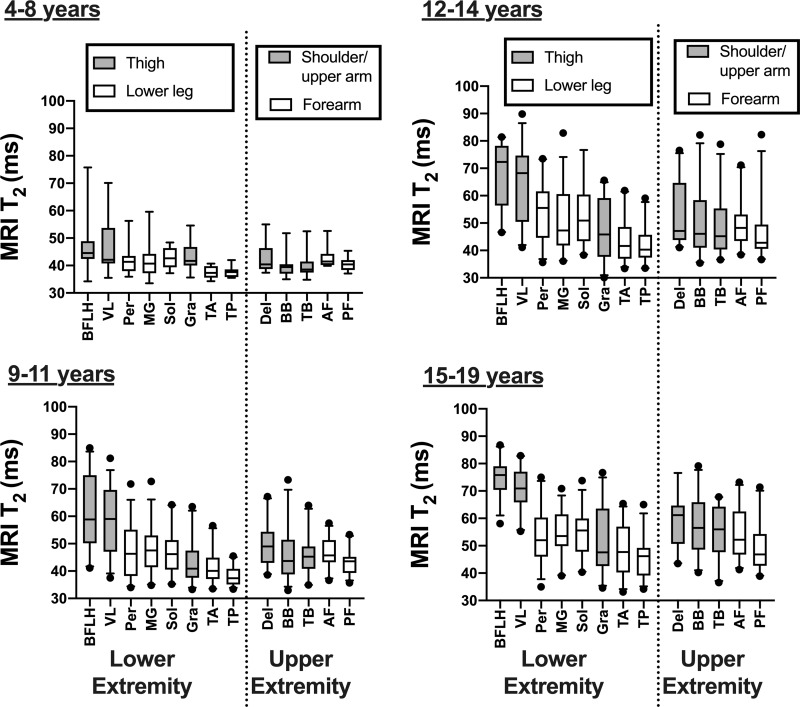
We compared differences between various muscles in the upper and lower extremities by using MRI T2 mapping (Fig 4). Proximal lower extremity muscles (biceps femoris long head and vastus lateralis) were most involved. For example, at 15–19 years, MRI T2 was greater in the biceps femoris long head (75.0 msec ± 6.3) than in the upper extremity muscles (deltoid, 58.9 msec ± 10.2 [P = .005]; biceps brachii, 57.8 msec ± 11.4 [P < .001]; triceps brachii, 55.1 msec ± 9.6 [P < .001]; anterior forearm, 54.7 msec ± 8.7 [P < .001]; and posterior forearm, 49.2 msec ± 8.6 [P < .001]). The deltoid, biceps brachii, and triceps brachii were not different (P = .06–.86) than the soleus, medial gastrocnemius, and peroneals in participants with DMD in any of the age groups. There was a pattern of proximal muscles being more involved than distal muscles in the upper extremity, and in the 15–19 age group the deltoid MRI T2 value (58.9 msec ± 10.2) was greater than the anterior (54.7 msec ± 8.7; P = .006) and posterior forearm (49.2 msec ± 8.6; P < .001).
Figure 4:
Box and whisker plots of MRI T2 in upper and lower extremity muscles in different age groups. Whisker bars represent 5th and 95th percentiles and dots are shown for outliers. AF = anterior forearm, BB = biceps brachii, BFLH = biceps femoris long head, Del = deltoid, Gra = gracilis, MG = medial gastrocnemius, Per = peroneals, PF = posterior forearm, Sol = soleus, TA = tibialis anterior, TB = triceps brachii, TP = tibialis posterior, VL = vastus lateralis.
Relationship between Upper Extremity MRI and 1H MR Spectroscopy and Functional Tests
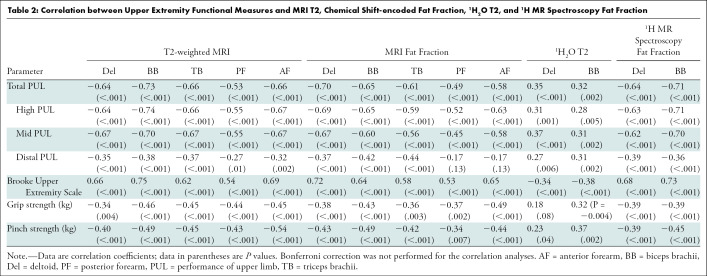
Upper extremity MRI and 1H MR spectroscopy measures in a range of muscles of DMD correlated with several of the functional and strength measures (Table 2). MRI T2 and fat fraction measures were more strongly correlated with the Brooke Upper Extremity scale (ρ = 0.53 [P < .001] to 0.75 [P < .001], respectively) compared with 1H2O T2 (ρ = −0.34 [P < .001] to −0.38 [P < .001], respectively). The MRI T2, chemical shift-encoded fat fraction, and 1H MR spectroscopy fat fraction measures of the upper extremity muscles were more strongly correlated with the total PUL (ρ = −0.49 [P < .001] to −0.73 [P < .001]), high PUL (ρ = −0.52 [P < .001] to −0.77 [P < .001]), and mid-level PUL (ρ = −0.45 [P < .001] to −0.70 [P < .001]), compared with the distal PUL (ρ = −0.17 [P < .13] to −0.39 [P < .001]) and the strength tests (grip, ρ = −0.34 [P < .004] −0.49 [P < .001]; and pinch, ρ = −0.34 [P < .007] to −0.54 [P < .001]). We also performed partial correlations with adjustments for age, and the correlations between MRI and 1H MR spectroscopy and function were similar.
Table 2:
Correlation between Upper Extremity Functional Measures and MRI T2, Chemical Shift-encoded Fat Fraction, 1H2O T2, and 1H MR Spectroscopy Fat Fraction
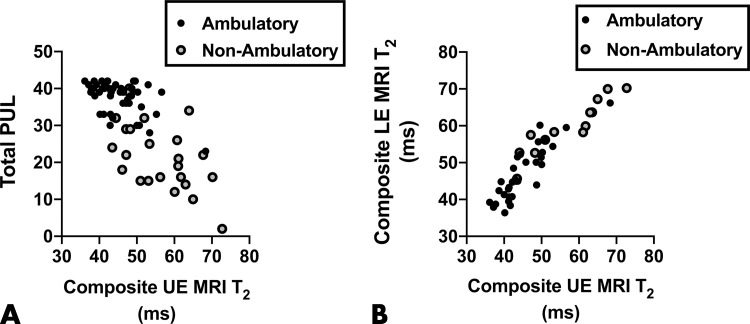
A composite of all upper extremity muscles examined with MRI (ie, average of deltoid, triceps brachii, biceps brachii, anterior forearm, and posterior forearm) was also correlated (ρ = −0.65; P < .001) to the total PUL, and significant correlations were observed in both ambulatory (ρ = −0.41; P = .003) and nonambulatory (ρ = −0.50; P = .01) groups (Fig 5, A). Furthermore, there was a strong correlation (ρ = 0.93; P < .001) between the composite upper extremity MRI measure and a composite lower extremity MRI measure (average of vastus lateralis, biceps femoris long head, gracilis, soleus, medial gastrocnemius, peroneals, tibialis anterior, and tibialis posterior) in both ambulatory (ρ = 0.88; P < .001) and nonambulatory (ρ = 0.97; P < .001) participants with DMD (Fig 5, B).
Figure 5:
Correlation scatterplots. A, Total performance of upper limb (PUL) and the composite upper extremity (UE) MRI T2 values were negatively correlated (ρ = −0.65; P < .001) in participants with Duchenne muscular dystrophy (DMD) and were negatively correlated in both ambulatory (ρ = −0.41; P = .003) and nonambulatory (ρ = −0.50; P = .01) participants with DMD when analyzed separately. B, Upper versus lower extremity (LE) MRI T2 composite measures were strongly positively correlated (ρ = 0.93; P < .001), including in both ambulatory (ρ = 0.88; P < .001) and nonambulatory (ρ = 0.97; P < .001) participants with DMD when analyzed separately.
Discussion
Our study evaluated the feasibility of acquiring upper extremity MRI and proton (1H) MR spectroscopy measures in ambulatory and nonambulatory participants with Duchenne muscular dystrophy (DMD) across multiple centers, because these measures have the potential to be valuable markers of disease progression. Upper extremity muscles (deltoid and biceps brachii) showed differences in participants with DMD compared with control participants (P < .001) by using MRI T2, water (1H2O) T2, and fat fraction measured with chemical shift-encoded imaging and 1H MR spectroscopy in a range of age groups. We also observed strong negative correlations between upper extremity MRI T2 and MRI and 1H MR spectroscopy fat fraction measures and functional outcomes, including the performance of upper limb (PUL; ρ = 0.70–0.73; P < .001).
Our findings are consistent with previous studies that reported elevated fat fraction and MRI T2 in the biceps brachii and triceps brachii in participants with DMD compared with control participants (10,12). We extended these findings by showing progression over several age groups in a large cohort by using MRI and fat fraction measures, whereas 1H2O T2 did not differ among age groups in participants with DMD. The use of fat fraction to detect disease progression in the upper extremity muscles is further supported; previous studies demonstrated the sensitivity of MRI to depict 1-year changes in the forearm in nonambulatory individuals with DMD (9,23).
In the lower extremity muscles, MRI and 1H MR spectroscopy measures of fat fraction and MRI T2 have shown strong correlation with functional abilities (6), sensitivity to depict disease progression within 1 year (7), and ability to depict therapeutic treatment with corticosteroids (14). Furthermore, MRI and 1H MR spectroscopy measures of T2 and fat fraction of muscle were previously demonstrated to be reproducible from day to day and across multiple centers (8). Relatively fewer studies have examined upper extremity muscles in DMD by using MRI and 1H MR spectroscopy (9–12,23), and, to our knowledge, no previous studies directly compared lower and upper extremity muscles by using MRI and 1H MR spectroscopy. We observed that the biceps femoris long head and vastus lateralis were the most involved muscles examined at a range of ages, followed by proximal upper extremity muscles (deltoid, biceps brachii, and triceps brachii) and lower leg muscles (peroneals, soleus, and medial gastrocnemius). Importantly, the youngest age group had proximal upper extremity involvement. Therefore, fat infiltration in arm muscles does not occur after infiltration of the legs but along with it, which is in contrast to a common perception that upper extremity muscles are not affected until later in life. Our findings are also supported by studies that showed that both upper extremity (elbow flexors) and leg extensor (rectus femoris) muscles were affected at a young age (<5 years) in participants with DMD by using US (24).
In our study, the upper extremity MRI and 1H MR spectroscopy measures of fat fraction and MRI T2 were negatively correlated with scores obtained in the PUL evaluation, positively correlated with the upper extremity Brooke scale, and negatively correlated with grip and pinch strength measures. Cross-sectional and longitudinal studies have shown that the PUL is reliable in a wide range of ages, across multiple centers, and tracks progression in DMD (16,25). Also, the PUL evaluation is well correlated with a comprehensive qualitative MRI analysis of 10 shoulder muscles, three upper arm muscles, and 15 forearm muscles evaluated by using the Mercuri scale (11). Therefore, there is considerable support that upper extremity MRI and 1H MR spectroscopy measures are strongly correlated with relevant functional abilities.
Our study had some limitations. We chose to target the muscle midbelly, typically near the maximal cross-sectional area. This allowed consistent comparisons across muscles, although we anticipate differences along the length of the muscle (26,27) because proximal and distal regions are often more affected than the midbelly. Although we captured portions of other muscles (infraspinatus and supraspinatus) we did not include these muscles in the comparisons because of potential confounding effects of the use of different regions among muscles. We also did not quantify individual muscles in the forearm because the small size of these muscles resulted in a low number of pixels within the muscle of interest on the image from MRI and reduced confidence of the quantitative measures. Because certain muscles (eg, supinator) are more involved, including multiple muscles in the region of interest may underestimate the involvement of certain forearm muscles (11,28). In addition, the chemical shift-encoded imaging approach inherently results in elevated fat fraction values at low lipid levels (control participants and young individuals with DMD) (12,20,29). Whereas there are approaches to account for this noise bias in muscle, they have not been validated across multiple centers and vendors in muscle (30). Therefore, we did not apply this correction. Finally, although we had a high overall success rate in performing the upper extremity examinations, we had fewer participants in the youngest age group (4–8 years), and positioning the participants comfortably in the MRI system became increasingly difficult with advanced disease progression and the presence of knee and hip contractures and spine deformities.
In conclusion, our multicenter study demonstrated early and progressive involvement of upper extremity muscles in participants with Duchenne muscular dystrophy (DMD) and showed the feasibility of MRI and proton MR spectroscopy to help track disease progression over a wide range of ages in participants with DMD. Future studies may consider examining the sensitivity to depict longitudinal changes and incorporating setups that minimize positioning constraints, such as whole-body imaging.
APPENDIX
Acknowledgments
Acknowledgments
We thank Eric Baetscher, BSc, Judith Steadman, Christi Swiers, and Tammy Nicholson for assistance with data acquisition; and Robert Mueller, PhD, Bing Wang, PhD, Hyunjun Park, BSc, Naphlim Olwe, BSc, and Steven Dougherty, BSc, for assistance with data analysis. Also, we are grateful to the study participants and their families for their participation in this study.
Study supported by the National Institute of Neurological Disorders and Stroke and the National Institute of Arthritis and Musculoskeletal and Skin Diseases (R01AR056973); study supported in part by NIH shared instrument grant (NIH S10OD021701 and NIH S10OD018224). A portion of this work was performed in the McKnight Brain Institute at the National High Magnetic Field Laboratory’s AMRIS Facility, which is supported by National Science Foundation Cooperative (DMR-1644779) and the State of Florida.
Disclosures of Conflicts of Interest: S.C.F. Activities related to the present article: disclosed no relevant relationships. Activities not related to the present article: disclosed grants/grants pending from NIH/NIAMS (R01 AR070101), Muscular Dystrophy Association, Italfarmaco, Sarepta Therapeutics, Summit Therapeutics, Catabasis Pharmaceuticals, Pfizer Inc., Eli Lilly. Other relationships: disclosed no relevant relationships. H.A. disclosed no relevant relationships. R.J.W. Activities related to the present article: disclosed no relevant relationships. Activities not related to the present article: disclosed travel support from MyoMRI conference. Other relationships: disclosed no relevant relationships. W.T.T. disclosed no relevant relationships. W.D.R. Activities related to the present article: disclosed no relevant relationships. Activities not related to the present article: disclosed no relevant relationships. Other relationships: disclosed money to author’s institution from Catabasis Pharmaceuticals; money to author from Italfarmaco; money to author from Sarepta Pharmaceitifal. A.M.B. disclosed no relevant relationships. U.A. disclosed no relevant relationships. D.J.W. disclosed no relevant relationships. D.J.L. Activities related to the present article: disclosed no relevant relationships. Activities not related to the present article: disclosed money to author’s institution for grants/grants pending from the Myotonic Dystrophy Foundation/Wyck Foundation. Other relationships: disclosed no relevant relationships. C.R.S. disclosed no relevant relationships. A.T.H. disclosed no relevant relationships. E.L.F. Activities related to the present article: disclosed no relevant relationships. Activities not related to the present article: disclosed money paid to author for board membership from Sarepta, Wave; disclosed grants/grants pending from PTC, Sarepta, Italfarmaco, Fibrogen Catabasis, Capricor, NS Pharma. Other relationships: disclosed no relevant relationships. G.I.T. Activities related to the present article: disclosed no relevant relationships. Activities not related to the present article: disclosed board membership from Johns Hopkins University and Roche/Genentec; disclosed grants/grants pending from NIH; disclosed travel from Johns Hopkins University and Roche. Other relationships: disclosed no relevant relationships. J.B. Activities related to the present article: disclosed no relevant relationships. Activities not related to the present article: disclosed money paid to author for consultancies from Alexion, Audentes, AveXis, Biogen, PTC Therapeutics, Sarepta, WAVE; disclosed grants/grants pending from Alexion, AveXis, Biogen, CSL Behring, Cytokinetics, Fibrogen, PTC Therapeutics, Sarepta, Summit, WAVE; disclosed payment for lectures from AveXis, Biogen. Other relationships: disclosed no relevant relationships. M.J.D. disclosed no relevant relationships. H.L.S. disclosed no relevant relationships. G.A.W. disclosed no relevant relationships. K.V. Activities related to the present article: disclosed no relevant relationships. Activities not related to the present article: disclosed grants/grants pending from Italpharmaco, Summit Therapeutics, PTC Therapeutics, Sarepta, Catabasis. Other relationships: disclosed no relevant relationships.
Abbreviations:
- DMD
- Duchenne muscular dystrophy
- PUL
- performance of upper limb
References
- 1.Strijkers GJ, Araujo ECA, Azzabou N, et al. Exploration of New Contrasts, Targets, and MR Imaging and Spectroscopy Techniques for Neuromuscular Disease - A Workshop Report of Working Group 3 of the Biomedicine and Molecular Biosciences COST Action BM1304 MYO-MRI. J Neuromuscul Dis 2019;6(1):1–30. [DOI] [PMC free article] [PubMed] [Google Scholar]
- 2.Carlier PG, Marty B, Scheidegger O, et al. Skeletal Muscle Quantitative Nuclear Magnetic Resonance Imaging and Spectroscopy as an Outcome Measure for Clinical Trials. J Neuromuscul Dis 2016;3(1):1–28. [DOI] [PMC free article] [PubMed] [Google Scholar]
- 3.Nagy S, Schädelin S, Hafner P, et al. Longitudinal reliability of outcome measures in patients with Duchenne muscular dystrophy. Muscle Nerve 2020;61(1):63–68. [DOI] [PubMed] [Google Scholar]
- 4.Wokke BH, van den Bergen JC, Versluis MJ, et al. Quantitative MRI and strength measurements in the assessment of muscle quality in Duchenne muscular dystrophy. Neuromuscul Disord 2014;24(5):409–416. [DOI] [PubMed] [Google Scholar]
- 5.Hollingsworth KG, Garrood P, Eagle M, Bushby K, Straub V. Magnetic resonance imaging in Duchenne muscular dystrophy: longitudinal assessment of natural history over 18 months. Muscle Nerve 2013;48(4):586–588. [DOI] [PubMed] [Google Scholar]
- 6.Barnard AM, Willcocks RJ, Finanger EL, et al. Skeletal muscle magnetic resonance biomarkers correlate with function and sentinel events in Duchenne muscular dystrophy. PLoS One 2018;13(3):e0194283. [DOI] [PMC free article] [PubMed] [Google Scholar]
- 7.Willcocks RJ, Rooney WD, Triplett WT, et al. Multicenter prospective longitudinal study of magnetic resonance biomarkers in a large duchenne muscular dystrophy cohort. Ann Neurol 2016;79(4):535–547. [DOI] [PMC free article] [PubMed] [Google Scholar]
- 8.Forbes SC, Walter GA, Rooney WD, et al. Skeletal muscles of ambulant children with Duchenne muscular dystrophy: validation of multicenter study of evaluation with MR imaging and MR spectroscopy. Radiology 2013;269(1):198–207. [DOI] [PMC free article] [PubMed] [Google Scholar]
- 9.Ricotti V, Evans MRB, Sinclair CDJ, et al. Upper Limb Evaluation in Duchenne Muscular Dystrophy: Fat-Water Quantification by MRI, Muscle Force and Function Define Endpoints for Clinical Trials. PLoS One 2016;11(9):e0162542. [DOI] [PMC free article] [PubMed] [Google Scholar]
- 10.Gaur L, Hanna A, Bandettini WP, Fischbeck KH, Arai AE, Mankodi A. Upper arm and cardiac magnetic resonance imaging in Duchenne muscular dystrophy. Ann Clin Transl Neurol 2016;3(12):948–955. [DOI] [PMC free article] [PubMed] [Google Scholar]
- 11.Brogna C, Cristiano L, Tartaglione T, et al. Functional levels and MRI patterns of muscle involvement in upper limbs in Duchenne muscular dystrophy. PLoS One 2018;13(6):e0199222. [DOI] [PMC free article] [PubMed] [Google Scholar]
- 12.Willcocks RJ, Triplett WT, Forbes SC, et al. Magnetic resonance imaging of the proximal upper extremity musculature in boys with Duchenne muscular dystrophy. J Neurol 2017;264(1):64–71. [DOI] [PMC free article] [PubMed] [Google Scholar]
- 13.Wary C, Azzabou N, Giraudeau C, et al. Quantitative NMRI and NMRS identify augmented disease progression after loss of ambulation in forearms of boys with Duchenne muscular dystrophy. NMR Biomed 2015;28(9):1150–1162. [DOI] [PubMed] [Google Scholar]
- 14.Arpan I, Willcocks RJ, Forbes SC, et al. Examination of effects of corticosteroids on skeletal muscles of boys with DMD using MRI and MRS. Neurology 2014;83(11):974–980. [DOI] [PMC free article] [PubMed] [Google Scholar]
- 15.Forbes SC, Willcocks RJ, Triplett WT, et al. Magnetic resonance imaging and spectroscopy assessment of lower extremity skeletal muscles in boys with Duchenne muscular dystrophy: a multicenter cross sectional study. PLoS One 2014;9(9):e106435 [Published correction appears in PLoS One 2014;9(10):e111822.]. [DOI] [PMC free article] [PubMed] [Google Scholar]
- 16.Pane M, Mazzone ES, Fanelli L, et al. Reliability of the Performance of Upper Limb assessment in Duchenne muscular dystrophy. Neuromuscul Disord 2014;24(3):201–206. [DOI] [PubMed] [Google Scholar]
- 17.Mayhew A, Mazzone ES, Eagle M, et al. Development of the Performance of the Upper Limb module for Duchenne muscular dystrophy. Dev Med Child Neurol 2013;55(11):1038–1045. [DOI] [PubMed] [Google Scholar]
- 18.Brooke MH, Griggs RC, Mendell JR, Fenichel GM, Shumate JB, Pellegrino RJ. Clinical trial in Duchenne dystrophy. I. The design of the protocol. Muscle Nerve 1981;4(3):186–197. [DOI] [PubMed] [Google Scholar]
- 19.Servais L, Deconinck N, Moraux A, et al. Innovative methods to assess upper limb strength and function in non-ambulant Duchenne patients. Neuromuscul Disord 2013;23(2):139–148. [DOI] [PubMed] [Google Scholar]
- 20.Triplett WT, Baligand C, Forbes SC, et al. Chemical shift-based MRI to measure fat fractions in dystrophic skeletal muscle. Magn Reson Med 2014;72(1):8–19. [DOI] [PMC free article] [PubMed] [Google Scholar]
- 21.Elliott MA, Walter GA, Swift A, Vandenborne K, Schotland JC, Leigh JS. Spectral quantitation by principal component analysis using complex singular value decomposition. Magn Reson Med 1999;41(3):450–455. [DOI] [PubMed] [Google Scholar]
- 22.Loughran T, Higgins DM, McCallum M, Coombs A, Straub V, Hollingsworth KG. Improving highly accelerated fat fraction measurements for clinical trials in muscular dystrophy: origin and quantitative effect of R2* changes. Radiology 2015;275(2):570–578. [DOI] [PubMed] [Google Scholar]
- 23.Hogrel JY, Wary C, Moraux A, et al. Longitudinal functional and NMR assessment of upper limbs in Duchenne muscular dystrophy. Neurology 2016;86(11):1022–1030. [DOI] [PMC free article] [PubMed] [Google Scholar]
- 24.Zaidman CM, Malkus EC, Connolly AM. Muscle ultrasound quantifies disease progression over time in infants and young boys with duchenne muscular dystrophy. Muscle Nerve 2015;52(3):334–338. [DOI] [PMC free article] [PubMed] [Google Scholar]
- 25.Ricotti V, Selby V, Ridout D, et al. Respiratory and upper limb function as outcome measures in ambulant and non-ambulant subjects with Duchenne muscular dystrophy: A prospective multicentre study. Neuromuscul Disord 2019;29(4):261–268. [DOI] [PubMed] [Google Scholar]
- 26.Chrzanowski SM, Baligand C, Willcocks RJ, et al. Multi-slice MRI reveals heterogeneity in disease distribution along the length of muscle in Duchenne muscular dystrophy. Acta Myol 2017;36(3):151–162. [PMC free article] [PubMed] [Google Scholar]
- 27.Hooijmans MT, Niks EH, Burakiewicz J, et al. Non-uniform muscle fat replacement along the proximodistal axis in Duchenne muscular dystrophy. Neuromuscul Disord 2017;27(5):458–464. [DOI] [PubMed] [Google Scholar]
- 28.Tartaglione T, Brogna C, Cristiano L, et al. Early involvement of the supinator muscle in Duchenne muscular dystrophy. Neuromuscul Disord 2018;28(1):62–63. [DOI] [PubMed] [Google Scholar]
- 29.Burakiewicz J, Sinclair CDJ, Fischer D, Walter GA, Kan HE, Hollingsworth KG. Quantifying fat replacement of muscle by quantitative MRI in muscular dystrophy. J Neurol 2017;264(10):2053–2067. [DOI] [PMC free article] [PubMed] [Google Scholar]
- 30.Liu CY, McKenzie CA, Yu H, Brittain JH, Reeder SB. Fat quantification with IDEAL gradient echo imaging: correction of bias from T(1) and noise. Magn Reson Med 2007;58(2):354–364. [DOI] [PubMed] [Google Scholar]
Associated Data
This section collects any data citations, data availability statements, or supplementary materials included in this article.


