Abstract
Purpose
To determine the performance of CT-based radiomic features for noninvasive prediction of histopathologic features of tumor grade, extracapsular spread, perineural invasion, lymphovascular invasion, and human papillomavirus status in head and neck squamous cell carcinoma (HNSCC).
Materials and Methods
In this retrospective study, which was approved by the local institutional ethics committee, CT images and clinical data from patients with pathologically proven HNSCC from The Cancer Genome Atlas (n = 113) and an institutional test cohort (n = 71) were analyzed. A machine learning model was trained with 2131 extracted radiomic features to predict tumor histopathologic characteristics. In the model, principal component analysis was used for dimensionality reduction, and regularized regression was used for classification.
Results
The trained radiomic model demonstrated moderate capability of predicting HNSCC features. In the training cohort and the test cohort, the model achieved a mean area under the receiver operating characteristic curve (AUC) of 0.75 (95% confidence interval [CI]: 0.68, 0.81) and 0.66 (95% CI: 0.45, 0.84), respectively, for tumor grade; a mean AUC of 0.64 (95% CI: 0.55, 0.62) and 0.70 (95% CI: 0.47, 0.89), respectively, for perineural invasion; a mean AUC of 0.69 (95% CI: 0.56, 0.81) and 0.65 (95% CI: 0.38, 0.87), respectively, for lymphovascular invasion; a mean AUC of 0.77 (95% CI: 0.65, 0.88) and 0.67 (95% CI: 0.15, 0.80), respectively, for extracapsular spread; and a mean AUC of 0.71 (95% CI: 0.29, 1.0) and 0.80 (95% CI: 0.65, 0.92), respectively, for human papillomavirus status.
Conclusion
Radiomic CT models have the potential to predict characteristics typically identified on pathologic assessment of HNSCC.
Keywords: CT, CT-Quantitative, Computer Applications-Detection/Diagnosis, Head/Neck, Informatics
Supplemental material is available for this article.
© RSNA, 2020
Summary
Radiomics features extracted from CT images showed moderate performance for predicting histopathologic features such as tumor grade, extracapsular spread, lymphovascular invasion, perineural invasion, and human papillomavirus status in head and neck cancers.
Key Points
■ This modeling approach demonstrated moderate area under the receiver operating characteristic curve for predicting tumor grade, extracapsular spread, lymphovascular invasion, perineural invasion, and human papillomavirus status, with the best performance achieved for predicting human papillomavirus status.
■ Radiomic CT features of head and neck carcinoma reflect tumor heterogeneity and may have the potential to predict histopathologic characteristics.
Introduction
Head and neck squamous cell carcinoma (HNSCC), which originates from the squamous epithelium of the upper aerodigestive tract, accounts for more than 60 000 new cases of cancer and 13 000 deaths yearly in the United States (1). Risk factors for HNSCC include tobacco exposure, alcohol dependence, and infection with oncogenic viruses (2). Treatment of HNSCC depends on the stage and consists of a combination of surgery, radiation, and chemotherapy. Early-stage HNSCC is typically treated with single modality therapy, either surgery or radiation, while advanced stages are typically treated with two or three modalities. Most patients with HNSCC undergo imaging before treatment (3), with CT being the most common modality. Imaging provides anatomic details regarding the extent of tumor spread, which is an integral part of the American Joint Committee on Cancer (AJCC) tumor, node, and metastasis (TNM) staging system (4). Other essential components of the evaluation of HNSCC involve histologic and molecular analyses of tissue samples (5–7).
Current standard therapies for HNSCC achieve a 40%–50% 5-year median cure rate (8). New molecular target treatments are in development to improve these outcomes (9–11). To improve tumor classification, the eighth edition of the AJCC TNM staging system (12) includes details beyond anatomy, such as extracapsular spread and human papillomavirus (HPV) status for patients with HNSCC. While perineural invasion, which is associated with an increased risk of local recurrence and cervical metastasis, and lymphovascular invasion are not currently used for diagnosis, multiple studies have shown their presence to negatively affect survival (13–16). Taken together, these histopathologic features (ie, tumor grade, lymphovascular invasion, perineural invasion, extracapsular spread, and HPV status) are not currently assessed by radiologists. A noninvasive quantitative analysis of these features could be clinically useful, particularly in cases in which biopsies are difficult to obtain or when there is tumor heterogeneity, to aid in treatment planning and consequently improve treatment decisions and prediction of prognosis.
In a typical radiomics workflow, computer vision algorithms are used to convert radiographic images into a large number of predefined image features (17) that may capture quantitative information reflecting tumor characteristics (17–20) that may not be visually apparent to a radiologist. These features can be leveraged using machine learning methods to predict diagnosis, prognosis, and molecular properties in several cancers (17,21–26), including head and neck cancer (27–33). For example, Kuno et al (31) showed significant association of CT radiomic texture features with treatment response for patients (n = 62) with primary HNSCC, and Zhang et al (34) found that CT texture and histogram analysis are associated with overall survival in patients with locally advanced HNSCC. Our hypothesis was that radiomic analysis of CT images of whole-tumor volumes can noninvasively predict relevant histopathologic characteristics of HNSCC essential for patient diagnosis and management. Our aim was to develop radiomics models to predict histopathologic features of HNSCCs using CT images.
Materials and Methods
Study Design
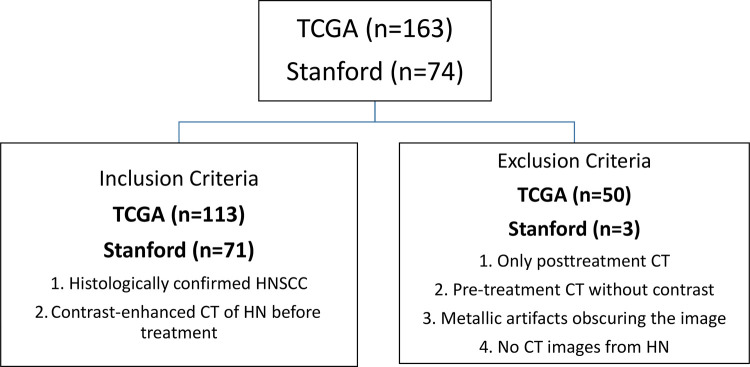
In this retrospective study, we analyzed two different HNSCC cohorts: a cohort for developing the model (The Cancer Genome Atlas [TCGA] HNSCC cohort [35]) and a Stanford HNSCC cohort for validating the model. For both data sets, inclusion criteria were patients with histologically confirmed noncutaneous HNSCC who underwent contrast material–enhanced CT of the head and neck before treatment. The exclusion criteria included the following: (a) patients with only posttreatment CT, (b) patients with no contrast-enhanced pretreatment CT scans, (c) patients for whom the contrast-enhanced pretreatment CT images were obscured by metal artifacts, and (d) patients with no CT scans of the head and neck area, even in the presence of a histologic diagnosis (Fig 1).
Figure 1:
Consort diagram demonstrates inclusion and exclusion criteria from The Cancer Genome Atlas (TCGA) cohort and test cohort. HN = head and neck, HNSCC = head and neck squamous cell carcinoma.
For the TCGA data set, the demographic and clinical data characteristics were acquired from the Genomic Data Commons Data Portal (https://portal.gdc.cancer.gov/), while CT scans of matched TCGA-HNSC patients (n = 163) were downloaded from The Cancer Imaging Archive (36) (https://wiki.cancerimagingarchive.net/) in July 2017. Analysis of this data set was conducted consistent with TCGA and The Cancer Imaging Archive data use agreement and did not require institutional review board approval. Of the original 163 patients from the TCGA cohort, 50 patients were removed for having no pretreatment CT (35 of 50 [70%]), for having severe metallic artifacts in the oral cavity (seven of 50 [14%]), or for lack of contrast-enhanced images (eight of 50 [16%]). A total of 113 patients from the TCGA were assessed.
For model validation, a retrospective Stanford HNSCC cohort (n = 74) was acquired between September 1997 and July 2017. The pathologic findings were made by the physicians, radiologists, and pathologists during treatment of the patients. The Stanford HNSCC data were obtained from Stanford Hospital with institutional review board approval from Stanford University for this retrospective study. Data were deidentified, and informed consent from patients was waived. We reviewed the medical records and obtained the clinical, histologic, and CT imaging data in accordance with the institutional review board guidelines. A subset of the patients (for whom the HPV status was available) in the Stanford HNSCC cohort was used in Huang et al (37). Of the original 74 patients, three (three of three [100%]) were excluded due to severe metallic artifacts in the oral cavity.
CT Image Acquisition
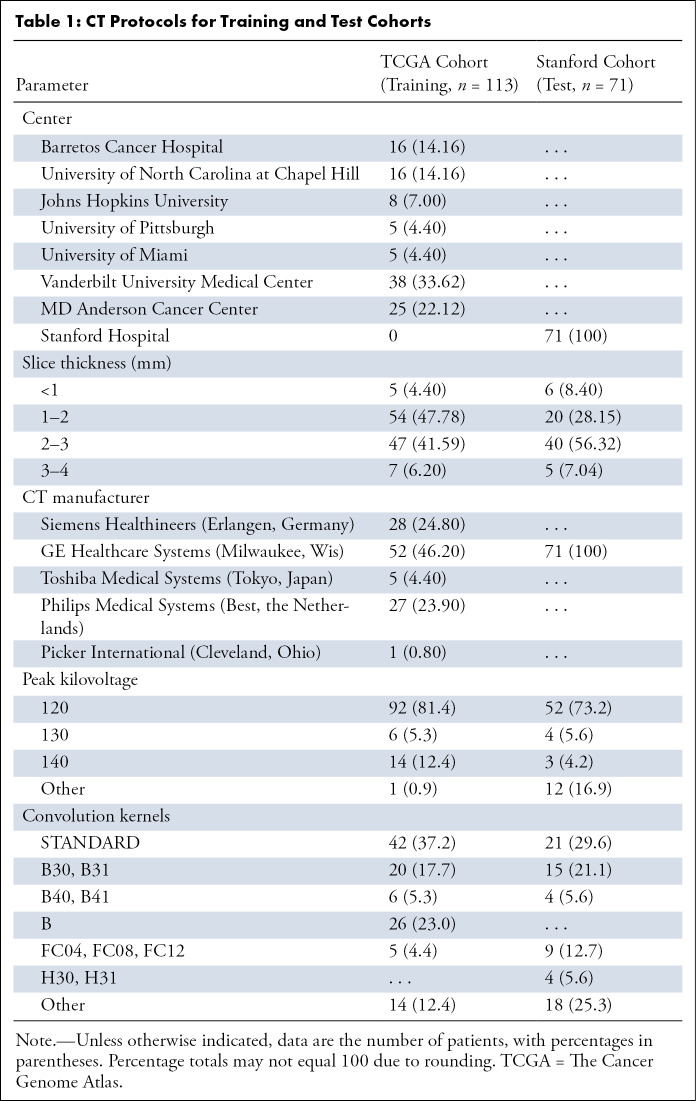
Statistics of various CT image acquisition parameters used in the training and test cohorts are summarized in Table 1. Iodinated contrast material was used for contrast enhancement of the CT scans.
Table 1:
CT Protocols for Training and Test Cohorts
Image Segmentation
All images were read and processed in the Digital Imaging and Communications in Medicine (DICOM) format. A radiologist (M.C.) with more than 10 years of experience in head and neck imaging examined each axial image of patient CT data and identified gross tumor volumes, delineating the area of the tumor in each section. For this, we used the pencil tool of a DICOM viewer (https://horosproject.org). All segmented tumors were validated by the same radiologist within 3 months after the first segmentation.
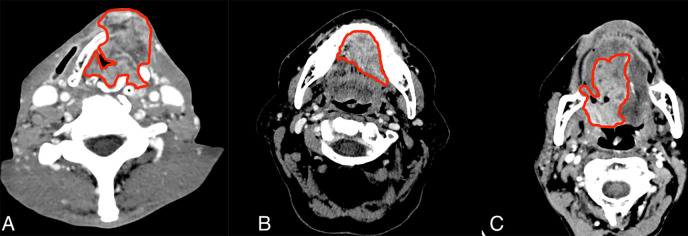
During the process of segmentation, artifacts around the tumor (airway, fat, bone, and muscle) were maximally avoided. Only tumor tissue, including solid and/or necrotic components, was included in the regions of interest. The regions of interest of the tumors were saved, and all pixels of the background outside the regions of interest of the volume of the gross tumor were set to zero before radiomic feature extraction (Fig 2).
Figure 2:
Example segmentation at axial postcontrast CT imaging. A, Squamous cell carcinoma of supraglottic larynx with anterior extralaryngeal extension. B, Left floor of mouth squamous cell carcinoma invading the genioglossus muscle and crossing the midline. C, Oropharynx squamous cell carcinoma including the base of the tongue with extension to the oral tongue.
Studied Endpoints
We studied five endpoints related to HNSCC: extracapsular spread, perineural invasion, lymphovascular invasion, tumor grade, and HPV status. All endpoints were considered as binary in the model: grade 3 against grade 1 and 2 for tumor grade, and presence or absence of extracapsular spread, lymphovascular invasion, and perineural invasion. HPV status was determined by MassARRAY spectrometry technology (Agena Bioscience; San Diego, Calif) for the TGCA cohort, while p16 status was used as a proxy for HPV status for the validation cohort.
Radiomic Feature Extraction
Three-dimensional tumor segmentations were first resampled to isometric voxels size of 1 mm × 1 mm × 1 mm, and 2131 quantitative image features were then extracted. These quantitative image features are categorized into four groups: (a) intensity-based features, (b) size and shape features, (c) texture features, and (d) filter-based features, as previously reported (23,39,40). Briefly, intensity-based features are calculated directly from the attenuation (Hounsfield intensity units), including first-order features, such as minimum, maximum, mean, or variance, and statistical features based on histograms of the intensity values. Next, shape and size features were used to quantify the three-dimensional shape and size of the tumors (eg, volume and surface area). Texture features are calculated on the basis of the spatial relationships between voxels and are further subdivided into histogram of gradients, local binary patterns, gray-level co-occurrence matrix, gray-level run length matrix, gray-level size zone matrix, and neighboring gray tone difference matrix features. Finally, the filter-based features consist of two subgroups: wavelet and Gabor features. In this case, wavelet and Gabor transformations were further applied to extract filter-transformed features for feature groups (a) and (c). The filter-based features capture higher-level abstraction of the imaging objects. All feature extraction was implemented with an in-house developed pipeline (available at https://github.com/gevaertlab/radiomics_pipeline) using Matlab 2016a (MathWorks, Natick, Mass). Description of all features and their feature classes are provided in Appendix E1 (supplement).
Machine Learning
The features obtained for the training set and the validation set were first harmonized using ComBat (https://github.com/Jfortin1/ComBatHarmonization) to address latent heterogeneity in features due to differences in CT acquisition parameters (40,41). Next, we removed radiomic features with near zero variation features using the R caret package (R Foundation for Statistical Computing, Vienna, Austria) (42). The remaining features were z-score normalized by setting the standard deviation to one and the mean to zero. Next, we used machine learning algorithms in combination with dimensionality reduction to predict clinical parameters. We used the up-resampling technique to deal with unbalanced sampling: This technique randomly samples, with replacement, the minority class to be the same size as the majority class. For dimensionality reduction, we used principal component analysis (PCA), which reduces the number of features by extracting new ones that represent a chosen percentage of variance of the initial radiomic features (43). In our study, we used PCA features representing at least 80% of the variance. Next, for classification, we used sparse logistic regression with an L1 penalty. The L1 penalty tends to assign nonzero weights to a small number of features and set the weights of remaining features to zero. This is similar to the absolute shrinkage and selection operation regression method, where a L1 penalty is added to the loss function to encourage sparsity in the selected features (44). Thus, it effectively performs feature selection by using a least absolute shrinkage and selection operator on the feature weights.
Unsupervised Analysis
For unsupervised analysis, hierarchic clustering with the Euclidean distance was used to cluster both features and patients. The grouping of features was then visualized with a heatmap created using the ComplexHeatmap package in R (44).
Statistical Analysis
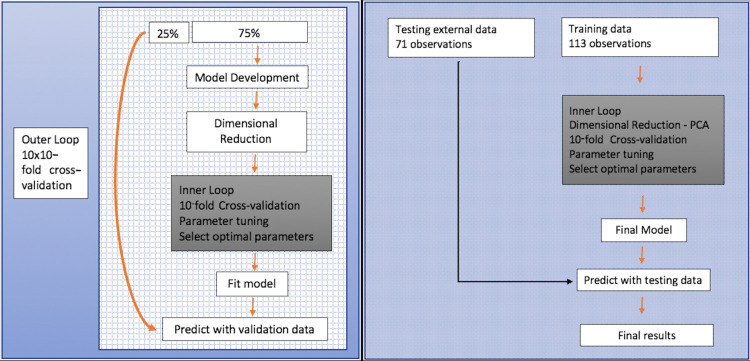
We used the two-tiered evaluation strategy illustrated in Figure 3. We first used the development cohort (ie, TCGA) in combination with 10-fold cross validation (CV) that was repeated 10 times by varying the assignment of samples to folds to evaluate the prediction of clinical parameters. Next, we extracted the optimal hyperparameters to construct a final model using the TCGA cohort and validated these models in the test cohort. We evaluated the model according to the receiver operating characteristic curve, accuracy, sensitivity, and specificity average of all iterations. We used the R software (https://www.r-project.org/), version 3.3.2, for all statistical analysis, and the models were implemented using R caret package and the glmnet package (42,44). With statistical tests, P < .05 was considered significant.
Figure 3:
Machine learning workflow for (left) training and (right) test cohort. Data analysis framework embedded with nested stratified repeated cross validation. The inner loop was used to train and select out the optimal binary classifier based only on radiomic features, while the outer loop was used to generate different resampling splits to evaluate the generalization performance of the optimal models. PCA = principal component analysis.
Results
Tumor and Patient Characteristics from the Training and Test Cohorts
To develop radiomics signatures of HNSCC clinical parameters, we extracted 2131 radiomic features from the entire tumor volume of pretreatment CT images from the TCGA and test cohorts. We selected 113 patients from the TCGA cohort as the development cohort, and we then validated models in an independent test cohort of 71 patients. For HPV status, we used a subset of data from patients for whom this information was available: 82 of 113 (73%) patients in the TCGA cohort and 52 of 71 (73%) patients in the validation cohort. In both cohorts, we only used data from patients with the target-class information and excluded the others.
There was no significant difference between the cohorts regarding sex, TNM clinical stage, and tumor grade (Table 2). Differences were observed between the two cohorts for smoking (Fisher exact P value, <.001, ignoring missing values) and alcohol history (Fisher exact P value, <.001, ignoring missing values). The TCGA cohort contained a higher percentage of patients with smoking and alcohol history compared with that of the test cohort (Table 2). Concerning perineural invasion and primary site of the tumor and considering patients for whom the data were available, most patients in the TCGA cohort had positive perineural invasion, more than 50% of which were from the oral cavity, while in the test cohort most tumors were from the oropharynx (36 of 71 [51%]) with no perineural invasion (37 of 50 [74%]). Significant differences also exist between the cohorts with regard to HPV status, with 25 of 82 (30%) patients in the TCGA cohort being HPV positive, compared with 38 of 52 (73%) patients in the validation cohort. A possible reason for such a large difference is that the proportion of oropharyngeal cancers is much higher in the validation cohort than in the TCGA cohort (51% and 22%, respectively) based on the demographics of HNSCC at our institution, and the prevalence of the HPV-positive subtype is much larger in the oropharynx than in other locations in the head and neck.
Table 2:
Clinical Summary Statistics of the Training and Test Cohorts

Unsupervised Analysis
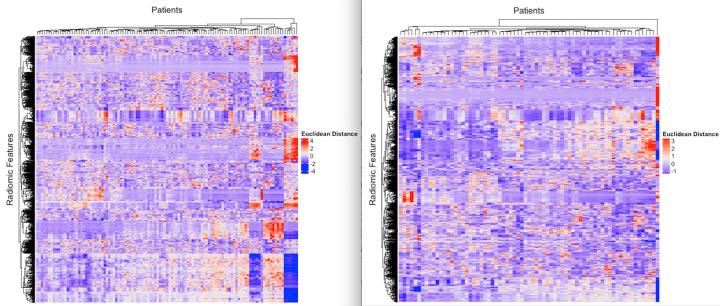
To perform a descriptive analysis of the radiomic features, we used unsupervised clustering to evaluate any grouping of features according to scanner differences (Table 1). We observed that there was no grouping of features according to the parameters evaluated (Fig 4).
Figure 4:
Heatmaps represent unsupervised analysis of radiomic features in the rows and patients in the columns. The color scale reflects the Euclidean distance between radiomic features (red = high distance, white = 0 distance, purple = low Euclidean distance). The left panel is the Stanford cohort, and the right panel is The Cancer Genome Atlas cohort.
Supervised Analysis in the TCGA Cohort
For each patient CT image in the TCGA cohort (n = 113), we performed manual segmentation of the whole-tumor volume and then used this volume for radiomic features extraction. This extraction resulted in 2131 features in our pipeline. After harmonization using ComBat, the radiomic features were used in a multivariate model to predict each endpoint using regression analysis. First, the model extracted new features through PCA representing at least 80% of the variance, which resulted in 25–35 features, depending on the endpoint and training subset during CV. We also collected the optimal hyperparameters of the model retained in each optimal least absolute shrinkage and selection operator classifier across the outer CV loop of the nested stratified 10 × 10–fold CV. Finally, we evaluated the performance in the training cohort through the outer 10-fold CV loop using the area under the receiver operating characteristic curve (AUC) metric.
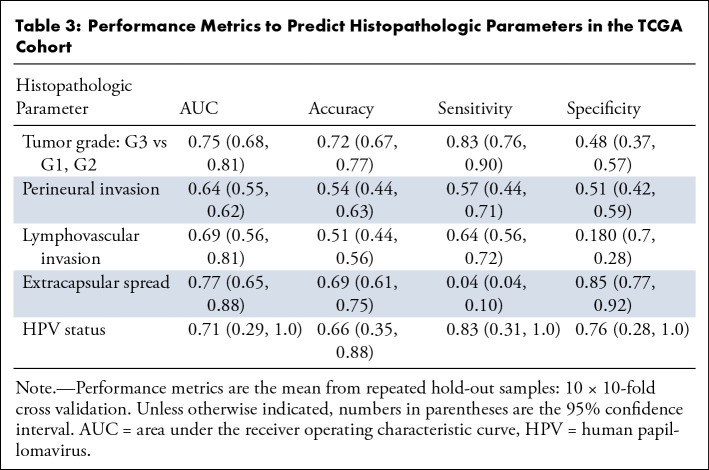
We measured the performance of our model for five different endpoints: HPV status, tumor grade, perineural invasion, lymphovascular invasion, and extracapsular spread (Table 3). The model demonstrated a moderate ability to predict HPV status, tumor grade, and extracapsular spread, with a mean AUC of the 10 × 10–fold CV of 0.71, 0.75, and 0.77, respectively. Perineural invasion and lymphovascular invasion demonstrated a mild performance, with a mean AUC of 0.64 and 0.69, respectively.
Table 3:
Performance Metrics to Predict Histopathologic Parameters in the TCGA Cohort
External Validation of the TCGA Prediction Model
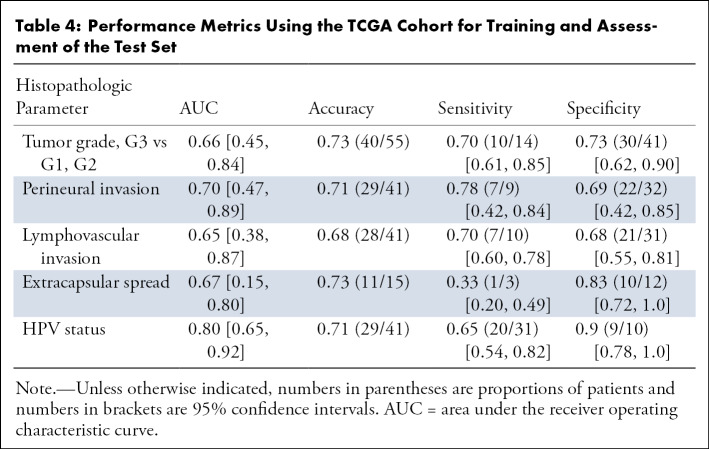
After extracting the best hyperparameters from the 10 outer CV loops on the training cohort, we built a final model on the TCGA data and tested the modeling in a test cohort. Our model for HPV status showed strong validation performance, with a mean AUC of 0.80 (Fig 5). The tumor grade and extracapsular spread models demonstrated moderate validation ability with an AUC of 0.66 and 0.67, respectively, in the test cohort. The perineural invasion and lymphovascular invasion models achieved an AUC of 0.70 and 0.65, respectively (Table 4).
Figure 5:
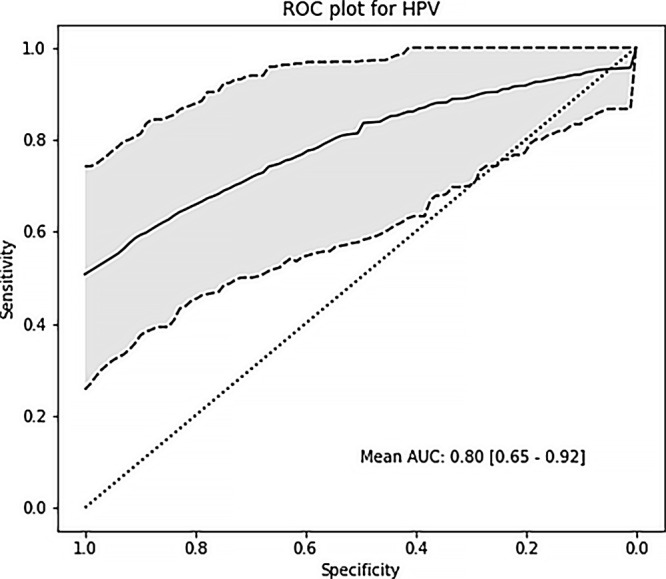
Receiver operating characteristic curve (ROC) shows the results of prediction analysis on the test cohort for human papillomavirus (HPV) status with a mean area under the curve (AUC) of 0.80.
Table 4:
Performance Metrics Using the TCGA Cohort for Training and Assessment of the Test Set
Robustness Analysis
Because all of the tumor segmentations were done by a single radiologist, we performed robustness analysis using in silico image perturbations following Zwanenburg et al (46), as in Huang et al (37) and Kim et al (47). Specifically, we used the RVC pipeline comprising rotation (R), volume adaptation (V), and contour randomization (C) using the same parameters as used in Zwanenburg et al (46). We performed the robustness analysis on the features obtained after dimensionality reduction using PCA on the training set, since these are the features for the logistic regression classifier. For the 29 features obtained by PCA (explaining about 80.3% of the total variance), we obtained a mean intraclass correlation coefficient (48) of 0.75 ± 0.09 (standard deviation), which implies that the features obtained after PCA were quite robust to variation in tumor segmentations.
Discussion
Our data show that a whole-tumor volumetric radiomic CT analysis can allow noninvasive prediction of relevant histopathologic HNSCC parameters for diagnosis and influencing patient treatment compared with the reference standard of tissue sampling. We present CT-based radiomics models that show strong-to-moderate power to predict HPV status, extracapsular spread, tumor grade, lymphovascular invasion, and perineural invasion. Our results show the feasibility of a noninvasive examination to predict HNSCC parameters that are correlated with prognosis by using radiomic signatures. We validated our model in an external cohort, and the results demonstrated satisfactory performance for predicting HPV status, extracapsular spread, and tumor grade. This study can motivate larger studies that may lead to updated models and an increase in predictive performance.
Regarding radiomics in HNSCC, other investigators have primarily studied the relationship between radiomic features and treatment response or survival. Bogowicz et al (49) demonstrated that a radiomic CT signature predicts local tumor control in patients with HNSCC treated with definitive radiation therapy and chemotherapy and achieved an AUC of 0.75 and 0.78 for training and validation, respectively. Parmar et al (50) demonstrated an association of radiomic feature clusters with prognosis (concordance index, 0.68), HPV status (AUC, 0.58), and stage (AUC, 0.77). Recently, Leijenaar et al (20) considered the prediction of HPV (p16) status in a multicenter cohort (n = 778) of patients with oropharyngeal HNSCC and reported an AUC of 0.76 in a validation set comprising a randomly chosen 20% of the full cohort (n = 150). Further, they reported no significant difference in AUC when including or excluding CT scans with artifacts in training and validation sets. They also confirmed the well-established fact that HPV-positive oropharyngeal HNSCCs are associated with better prognosis compared with HPV-negative cancers. We report considerably better results in predicting HPV status (mean AUC, 0.80 in an external validation cohort).
Tumor grade is an important prognostic indicator for HNSCC, and the histologic classification consists of three different types: well differentiated, moderately differentiated, and poorly differentiated. Ahn et al (51) investigated the efficacy of histogram analysis of apparent diffusion coefficient maps at MRI to predict HNSCC grade and found a significant difference in the mean apparent diffusion coefficient value of the tumor volume using a b value of 2000 sec/mm2. We found an AUC of 0.75 and 0.66 in the training and testing cohorts, respectively, for tumor grade using our CT-based model.
Perineural invasion is defined as the movement of cancer cells into the neural space, usually into small nerves. The diagnosis is based on histologic samples, and perineural invasion is associated with local-regional recurrence and decreased survival (52). Routine CT or MRI can often identify perineural spread, which is macroscopic perineural growth along major peripheral neural branches (53), but such imaging cannot identify perineural invasion. In our study we observed a mean AUC of 0.64 in the TCGA cohort and 0.70 in the test cohort. Extracapsular spread is another histologic prognostic factor that relates to extension of tumor beyond the lymph node capsule in nodal metastasis. It is correlated with increased risk of local recurrence and distant metastases (54) and is now part of the eighth edition of the AJCC Cancer Staging Manual. Url et al tested the efficacy of radiologists to assess extracapsular spread on CT scans in a retrospective study, reporting a sensitivity of 73% and specificity of 91% for extracapsular spread with two blinded radiologists (55). To our knowledge, no previous study tried to correlate radiomic CT features of the primary tumor to predict extracapsular spread in HNSCC. Our results show that radiomics of the primary tumor is not able to achieve the same performance for identifying extracapsular spread as radiologists, likely because our radiomic feature extraction is limited to the study of the primary lesion only. However, it showed a significant nonrandom prediction performance on independent validation (AUC, 0.67), suggesting that the radiographic appearance of the primary tumor reflects extracapsular spread.
Our study had several limitations. First, our study was retrospective and had a relatively small cohort size. Second, the TCGA cohort was a multi-institutional cohort and hence is heterogeneous in terms of CT acquisition parameters such as slice thickness, pixel spacing, and exposure. Previous studies show that acquisition parameters, especially slice thickness, pixel spacing, and gray-level discretization can have a considerable effect on radiomic texture features (56–60). We resampled the images prior to feature extraction, mitigating the effect of varying slice thickness and pixel spacing to a large extent. We used ComBat to further harmonize the radiomic features, and we expected the features obtained by linearly combining the normalized raw features in the PCA step to be even less sensitive to the variability of CT acquisition parameters. Third, all tumor segmentations were performed by a single radiologist. To address this limitation, we performed robustness analysis using in silico image perturbations following the method of Zwanenburg et al (46). Fourth, our model did not include clinical information (eg, smoking status) that could potentially improve performance (49). Our data set had a wide range of tumor sizes, and in the case of small tumors, some of the radiomic feature extraction may have been compromised by partial volume effects (61). Additionally, we assessed patient images from only one time point. Comparing radiomic features of the same patient before and after treatment can also provide additional new information (62).
In conclusion, our model demonstrated the potential to predict tumor characteristics typically based on tissue examination (eg, HPV status, tumor grade, lymphovascular invasion, extracapsular spread) in HNSCC in a noninvasive way for individual patients. Continued development of radiomics will be needed to determine the best operating points for each radiomic signature, leading to the desired sensitivity and specificity. Future studies with standardized cohorts likely will lead to an increase of the performance of HNSCC radiomics based on the internal CV results. Thus, our work contributes to the body of evidence that radiomics can predict not only patient outcome and prognosis, but also histopathologic tumor characteristics for patients with HNSCC. The continued development of radiomic signatures has the promise to contribute to a more personalized and potentially improved treatment for HNSCC.
APPENDIX
Supported by the National Institute of Biomedical Imaging and Bioengineering of the National Institutes of Health under award number R01EB020527. The content is solely the responsibility of the authors and does not necessarily represent the official views of the National Institutes of Health. M.C. was supported by São Paulo State Foundation for Teaching and Research (FAPESP). C.H. and S.Z. were supported by the China Scholarship Council (201606320087) and the China Medical Board (CMB) Collaborating Program (15-216). The funders had no role in study design, data collection and analysis, decision to publish, or preparation of the manuscript.
P.M. and M.C. contributed equally to this work.
Disclosures of Conflicts of Interest: P.M. disclosed no relevant relationships. M.C. disclosed no relevant relationships. C.H. disclosed no relevant relationships. M.Z. disclosed no relevant relationships. S.Z. disclosed no relevant relationships. A.D.C. Activities related to the present article: grants from Abbvie, AstraZeneca, Atara, Bristol-Squibb Pharmaceuticals, CellSight Technologies, Cullinan, Exelis, Innate Pharma, Tessa Therapeutics, and Threshold Pharmaceuticals; consulting fees from Aduro Biotech, Atara, Biopharma, Biotherapeutics, COTA, Cue, IQVIA RDS, KeyQuest Health, Loxo Oncology, PRA Health Sciences, Pfizer, and Rakuten Medical. Activities not related to the present article: employment with Stanford University. Other relationships: disclosed no relevant relationships. N.F. disclosed no relevant relationships. O.G. disclosed no relevant relationships.
Abbreviations:
- AJCC
- American Joint Committee on Cancer
- AUC
- area under the receiver operating characteristic curve
- CI
- confidence interval
- CV
- cross validation
- HNSCC
- head and neck squamous cell carcinoma
- HPV
- human papillomavirus
- PCA
- principal component analysis
- TCGA
- The Cancer Genome Atlas
References
- 1.Siegel RL, Miller KD, Jemal A. Cancer statistics, 2018. CA Cancer J Clin 2018;68(1):7–30. [DOI] [PubMed] [Google Scholar]
- 2.Marur S, Forastiere AA. Head and neck squamous cell carcinoma: update on epidemiology, diagnosis, and treatment. Mayo Clin Proc 2016;91(3):386–396. [DOI] [PubMed] [Google Scholar]
- 3.Som PM, Curtin HD, Mancuso AA. Imaging-based nodal classification for evaluation of neck metastatic adenopathy. AJR Am J Roentgenol 2000;174(3):837–844. [DOI] [PubMed] [Google Scholar]
- 4.Adelstein D, Gillison ML, Pfister DG, et al. NCCN guidelines insights: head and neck cancers, version 2.2017. J Natl Compr Canc Netw 2017;15(6):761–770. [DOI] [PubMed] [Google Scholar]
- 5.Campbell JD, Yau C, Bowlby R, et al. Genomic, pathway network, and immunologic features distinguishing squamous carcinomas. Cell Rep 2018;23(1):194–212.e6 [DOI] [PMC free article] [PubMed] [Google Scholar]
- 6.Brennan K, Shin JH, Tay JK, et al. NSD1 inactivation defines an immune cold, DNA hypomethylated subtype in squamous cell carcinoma. Sci Rep 2017;7(1):17064. [DOI] [PMC free article] [PubMed] [Google Scholar]
- 7.Brennan K, Koenig JL, Gentles AJ, Sunwoo JB, Gevaert O. Identification of an atypical etiological head and neck squamous carcinoma subtype featuring the CpG island methylator phenotype. EBioMedicine 2017;17:223–236. [DOI] [PMC free article] [PubMed] [Google Scholar]
- 8.Ausoni S, Boscolo-Rizzo P, Singh B, et al. Targeting cellular and molecular drivers of head and neck squamous cell carcinoma: current options and emerging perspectives. Cancer Metastasis Rev 2016;35(3):413–426. [DOI] [PMC free article] [PubMed] [Google Scholar]
- 9.Santuray RT, Johnson DE, Grandis JR. New therapies in head and neck cancer. Trends Cancer 2018;4(5):385–396. [DOI] [PMC free article] [PubMed] [Google Scholar]
- 10.Ling DC, Bakkenist CJ, Ferris RL, Clump DA. Role of immunotherapy in head and neck cancer. Semin Radiat Oncol 2018;28(1):12–16. [DOI] [PubMed] [Google Scholar]
- 11.Kozakiewicz P, Grzybowska-Szatkowska L. Application of molecular targeted therapies in the treatment of head and neck squamous cell carcinoma. Oncol Lett 2018;15(5):7497–7505. [DOI] [PMC free article] [PubMed] [Google Scholar]
- 12.Byrd DR, Greene FL. The eighth edition of TNM: implications for the surgical oncologist. Ann Surg Oncol 2018;25(1):10–12. [DOI] [PubMed] [Google Scholar]
- 13.Fagan JJ, Collins B, Barnes L, D’Amico F, Myers EN, Johnson JT. Perineural invasion in squamous cell carcinoma of the head and neck. Arch Otolaryngol Head Neck Surg 1998;124(6):637–640. [DOI] [PubMed] [Google Scholar]
- 14.Jardim JF, Francisco ALN, Gondak R, Damascena A, Kowalski LP. Prognostic impact of perineural invasion and lymphovascular invasion in advanced stage oral squamous cell carcinoma. Int J Oral Maxillofac Surg 2015;44(1):23–28. [DOI] [PubMed] [Google Scholar]
- 15.Liu SA, Wang CC, Jiang RS, Lee FY, Lin WJ, Lin JC. Pathological features and their prognostic impacts on oral cavity cancer patients among different subsites: a singe institute’s experience in Taiwan. Sci Rep 2017;7(1):7451. [DOI] [PMC free article] [PubMed] [Google Scholar]
- 16.Jones HB, Sykes A, Bayman N, et al. The impact of lymphovascular invasion on survival in oral carcinoma. Oral Oncol 2009;45(1):10–15. [DOI] [PubMed] [Google Scholar]
- 17.Aerts HJWL, Velazquez ER, Leijenaar RTH, et al. Decoding tumour phenotype by noninvasive imaging using a quantitative radiomics approach. Nat Commun 2014;5(1):4006. [DOI] [PMC free article] [PubMed] [Google Scholar]
- 18.Lambin P, Rios-Velazquez E, Leijenaar R, et al. Radiomics: extracting more information from medical images using advanced feature analysis. Eur J Cancer 2012;48(4):441–446. [DOI] [PMC free article] [PubMed] [Google Scholar]
- 19.Avanzo M, Stancanello J, El Naqa I. Beyond imaging: the promise of radiomics. Phys Med 2017;38:122–139. [DOI] [PubMed] [Google Scholar]
- 20.Leijenaar RT, Bogowicz M, Jochems A, et al. Development and validation of a radiomic signature to predict HPV (p16) status from standard CT imaging: a multicenter study. Br J Radiol 2018;91(1086):20170498. [DOI] [PMC free article] [PubMed] [Google Scholar]
- 21.Zhou M, Leung A, Echegaray S, et al. Non-small cell lung cancer radiogenomics map identifies relationships between molecular and imaging phenotypes with prognostic implications. Radiology 2018;286(1):307–315. [DOI] [PMC free article] [PubMed] [Google Scholar]
- 22.Joye I, Debucquoy A, Deroose CM, et al. Quantitative imaging outperforms molecular markers when predicting response to chemoradiotherapy for rectal cancer. Radiother Oncol 2017;124(1):104–109. [DOI] [PMC free article] [PubMed] [Google Scholar]
- 23.Gevaert O, Echegaray S, Khuong A, et al. Predictive radiogenomics modeling of EGFR mutation status in lung cancer. Sci Rep 2017;7(1):41674. [DOI] [PMC free article] [PubMed] [Google Scholar]
- 24.Karlo CA, Di Paolo PL, Chaim J, et al. Radiogenomics of clear cell renal cell carcinoma: associations between CT imaging features and mutations. Radiology 2014;270(2):464–471. [DOI] [PMC free article] [PubMed] [Google Scholar]
- 25.Cusumano D, Dinapoli N, Boldrini L, et al. Fractal-based radiomic approach to predict complete pathological response after chemo-radiotherapy in rectal cancer. Radiol Med (Torino) 2018;123(4):286–295. [DOI] [PubMed] [Google Scholar]
- 26.Scrivener M, de Jong EEC, van Timmeren JE, Pieters T, Ghaye B, Geets X. Radiomics applied to lung cancer: a review. Transl Cancer Res 2016;5(4):398–409. [Google Scholar]
- 27.Wong AJ, Kanwar A, Mohamed AS, Fuller CD. Radiomics in head and neck cancer: from exploration to application. Transl Cancer Res 2016;5(4):371–382. [DOI] [PMC free article] [PubMed] [Google Scholar]
- 28.Bogowicz M, Riesterer O, Stark LS, et al. Comparison of PET and CT radiomics for prediction of local tumor control in head and neck squamous cell carcinoma. Acta Oncol 2017;56(11):1531–1536. [DOI] [PubMed] [Google Scholar]
- 29.Ou D, Blanchard P, Rosellini S, et al. Predictive and prognostic value of CT based radiomics signature in locally advanced head and neck cancers patients treated with concurrent chemoradiotherapy or bioradiotherapy and its added value to human papillomavirus status. Oral Oncol 2017;71:150–155. [DOI] [PubMed] [Google Scholar]
- 30.Vallières M, Kay-Rivest E, Perrin LJ, et al. Radiomics strategies for risk assessment of tumour failure in head-and-neck cancer. Sci Rep 2017;7(1):10117. [DOI] [PMC free article] [PubMed] [Google Scholar]
- 31.Kuno H, Qureshi MM, Chapman MN, et al. CT texture analysis potentially predicts local failure in head and neck squamous cell carcinoma treated with chemoradiotherapy. AJNR Am J Neuroradiol 2017;38(12):2334–2340. [DOI] [PMC free article] [PubMed] [Google Scholar]
- 32.Buch K, Fujita A, Li B, Kawashima Y, Qureshi MM, Sakai O. Using texture analysis to determine human papillomavirus status of oropharyngeal squamous cell carcinomas on CT. AJNR Am J Neuroradiol 2015;36(7):1343–1348. [DOI] [PMC free article] [PubMed] [Google Scholar]
- 33.Fujita A, Buch K, Li B, Kawashima Y, Qureshi MM, Sakai O. Difference between HPV-positive and HPV-negative non-oropharyngeal head and neck cancer: texture analysis features on CT. J Comput Assist Tomogr 2016;40(1):43–47. [DOI] [PubMed] [Google Scholar]
- 34.Zhang H, Graham CM, Elci O, et al. Locally advanced squamous cell carcinoma of the head and neck: CT texture and histogram analysis allow independent prediction of overall survival in patients treated with induction chemotherapy. Radiology 2013;269(3):801–809. [DOI] [PubMed] [Google Scholar]
- 35.Hutter C, Zenklusen JC. The Cancer Genome Atlas: creating lasting value beyond its data. Cell 2018;173(2):283–285. [DOI] [PubMed] [Google Scholar]
- 36.Clark K, Vendt B, Smith K, et al. The Cancer Imaging Archive (TCIA): maintaining and operating a public information repository. J Digit Imaging 2013;26(6):1045–1057. [DOI] [PMC free article] [PubMed] [Google Scholar]
- 37.Huang C, Cintra M, Brennan K, et al. Development and validation of radiomic signatures of head and neck squamous cell carcinoma molecular features and subtypes. EBioMedicine 2019;45:70–80. [DOI] [PMC free article] [PubMed] [Google Scholar]
- 38.Gevaert O, Mitchell LA, Achrol AS, et al. Glioblastoma multiforme: exploratory radiogenomic analysis by using quantitative image features. Radiology 2015;276(1):313. [DOI] [PMC free article] [PubMed] [Google Scholar]
- 39.Gevaert O, Xu J, Hoang CD, et al. Non-small cell lung cancer: identifying prognostic imaging biomarkers by leveraging public gene expression microarray data--methods and preliminary results. Radiology 2012;264(2):387–396. [DOI] [PMC free article] [PubMed] [Google Scholar]
- 40.Johnson WE, Li C, Rabinovic A. Adjusting batch effects in microarray expression data using empirical Bayes methods. Biostatistics 2007;8(1):118–127. [DOI] [PubMed] [Google Scholar]
- 41.Fortin JP, Parker D, Tunç B, et al. Harmonization of multi-site diffusion tensor imaging data. Neuroimage 2017;161:149–170. [DOI] [PMC free article] [PubMed] [Google Scholar]
- 42.Kuhn M. Building predictive models in R using the caret package. J Stat Softw 2015;28(5):1–26. [Google Scholar]
- 43.Ma S, Dai Y. Principal component analysis based methods in bioinformatics studies. Brief Bioinform 2011;12(6):714–722. [DOI] [PMC free article] [PubMed] [Google Scholar]
- 44.Tibshirani R. Regression shrinkage and selection via the lasso. J R Stat Soc Series B Stat Methodol 1991;58(1):267–288. [Google Scholar]
- 45.Gu Z, Eils R, Schlesner M. Complex heatmaps reveal patterns and correlations in multidimensional genomic data. Bioinformatics 2016;32(18):2847–2849. [DOI] [PubMed] [Google Scholar]
- 46.Zwanenburg A, Leger S, Agolli L, et al. Assessing robustness of radiomic features by image perturbation. Sci Rep 2019;9(1):614. [DOI] [PMC free article] [PubMed] [Google Scholar]
- 47.Kim D, Wang N, Ravikumar V, et al. Prediction of 1p/19q codeletion in diffuse glioma patients using pre-operative multiparametric magnetic resonance imaging. Front Comput Neurosci 2019;13:52. [DOI] [PMC free article] [PubMed] [Google Scholar]
- 48.Shrout PE, Fleiss JL. Intraclass correlations: uses in assessing rater reliability. Psychol Bull 1979;86(2):420–428. [DOI] [PubMed] [Google Scholar]
- 49.Bogowicz M, Riesterer O, Ikenberg K, et al. Computed tomography radiomics predicts HPV status and local tumor control after definitive radiochemotherapy in head and neck squamous cell carcinoma. Int J Radiat Oncol Biol Phys 2017;99(4):921–928. [DOI] [PubMed] [Google Scholar]
- 50.Parmar C, Leijenaar RTH, Grossmann P, et al. Radiomic feature clusters and prognostic signatures specific for lung and head & neck cancer. Sci Rep 2015;5(1):11044. [DOI] [PMC free article] [PubMed] [Google Scholar]
- 51.Ahn SJ, Choi SH, Kim YJ, et al. Histogram analysis of apparent diffusion coefficient map of standard and high B-value diffusion MR imaging in head and neck squamous cell carcinoma: a correlation study with histological grade. Acad Radiol 2012;19(10):1233–1240. [DOI] [PubMed] [Google Scholar]
- 52.Bur AM, Lin A, Weinstein GS. Adjuvant radiotherapy for early head and neck squamous cell carcinoma with perineural invasion: a systematic review. Head Neck 2016;38(Suppl 1):E2350–E2357. [DOI] [PubMed] [Google Scholar]
- 53.Moreira MCS, Dos Santos AC, Cintra MB. Perineural spread of malignant head and neck tumors: review of the literature and analysis of cases treated at a teaching hospital. Radiol Bras 2017;50(5):323–327. [DOI] [PMC free article] [PubMed] [Google Scholar]
- 54.Mermod M, Tolstonog G, Simon C, Monnier Y. Extracapsular spread in head and neck squamous cell carcinoma: a systematic review and meta-analysis. Oral Oncol 2016;62:60–71. [DOI] [PubMed] [Google Scholar]
- 55.Url C, Schartinger VH, Riechelmann H, et al. Radiological detection of extracapsular spread in head and neck squamous cell carcinoma (HNSCC) cervical metastases. Eur J Radiol 2013;82(10):1783–1787. [DOI] [PubMed] [Google Scholar]
- 56.Lo P, Young S, Kim HJ, Brown MS, McNitt-Gray MF. Variability in CT lung-nodule quantification: effects of dose reduction and reconstruction methods on density and texture based features. Med Phys 2016;43(8):4854–4865. [DOI] [PMC free article] [PubMed] [Google Scholar]
- 57.Buch K, Li B, Qureshi MM, Kuno H, Anderson SW, Sakai O. Quantitative assessment of variation in CT parameters on texture features: pilot study using a nonanatomic phantom. AJNR Am J Neuroradiol 2017;38(5):981–985. [DOI] [PMC free article] [PubMed] [Google Scholar]
- 58.Shafiq-Ul-Hassan M, Zhang GG, Latifi K, et al. Intrinsic dependencies of CT radiomic features on voxel size and number of gray levels. Med Phys 2017;44(3):1050–1062. [DOI] [PMC free article] [PubMed] [Google Scholar]
- 59.Larue RTHM, van Timmeren JE, de Jong EEC, et al. Influence of gray level discretization on radiomic feature stability for different CT scanners, tube currents and slice thicknesses: a comprehensive phantom study. Acta Oncol 2017;56(11):1544–1553. [DOI] [PubMed] [Google Scholar]
- 60.Yasaka K, Akai H, Mackin D, et al. Precision of quantitative computed tomography texture analysis using image filtering: a phantom study for scanner variability. Medicine (Baltimore) 2017;96(21):e6993. [DOI] [PMC free article] [PubMed] [Google Scholar]
- 61.Brooks FJ, Grigsby PW. The effect of small tumor volumes on studies of intratumoral heterogeneity of tracer uptake. J Nucl Med 2014;55(1):37–42. [DOI] [PMC free article] [PubMed] [Google Scholar]
- 62.Liu Z, Zhang XY, Shi YJ, et al. Radiomics analysis for evaluation of pathological complete response to neoadjuvant chemoradiotherapy in locally advanced rectal cancer. Clin Cancer Res 2017;23(23):7253–7262. [DOI] [PubMed] [Google Scholar]
Associated Data
This section collects any data citations, data availability statements, or supplementary materials included in this article.


