

Abstract
Background
Although artificial intelligence (AI) shows promise across many aspects of radiology, the use of AI to create differential diagnoses for rare and common diseases at brain MRI has not been demonstrated.
Purpose
To evaluate an AI system for generation of differential diagnoses at brain MRI compared with radiologists.
Materials and Methods
This retrospective study tested performance of an AI system for probabilistic diagnosis in patients with 19 common and rare diagnoses at brain MRI acquired between January 2008 and January 2018. The AI system combines data-driven and domain-expertise methodologies, including deep learning and Bayesian networks. First, lesions were detected by using deep learning. Then, 18 quantitative imaging features were extracted by using atlas-based coregistration and segmentation. Third, these image features were combined with five clinical features by using Bayesian inference to develop probability-ranked differential diagnoses. Quantitative feature extraction algorithms and conditional probabilities were fine-tuned on a training set of 86 patients (mean age, 49 years ± 16 [standard deviation]; 53 women). Accuracy was compared with radiology residents, general radiologists, neuroradiology fellows, and academic neuroradiologists by using accuracy of top one, top two, and top three differential diagnoses in 92 independent test set patients (mean age, 47 years ± 18; 52 women).
Results
For accuracy of top three differential diagnoses, the AI system (91% correct) performed similarly to academic neuroradiologists (86% correct; P = .20), and better than radiology residents (56%; P < .001), general radiologists (57%; P < .001), and neuroradiology fellows (77%; P = .003). The performance of the AI system was not affected by disease prevalence (93% accuracy for common vs 85% for rare diseases; P = .26). Radiologists were more accurate at diagnosing common versus rare diagnoses (78% vs 47% across all radiologists; P < .001).
Conclusion
An artificial intelligence system for brain MRI approached overall top one, top two, and top three differential diagnoses accuracy of neuroradiologists and exceeded that of less-specialized radiologists.
© RSNA, 2020
Online supplemental material is available for this article.
See also the editorial by Zaharchuk in this issue.

Summary
An artificial intelligence system extracted meaningful image features and calculated disease probabilities to derive brain MRI differential diagnoses approaching neuroradiologists’ accuracy for 19 diseases.
Key Result
■ An artificial intelligence (AI) system combined deep learning, feature engineering, and an expert-knowledge Bayesian network–derived accurate brain MRI differential diagnoses similar to academic neuroradiologists (91% vs 86% correct, respectively; P = .20), and higher than radiology residents (56%; P < .001), general radiologists (57%; P < .001), and neuroradiology fellows (77%; P = .003) across a range of 19 diagnoses at brain MRI.
Introduction
Artificial intelligence (AI) shows great potential for transforming health care and medical imaging, with deep learning being the AI tool with the most impact (1,2). Many successful implementations of deep learning in neuroradiology have been for extracting findings, such as hemorrhage on head CT images (3–5). Although useful, a fully diagnostic system must additionally be applicable to rare diseases despite scarce training cases, differentiate between a large number of diagnoses, and provide direct access to intermediate features used to derive a diagnosis.
Moreover, in an inherently probabilistic field such as radiology, differential diagnoses with associated disease probabilities, rather than a single best diagnosis output, are essential for guiding management (6,7). Bayesian inference (8) offers the opportunity to directly provide such calculations of disease probabilities, taking into account image and clinical features and baseline probabilities of rare and common diseases. This is a task for which nonspecialists and deep learning are both ill-equipped.
Because of the complementary nature of different AI methods, we sought to develop a system that computationally models the three sequential steps radiologists use for MRI interpretation by using a conglomerate of AI tools. First, the system detects image abnormalities using deep learning, which simulates the radiology trainee learning to recognize abnormalities through many examples. Second, it characterizes abnormalities through available MRI sequences using image processing with quantitative outputs, akin to a radiologist explicitly describing imaging features or findings. Finally, it integrates these AI-based image features with clinical features into a probabilistic differential diagnosis by using Bayesian inference, like the radiologist correlating imaging features with certain diagnoses based on knowledge.
Although the first step of this process, image abnormality detection, is purely data driven (ie, learned from training data), the third step is explicitly informed by domain expertise in the form of expert-derived conditional probabilities. That is, a system extracting image features that probabilistically differentiate diagnoses of interest requires no additional training data to derive a differential diagnosis. Rather, the need for training data can be replaced by expert knowledge about the probability of these image features given each diagnosis. To validate the outputs of such a composite data-driven and domain-expertise automated system, we compared its diagnostic performance to radiologists with various levels of specialization. We hypothesized that the AI system would perform diagnostically at the level of academic neuroradiologists, focusing on 19 common and rare diseases affecting the cerebral hemispheres as proof of concept.
Materials and Methods
This Health Insurance Portability and Accountability Act–compliant retrospective study was approved by our institutional review board, with a waiver for written informed consent. Nonemployee or nonconsultant authors (A.M.R., J.D.R., J.W., L.X., and M.T.D.) analyzed and controlled the data.
Patients and Diseases
There were 178 study patients (105 women; mean age, 48 years ± 17 [standard deviation]), with one anonymized brain MRI (“study”) per patient, acquired between January 2008 and January 2018. Studies were obtained from our institution’s picture archiving and communication system (Table 1) according to the procedures detailed in Figure 1 and in Appendix E1 (online).
Table 1:
Demographics and Clinical Characteristics of the Study Population

Figure 1:

Flowchart shows study selection according to exclusion criteria, from initial patient search to training set and test set randomization. FLAIR = fluid-attenuated inversion recovery, IRB = institutional review board.
Diagnoses included 19 entities encompassing a large range of common and rare diseases causing fluid-attenuated inversion-recovery (FLAIR) abnormality, focusing on diseases predominantly affecting the cerebral hemispheres (Fig 2). Diagnoses were selected to contain considerable imaging overlap, making definitive diagnostic differentiation difficult or impossible, instead requiring differential diagnoses (similar to standard neuroradiologic practice).
Figure 2:

Image shows example axial fluid-attenuated inversion recovery (FLAIR) slice for each of 19 neurologic diseases included in study. ADEM = acute disseminated encephalomyelitis, CADASIL = cerebral autosomal dominant arteriopathy with subcortical infarcts and leukoencephalopathy, CNS = primary central nervous system, HIV = human immunodeficiency virus, MS = multiple sclerosis, NMO = neuromyelitis optica, PML = progressive multifocal leukoencephalopathy, PRES = posterior reversible encephalopathy syndrome. Range of repetition time and echo time values are given in Table 2.
In addition to imaging data, five clinical characteristics were extracted from each patient’s chart: age, sex, immune status, presence of viral prodrome, and chronicity of clinical symptoms (Table 1).
Imaging Data
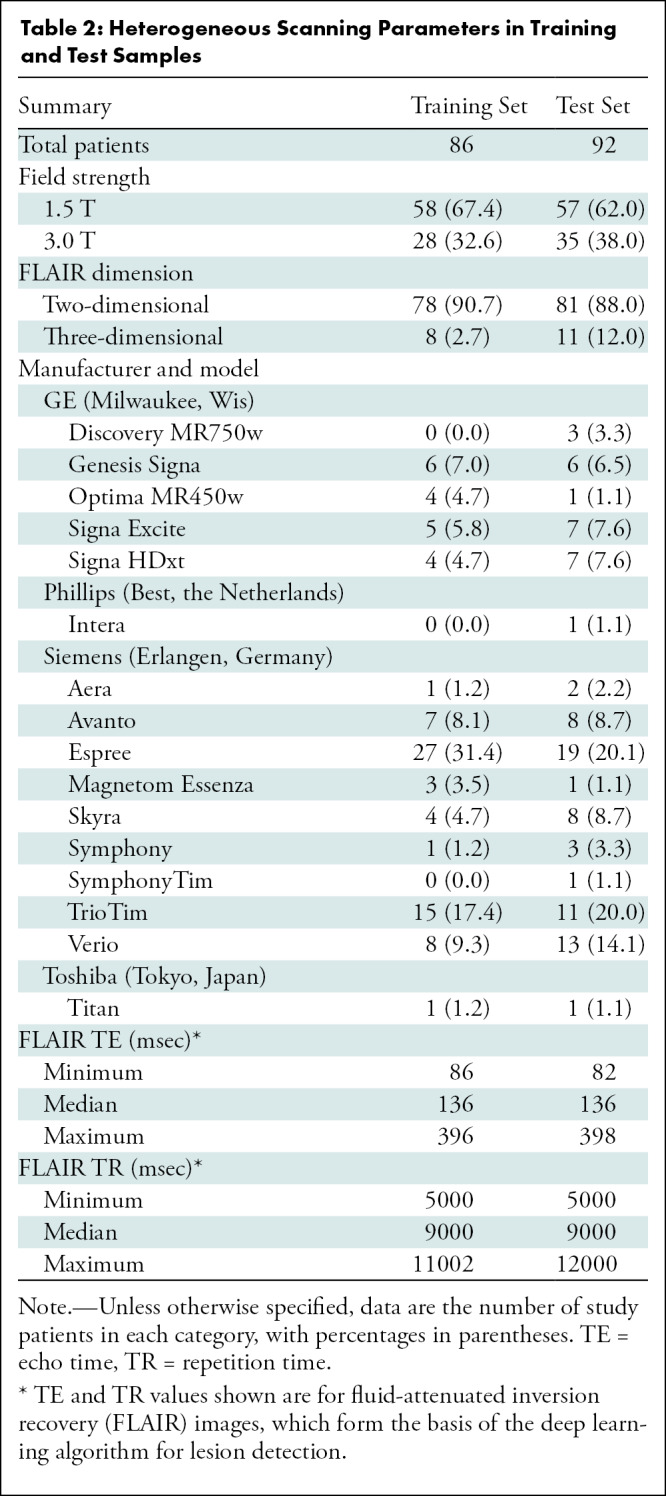
Studies were divided into training (n = 86) and test (n = 92) sets. Training data previously used to train convolutional neural networks (see below) overlapped with the 86 training studies described here, but not with the test studies. This training set of 86 cases was used to update AI system parameters (specifically, thresholds for key feature extraction [see “Lesion Characterization” section] and conditional probabilities [see “Bayesian Inference for Differential Diagnosis Development” section]). The test set was held out for independent testing. Because no hyperparameter optimization was performed, there was no requirement for a separate validation set. The test data set included five example studies of each disease randomly selected from the study cohort except Susac syndrome, for which we only found two patients due to its rarity. The remainder formed the training set (Table 1). Imaging data stemmed from a wide range of imaging parameters from over 20 different physical MRI scanners (16 scanner models across multiple locations) (Table 2), typical of clinical imaging. Sequences extracted from MR images included T1-weighted, T1 postcontrast, T2-weighted, FLAIR, diffusion-weighted, apparent diffusion coefficient, and gradient-echo or susceptibility-weighted imaging. If a sequence (eg, T1 postcontrast) was unavailable for a patient, then the AI algorithm and radiologist provided diagnoses without that sequence. Specific pulse sequences were highly heterogeneous, with over 30 unique FLAIR sequences alone (varying along echo time, repetition time, in-plane resolution, and slice thickness) (Table 2).
Table 2:
Heterogeneous Scanning Parameters in Training and Test Samples
Deep Learning for Lesion Detection
The AI system consisted of three separate components (Fig 3). First, following image preprocessing (see Appendix E1 [online]), intracranial lesions were detected based on the FLAIR sequence by using our previously developed convolutional neural network with three-dimensional U-Net architecture (9) (Fig 3, A). Two separately trained previously developed three-dimensional U-Nets using the same architecture and training cases were also applied to our data for detecting pathologic T1 signal (10) and abnormal gradient-echo or susceptibility-weighted imaging signal (11).
Figure 3:

Image shows overview of artificial intelligence (AI) system. A, Schematic of three-dimensional U-Net architecture used for abnormal signal detection. B, Illustration of automatically extracted features by using image processing. All examples except gradient-echo (GRE) susceptibility detection are from patient with primary central nervous system lymphoma. See Materials and Methods section for details on how each feature is extracted. C, Multiple quantitative features are calculated for every lesion in every patient, including those shown in this example. These features are stored, providing rich quantitative description of the lesions. For developing differential diagnosis, thresholded features are then probabilistically combined in Bayesian network. D, Schematic of Bayesian network demonstrates naive Bayesian architecture with complete set of features used by AI system to differentiate diseases of cerebral hemispheres, divided into four categories: clinical, signal, spatial, and volumetric. ADC = apparent diffusion coefficient, ANTs = Advanced Normalization Tools, CC = corpus callosum, DWI = diffusion-weighted imaging, FLAIR = fluid-attenuated inversion recovery, vol = volume.
Lesion Characterization
Image processing was performed by using in-house modifications of the open-source Advanced Normalization Tools software package (version 2.1; https://github.com/ANTsX/ANTs) (12,13) (see details in Appendix E1 [online]). The lesion mask of FLAIR U-Net was overlaid onto each MRI sequence, with extracted tissue segmentations and with a standard atlas to extract 18 features of interest for each study (Fig 3, B and C). Quantitative image features (eg, lesion volume in cubic millimeters) were extracted and then thresholded to obtain qualitative feature states (eg, large, medium, or small lesions). The thresholds were set by expert knowledge and updated by using the 86 training studies. Detailed descriptions for all 18 extracted signal (n = 5), volumetric (n = 6), and spatial (n = 7) quantitative features, and the five clinical features, are provided in Appendix E1 (online).
Bayesian Inference for Differential Diagnosis Development
For each patient, the 18 imaging features plus five clinical features were combined by using naive Bayesian inference (available at https://github.com/rauscheck/radai) to calculate a probability for each possible diagnosis (Fig 3, D). Bayesian conditional probabilities were determined with domain expertise, using statistics published in a comprehensive neuroradiology textbook (14) and in available literature (15–19) when available, and otherwise a consensus of two neuroradiologists (A.M.R., a neuroradiology fellow, and S.M., with 12 years of postfellowship experience). The goal of this process was to encapsulate expert knowledge of the probabilistic mapping between features and diseases. The probabilities were subsequently tuned to approximate a weighted average of the expert-derived probabilities with the disease-specific frequency of the feature states across the 86 training studies only.
Comparison to Radiologist Performance
To compare the performance of the AI system to radiologists, test data were anonymized and independently presented to four radiology residents (two 2nd-year and two 4th-year residents), two neuroradiology fellows (each with 9 months of fellowship training), two general radiologists (who routinely read brain MR images; one neuroradiology fellowship–trained; with 20 years and 21 years of posttraining experience, respectively), and two academic neuroradiology attending physicians at our tertiary care center (I.M.N. and S.M., with 7 years and 12 years postfellowship experience, respectively), using a standard hanging protocol in our institution’s picture archiving and communication system. Radiologists were given the same MRI sequences and clinical features available to the AI system. They were informed of the equal distribution of diagnoses across patients. Radiologists provided their top three most probable diagnoses (“differential diagnosis”) out of a menu of 19 possible diagnoses.
Statistical Analysis
To compare the AI system to radiologists while considering the paired nature of the data, we used a generalized estimating equation with robust variance estimator, expressed as odds ratios (ORs) compared with AI system accuracy as baseline, for three separate outcome measures: correct diagnosis within the top three differential diagnoses, within the top two differential diagnoses, and within the top one diagnosis. Categories of radiologists (attending physicians, fellows, general radiologists, residents, and AI system) were specified in this model and individual readers nested within their respective categories. For comparing the AI system to individual radiologists, McNemar test was used. Receiver operating characteristic curves were constructed to serve as a summary measure of performance across top one, top two, and top three differential diagnoses by using position in the differential diagnoses to create an ordinal scale of four confidence levels, with 95% confidence intervals (CIs) of area under the receiver operating characteristic curves (AUCs) calculated by bootstrapping. The χ2 test was used for comparing the fraction of cases answered correctly according to disease prevalence. Correlations between individual-reader confusion matrices were evaluated. All statistical analyses were performed by using MATLAB (version r2019a; Mathworks, Natick, Mass), except the generalized estimating equation, implemented by using Stata (version 13.1; StataCorp, College Station, Tex). Statistical significance was defined as P < .05. See additional details in Appendix E1 (online).
Results
Patient Demographics
The train and test set split resulted in 86 studies in the training set and 92 in the test set (Fig 1, Table 1) across 19 different diseases (Fig 2). There were no significant differences in age (P = .38; two-tailed t test) or sex (P = .49; χ2 test) between the training and test set. Having fixed the number of test studies to five for each disease except Susac syndrome (n = 2), the number of training studies varied from zero to seven across diseases. Training data were only used for fine-tuning expert-defined key feature thresholds and Bayesian conditional probabilities, so training data did not require equal proportions of diagnoses.
AI System Performance Compared with Radiologists
The composite AI system outputs a probability associated with each of the 19 diseases. The three diseases with the highest probabilities represent the system’s differential diagnosis. The AI system correctly placed the correct diagnosis within its top three differential diagnoses in 84 of 92 (91%) of test studies (Fig 4, A). There was no difference in diagnostic accuracy between the AI system and academic neuroradiologists on the same set of studies (76–82 items correct of 92 items [83%–89%; mean percent correct across participants, 86%]; OR, 0.58; 95 CI%: 0.25, 1.32; P = .20). AI system performance was better than radiology residents (37–59 items correct of 92 items [40%–64%; mean percent correct across participants, 56%]; OR, 0.12; 95% CI: 0.06, 0.27; P < .001), general radiologists (49–54 items correct of 92 items [53%–59%; mean percent correct across participants, 57%]; OR, 0.11; 95% CI: 0.05, 0.25; P < .001), and neuroradiology fellows with 9 months of experience (63–78 items correct of 92 items [68%–85%; mean percent correct across participants, 77%]; OR, 0.31; 95% CI: 0.14, 0.68; P = .003). We also evaluated the algorithm on top two differential diagnoses (Fig 4, B) and top diagnosis accuracy (Fig 4, C), showing similar performance to academic neuroradiologists (top two, P = .20; top one, P = .08) and neuroradiology fellows (top two, P = .26; top one, P = .78) and better performance than general radiologists (P < .001) and radiology residents (P < .001) on both outcome measures (Tables E1–E3 [online]). Comparisons of the AI system to individual radiologists demonstrated similar findings: AI system performance was similar to that of academic neuroradiologists on all measures, was better than one of two neuroradiology fellows on top one differential diagnosis and top two differential diagnoses performance, and was consistently better than that of all radiology residents and general radiologists (see Table E4 [online] for P values).
Figure 4:

Graphs show performance of composite artificial intelligence (AI) system compared with radiologists with various levels of specialization. A, Performance is measured as percent correct by listing correct diagnosis within top three differential diagnoses (DDx) across 92 test studies (19 diseases). Each circle represents a single radiologist, and horizontal line represents mean across each radiologist group. Horizontal dashed line is performance of AI system. Error bars represent 95% binomial probability confidence intervals. B, Accuracy (percent correct) within top two diagnoses. C, Accuracy (percent correct) only using top diagnosis. D, Receiver operating characteristic (ROC) curves for AI system (green) compared with radiologists (other colors). AI system has similar area under the curve (AUC) to that of academic neuroradiologists (black). ROC curves are based on top one, top two, and top three most probable diagnoses provided by each radiologist. See Materials and Methods section for further details. Reported AUCs are nonparametric.
Receiver Operating Characteristic Analysis
Evaluation by using receiver operating characteristic curve also demonstrated performance of the AI system (AUC, 0.92 [95% CI: 0.88, 0.95]) similar to academic neuroradiologists (AUC, 0.90 [95 % CI: 0.89, 0.93]), both of which were superior to neuroradiology fellows (AUC, 0.85 [95% CI: 0.81, 0.87]), general radiologists (AUC, 0.72 [95% CI: 0.68, 0.76]), and radiology residents (AUC, 0.73 [95% CI: 0.70, 0.75]) (Fig 4, C). Results were similar when using partial AUC values at high specificity (Table E5 [online]).
Effect of Disease Prevalence on Radiologists and on AI System
To understand the strengths of the automated system, we evaluated its performance compared with radiologists for each diagnosis individually (Fig E1 [online]) and according to how commonly the diseases are encountered in practice (Fig 5). Radiologists across all specialization levels were better at diagnosing common diseases (25–43 items correct of 45 items [56%–96% correct; median percent correct across radiologists, 77%]) compared with rare diseases (six to 22 items correct of 27 items [22%–82% correct; median percent correct across radiologists, 39%]) (P < .001), with intermediate performance on moderately rare diseases (six to 18 items correct of 20 items [30%–90% correct; median percent correct across radiologists, 60%]). The difference in performance between common and rare diseases was most pronounced for residents (43% difference; P < .001) and general radiologists (37% difference; P < .001), compared with neuroradiology fellows (20% difference; P = .007) and academic neuroradiology attending physicians (17% difference; P = .003), who more frequently see rare diseases at a tertiary care center.
Figure 5:

Graphs show performance of artificial intelligence (AI) system and radiologists depending on disease prevalence. Radiologists at all levels more often correctly diagnosed common diseases than rare diseases, with the effect less pronounced with increasing experience with rare diseases. For AI system, there was no significant difference in performance on common versus rare diseases. Individual shapes indicate top three diagnostic accuracy (percent correct) for an individual disease across radiologists of each category, with diseases categorized by their prevalence. Horizontal bars demonstrate mean across individual data points, with corresponding standard error of mean indicated by the error bars. P values shown are based on χ2 test comparing common and rare disease performance. DDx = differential diagnosis.
For the AI algorithm, there was no detectable difference between performance on common compared with rare disease entities (absolute difference, 8%; 42 of 45 common diseases and 23 of 27 rare diseases; P = .26).
Evaluating Radiologist and AI Errors
We further evaluated the strengths and weaknesses of the AI system, as well as those of radiologists, by means of confusion matrices (Fig 6). When evaluated on predicting the true diagnosis as the top diagnosis, the AI system was found to perform particularly well at some diagnoses (eg, posterior reversible encephalopathy syndrome and low-grade glioma) and poorly on others (eg, multiple sclerosis and metastases). Different individual radiologists and the AI system make errors on divergent diagnoses (Fig 6, B–E). However, confusion matrices between radiologists more closely resemble each other than the confusion matrix of the AI system, suggesting that the AI system and humans make different types of errors. This claim can be qualitatively appreciated or quantified by using correlation between confusion matrices. The correlation between the two academic neuroradiologists (r = 0.79) was higher than the mean correlation between the AI system and each academic neuroradiologist (r = 0.71; P = .02), and the mean correlation between individual academic neuroradiologists and neuroradiology fellows (r = 0.72) was higher than between the AI system and individual neuroradiology fellows (r = 0.64; P = .05; Fisher r-to-z transformation).
Figure 6:

Confusion matrices show sources of diagnostic errors for artificial intelligence (AI) system and individual radiologists for each disease. By convention, true disease labels are shown along x-axis, and predictions are shown along y-axis, with color bar representing fraction of patients of true diagnosis where predicted disease was listed as top diagnosis (ie, columns add up to one). Perfect diagnostic algorithm would result in yellow squares along diagonal from top left to bottom right. At least two types of mistakes are seen both among radiologists and AI system, exemplified by white rectangles for AI system: confusion between similarly appearing diseases, and overdiagnosing certain diseases. Different individuals within a group make different mistakes, and fewer errors occur with increasing specialization. Act = active, ADEM = acute disseminated encephalomyelitis, ALD = adrenoleukodystrophy, CADASIL = cerebral autosomal dominant arteriopathy with subcortical infarcts and leukoencephalopathy, CNS = central nervous system, HG = high-grade, HIV enceph = human immunodeficiency virus encephalopathy, Inact = inactive, LG = low-grade, MS = multiple sclerosis, NMO = neuromyelitis optica, PML = progressive multifocal leukoencephalopathy, PRES = posterior reversible encephalopathy syndrome, SVID = small vessel ischemic disease, TLE = toxic leukoencephalopathy, tumef = tumefactive.
Importantly, the probabilities produced by the AI system reflect the confidence of the system in its diagnostic predictions. For those cases where the AI system predicted the correct diagnosis as the most likely (n = 51 of 92), the mean prediction probability of the top diagnosis was 63%, which was higher than the mean prediction probability of 47% in those cases (n = 41 of 92) where it predicted an incorrect diagnosis (P < .001; t test).
Impact of Imaging and Clinical Features on AI Performance
By holding out features from the Bayesian network that are otherwise calculated by the AI system, one can learn about the relative importance of those features for providing diagnostic information (Table 3). When all five clinical features are removed from the input, the performance of the entire system is reduced from 84 of 92 (91%) correct to 63 of 92 (68%) correct on top three differential diagnoses accuracy. Signal features (T1 signal, gradient-echo, etc) carry the least information, with performance at 79 of 92 (86%) without these features. The removal of only spatial or volumetric features reduces performance to 77 of 92 (84%) and 75 of 92 (82%), respectively. Removing all imaging information (leaving only five clinical features for deciding between the 19 diagnoses) still allows top three diagnosis accuracy of 50 of 92 (54%). Both the reduced performance without clinical features (P < .001) and the performance far above chance given only clinical features (P < .001) demonstrate the importance of clinical information combined with imaging features for brain MRI diagnosis.
Table 3:
Accuracy of the Artificial Intelligence System after Excluding Information Derived from Various Feature Categories (n = 92)

Because image quality improves over time, we analyzed AI system accuracy as a function of study acquisition date. There was no clear change in diagnostic accuracy across the 10 years of study acquisition dates (Fig E2 [online]).
Discussion
Despite advances in deep learning, its utility for providing differential diagnoses of common and rare diagnoses on complex imaging such as brain MRI remains limited. To address some limitations of existing techniques, we constructed an artificial intelligence (AI) system as a fusion of distinct methods with complementary strengths. This AI system accepts clinical brain MRI scans as input and provides a differential diagnosis as output. On a number of outcome measures, the AI system approached neuroradiologists’ diagnostic performance for 19 diseases affecting the cerebral hemispheres (eg, 91% vs 86% correct top three differential diagnoses; P = .20), providing strong support that diagnostically relevant information is extracted by this system.
The AI system was constructed to separately model the perceptual and cognitive components of human radiologic image interpretation (20). First, a convolutional neural network trained on abnormal FLAIR signal detects lesions (9). Then, human-interpretable quantitative image and lesion features are explicitly derived by using image processing techniques. Finally, these “findings” are combined with limited clinical features by using expert knowledge–based Bayesian inference to arrive at a differential diagnosis (ie, the “impression”), ranked by disease probabilities.
The final diagnostic component of the AI system does not rely on training, instead encapsulating expert knowledge about the relationship between image features and diagnoses within the conditional probabilities of the Bayesian network. As such, it performed similarly on common (93% top three differential diagnoses accuracy) and rare (82%) diseases (P = .26). Meanwhile, radiologists performed better on common (78%) than rare (47%) diseases (P < .001). Additional advantages of a composite deep learning and Bayesian AI system include explicit calculation of intermediate image features, such as location or size of lesions, and the framing of system outputs in terms of clinically meaningful probabilities. With access to all features in the system, the accuracy of each component can be investigated and improved independently.
Although the AI system produced errors, these were different from and perhaps complementary to those produced by humans. The types of errors addressed by this type of AI algorithm include distinctly human biases such as satisfaction of search (21) and heavily skewed probability calculations (22). With imaging demand increasing steadily and outpacing the capacity of radiologists (23), methodologies that simultaneously improve efficiency (24,25) and reduce errors should be a welcome addition to the radiologist’s repertoire.
Our study had limitations. This proof-of-concept study focused on 19 predefined common and rare neurologic diagnoses causing FLAIR abnormality within the cerebral hemispheres, whereas the number of diseases, disease subcategories, and imaging manifestations encountered in practice is broader. Whereas the current system is limited to certain prespecified image features important for differentiating these 19 diseases, other imaging features, including comparisons to prior imaging, could be computationally extracted for other diagnoses or for improving top diagnosis performance. At present, academic neuroradiologists qualitatively exceed performance of the AI system at single top diagnosis, and further studies are needed to understand the conditions under which humans outperform this system. In addition, clinical context and implications of diagnoses are not modeled into the AI system and are components of radiology that remain difficult to model computationally. Because many of the diagnoses included in our study do not have a fully independent pathologic reference standard, instead defined by a combination of radiologic and clinical follow-up, the AI system is unlikely to perform better than did expert radiologists on these diagnoses. Furthermore, this system only functions on patients with a single diagnosis and without prior surgery. Future systems will need to incorporate the ability to differentiate multiple diagnoses within the same patient (26,27). Finally, the retrospective work described here was performed at a single health system, potentially limiting generalization (28). Decreased reliance on training data in favor of neuroimaging principles may, however, boost generalizability.
In conclusion, we built a composite artificial intelligence (AI) system that computationally models radiologists’ perceptual and cognitive steps to brain MRI interpretation. On a diverse set of 19 diseases with real clinical MR images, it explicitly extracts clinically relevant imaging features and combines these into diagnostic performance at a level exceeding general radiologists and trainees and approaching that of academic neuroradiologists. The study exemplifies the large variety of diseases that can be diagnosed when combining data- and knowledge-driven approaches, despite small training samples. It will be important to test the system prospectively and at other institutions. We anticipate that our AI system will generalize well, as it already works across more than 20 different MR scanner types and a wide range of acquisition parameters. Prospective evaluation is important because the current data samples were biased toward a near-equal probability of common and rare diseases. In clinical practice, disease prevalence can be incorporated into the Bayesian network as “prior probabilities,” but transitioning from an experimental to clinical setting using such modifications will necessitate further performance evaluations. We anticipate that the general framework of a composite AI system combining data-driven and knowledge-driven approaches can be applied to many domains within radiology and will ultimately form the basis of more efficient and accurate radiology practice.
APPENDIX
SUPPLEMENTAL FIGURES
Acknowledgments
Acknowledgments
We gratefully acknowledge the support of NVIDIA, who donated the Titan Xp graphics processing unit used for this research.
A.M.R. and J.D.R. contributed equally to this work.
Disclosures of Conflicts of Interest: A.M.R. Activities related to the present article: received payment for reimbursement for American Society for Neuroradiology and Society for Imaging Informatics in Medicine (SIIM) 2019 travel expenses. Activities not related to the present article: disclosed no relevant relationships. Other relationships: disclosed no relevant relationships. J.D.R. disclosed no relevant relationships. L.X. Activities related to the present article: disclosed no relevant relationships. Activities not related to the present article: is a consultant for Galileo Clinical Decision Support; is employed by University of Pennsylvania. Other relationships: disclosed no relevant relationships. J.W. disclosed no relevant relationships. M.T.D. disclosed no relevant relationships. E.J.B. disclosed no relevant relationships. A.M.K. disclosed no relevant relationships. J.E. disclosed no relevant relationships. T.C.C. Activities related to the present article: disclosed no relevant relationships. Activities not related to the present article: is a board member of Association of University Radiologists, Pennsylvania Radiological Society, PRRS, Radiological Society of North America (RSNA), and SIIM; is member of Informatics Commission at American College of Radiology (ACR); has grants/grants pending with American College of Radiology Imaging Network, ACR, RSNA, and SIIM; received payment for lectures including service on speakers bureaus from RADxx; receives royalties from Osler Institute. Other relationships: disclosed no relevant relationships. R.N.B. Activities related to the present article: disclosed no relevant relationships. Activities not related to the present article: is a board member of and holds stock/stock options in Galileo Clinical Decision Support; has patents (planned, pending, or issued) with University of Pennsylvania and Galileo Clinical Decision Support. Other relationships: disclosed no relevant relationships. I.M.N. Activities related to the present article: disclosed no relevant relationships. Activities not related to the present article: has grants/grants pending with Galileo Clinical Decision Support. Other relationships: disclosed no relevant relationships. S.M. disclosed no relevant relationships. J.C.G. Activities related to the present article: disclosed no relevant relationships. Activities not related to the present article: is employed by University of Electronic Science and Technology of China. Other relationships: disclosed no relevant relationships.
A.M.R. supported by a Radiological Society of North America (RSNA) Resident Research grant (RR1778). A.M.R. and J.D.R. supported by institutional T-32 training grants (T32EB001631-14 [A.M.R.] and T32-EB004311-10 [A.M.R. and J.D.R.]). E.J.B. supported by RSNA Education Scholar grant (ESCH1505). I.M.N. supported by National Institutes of Health (NIH) training grant (T32). J.C.G. supported by NIH R01 grant.
Abbreviations:
- AI
- artificial intelligence
- AUC
- area under the receiver operating characteristic curve
- CI
- confidence interval
- FLAIR
- fluid-attenuated inversion recovery
- OR
- odds ratio
References
- 1. McBee MP, Awan OA, Colucci AT, et al . Deep Learning in Radiology . Acad Radiol 2018. ; 25 ( 11 ): 1472 – 1480 . [DOI] [PubMed] [Google Scholar]
- 2. Shen D, Wu G, Suk HI. . Deep Learning in Medical Image Analysis . Annu Rev Biomed Eng 2017. ; 19 ( 1 ): 221 – 248 . [DOI] [PMC free article] [PubMed] [Google Scholar]
- 3. Chang PD, Kuoy E, Grinband J, et al . Hybrid 3D/2D Convolutional Neural Network for Hemorrhage Evaluation on Head CT . AJNR Am J Neuroradiol 2018. ; 39 ( 9 ): 1609 – 1616 . [DOI] [PMC free article] [PubMed] [Google Scholar]
- 4. Chilamkurthy S, Ghosh R, Tanamala S, et al . Deep learning algorithms for detection of critical findings in head CT scans: a retrospective study . Lancet 2018. ; 392 ( 10162 ): 2388 – 2396 . [DOI] [PubMed] [Google Scholar]
- 5. Kuo W, Hӓne C, Mukherjee P, Malik J, Yuh EL. . Expert-level detection of acute intracranial hemorrhage on head computed tomography using deep learning . Proc Natl Acad Sci U S A 2019. ; 116 ( 45 ): 22737 – 22745 . [DOI] [PMC free article] [PubMed] [Google Scholar]
- 6. Larson DB, Langlotz CP. . The Role of Radiology in the Diagnostic Process: Information, Communication, and Teamwork . AJR Am J Roentgenol 2017. ; 209 ( 5 ): 992 – 1000 . [DOI] [PubMed] [Google Scholar]
- 7. Sox HC, Higgins MC, Owens DK. . Medical decision making . 2nd ed. Chichester, England: : Wiley; , 2013. . [Google Scholar]
- 8. Burnside ES. . Bayesian networks: computer-assisted diagnosis support in radiology . Acad Radiol 2005. ; 12 ( 4 ): 422 – 430 . [DOI] [PubMed] [Google Scholar]
- 9. Duong MT, Rudie JD, Wang J, et al . Convolutional Neural Network for Automated FLAIR Lesion Segmentation on Clinical Brain MR Imaging . AJNR Am J Neuroradiol 2019. ; 40 ( 8 ): 1282 – 1290 . [DOI] [PMC free article] [PubMed] [Google Scholar]
- 10. Mattay R, Wang J, Xie L, et al . Automated Segmentation of Abnormal T1 Signal for 35 Neurological Diagnoses using a Custom 3D U-Net Convolutional Neural Network. SIIM , Denver, CO: , 2019. . Accessed January 3, 2020 . [Google Scholar]
- 11. Choi J, Xie L, Wang J, Gee JC, Rauschecker AM, Rudie JD. . Automated Segmentation of Areas of Abnormal Susceptibility on MRI Using a 3D Convolution Neural Network . ASNR; , Boston, MA: , 2019. . Accessed January 3, 2020 . [Google Scholar]
- 12. Avants BB, Tustison NJ, Song G, Cook PA, Klein A, Gee JC. . A reproducible evaluation of ANTs similarity metric performance in brain image registration . Neuroimage 2011. ; 54 ( 3 ): 2033 – 2044 . [DOI] [PMC free article] [PubMed] [Google Scholar]
- 13. Das SR, Avants BB, Grossman M, Gee JC. . Registration based cortical thickness measurement . Neuroimage 2009. ; 45 ( 3 ): 867 – 879 . [DOI] [PMC free article] [PubMed] [Google Scholar]
- 14. Osborn AG. . Osborn’s brain: imaging, pathology, and anatomy . Salt Lake City, Utah: : Amirsys; , 2013. . [Google Scholar]
- 15. Geraldes R, Ciccarelli O, Barkhof F, et al . The current role of MRI in differentiating multiple sclerosis from its imaging mimics . Nat Rev Neurol 2018. ; 14 ( 4 ): 199 – 213 [Published correction appears in Nat Rev Neurol 2018;14(4):213.] . [DOI] [PubMed] [Google Scholar]
- 16. Haldorsen IS, Espeland A, Larsson EM. . Central nervous system lymphoma: characteristic findings on traditional and advanced imaging . AJNR Am J Neuroradiol 2011. ; 32 ( 6 ): 984 – 992 . [DOI] [PMC free article] [PubMed] [Google Scholar]
- 17. Resende LL, de Paiva ARB, Kok F, da Costa Leite C, Lucato LT. . Adult Leukodystrophies: A Step-by-Step Diagnostic Approach . RadioGraphics 2019. ; 39 ( 1 ): 153 – 168 . [DOI] [PubMed] [Google Scholar]
- 18. Dutra BG, da Rocha AJ, Nunes RH, Maia ACM. . Neuromyelitis Optica Spectrum Disorders: Spectrum of MR Imaging Findings and Their Differential Diagnosis . RadioGraphics 2018. ; 38 ( 1 ): 169 – 193 . [DOI] [PubMed] [Google Scholar]
- 19. Sarbu N, Shih RY, Jones RV, Horkayne-Szakaly I, Oleaga L, Smirniotopoulos JG. . White Matter Diseases with Radiologic-Pathologic Correlation . RadioGraphics 2016. ; 36 ( 5 ): 1426 – 1447 . [DOI] [PubMed] [Google Scholar]
- 20. Bruno MA, Walker EA, Abujudeh HH. . Understanding and Confronting Our Mistakes: The Epidemiology of Error in Radiology and Strategies for Error Reduction . RadioGraphics 2015. ; 35 ( 6 ): 1668 – 1676 . [DOI] [PubMed] [Google Scholar]
- 21. Kim YW, Mansfield LT. . Fool me twice: delayed diagnoses in radiology with emphasis on perpetuated errors . AJR Am J Roentgenol 2014. ; 202 ( 3 ): 465 – 470 . [DOI] [PubMed] [Google Scholar]
- 22. Kahneman D, Tversky A. . Subjective probability: A judgment of representativeness . Cognit Psychol 1972. ; 3 ( 3 ): 430 – 454 . [Google Scholar]
- 23. McDonald RJ, Schwartz KM, Eckel LJ, et al . The effects of changes in utilization and technological advancements of cross-sectional imaging on radiologist workload . Acad Radiol 2015. ; 22 ( 9 ): 1191 – 1198 . [DOI] [PubMed] [Google Scholar]
- 24. Al Yassin A, Salehi Sadaghiani M, Mohan S, Bryan RN, Nasrallah I. . It is About “Time”: Academic Neuroradiologist Time Distribution for Interpreting Brain MRIs . Acad Radiol 2018. ; 25 ( 12 ): 1521 – 1525 . [DOI] [PubMed] [Google Scholar]
- 25. Brown M, Browning P, Wahi-Anwar MW, et al . Integration of Chest CT CAD into the Clinical Workflow and Impact on Radiologist Efficiency . Acad Radiol 2019. ; 26 ( 5 ): 626 – 631 . [DOI] [PubMed] [Google Scholar]
- 26. Guerrero R, Qin C, Oktay O, et al . White matter hyperintensity and stroke lesion segmentation and differentiation using convolutional neural networks . Neuroimage Clin 2017. ; 17 : 918 – 934 . [DOI] [PMC free article] [PubMed] [Google Scholar]
- 27. Rudie JD, Weiss DA, Saluja R, et al . Multi-Disease Segmentation of Gliomas and White Matter Hyperintensities in the BraTS Data Using a 3D Convolutional Neural Network . Front Comput Neurosci 2019. ; 13 : 84 . [DOI] [PMC free article] [PubMed] [Google Scholar]
- 28. Zech JR, Badgeley MA, Liu M, Costa AB, Titano JJ, Oermann EK. . Variable generalization performance of a deep learning model to detect pneumonia in chest radiographs: A cross-sectional study . PLoS Med 2018. ; 15 ( 11 ): e1002683 . [DOI] [PMC free article] [PubMed] [Google Scholar]
- 29. Yushkevich PA, Piven J, Hazlett HC, et al . User-guided 3D active contour segmentation of anatomical structures: significantly improved efficiency and reliability . Neuroimage 2006. ; 31 ( 3 ): 1116 – 1128 . [DOI] [PubMed] [Google Scholar]
- 30. Simard PY, Steinkraus D, Platt JC. . Best practices for convolutional neural networks applied to visual document analysis . Seventh International Conference on Document Analysis and Recognition, 2003 Proceedings, Edinburgh, August 6, 2003. Piscataway, NJ: IEEE, 2003; 958–963. [Google Scholar]
- 31. Ronneberger O, Fischer P, Brox T. . U-Net: Convolutional Networks for Biomedical Image Segmentation . Cham, Switzerland: : Springer International; , 2015. ; 234 – 241 . [Google Scholar]
- 32. Milletari F, Navab N, Ahmadi SA. V-Net : Fully Convolutional Neural Networks for Volumetric Medical Image Segmentation . arXiv [preprint]. https://arxiv.org/abs/1606.04797. Posted June 15, 2016. Accessed June 1, 2016 .
- 33. Abadi M, Agarwal A, Barham P, et al . TensorFlow: Large-Scale Machine Learning on Heterogeneous Distributed Systems . arXiv [preprint]. https://arxiv.org/abs/1603.04467. Posted March 14, 2016. Accessed January 2, 2019 .
- 34. Marcus DS, Wang TH, Parker J, Csernansky JG, Morris JC, Buckner RL. . Open Access Series of Imaging Studies (OASIS): cross-sectional MRI data in young, middle aged, nondemented, and demented older adults . J Cogn Neurosci 2007. ; 19 ( 9 ): 1498 – 1507 . [DOI] [PubMed] [Google Scholar]
- 35. Manjón JV, Coupé P, Buades A, Fonov V, Louis Collins D, Robles M. . Non-local MRI upsampling . Med Image Anal 2010. ; 14 ( 6 ): 784 – 792 . [DOI] [PubMed] [Google Scholar]
- 36. Zhou XH, McClish DK, Obuchowski NA. . Statistical methods in diagnostic medicine . 2nd ed. Hoboken, NJ: : Wiley; , 2011. . [Google Scholar]
- 37. Obuchowski NA. . ROC analysis . AJR Am J Roentgenol 2005. ; 184 ( 2 ): 364 – 372 . [DOI] [PubMed] [Google Scholar]
- 38. Shiraishi J, Pesce LL, Metz CE, Doi K. . Experimental design and data analysis in receiver operating characteristic studies: lessons learned from reports in radiology from 1997 to 2006 . Radiology 2009. ; 253 ( 3 ): 822 – 830 . [DOI] [PMC free article] [PubMed] [Google Scholar]
- 39. Lusted LB. . Signal detectability and medical decision-making . Science 1971. ; 171 ( 3977 ): 1217 – 1219 . [DOI] [PubMed] [Google Scholar]
Associated Data
This section collects any data citations, data availability statements, or supplementary materials included in this article.