Abstract
Background
Identification of markers to aid in understanding the growth kinetics of Von Hippel–Lindau (VHL)-associated clear cell renal cell carcinoma (ccRCC) has the potential to allow individualization of patient care, thereby helping prevent unnecessary screening and optimizing intervention.
Purpose
To determine whether the degree of restricted diffusion at baseline MRI holds predictive potential for the growth rate of VHL-associated ccRCC.
Materials and Methods
Patients with VHL disease who underwent surgical resection of tumors between November 2014 and October 2017 were analyzed retrospectively in this HIPAA-compliant study. The change in ccRCC volume between two time points and apparent diffusion coefficient (ADC) at baseline was calculated by using segmentations by two readers at nephrographic-phase CT and diffusion-weighted MRI, respectively. Intraclass correlation coefficient was used to assess agreement between readers. Repeated-measures correlation was used to investigate relationships between ADC (histogram parameters) and tumor size at baseline with growth rate and volume doubling time (VDT). Predictive performance of the ADC parameter with highest correlation and tumor size at baseline was reviewed to differentiate tumors based on their VDT (≤1 year or >1 year).
Results
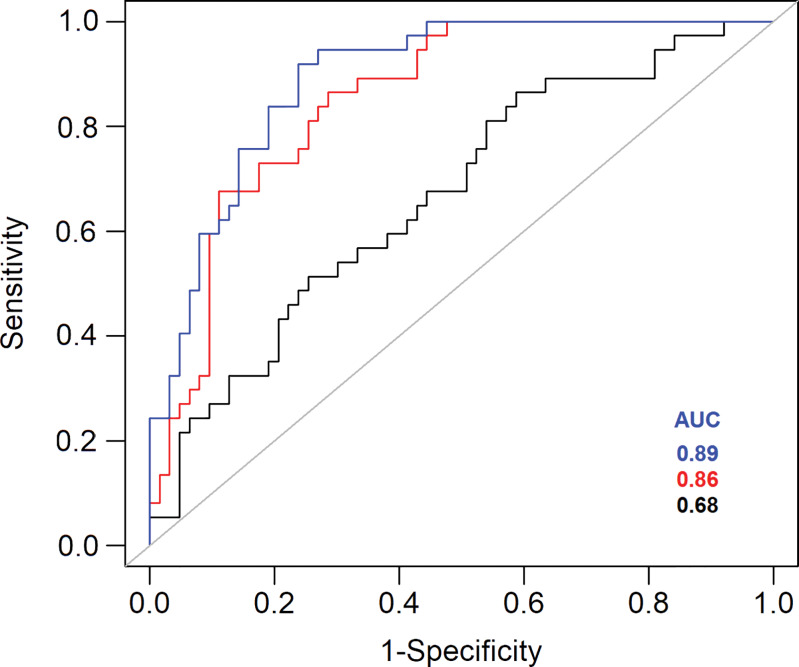
Forty-six patients (mean age, 46 years ± 7 [standard deviation]; 25 women) with 100 ccRCCs were evaluated. Interreader agreement resulted in mean κ scores of 0.89, 0.82, and 0.93 for mean ADC, baseline tumor volume, and follow-up tumor volume, respectively. ADC percentiles correlated negatively with tumor growth rate but correlated positively with VDT. Lower ADC values demonstrated stronger correlations. The 25th percentile ADC had the strongest correlation with growth rate (ρ = −0.52, P < .001) and VDT (ρ = 0.60, P < .001) and enabled prediction of VDT (≤1 year or >1 year) with an area under the receiver operating characteristic curve of 0.86 (sensitivity, 67%; specificity, 89%) (P < .001).
Conclusion
Apparent diffusion coefficient at baseline was negatively correlated with tumor growth rate. Diffusion-weighted MRI may be useful to identify clear cell renal cell carcinomas with higher growth rates.
© RSNA, 2020
See also the editorial by Goh and Prezzi in this issue.
Summary
The apparent diffusion coefficient from baseline diffusion-weighted MRI can be used to predict growth of clear cell renal cell carcinoma in patients with Von Hippel–Lindau disease.
Key Results
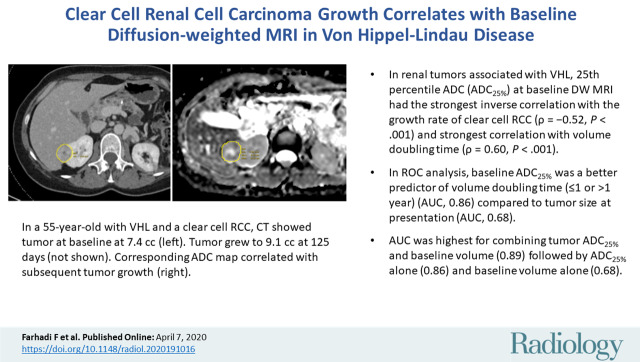
■ In renal tumors associated with Von Hippel–Lindau disease, the 25th percentile apparent diffusion coefficient (ADC25%) at baseline diffusion-weighted MRI had the strongest inverse correlation with the clear cell renal cell carcinoma growth rate (ρ = −0.52, P < .001) and the strongest correlation with volume doubling time (VDT) (ρ = 0.60, P < .001).
■ At receiver operating characteristic curve analysis, baseline ADC25% was a better predictor of VDT (≤1 year or >1 year) (area under the receiver operating characteristic curve [AUC], 0.86) than was tumor size at presentation (AUC, 0.68).
■ AUC was highest for combining tumor ADC25% and baseline volume (AUC, 0.89), followed by ADC25% alone (AUC, 0.86) and baseline volume alone (AUC, 0.68).
Introduction
Von Hippel–Lindau (VHL) disease is a multisystem inherited cancer syndrome that poses a risk for central nervous system and retinal hemangioblastomas, pancreatic cysts and neuroendocrine tumors, epididymal cystadenomas, renal cysts, and solid and cystic clear cell renal cell carcinomas (ccRCCs) (1–3). Although advances in the management of renal cell carcinoma and central nervous system hemangioblastoma have improved long-term outcomes in individuals with VHL disease, renal tumors remain the leading cause of death (2,4). Because of the recurrent and multifocal nature of renal disease, nephron-sparing surgical intervention remains the preferred method of treatment in the interest of preserving renal function and preventing metastasis.
To minimize the use of surgical procedures, active surveillance of patients until the largest tumor reaches 3 cm in diameter is often recommended because metastasis is rare in smaller tumors. In addition, patients with VHL disease often have numerous renal tumors at one time point. Thus, a method to assess intrasubject variation in growth kinetics of multiple tumors within a kidney could improve identification and tracking of tumors with the highest growth rates to more appropriately time surgical intervention (3,5).
The frequency of surveillance and appropriate timing of intervention for VHL-associated renal tumors are based on the size, location, and growth rate of renal tumors. However, the identification of additional markers to aid the understanding of VHL renal tumor growth kinetics would allow individualization of patient care, thereby avoiding unnecessary screenings and optimizing interventions to reduce the risk for metastasis.
Although MRI is a mainstay for surveillance of VHL-associated renal tumors, use of sequences, such as diffusion-weighted (DW) imaging, could improve tumor characterization and overall patient care (3). DW imaging provides quantitative markers, such as apparent diffusion coefficients (ADCs), which frequently reflect changes in the histologic architecture of tissue (eg, cellularity, microcirculation, membrane integrity) before observation of any gross structural changes with conventional sequences, such as T1- or T2-weighted imaging (6–8).
As such, DW imaging has recently been applied to oncologic imaging for tumor detection and characterization, as well as for prediction and monitoring of treatment response. In regard to renal cell carcinoma, ADC values have shown promise in determining tumor aggressiveness through accurate differentiation of high- and low-grade ccRCC tumors (9) and cellularity of renal tumors (10). However, to our knowledge, the longitudinal relationship between ADC value and growth of renal tumors has not been investigated. The aim of this study was to determine whether the degree of restricted diffusion at MRI, quantified as ADC, holds predictive value for the growth rate of VHL-associated ccRCC.
Materials and Methods
A prospectively maintained registry of consecutive patients with hereditary renal cancers was queried for individuals with a confirmed diagnosis of VHL who underwent surgical resection of tumors between November 2014 and October 2017. All data used were compliant with the Health Insurance Portability and Accountability Act and were acquired with institutional review board–approved protocols. Patients gave written informed consent to participate in this protocol (NCI-89-C-0086).
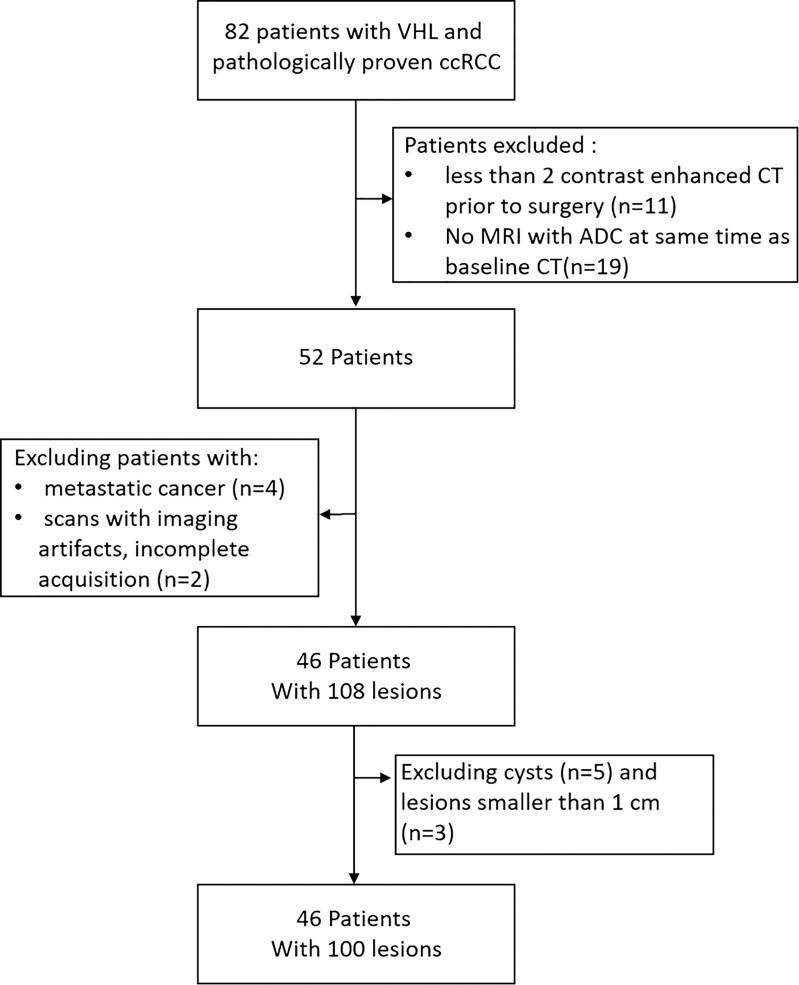
For this retrospective study, patients were required to have undergone contrast material–enhanced CT at a minimum of two time points before surgery, as well as MRI, including DW MRI, on the same date as baseline CT. In our research institution, because of the multisystemic nature of the disease, patients with VHL undergo simultaneous or alternating MRI and CT during routine surveillance. Thus, we excluded patients with fewer than two contrast-enhanced CT examinations before surgery, patients who did not undergo DW MRI at the same time as baseline CT, patients with metastasis, and patients whose images showed artifacts or incomplete acquisition. Moreover, cysts, complex lesions, and tumors smaller than 1 cm were excluded from this study (Fig 1). A subset of 11 patients described in this study were previously evaluated for germline mutations and growth (11). All tumors included in this study were pathologically confirmed as ccRCC based on pathology reports generated after surgical excision.
Figure 1:
Flowchart shows patient selection. ADC = apparent diffusion coefficient, ccRCC = clear cell renal cell carcinoma, VHL = Von Hippel–Lindau disease.
MRI Examinations
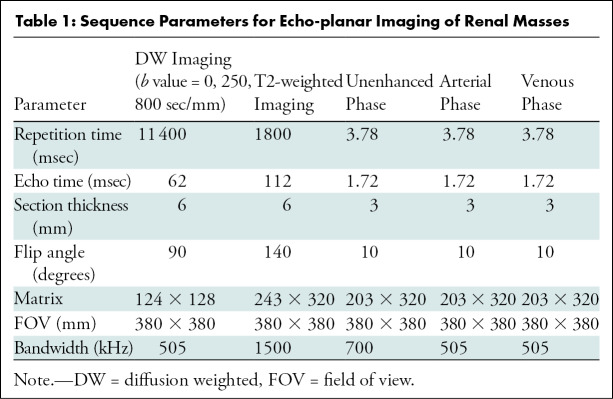
All MRI examinations were performed with a 1.5-T machine using body matrix phased-array coils (Aera; Siemens Healthcare, Erlangen, Germany). DW imaging was performed with echo-planar sequences in the transverse position, and monoexponential ADC maps were generated by using an integrated picture archiving and communication system (Carestream, version 12.1.5; Carestream Health, Rochester, NY). In addition to DW imaging, patients underwent the following routine imaging sequences: multiplanar T2- and T1-weighted imaging before and after administration of contrast material in the arterial and venous phases. One dose of gadobutrol (0.1 mmol per kilogram of body weight, Gadovist; Bayer, Washington, DC) was administered and followed by a 20-mL saline flush. After contrast material injection, images were acquired during the corticomedullary (20 seconds), nephrogenic (70 seconds), and excretory (3 minutes) phases. Table 1 lists MRI acquisition parameters.
Table 1:
Sequence Parameters for Echo-planar Imaging of Renal Masses
CT Examinations
CT scans were obtained by using multidetector row CT scanners (Siemens Biograph, Siemens Somatom Definition Flash, and Siemens Somatom Force; Siemens Healthcare). All CT examinations were performed in accordance with our institution’s protocol for renal masses. Images were obtained in spiral mode with 92 × 0.6 mm collimation, 120- or 100-kV tube voltage with automatic tube current modulation, 2-mm section thickness with 1-mm increments, and 0.5-second gantry rotation time. Initially, an unenhanced CT image of the abdomen was obtained. Then, one dose of iopamidol (1.8 mL/kg [maximum dose, 130 mL], Isovue 300; Bracco Diagnostics, Melville, NY) was administered intravenously at a rate of 3–4 mL/sec. We used a 10-second delay for bolus tracking with arterial phase acquisition at a 100-HU threshold followed by acquisition in the nephrogenic phase 70 seconds after the arterial phase.
Image Analysis
Picture archiving and communication system imaging software with volumetric measurement capabilities (Carestream, version 12.1.5; Carestream Health, Rochester, NY) was used for image analysis. Tumor pathology reports were matched to imaging data to identify solid ccRCC tumors. Tumor boundaries were determined and segmented via inspection of DW and T1- and T2-weighted contrast-enhanced MRI and nephrographic-phase CT scans by an imaging research fellow (F.F., 2 years of experience). Each volumetric segmentation of tumors on ADC images (baseline) and nephrographic-phase CT images (baseline and follow-up) were reviewed and modified by an MRI-trained radiologist (A.A.M., 9 years of experience). For CT segmentations, images from each time point were viewed a minimum of 2 weeks apart to avoid observer bias. Segmentation was performed by using freehand regions of interest encircling the tumor on every section with a discernable tumor. To ascertain reliability of segmentation data, an additional set of segmentations was generated for all cases by a fellowship-trained body radiologist (E.C.J., 29 years of experience). All individuals who participated in segmentation were blinded to clinical data and follow-up images.
Tumor volumes were calculated from CT measurements by multiplying individual pixel volume by total number of pixels included in each segmentation. Tumor volume (V) was used to calculate growth rate (GR) between the two time points (t0, t1) in cubic centimeter per year, as follows:
Tumor volume doubling time (VDT) was calculated by using the following formula:
In the formulas, t1 − t0 is the time difference (in days) between baseline and follow-up, and V(t0) and V(t1) are the tumor volumes at baseline and follow-up, respectively.
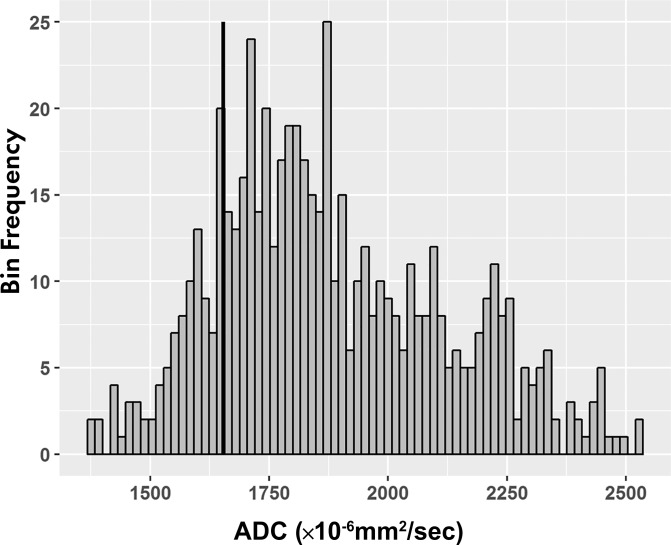
For ADC maps, voxel analysis of each segmented volume was performed, and histograms (binwidth = 16) were plotted with ADC on the x- and y-axis representing the number of voxels with that ADC value (Fig 2d). Tumor ADC parameters, including quartiles (25th, 50th, 75th), 10th and 90th percentiles, mean, skewness, and kurtosis, were derived from the histograms.
Figure 2d:
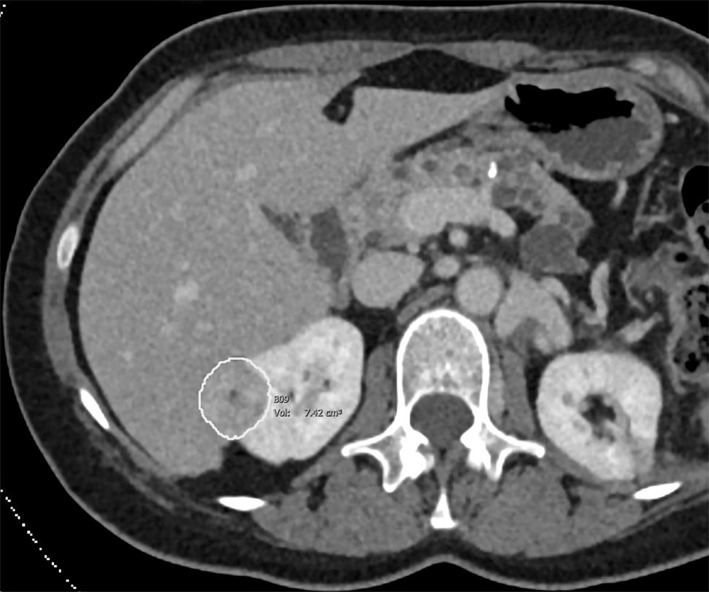
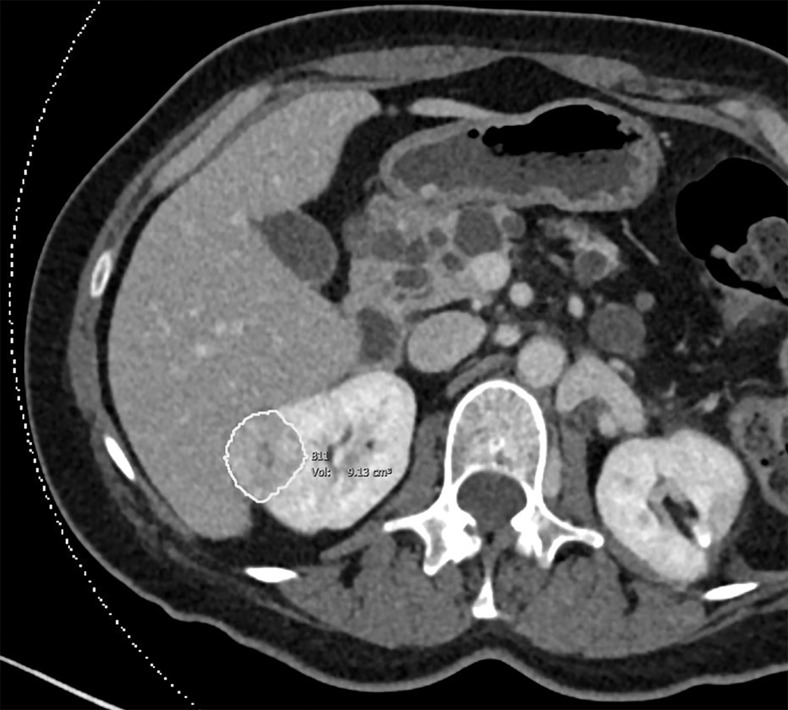
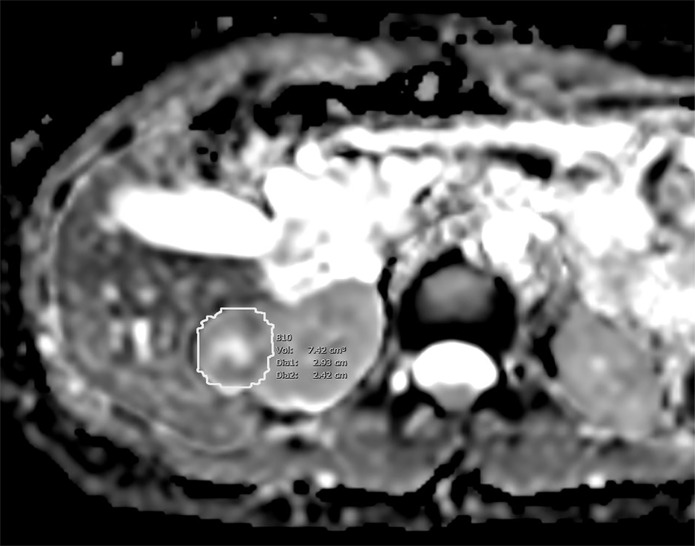
Images of clear cell renal cell carcinoma in a 55-year-old man with Von Hippel–Lindau syndrome. (a, b) Axial contrast material–enhanced nephrographic phase CT scans show the tumor was 7.4 cm3 at baseline (a) and had grown to 9.1 cm3 at 125 days (b). (c) Axial apparent diffusion coefficient (ADC) map of the tumor at baseline and (d) corresponding histogram percentile analysis.
Figure 2a:
Images of clear cell renal cell carcinoma in a 55-year-old man with Von Hippel–Lindau syndrome. (a, b) Axial contrast material–enhanced nephrographic phase CT scans show the tumor was 7.4 cm3 at baseline (a) and had grown to 9.1 cm3 at 125 days (b). (c) Axial apparent diffusion coefficient (ADC) map of the tumor at baseline and (d) corresponding histogram percentile analysis.
Figure 2b:
Images of clear cell renal cell carcinoma in a 55-year-old man with Von Hippel–Lindau syndrome. (a, b) Axial contrast material–enhanced nephrographic phase CT scans show the tumor was 7.4 cm3 at baseline (a) and had grown to 9.1 cm3 at 125 days (b). (c) Axial apparent diffusion coefficient (ADC) map of the tumor at baseline and (d) corresponding histogram percentile analysis.
Figure 2c:
Images of clear cell renal cell carcinoma in a 55-year-old man with Von Hippel–Lindau syndrome. (a, b) Axial contrast material–enhanced nephrographic phase CT scans show the tumor was 7.4 cm3 at baseline (a) and had grown to 9.1 cm3 at 125 days (b). (c) Axial apparent diffusion coefficient (ADC) map of the tumor at baseline and (d) corresponding histogram percentile analysis.
Statistical Analysis
Correlation of growth rate and volume doubling time with ADC histogram values was calculated by using the Bland-Altman method to account for within-participant correlation using the repeated-measures correlation (rmcorr) package in R Statistical Software (version 1.0.44; R Studio: Integrated Development Environment for R, Boston, Mass) (12). The latter was performed because multiple tumors were from the same patient. A bootstrapping method to 1000 replicates was used to assess the significance of the correlation and corresponding confidence interval (CI). This procedure was also used to measure relationships between tumor size at baseline with growth rate and VDT. P values were reported by using Bonferroni correction for multiple comparisons to account for the number of variables tested.
Shrout-Fleiss intraclass correlation coefficient was used to assess agreement of measurement values, including mean ADC and baseline and follow-up volume, for each tumor between radiologists (13).
Predictive performance of tumor size at baseline, the ADC parameter with the strongest correlation with VDT, and their combined performance were reviewed in classifying tumors with VDT of 1 year or less or more than 1 year with 95% CIs by using logistic regression with a generalized estimating equation. The model was based on binomial distribution and used an exchangeable correlation matrix to calculate estimates of prediction performance. A multinomial model was used to analyze combined (ADC and baseline volume) performance:
 |
The left side of this equation corresponds to the probability of the event, and the right side is the regression component for two independent variables (X and Z; ADC and baseline volume, respectively) in which β and γ are coefficients of regression and α is the intercept.
Receiver operating characteristic curves were drawn, and the area under this curve was calculated to assess the predictive value. For analysis of the receiver operating characteristic curve, cutoff points were calculated by maximizing the sum of sensitivity and specificity for differentiating tumors based on their VDT (≤1 year or >1 year). R statistical software was used for all statistical analysis, and significance was indicated by a two-sided P value of less than .05.
Results
Patient and Tumor Characteristics
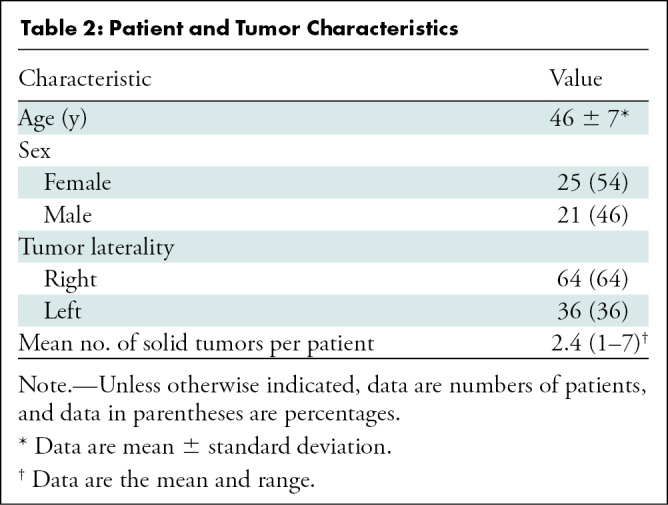
The study cohort consisted of 46 patients (25 women; mean age, 46 years ± 7 [standard deviation]) with a total of 100 tumors (Table 2). The mean follow-up interval was 397 days ± 233 (range, 67–1201 days). There was a mean of 2.4 tumors per patient (range, one to seven tumors). Tumors had a mean volume of 7.8 cm3 ± 3.9 (range, 0.6–50.9 cm3) at baseline and 10.3 cm3 ± 6.2 (range, 0.7–53.8 cm3) at follow-up. Mean tumor growth rate was 4.5 cm3 per year ± 3.2 (range, 0.2–14.6 cm3 per year), and mean VDT was 614.2 days ± 432.3 (range, 88–1964.6 days). A VDT of 1 year or less was seen in 36% (36 of 100) of tumors.
Table 2:
Patient and Tumor Characteristics
ADC Parameters
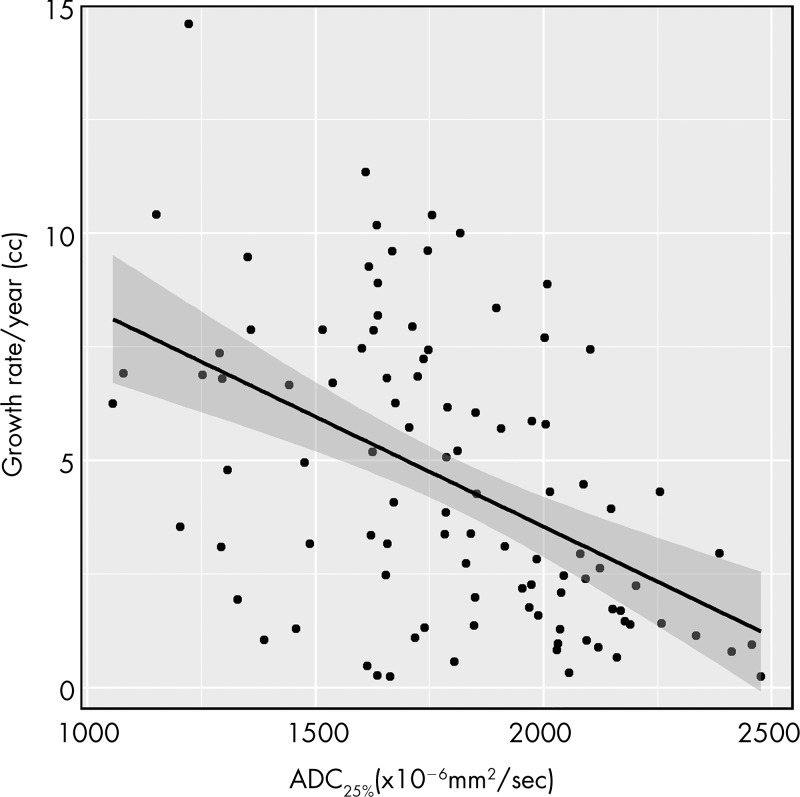
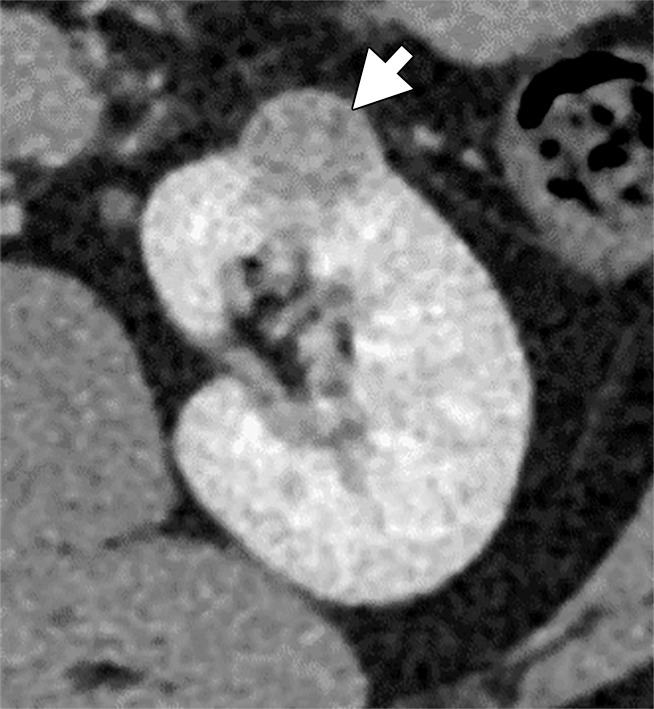
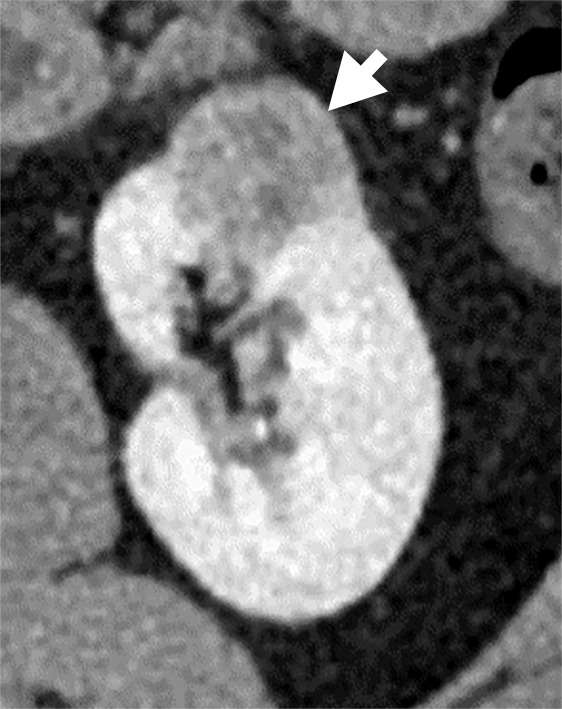
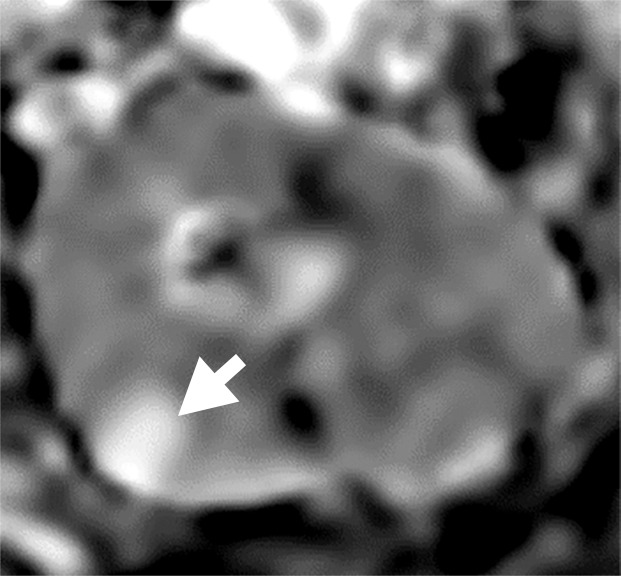
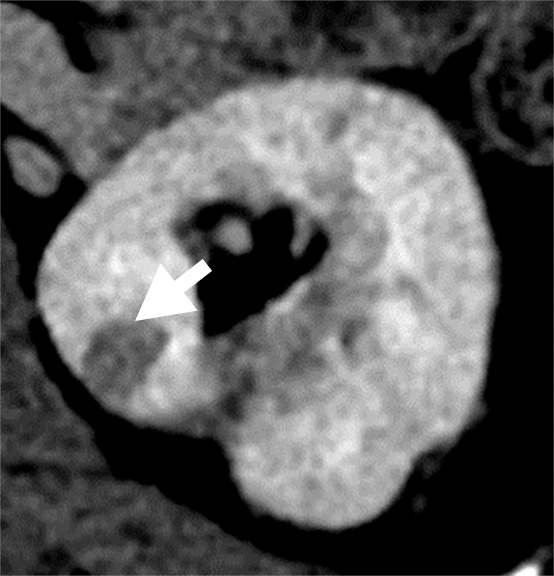
Table 3 summarizes the mean and median values of all measured ADC parameters of tumors at baseline. For all percentiles, ADC was inversely correlated with growth rate and was positively correlated with doubling time, indicating that lower ADC was associated with faster tumor growth and shorter doubling time (Fig 3). The 25th percentile ADC (ADC25%) showed the strongest correlation with tumor growth rate (ρ = −0.52 [95% CI: −0.62, −0.36]; P < .001) (Fig 4), followed by the 10th percentile ADC (ρ = −0.51 [95% CI: −0.63, −0.31]; P < .001), mean ADC (ρ = −0.44 [95% CI: −0.61, −0.28]; P < .001), median ADC (ρ = −0.42 [95% CI: −0.59, −0.31]; P < .001), 90th percentile ADC (ρ = −0.35 [95% CI: −0.46, −0.18]; P < .001), and 75th percentile ADC (ρ = −0.29 [95% CI: −0.52, −0.19]; P = .03). ADC skewness (ρ = −0.009 [95% CI: −0.13, 0.26]; P > .99) and kurtosis (ρ = −0.02 [95% CI: −0.30, 0.10]; P > .99) were not correlated with tumor growth rate.
Table 3:
Mean and Median Baseline Apparent Diffusion Coefficients
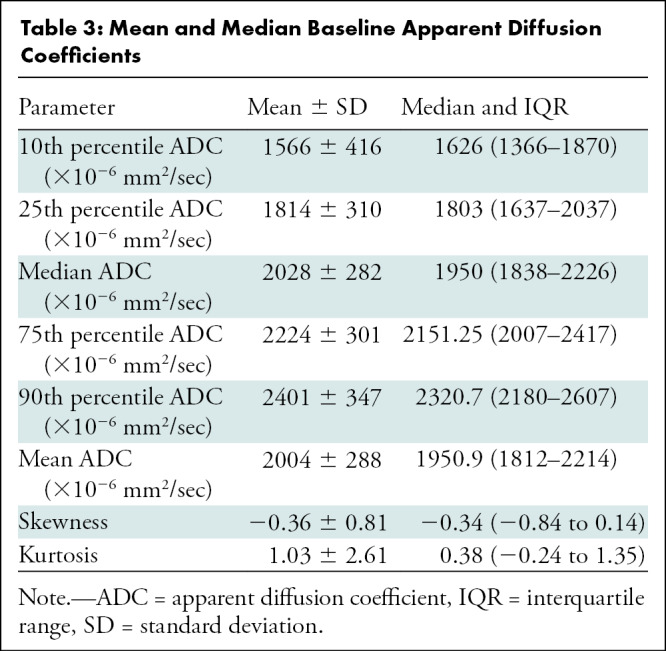
Figure 3a:
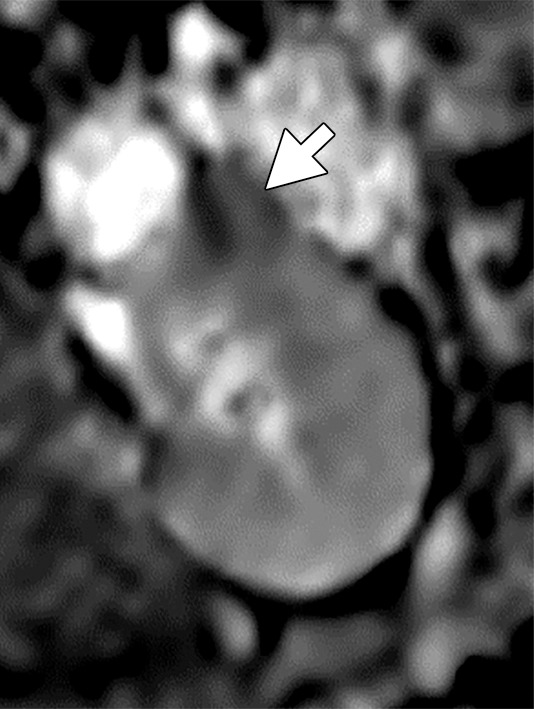
(a–c) Clear cell renal cell carcinoma (ccRCC) (arrow) in a 57-year-old man with Von Hippel–Lindau (VHL) disease that appears hypointense on (a) the baseline apparent diffusion coefficient (ADC) image (mean, 1536 × 10−6 mm2/sec) and shows 8.9 cm3 per year growth and 232-day doubling time between (b) baseline and (c) follow-up contrast-enhanced CT. (d–f) ccRCC (arrow) in a 61-year-old woman with VHL disease with a hyperintense appearance on (d) the baseline ADC image (mean, 2431 × 10−6 mm2/sec) with 2.5-cm3 per year growth and 1008-day doubling time between (e) baseline and (f) follow-up contrast-enhanced CT.
Figure 4:
Scatterplot shows tumor growth rate per year versus 25th percentile apparent diffusion coefficient (ADC25%) value of the tumor at presentation.
Figure 3b:
(a–c) Clear cell renal cell carcinoma (ccRCC) (arrow) in a 57-year-old man with Von Hippel–Lindau (VHL) disease that appears hypointense on (a) the baseline apparent diffusion coefficient (ADC) image (mean, 1536 × 10−6 mm2/sec) and shows 8.9 cm3 per year growth and 232-day doubling time between (b) baseline and (c) follow-up contrast-enhanced CT. (d–f) ccRCC (arrow) in a 61-year-old woman with VHL disease with a hyperintense appearance on (d) the baseline ADC image (mean, 2431 × 10−6 mm2/sec) with 2.5-cm3 per year growth and 1008-day doubling time between (e) baseline and (f) follow-up contrast-enhanced CT.
Figure 3c:
(a–c) Clear cell renal cell carcinoma (ccRCC) (arrow) in a 57-year-old man with Von Hippel–Lindau (VHL) disease that appears hypointense on (a) the baseline apparent diffusion coefficient (ADC) image (mean, 1536 × 10−6 mm2/sec) and shows 8.9 cm3 per year growth and 232-day doubling time between (b) baseline and (c) follow-up contrast-enhanced CT. (d–f) ccRCC (arrow) in a 61-year-old woman with VHL disease with a hyperintense appearance on (d) the baseline ADC image (mean, 2431 × 10−6 mm2/sec) with 2.5-cm3 per year growth and 1008-day doubling time between (e) baseline and (f) follow-up contrast-enhanced CT.
Figure 3d:
(a–c) Clear cell renal cell carcinoma (ccRCC) (arrow) in a 57-year-old man with Von Hippel–Lindau (VHL) disease that appears hypointense on (a) the baseline apparent diffusion coefficient (ADC) image (mean, 1536 × 10−6 mm2/sec) and shows 8.9 cm3 per year growth and 232-day doubling time between (b) baseline and (c) follow-up contrast-enhanced CT. (d–f) ccRCC (arrow) in a 61-year-old woman with VHL disease with a hyperintense appearance on (d) the baseline ADC image (mean, 2431 × 10−6 mm2/sec) with 2.5-cm3 per year growth and 1008-day doubling time between (e) baseline and (f) follow-up contrast-enhanced CT.
Figure 3e:
(a–c) Clear cell renal cell carcinoma (ccRCC) (arrow) in a 57-year-old man with Von Hippel–Lindau (VHL) disease that appears hypointense on (a) the baseline apparent diffusion coefficient (ADC) image (mean, 1536 × 10−6 mm2/sec) and shows 8.9 cm3 per year growth and 232-day doubling time between (b) baseline and (c) follow-up contrast-enhanced CT. (d–f) ccRCC (arrow) in a 61-year-old woman with VHL disease with a hyperintense appearance on (d) the baseline ADC image (mean, 2431 × 10−6 mm2/sec) with 2.5-cm3 per year growth and 1008-day doubling time between (e) baseline and (f) follow-up contrast-enhanced CT.
Figure 3f:
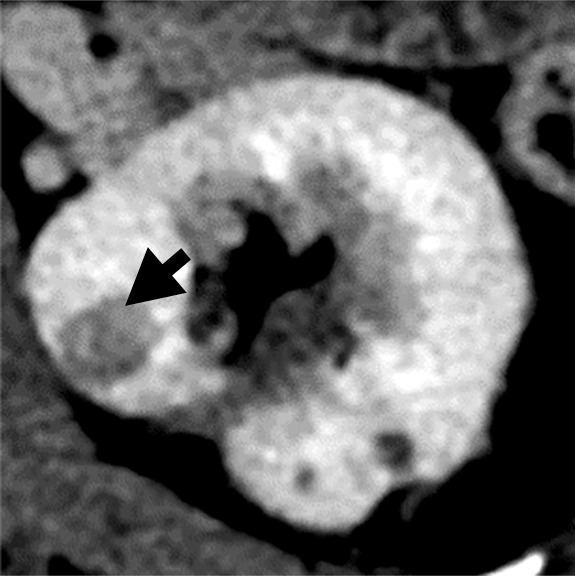
(a–c) Clear cell renal cell carcinoma (ccRCC) (arrow) in a 57-year-old man with Von Hippel–Lindau (VHL) disease that appears hypointense on (a) the baseline apparent diffusion coefficient (ADC) image (mean, 1536 × 10−6 mm2/sec) and shows 8.9 cm3 per year growth and 232-day doubling time between (b) baseline and (c) follow-up contrast-enhanced CT. (d–f) ccRCC (arrow) in a 61-year-old woman with VHL disease with a hyperintense appearance on (d) the baseline ADC image (mean, 2431 × 10−6 mm2/sec) with 2.5-cm3 per year growth and 1008-day doubling time between (e) baseline and (f) follow-up contrast-enhanced CT.
ADC25% also had the strongest correlation with VDT (ρ = 0.60 [95% CI: 0.48, 0.72]; P < .001), followed by 10th percentile ADC (ρ = 0.58 [95% CI: 0.35, 0.68]; P < .001), mean ADC (ρ = 0.58 [95% CI: 0.45, 0.71]; P < .001), median ADC (ρ = 0.56 [95% CI: 0.47, 0.72]; P < .001), 75th percentile ADC (ρ = 0.50 [95% CI: 0.40, 0.65]; P < .001), and 90th percentile ADC (ρ = 0.47 [95% CI: 0.30, 0.61]; P < .001). ADC skewness (ρ = −0.08 [95% CI: −0.32, 0.05]; P > .99) and kurtosis (ρ = 0.29 [95% CI: 0.02, 0.4]; P > .99) were not correlated with VDT.
Tumor size at baseline demonstrated a weak negative correlation (ρ = −0.38, P < .001) with growth rate, indicating that larger tumors at baseline showed a slower growth rate. Tumor size at baseline also correlated positively with volume doubling time (ρ = 0.42, P < .001).
ADC25% showed significance (P < .001) in categorizing tumors to VDT of 1 year or less or more than 1 year. It had a sensitivity of 67%, a specificity of 89%, and an overall accuracy of 81% (coefficient, −0.05; intercept, 8.9). Tumor size at baseline had a sensitivity of 33%, a specificity of 84%, and an overall accuracy of 66% (coefficient, −0.13; intercept, 0.2). Use of both ADC25% and tumor size at baseline resulted in a sensitivity of 67%, a specificity of 86%, and an overall accuracy of 79% (ADC25% coefficient: −0.06, tumor size coefficient, −0.2; intercept, 11.8).
Area under the receiver operating characteristic curve (AUC) was highest for the combination of ADC and baseline volume (AUC = 0.89), followed by the combination of ADC and ADC25% (AUC = 0.86) and the combination of ADC and tumor baseline volume (AUC = 0.68). Figure 5 shows the receiver operating characteristic curve and AUC for these three prediction models.
Figure 5:
Receiver operating characteristic curves plotted for differentiating tumors with volume doubling time of more than 1 year or 1 year or less show tumor volume at baseline (black), 25th percentile apparent diffusion coefficient (ADC25%) (red), and both (blue). AUC = area under the receiver operating characteristic curve.
Interobserver Agreement
Intraclass reliability of segmentation measurements resulted in mean κ scores of 0.89, 0.82, and 0.93 for mean ADC at baseline, baseline volume, and follow-up volume, respectively, indicating strong agreement between raters.
Discussion
Our findings indicate that Von Hippel–Lindau (VHL)-related clear cell renal cell carcinoma (ccRCC) tumors with lower baseline apparent diffusion coefficient (ADC) values tend to have faster growth rates than do tumors with higher ADC values. Lower ADC values indicate greater restricted diffusion, which is directly attributed to increased cellularity of tumors with intact cell membranes, which disrupts Brownian motion of water molecules within the tumor (14,15). In concordance with the negative correlation between ADC values and growth rate indicated in our study, negative correlations between ADC values and other pathologic characteristics (ie, cellular density, nucleus-to-cytoplasm ratio) have been noted in a variety of malignancies (16,17).
A previous study on prostate tumors also revealed a negative correlation between the ADC values and the proliferative activity of the tumors (18). In our study, this relationship was strengthened through observation of significant variation in renal tumor growth rates within the same kidney of a patient. We used a mathematic model to adjust for clustering effect of multiple masses in some patients, demonstrating that tumors with the highest growth rates demonstrated lower ADC values compared with slower growing tumors in the same patient.
Between ADC histogram parameters that were evaluated in our study, ADC25% showed the strongest correlation with both tumor growth rate and doubling time. Correlation with tumor growth rate was higher in lower ADC percentiles. Our results align with former findings that lower ADC percentiles demonstrate better performance for risk stratification of tumors in other cancer types (19,20). Moreover, previous studies have demonstrated relationships between lower ADC values and aggression of ccRCC regarding higher TNM staging, Fuhrman grade, and larger tumor size (9,10).
Tumor ADC is conventionally quantified by placement of a region of interest within a portion of the tumor demonstrating restricted diffusion by visual assessment. Because of intratumoral heterogeneity frequently observed in renal tumors in our study, ADC was evaluated over the whole tumor volume; a small region of interest could not accurately reflect different biologic characteristics within the tumor. Several studies have shown that histogram analysis of the entire tumor volume has substantial advantages for determining prognostic outcomes when analyzing diffusion as compared with conventional region of interest–based measurement (21,22) and minimizes interobserver bias related to selected region of interest placement (23).
In active surveillance of renal tumors, tumor size is most often the main determinant of frequency of follow-up of tumors, as well as timing of intervention. However, uncertainty about future growth patterns and risk for metastasis of renal tumors under active surveillance often influences clinicians and patients toward active treatment (24,25).
We found a weak association between tumor size at baseline and future growth rates, with smaller tumors growing proportionally faster than larger ones. This could be explained by a growth model, reported previously in multiple solid organ malignancies (including renal tumors), referred to as Gompertzian growth kinetics. Gompertzian growth kinetics theorizes that a tumor's growth is initially exponential but decreases as the tumor increases in size and eventually plateaus when it reaches a certain size (25).
Tumor VDT is another measure that is used in various cancers to index tumor progression (21,26). Our study assessed whether baseline tumor characteristics could provide insight on future tumor doubling time. We found that smaller tumors and tumors with lower ADC values tend to have a shorter doubling time.
Tumor volume at baseline also demonstrated good performance for differentiating tumors with short VDT (≤1 year) from tumors with a doubling time of more than 1 year (area under the receiver operating characteristic curve, 0.68). ADC had higher predictive performance, with much higher sensitivity (67% vs 33%) in detection of tumors with VDT of more than 1 year when compared with tumor size at baseline. Highest performance, however, was achieved when both ADC25% and baseline volume were used for prediction.
We suggest the use of ADC values for clinical evaluation of VHL-associated ccRCC tumors. A quantitative parameter such as ADC can accompany other less quantitative clinical sources to support clinician decisions concerning optimal surveillance of patients with VHL disease in the hopes of reducing metastasis while preserving renal function.
Although our study is one of the largest series to evaluate VHL renal tumors, our findings are limited by the small sample size and lack of an independent data set. Hence, our prediction performance measures are apt to be overestimates. Additionally, potential errors in manual image segmentation could have introduced inaccuracies in our data. Automatic segmentation algorithms could be a more practical solution to generate segmentation data in the future. Larger-scale validation studies with an independent data set are warranted. It is important to note that our findings need to be replicated in VHL-deficient tumors in patients with sporadic ccRCC.
In conclusion, use of apparent diffusion coefficient values at baseline may prove useful in the identification of clear cell renal cell carcinoma tumors with significantly increased growth rates. Our findings could provide a valuable tool for personalized clinical management plans that avoid unnecessary intensive surveillance of lower-risk renal tumors, instead focusing attention on tumors with higher risk for rapid growth and metastasis in patients with Von Hippel–Lindau disease.
Acknowledgments
Acknowledgments
We thank Dr Paul Wakim for providing insights on statistical analysis and Robert Evers for MRI technical support.
Supported by the Intramural Research Program of the NIH Clinical Center.
Disclosures of Conflicts of Interest: F.F. disclosed no relevant relationships. M.N. disclosed no relevant relationships. A.K.P. disclosed no relevant relationships. A.S. disclosed no relevant relationships. A.T. disclosed no relevant relationships. M.W.B. disclosed no relevant relationships. W.M.L. disclosed no relevant relationships. E.C.J. disclosed no relevant relationships. A.A.M. disclosed no relevant relationships.
Abbreviations:
- ADC
- apparent diffusion coefficient
- ADC25%
- 25th percentile ADC
- ccRCC
- clear cell renal cell carcinoma
- CI
- confidence interval
- DW
- diffusion weighted
- VDT
- volume doubling time
- VHL
- Von Hippel–Lindau
References
- 1. Lonser RR, Glenn GM, Walther M, et al . von Hippel-Lindau disease . Lancet 2003. ; 361 ( 9374 ): 2059 – 2067 . [DOI] [PubMed] [Google Scholar]
- 2. Nielsen SM, Rhodes L, Blanco I, et al . Von Hippel-Lindau disease: genetics and role of genetic counseling in a multiple neoplasia syndrome . J Clin Oncol 2016. ; 34 ( 18 ): 2172 – 2181 . [DOI] [PubMed] [Google Scholar]
- 3. Schmidt LS, Linehan WM. . Genetic predisposition to kidney cancer . Semin Oncol 2016. ; 43 ( 5 ): 566 – 574 . [DOI] [PMC free article] [PubMed] [Google Scholar]
- 4. Czarniecki M, Gautam R, Choyke PL, Turkbey B. . Imaging findings of hereditary renal tumors, a review of what the radiologist should know . Eur J Radiol 2018. ; 101 : 8 – 16 . [DOI] [PubMed] [Google Scholar]
- 5. Duffey BG, Choyke PL, Glenn G, et al . The relationship between renal tumor size and metastases in patients with von Hippel-Lindau disease . J Urol 2004. ; 172 ( 1 ): 63 – 65 . [DOI] [PubMed] [Google Scholar]
- 6. Giannarini G, Petralia G, Thoeny HC. . Potential and limitations of diffusion-weighted magnetic resonance imaging in kidney, prostate, and bladder cancer including pelvic lymph node staging: a critical analysis of the literature . Eur Urol 2012. ; 61 ( 2 ): 326 – 340 . [DOI] [PubMed] [Google Scholar]
- 7. Hötker AM, Mazaheri Y, Wibmer A, et al . Use of DWI in the differentiation of renal cortical tumors . AJR Am J Roentgenol 2016. ; 206 ( 1 ): 100 – 105 . [DOI] [PMC free article] [PubMed] [Google Scholar]
- 8. Zhang H, Gan Q, Wu Y, et al. Diagnostic performance of diffusion-weighted magnetic resonance imaging in differentiating human renal lesions (benignity or malignancy): a meta-analysis . Abdom Radiol (NY) 2016. ; 41 ( 10 ): 1997 – 2010 . [DOI] [PubMed] [Google Scholar]
- 9. Zhang YD, Wu CJ, Wang Q, et al . Comparison of utility of histogram apparent diffusion coefficient and R2* for differentiation of low-grade from high-grade clear cell renal cell carcinoma . AJR Am J Roentgenol 2015. ; 205 ( 2 ): W193 – W201 . [DOI] [PubMed] [Google Scholar]
- 10. Squillaci E, Manenti G, Cova M, et al . Correlation of diffusion-weighted MR imaging with cellularity of renal tumours . Anticancer Res 2004. ; 24 ( 6 ): 4175 – 4179 . [PubMed] [Google Scholar]
- 11. Farhadi F, Nikpanah M, Li X, et al . Germline VHL gene variant in patients with von Hippel-Lindau disease does not predict renal tumor growth . Abdom Radiol (NY) 2018. ; 43 ( 10 ): 2743 – 2749 . [DOI] [PMC free article] [PubMed] [Google Scholar]
- 12.Bakdash JZ, Marusich LR. Repeated measures correlation. Front Psychol 2017;8:456 [Published correction appears in Front Psychol 2019;10:1201.]. [DOI] [PMC free article] [PubMed] [Google Scholar]
- 13. Shrout PE, Fleiss JL. . Intraclass correlations: uses in assessing rater reliability . Psychol Bull 1979. ; 86 ( 2 ): 420 – 428 . [DOI] [PubMed] [Google Scholar]
- 14. Malayeri AA, El Khouli RH, Zaheer A, et al . Principles and applications of diffusion-weighted imaging in cancer detection, staging, and treatment follow-up . RadioGraphics 2011. ; 31 ( 6 ): 1773 – 1791 . [DOI] [PMC free article] [PubMed] [Google Scholar]
- 15. Qayyum A. . Diffusion-weighted imaging in the abdomen and pelvis: concepts and applications . RadioGraphics 2009. ; 29 ( 6 ): 1797 – 1810 . [DOI] [PMC free article] [PubMed] [Google Scholar]
- 16. Driessen JP, Caldas-Magalhaes J, Janssen LM, et al . Diffusion-weighted MR imaging in laryngeal and hypopharyngeal carcinoma: association between apparent diffusion coefficient and histologic findings . Radiology 2014. ; 272 ( 2 ): 456 – 463 . [DOI] [PubMed] [Google Scholar]
- 17. Patterson DM, Padhani AR, Collins DJ. . Technology insight: water diffusion MRI--a potential new biomarker of response to cancer therapy . Nat Clin Pract Oncol 2008. ; 5 ( 4 ): 220 – 233 . [DOI] [PubMed] [Google Scholar]
- 18. Wang XZ, Wang B, Gao ZQ, et al . Diffusion-weighted imaging of prostate cancer: correlation between apparent diffusion coefficient values and tumor proliferation . J Magn Reson Imaging 2009. ; 29 ( 6 ): 1360 – 1366 . [DOI] [PubMed] [Google Scholar]
- 19. Kang Y, Choi SH, Kim YJ, et al . Gliomas: Histogram analysis of apparent diffusion coefficient maps with standard- or high-b-value diffusion-weighted MR imaging--correlation with tumor grade . Radiology 2011. ; 261 ( 3 ): 882 – 890 . [DOI] [PubMed] [Google Scholar]
- 20. Donati OF, Mazaheri Y, Afaq A, et al . Prostate cancer aggressiveness: assessment with whole-lesion histogram analysis of the apparent diffusion coefficient . Radiology 2014. ; 271 ( 1 ): 143 – 152 . [DOI] [PubMed] [Google Scholar]
- 21. Lee JY, Kim CK, Choi D, Park BK. . Volume doubling time and growth rate of renal cell carcinoma determined by helical CT: a single-institution experience . Eur Radiol 2008. ; 18 ( 4 ): 731 – 737 . [DOI] [PubMed] [Google Scholar]
- 22. Wu CJ, Wang Q, Li H, et al . DWI-associated entire-tumor histogram analysis for the differentiation of low-grade prostate cancer from intermediate-high-grade prostate cancer . Abdom Imaging 2015. ; 40 ( 8 ): 3214 – 3221 . [DOI] [PubMed] [Google Scholar]
- 23. Gerlinger M, Rowan AJ, Horswell S, et al . Intratumor heterogeneity and branched evolution revealed by multiregion sequencing . N Engl J Med 2012. ; 366 ( 10 ): 883 – 892 . [DOI] [PMC free article] [PubMed] [Google Scholar]
- 24. Chawla SN, Crispen PL, Hanlon AL, Greenberg RE, Chen DY, Uzzo RG. . The natural history of observed enhancing renal masses: meta-analysis and review of the world literature . J Urol 2006. ; 175 ( 2 ): 425 – 431 . [DOI] [PubMed] [Google Scholar]
- 25. Crispen PL, Viterbo R, Boorjian SA, Greenberg RE, Chen DY, Uzzo RG. . Natural history, growth kinetics, and outcomes of untreated clinically localized renal tumors under active surveillance . Cancer 2009. ; 115 ( 13 ): 2844 – 2852 . [DOI] [PMC free article] [PubMed] [Google Scholar]
- 26. Lindell RM, Hartman TE, Swensen SJ, et al . Five-year lung cancer screening experience: CT appearance, growth rate, location, and histologic features of 61 lung cancers . Radiology 2007. ; 242 ( 2 ): 555 – 562 . [DOI] [PubMed] [Google Scholar]


