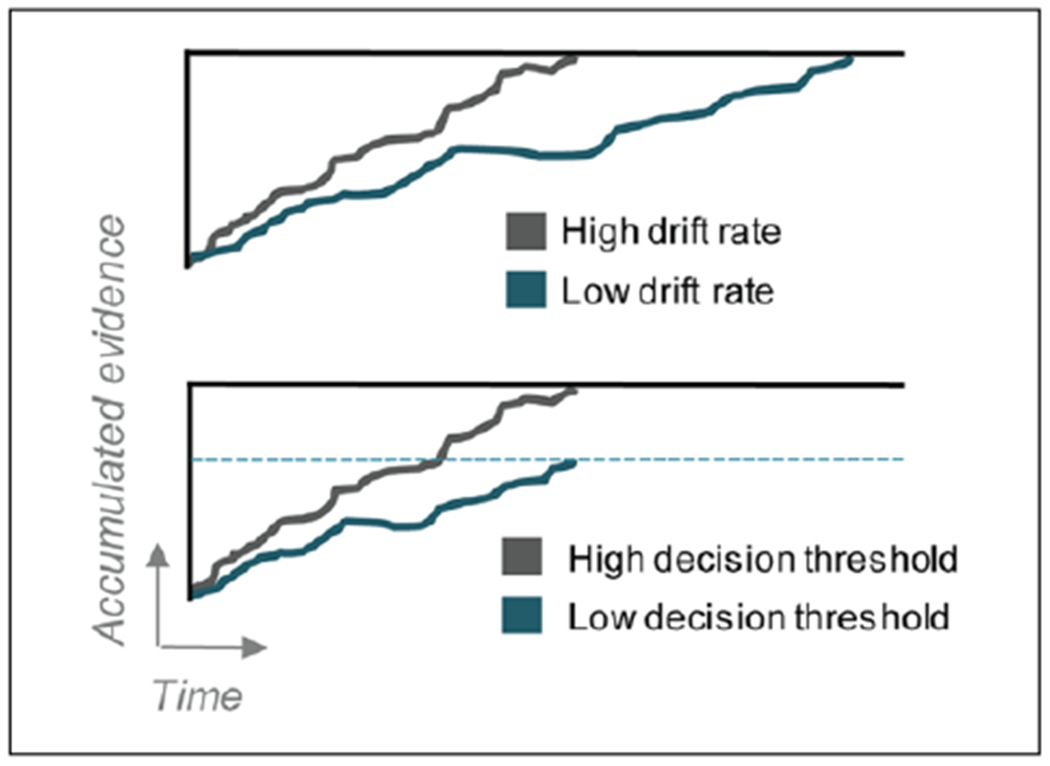
Figure 3.

Evidence accumulation and decision thresholds. Schematic illustration of the evidence accumulation process, indicating how accumulated evidence increases over time toward the decision threshold for the correct decision. When the accumulated evidence reaches the decision threshold, a response is made. Upper panel displays high and low drift rates of the accumulated evidence. In this case, both conditions eventually accumulate the same level of evidence and therefore will have similar accuracy, but it takes longer time when the drift rate is low, such as during a difficult task. Lower panel displays high and low decision thresholds. Drift rate is slower in the low-threshold condition, but since the decision threshold is lower, the response is made at the same time as the high-threshold condition, but with less accumulated evidence and therefore lower accuracy level.
