Abstract
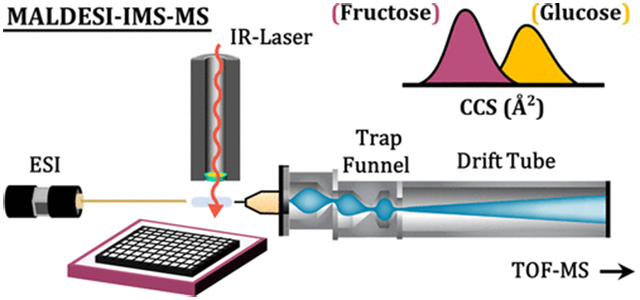
Because of its high degree of selectivity and chemical resolution, mass spectrometry (MS) is rapidly becoming the analytical method of choice for high-throughput evaluations and clinical diagnostics. While advances in MS resolving power have increased by an order of magnitude over the past decade, advances in sample introduction are still needed for high-throughput screening applications where the time frame of chromatographic separation would limit the duty cycle. Infrared matrix-assisted laser desorption electrospray ionization (IR-MALDESI) is an ambient ionization source that has been shown to be applicable for direct analyses and mass spectrometry imaging (MSI) of complex biological samples in a high-throughput manner. To increase a range of detectable features in IR-MALDESI experiments, we integrated the home-built ion source with a commercially available drift tube ion mobility spectrometer-mass spectrometer (IMS-MS) and analyzed small polar molecules, lipids, carbohydrates, and intact proteins. We also describe in detail how the pulsed ionization source was synchronized with IMS-MS.
Keywords: mass spectrometry imaging, ion mobility spectrometry, IR-MALDESI, high-throughput, isomer resolution
Graphical Abstract
In clinical and pharmaceutical applications, there is a largely unmet need for versatile instrumentation capable of screening a wide range of analytes while maximizing throughput.1,2 Mass spectrometry (MS) is the intuitive choice for such a platform, and modern time-of-flight (TOF) and Fourier transform (FT) mass analyzers provide mass resolution and quantitative performance at rates well under one sample per second.3,4 However, the throughput possible with mass spectrometers is effectively limited by the sample introduction process. Since biological samples often come as complex mixtures in a matrix of buffer salts, detergents, and other additives, sample pretreatment is often necessary prior to MS analysis. ESI-MS studies typically require online extractions and/or chromatography separations to minimize matrix effects; however, these steps greatly reduce sample throughput. While sample preparation steps such as filtering or extraction can be effectively parallelized to increase throughput, they are still performed at a rate significantly slower than the scan rate of the mass spectrometer. Furthermore, liquid chromatography (LC) and capillary electrophoresis (CE) separations typically require minutes to hours per sample depending on complexity, greatly hindering throughput.
INFRARED MATRIX-ASSISTED LASER DESORPTION ELECTROSPRAY IONIZATION (IR-MALDESI)
Infrared matrix-assisted laser desorption electrospray ionization (IR-MALDESI) is an ambient ionization source that has been successfully used for direct analyses as well as 2D and 3D mass spectrometry imaging of complex biological samples such as liquid buffers with high salt concentration,5-8 hairs,9 soft,10 and hard11 tissues. IR-MALDESI utilizes an infrared laser for sampling and generates ions through interactions between the aerosol of ablated material and charged electrospray droplets.12,13 The mechanism of ionization is very similar to ESI or DESI, where the ions are produced primarily from protonation/deprotonation reactions.14 IR-MALDESI has two key features that make it suitable for detection of analytes in a high-throughput fashion. First, IR-MALDESI ablates and ionizes material in a single concerted process; therefore, extremely fast analyses are possible with upper duty cycles nearing 20 Hz.7,15,16 Second, IR-MALDESI requires minimal to no sample preparation steps because exogenous ice is the only matrix used during analyses.17 In this work, we describe the construction of a novel IR-MALDESI ion interface coupled to ion mobility spectrometry for complementary separation with no increase in analysis time. This workflow has the potential to provide increased levels of molecular annotation in both high-throughput screening and imaging applications with the no trade-off in duty cycle. Since IR-MALDESI employs no cleanup steps or chromatographic separations prior to ionization, coupling the source with an ion mobility mass spectrometer helps to increase the coverage of isomeric and isobaric species.
ION MOBILITY SPECTROMETRY (IMS)
Ion mobility spectrometry (IMS) is a trending analytical separation technique which provides structural resolution of ions prior to their detection in a mass analyzer. IMS distinguishes ions based on their electrophoretic mobility differences in an inert gas (typically nitrogen) and under the influence of a weak electric field (ca. tens of V/cm). In IMS, the mobility of each ion is determined as a function of analyte velocity and field strength. Mobility measurements then enable the calculation of an ion-neutral size parameter referred to as the ion’s collision cross section, or CCS (Ω), via the Mason–Schamp eq (eq 1).18,19 By accounting for the density (N0) and temperature (T) of drift gas, the CCS of each analyte is calculated as a function of the ion’s charge (z), reduced mass (μ), and mobility (K0).20
| (1) |
IMS experienced rapid growth in the analytical community after interfacing IMS separations with high-resolution mass spectrometry for commercial instrumentation in the early 2000s.21 Because of the complementary speed and separatory capacity afforded by IMS, several different methods of mobility separation have been developed, including drift tube ion mobility spectrometry (DTIMS), traveling wave ion mobility spectrometry (TWIMS), trapped ion mobility spectrometry (TIMS), and field asymmetric waveform ion mobility spectrometry (FAIMS).22 If sufficient differences in molecular structure exist for the isomers, IMS can separate, identify, and quantify each in complex samples, provided appropriate analytical standards are available for structural verification. In addition to isomer separations, recent developments in the precision and reproducibility of IMS measurements have promoted wide-scale utility of translatable mobility values (CCS) across laboratories as an additional metric of ion annotation in untargeted experiments.23-25 These values are currently being collected across laboratories with subsequent compilation into libraries of CCS information. For example, recently Picache and co-workers have developed an online CCS database for open-access annotation of previously characterized samples.26 Using CCS values as additional ion descriptors, IMS-MS workflow provides exciting analytical utility in both targeted and untargeted analyses of biological and nonbiological samples.
IMS has been previously coupled with several ionization sources, such as MALDI,22,27,28 DESI,29,30 and LAESI31-33 to directly analyze biological and nonbiological samples. However, coupling an ablation-based ionization source with commercially available drift tube ion mobility to demonstrate spatial distribution of low-abundant and multiply charged species from a fresh, untreated sample using conventional MSI systems has not been thoroughly developed. In fact, it was quite challenging as novel timing systems with submicrosecond precision had to be developed and fully synchronized with the IMS. In this work, we describe the design and application of interfacing IR-MALDESI with a commercially available drift tube IMS for the ionization, separation, and detection of a wide range of small molecules, lipids, carbohydrates, and intact proteins to demonstrate the range of applications possible with this platform.
MATERIALS AND METHODS
Materials.
Methanol, water, acetonitrile, formic acid, and caffeine were obtained from Fisher Scientific (Hampton, NH, U.S.A.) at HPLC-grade or higher purity. Agilent Low Concentration Tuning Mix (Agilent Technologies, Santa Clara, CA) was used for mass and mobility calibrations. Triton X-100 and thioredoxin (from human) were obtained from Sigma-Aldrich (St. Louis, MO, U.S.A.). All optics and optomechanical components were purchased from Thorlabs (Newton, NJ, U.S.A.).
Instrument Integration.
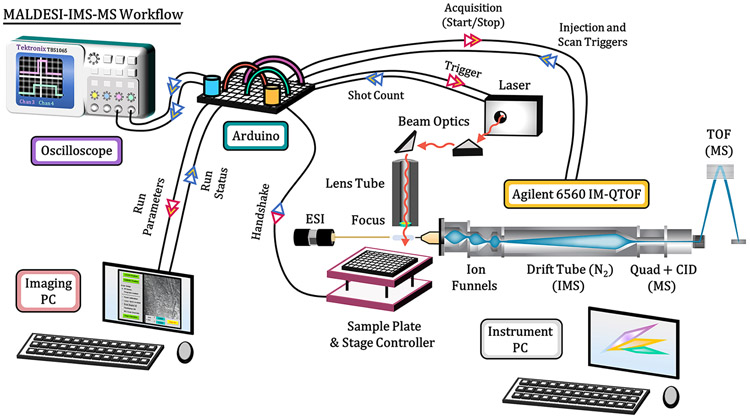
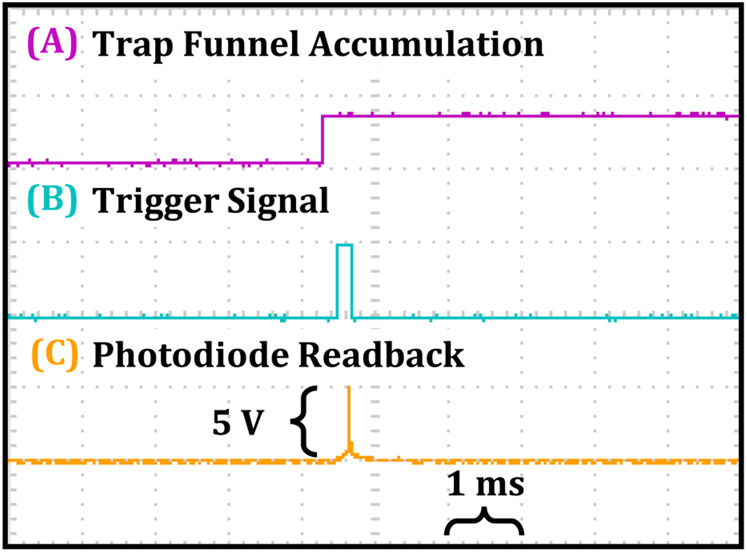
Figure 1 provides an illustrative depiction of the IR-MALDESI-IMS-MS workflow, along with corresponding communication sequences between various components (Supplemental Figure S1). The IMS-MS platform used in all experiments is a commercially available drift tube ion mobility spectrometer (DTIMS, Agilent 6560 IM-QTOF, Agilent Technologies, Santa Clara, CA). This instrument has been characterized in detail in previous publications.19,34 Mobility analysis is initiated by opening a trapping ion funnel for a preset duration prior to each injection into the linear drift tube (40 ms fill time and 60 ms/spectrum in these experiments). Adapting a pulsed, transient ion source like IR-MALDESI to IMS therefore necessitates accurate synchronization of peak ion current to active ion accumulation. The instrument does not natively support external triggering of single scans, so it was necessary to trigger the laser based on the trapping funnel state, which is continuously reported via externally accessible digital outputs. An Arduino Uno microcontroller (Arduino, Ivrea, Italy) was programmed to track the instrument state on a 200 μs timer running in parallel with the firing sequence of a custom-built pulsed mid-IR laser system (JGMA Inc., Burlington, MA). The operating principles of the laser have been described in detail previously.15 For each shot requested, the firing sequence waits for the appropriate funnel accumulation state before sending the trigger signal to the laser. The laser responds to the trigger with a burst of nanosecond-long pulses at 10 kHz for a specified trigger signal duration or until a maximum of approximately 15 pulses (~1 mJ/pulse), which is limited by the capacity of the current supply board (D100B, Highland Technology, San Francisco, CA). The laser activity was measured using a photodiode circuit fed back to the Arduino to allow easy control of the energy output by controlling the number of pulses per burst. A complete diagram for the triggering circuit is provided in Supplemental Figures S1 and S2, and the communication sequence for one pixel/burst is shown in Figure 2. The signals for trap funnel accumulation, laser triggering, and photodiode readback were monitored using a four-channel oscilloscope (TBS1064, Tektronix, Beaverton, OR), running at 100% duty cycle. Thus, for the experiments in this work, a single 1 mJ laser pulse provided ion acquisition at a rate of 10–20 Hz. For extended IMS-MS settings, see Supplemental Figure S3.
Figure 1.
MALDESI-IMS-MS workflow used in the manuscript. A diagram is shown illustrating the major components of the IMS-QTOF MS platform and the annotated connections to the Arduino microcontroller board used to control each acquisition. A temporal description of these steps is included in the Supporting Information (Supplemental Figure S1).
Figure 2.
Representative oscilloscope trace during acquisition. Each division represents 1 ms horizontally and 5 V vertically. (A) Agilent 6560 trapping funnel status readout. (B) Trigger signal from Arduino to laser. (C) Photodiode readback from one laser pulse.
To develop both an imaging interface and high-throughput screening IR-MALDESI-IMS-MS platform, the sampling orifice of the instrument had to be designed with dimensions allowing samples to fit under the electrospray axis with a reasonable amount of clearance for sample stage travel. To achieve this, a 2-in. capillary extension was constructed from stainless steel and PEEK (Supplemental Figure S4). A magnetic identifier was removed from a separate NanoESI source and used to bypass the instrument interlock. The driving voltage for the electrospray was set at +3500 V using an external high voltage supply and the instrument-specified capillary voltage was held at 0 V. Solvent for the ESI process (50/50 H2O/MeOH or H2O/ACN) was provided by a Harvard Apparatus syringe pump (Cambridge, MA) operating at a flow rate of 1 μL/min through a home-built capillary emitter with I.D. of 50 μm, silica tubing, and stainless steel union where voltage was applied.
Safety Considerations.
The experiment as described involves defeating the safety interlock of the instrument in order to run without a source enclosure. This allows the user to enable a high voltage power supply to apply potential to parts of the instruments exposed to intentional or accidental contact with persons and equipment. The electrospray high voltage supply is likewise exposed. The laser used for sampling is a class IV invisible pulsed IR laser, which can produce a significant amount of energy at a principle wavelength of 2970 nm. By NC State regulations, all personnel in the location with the class IV laser installed must first undergo laser safety training. Adequate eye protection for each system was a minimum precaution.
RESULTS AND DISCUSSION
Optimization of IR-MALDESI Ionization.
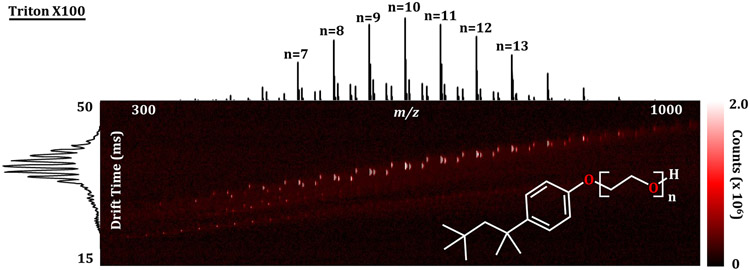
An aqueous solution of Triton X-100 (1 mg/mL) was used to evaluate the efficiency of the IR-MALDESI sampling and transfer into the IMS-MS platform (Figure 3). Droplets were manually spotted onto a plate placed at the laser focal plane and sampled by manual triggering of single laser shots. The characteristic IMS-MS spectrum containing both the drift time and mass information was used to evaluate optimum conditions during adjustments of the source settings such as internal voltages, temperatures, and laser energy. The instrument was initially configured to mirror previous parameters for IR-MALDESI analysis on an Orbitrap platform.35 The initial parameters used placed the laser axis 1 mm from the electrospray emitter tip and 5 mm from the inlet capillary. Varying these measurements by up to several millimeters had only subtle effects on signal for the Triton X-100 solution; therefore, the initial positioning was retained.
Figure 3.
Quality control and initial data from the MALDESI-IMS-MS platform. A nested IMS-MS spectrum of 1 mg/mL Triton X-100 in water at suitable conditions for IR-MALDESI sampling. The characteristic series of repeating peaks between 400 and 800 m/z was used as a quality reference for tuning the system and to verify that sampling and ionization were efficient. Heatmap colors in the drift time − m/z space correspond to the abundance of each feature.
Liver Analysis.
After tuning the instrument, a lipid extract from a healthy rat liver was prepared using the Folch extraction method.41 To reduce volatility and increase IR absorptivity, the organic, lipid-rich fraction was isolated and diluted 1:1 with methanol to a final composition of approximately 75% methanol and 25% chloroform prior to analysis. Droplets of lipid extract were manually dispensed and analyzed. Figure 4 illustrates the observed mass spectra using the IR-MALDESI-IMS-MS platform, which primarily consisted of phosphatidylcholines in both protonated and sodiated forms. A separate extraction from the same liver was also directly infused into a Q Exactive Plus mass spectrometer to provide an interplatform comparison (Supplemental Figure S5). The identities and relative abundances of the main lipid signals were in all cases similar, and the measured m/z ratios agreed with the annotations by accurate mass to within 5 ppm. While the IMS did not detect all lipids observed in the Orbitrap analysis, all ions noted by IMS were also observed on the Orbitrap. The sensitivity of the IMS platform is possibly lower because of the pulsed nature of the mobility experiment; however, the ability to match tentative lipid annotations by CCS to previous studies is an advantage afforded to IMS (Supplemental Figure S6).42 We note here that only the length of acyl chains and number of double bonds are described for the PC lipids noted in both the IMS and Orbitrap analysis. A significant challenge in the lipidomics community is to develop a high-confidence method to characterize location and geometry of double bonds in untargeted analysis. While previous studies have demonstrated the capabilities of IMS to separate these classes of isomers, comprehensive lipid characterization solely based on m/z and CCS remains a challenge and will likely need to be addressed by several orthogonal methods, such as incorporating novel fragmentation methods (e.g., OzID,43,44 UVPD45) in complementary analysis with chromatography and ion mobility.
Figure 4.
Mass spectrum for a lipid extract of rat liver for the IR-MALDESI-IMS-MS platform with putative identifications. The series of protonated and sodiated phosphatidylcholine (PC) cations observed is ubiquitous in mass spectrometry imaging of animal tissue. This series was also observed with an IR-MALDESI-Orbitrap platform.
Coca-Cola Analysis.
After optimization of the IR-MALDESI-IMS-MS sampling process, a quantification assay was designed to characterize the dynamic range of the platform. First, a caffeine solution was prepared by sequential dilution from 1000 to 16 μg/mL in 50:50 methanol/water and manually dispensed into microtiter plate wells. Each well was analyzed continuously for 1 min with one laser shot per IMS acquisition, and the results were summed together. The dilution analyses were repeated several times, each with the samples run in order of increasing concentration, to minimize the impact of carry-over. A sample of Coca-Cola Classic (the Coca-Cola Company, Atlanta, GA) of nominal caffeine content of ca. 98 μg/mL was also assessed to evaluate matrix effects. The sample was decarbonated through brief sonication and analyzed in the same way as the calibration solution.
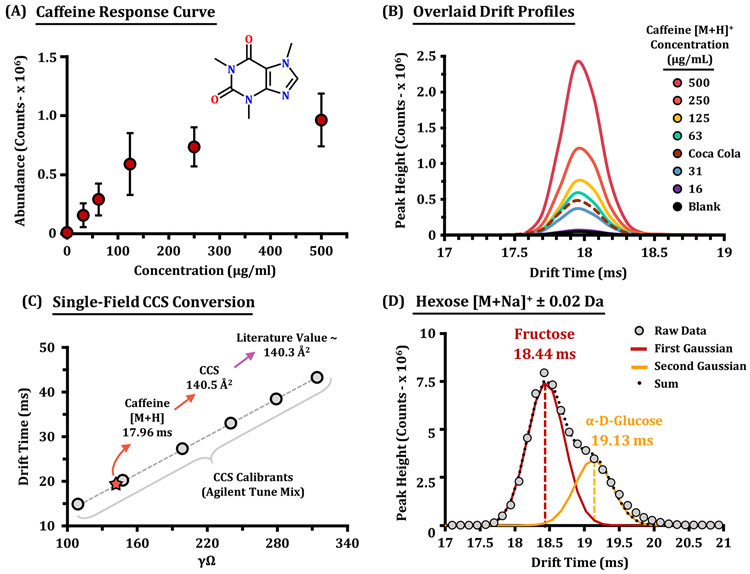
Results from IR-MALDESI direct analysis of the caffeine solutions are shown in Figure 5. The calibration curve (Figure 5A) shows that a region of detector saturation is reached at concentrations in excess of 100 μg/mL. Blanks run immediately after the most concentrated samples showed caffeine at <1% of the previously measured signal. This effect could be further reduced by diluting the viscous sample or attenuating the power of the laser to decrease the amount of material sampled per laser pulse. To achieve the greatest potential dynamic range, shielding or active decontamination of the emitter is necessary but is currently beyond our proof of concept demonstrated in this work. Using the values on the can may lead to an underestimation by a factor of approximately two (98 μg/mL), which is most likely due to suppression effects from the sample matrix. To obtain a more accurate quantitative measurement in future studies, matrix matching would be advantageous, as our caffeine standard was dissolved neat. Using a same-day caffeine calibration curve to calculate the concentration of caffeine in Coca-Cola resulted in an estimate of 50 μg/mL of caffeine (Figure 5B). For higher-precision quantitative analysis, heavy labeled internal standards would be utilized as demonstrated previously using a similar IR-MALDESI source interfaced to an Orbitrap MS.46 Raw drift times for caffeine were converted to CCS using the single-field method, the resulting CCS value (140.5 Å2 is in agreement with previous measurements (140.3 Å2)) (Figure 5C).23 In particular, the mass spectra from the undiluted sample are dominated by an intense peak at m/z 203.05, corresponding to sodium adducts of hexose.
Figure 5.
IR-MALDESI-IMS-MS of small molecules. (A) Average abundance evaluations for the [M + H]+ signal of caffeine summed for per concentration level (or 50 IMS acquisitions) with error bars illustrating one standard deviation. (B) IMS drift time profiles for each caffeine concentration level, including a solvent blank and undiluted Coca-Cola. (C) Single-field calibration curve utilized to convert drift time values to CCS. The drift time measured for the [M + H]+ caffeine ion was 17.96 ms, which after conversion to CCS was calculated to 140.5 Å2. Previous literature measurements of caffeine produced an average CCS value of 140.3 Å2, which is in good agreement. (D) The drift time profile of the hexose sugar [M + Na]+ ion acquired from the Coca-Cola sample. Two Gaussian peaks were fit to the profile illustrating CCS values consistent with fructose and glucose in an abundance ratio of 68:32.
As shown in Figure 5D, the mobility profile of this distribution illustrates two contributing components, perhaps isomeric compounds with shared molecular formula, C6H6O6Na. The CCS Compendium recently published from the McLean Lab and supporting CCS values26,47 were then used to tentatively annotate these features as fructose and glucose with a mass error of ca. 2 ppm and CCS errors of <0.7% (Supplemental Figure S7). Since high fructose corn syrup is a known ingredient in Coca-Cola (100 mg/g), this illustrates the analytical utility in IMS to provide rapid isomer distinction in a time frame compatible with high-throughput screening and MSI.
Intact Protein Analysis.
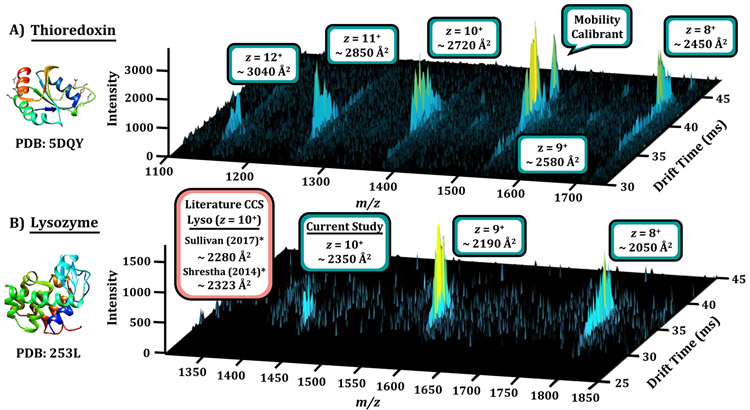
Since the ability of IR-MALDESI to ionize peptides and proteins from liquid and solid-state standards has already been demonstrated,13,36 an additional objective of this work was to interface the IR-MALDESI source with IMS to rapidly characterize intact proteins as well as small molecules from both biological and nonbiological samples (not standards). We started with intact protein analysis of thioredoxin from human (Figure 6A) and lysozyme from hen egg (Figure 6B), both of which are in the 12–15 kDa range (PDB structures 5DQY37 and 253L,38 respectively). To ensure ease of transfer through ion optics in the mass spectrometer, proteins were first analyzed using a conventional ESI source (Agilent Jet Stream) with a buffer of 5 mM ammonium acetate in 50/50 water/methanol. After ensuring efficient ion transmission, each protein was effectively ionized using the prototype IR-MALDESI source. The resulting spectra for thioredoxin and lysozyme are illustrated in panels A and B, respectively, of Figures 6. Lysozyme acts as a quality control and a model system which has been extensively characterized in the literature. For instance, studies by Shrestha and Vertes, using traveling wave IMS,31 and Sullivan et al., using conventional drift tube IMS, have examined various charge states of this model protein.39 Both experiments, including the present study, were conducted in nitrogen drift gas. Our measured value of 2350 Å2 for the 10+ state of lysozyme is in acceptable correlation with these previous studies at 1.2% and 3.1% difference in CCS, which is approaching the error of reproducibility. Additional charge states and their correlation with the literature are annotated in Supplement Figure S8. Additionally, the CCS values measured for lysozyme in both ESI and IR-MALDESI on our DTIMS platform are in close agreement. While these results are encouraging, fully characterizing the effect on protein structure by ionization IR-MALDESI would require a larger data set of native proteins compared with nanoelectrospray ionization, at biological conditions. This avenue may be pursued in future studies but is beyond the scope of the current work. The small proteins utilized in this work were analyzed to ensure efficient ionization by the prototype ion source for generation of preliminary IMS data. We do note that each ionization method in this work uses 50% organic, and as such, these conditions do not reflect the native state. Future investigations of more heavily studied proteins (e.g., ubiquitin, myoglobin) could help ascertain the degree of conservation of native structure in the IR-MALDESI process.40
Figure 6.
MALDESI-IMS-MS nested spectra of intact proteins. (A) N-terminal histidine tagged thioredoxin protein from human, with observed charge states ranging from 8+ to 12+ charge states analyzed in 50/50 water/methanol. The feature at m/z 1522 is one component of the Agilent Tune Mix used to calculate CCS in single-field IMS mode. (B) Lysozyme nested spectra for the 8+, 9+, and 10+ charge states and corresponding CCS values. Crystal structures were visualized in Chimera from the corresponding PDB entry. Detailed deviations in CCS values between studies are detailed in Supplemental Figure S8.
Imaging Analysis.
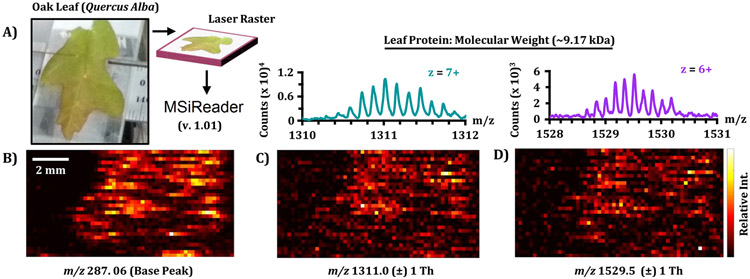
Although the previous experiments have demonstrated the capability of the developed workflow to analyze samples in a high-throughput manner, an additional benefit of the IR-MALDESI source is to spatially ionize analytes for localized MS information. A proof-of-concept imaging experiment was performed using an existing platform for imaging, adapted for the IM-QTOF platform.12 A locally sourced oak leaf on the NC State campus was harvested for imaging analysis and analyzed with sequential line scans (Figure 7A). IMS-MS spectra were extracted from the Agilent.d file and converted to .imzML format48 as a single row of TOF scans, which was subsequently loaded with a modified version of MSiReader 1.0149,50 that is currently under development to support IMS-MS data. The scans were arranged into a multidimensional matrix with spatial coordinates and drift time information conserved. Image heatmaps were generated for peaks of interest based on sum abundance in a mass-drift window, with a few representative images presented in Figures 7B-D. The base peak in the tissue-correlated sum spectrum, m/z 287.06, is tentatively annotated as any of several isomeric flavonoids of the formula C15H10O6. Interestingly, we also observed multiply charged species on the oak leaf, in particular two features at m/z 1311 (z = 7+) and 1529 (z = 6+). The deconvoluted masses for both features approximate to 9.17 kDa, likely a small protein. As our previous findings demonstrated that our instrument setup could readily analyze intact proteins, these results were exciting, as our previous IR-MALDESI analysis of biological samples using trap-based systems has lacked the dynamic range to detect native proteins over the background signal of abundant lipids and metabolites.
Figure 7.
Raster experiment with consecutive line scans of a locally sourced oak leaf. (A) After sample collection, spectra were acquired using the developed IR-MALDESI-IMS-MS system and exported to MSiReader for data visualization. Ion heatmaps for the base peak and highly charged features are illustrated with corresponding mass spectra (B, C, and D, respectively.)
CONCLUSIONS
The combination of IR-MALDESI and IMS-MS in this manuscript illustrates an effective platform for high-throughput screening capabilities and imaging MS, while also maximizing the data content for each acquired spectrum. Because of the similar millisecond timing regimes for IR-MALDESI and IMS, the techniques couple extremely well. Furthermore, the rapid isomer and isobar separations from the IMS illustrate the widespread implication for the IR-MALDESI-IMS-MS workflow in small polar molecule, lipid, carbohydrate, and intact protein studies. The IR-MALDESI-IMS-MS platform detailed in this manuscript was also fully built using standard parts. Thus, this manuscript details a platform that is fully assessable for others in the scientific community and is capable of providing rapid isomer and mass separations for enhanced MSI studies in pharmaceutical and clinical industries.
Supplementary Material
ACKNOWLEDGMENTS
The authors wish to thank John Fjeldsted, Alex Apffel, and Bill Frazer of Agilent Technologies Inc. for providing technical advice. All animal tissue samples used in this paper were obtained from animals raised using practices approved by the North Carolina State University Institutional Animal Care and Use Committee (IACUC). All mass spectrometry measurements were made in the Molecular Education, Technology, and Research Innovation Center (METRIC) at NC State University. Funding for this work was made possible through grants from the NIH (R01GM087964) and the NIH National Institute of Environmental Health Sciences (P42 ES027704). Additional funding was also provided by startup funds from North Carolina State University.
Footnotes
Supporting Information
The Supporting Information is available free of charge at https://pubs.acs.org/doi/10.1021/jasms.9b00081.
Drawing and complete bill of materials for IR beam guide; detailed circuit diagram for Arduino-based control board, including a functional example program; and additional data (PDF)
The authors declare no competing financial interest.
Contributor Information
Måns Ekelöf, FTMS Laboratory for Human Health Research, Department of Chemistry, North Carolina State University, Raleigh, North Carolina 27695, United States.
James Dodds, FTMS Laboratory for Human Health Research, Department of Chemistry, North Carolina State University, Raleigh, North Carolina 27695, United States.
Sitora Khodjaniyazova, FTMS Laboratory for Human Health Research, Department of Chemistry, North Carolina State University, Raleigh, North Carolina 27695, United States.
Kenneth P. Garrard, FTMS Laboratory for Human Health Research, Department of Chemistry and Precision Engineering Consortium, Department of Mechanical and Aerospace Engineering, North Carolina State University, Raleigh, North Carolina 27695, United States
Erin S. Baker, FTMS Laboratory for Human Health Research, Department of Chemistry, North Carolina State University, Raleigh, North Carolina 27695, United States.
David C. Muddiman, FTMS Laboratory for Human Health Research, Department of Chemistry and Molecular Education, Technology, and Research Innovation Center (METRIC), North Carolina State University, Raleigh, North Carolina 27695, United States.
REFERENCES
- (1).Kim M-J; Kim H; Cha I-J; Park J-S; Shon J-H; Liu K-H; Shin J-G High-throughput screening of inhibitory potential of nine cytochrome P450 enzymes in vitro using liquid chromatography/tandem mass spectrometry. Rapid Commun. Mass Spectrom 2005, 19, 2651–2658. [DOI] [PubMed] [Google Scholar]
- (2).Chen P Electrospray Ionization Tandem Mass Spectrometry in High-Throughput Screening of Homogeneous Catalysts. Angew. Chem., Int. Ed 2003, 42, 2832–2847. [DOI] [PubMed] [Google Scholar]
- (3).Hu Q; Noll RJ; Li H; Makarov A; Hardman M; Graham Cooks R The Orbitrap: a new mass spectrometer. J. Mass Spectrom 2005, 40, 430–443. [DOI] [PubMed] [Google Scholar]
- (4).Kafader JO; Melani RD; Senko MW; Makarov AA; Kelleher NL; Compton PD Measurement of Individual Ions Sharply Increases the Resolution of Orbitrap Mass Spectra of Proteins. Anal. Chem 2019, 91, 2776–2783. [DOI] [PubMed] [Google Scholar]
- (5).Fideler J; Johanningsmeier SD; Ekelöf M; Muddiman DC Discovery and quantification of bioactive peptides in fermented cucumber by direct analysis IR-MALDESI mass spectrometry and LC-QQQ-MS. Food Chem. 2019, 271, 715–723. [DOI] [PubMed] [Google Scholar]
- (6).Nazari M; Malico AA; Ekelöf M; Lund S; Williams GJ; Muddiman DC Direct analysis of terpenes from biological buffer systems using SESI and IR-MALDESI. Anal. Bioanal. Chem 2018, 410, 953–962. [DOI] [PMC free article] [PubMed] [Google Scholar]
- (7).Nazari M; Ekelöf M; Khodjaniyazova S; Elsen NL; Williams JD; Muddiman DC Direct screening of enzyme activity using infrared matrix-assisted laser desorption electrospray ionization. Rapid Commun. Mass Spectrom 2017, 31, 1868–1874. [DOI] [PMC free article] [PubMed] [Google Scholar]
- (8).Bai H; Khodjaniyazova S; Garrard KP; Muddiman DC Three-Dimensional Imaging with Infrared Matrix-Assisted Laser Desorption Electrospray Ionization Mass Spectrometry. J. Am. Soc. Mass Spectrom. 2019, DOI: 10.1021/jasms.9b00066. [DOI] [PMC free article] [PubMed] [Google Scholar]
- (9).Gilliland WM Jr; Prince HM; Poliseno A; Kashuba AD; Rosen EP Infrared Matrix-Assisted Laser Desorption Electrospray Ionization Mass Spectrometry Imaging of Human Hair to Characterize Longitudinal Profiles of the Antiretroviral Maraviroc for Adherence Monitoring. Anal. Chem. 2019, 91, 10816–10822. [DOI] [PMC free article] [PubMed] [Google Scholar]
- (10).Bagley MC; Ekelöf M; Rock K; Patisaul H; Muddiman DC IR-MALDESI mass spectrometry imaging of underivatized neurotransmitters in brain tissue of rats exposed to tetrabromobisphenol A. Anal. Bioanal. Chem 2018, 410, 7979–7986. [DOI] [PMC free article] [PubMed] [Google Scholar]
- (11).Khodjaniyazova S; Hanne NJ; Cole JH; Muddiman DC Mass spectrometry imaging (MSI) of fresh bones using infrared matrix-assisted laser desorption electrospray ionization (IR-MALDE-SI). Anal. Methods 2019, 11, 5929. [DOI] [PMC free article] [PubMed] [Google Scholar]
- (12).Robichaud G; Barry JA; Garrard KP; Muddiman DC Infrared Matrix-Assisted Laser Desorption Electrospray Ionization (IR-MALDESI) Imaging Source Coupled to a FT-ICR Mass Spectrometer. J. Am. Soc. Mass Spectrom 2013, 24, 92–100. [DOI] [PMC free article] [PubMed] [Google Scholar]
- (13).Sampson JS; Hawkridge AM; Muddiman DC Generation and detection of multiply-charged peptides and proteins by matrix-assisted laser desorption electrospray ionization (MALDE-SI) fourier transform ion cyclotron resonance mass spectrometry. J. Am. Soc. Mass Spectrom 2006, 17, 1712–1716. [DOI] [PubMed] [Google Scholar]
- (14).Dixon RB; Muddiman DC Study of the ionization mechanism in hybrid laser based desorption techniques. Analyst 2010, 135, 880–882. [DOI] [PubMed] [Google Scholar]
- (15).Ekelöf M; Manni J; Nazari M; Bokhart M; Muddiman DC Characterization of a novel miniaturized burst-mode infrared laser system for IR-MALDESI mass spectrometry imaging. Anal. Bioanal. Chem 2018, 410, 2395–2402. [DOI] [PMC free article] [PubMed] [Google Scholar]
- (16).Ekelöf M; Muddiman DC IR-MALDESI method optimization based on time-resolved measurement of ion yields. Anal. Bioanal. Chem 2018, 410, 963–970. [DOI] [PubMed] [Google Scholar]
- (17).Tu A; Muddiman DC Internal Energy Deposition in Infrared Matrix-Assisted Laser Desorption Electrospray Ionization With and Without the Use of Ice as a Matrix. J. Am. Soc. Mass Spectrom 2019, 30, 2380. [DOI] [PMC free article] [PubMed] [Google Scholar]
- (18).Revercomb HE; Mason EA Theory of plasma chromatography/gaseous electrophoresis. Review. Anal. Chem 1975, 47, 970–983. [Google Scholar]
- (19).May JC; Goodwin CR; Lareau NM; Leaptrot KL; Morris CB; Kurulugama RT; Mordehai A; Klein C; Barry W; Darland E; Overney G; Imatani K; Stafford GC; Fjeldsted JC; McLean JA Conformational Ordering of Biomolecules in the Gas Phase: Nitrogen Collision Cross Sections Measured on a Prototype High Resolution Drift Tube Ion Mobility-Mass Spectrometer. Anal. Chem 2014, 86, 2107–2116. [DOI] [PMC free article] [PubMed] [Google Scholar]
- (20).Gabelica V; Afonso C; Barran PE; Benesch JLP; Bleiholder C; Bowers MT; Bilbao A; Bush MF; Campbell JL; Campuzano IDG; Causon TJ; Clowers BH; Creaser C; De Pauw E; Far J; Fernandez-Lima F; Fjeldsted JC; Giles K; Groessl M; Hogan CJ Jr.; Hann S; Kim HI; Kurulugama RT; May JC; McLean JA; Pagel K; Richardson K; Ridgeway ME; Rosu F; Sobott F; Shvartsburg AA; Thalassinos K; Valentine SJ; Wyttenbach T Recommendations for Reporting Ion Mobility Mass Spectrometry Measurements. Mass Spectrom. Rev 2019, 38, 291–320. [DOI] [PMC free article] [PubMed] [Google Scholar]
- (21).Pringle SD; Giles K; Wildgoose JL; Williams JP; Slade SE; Thalassinos K; Bateman RH; Bowers MT; Scrivens JH An investigation of the mobility separation of some peptide and protein ions using a new hybrid quadrupole/travelling wave IMS/oa-ToF instrument. Int. J. Mass Spectrom 2007, 261, 1–12. [Google Scholar]
- (22).May JC; McLean JA Ion mobility-mass spectrometry: time-dispersive instrumentation. Anal. Chem 2015, 87, 1422–1436. [DOI] [PMC free article] [PubMed] [Google Scholar]
- (23).Stow SM; Causon TJ; Zheng X; Kurulugama RT; Mairinger T; May JC; Rennie EE; Baker ES; Smith RD; McLean JA; Hann S; Fjeldsted JC An Interlaboratory Evaluation of Drift Tube Ion Mobility–Mass Spectrometry Collision Cross Section Measurements. Anal. Chem 2017, 89, 9048–9055. [DOI] [PMC free article] [PubMed] [Google Scholar]
- (24).Paglia G; Williams JP; Menikarachchi L; Thompson JW; Tyldesley-Worster R; Halldórsson S; Rolfsson O; Moseley A; Grant D; Langridge J; Palsson BO; Astarita G Ion Mobility Derived Collision Cross Sections to Support Metabolomics Applications. Anal. Chem 2014, 86, 3985–3993. [DOI] [PMC free article] [PubMed] [Google Scholar]
- (25).Mairinger T; Causon TJ; Hann S The potential of ion mobility–mass spectrometry for non-targeted metabolomics. Curr. Opin. Chem. Biol 2018, 42, 9–15. [DOI] [PubMed] [Google Scholar]
- (26).Picache JA; Rose BS; Balinski A; Leaptrot KL; Sherrod SD; May JC; McLean JA Collision cross section compendium to annotate and predict multi-omic compound identities. Chemical Science 2019, 10, 983–993. [DOI] [PMC free article] [PubMed] [Google Scholar]
- (27).Jackson SN; Ugarov M; Egan T; Post JD; Langlais D; Albert Schultz J; Woods AS MALDI-ion mobility-TOFMS imaging of lipids in rat brain tissue. J. Mass Spectrom. 2007, 42, 1093–1098. [DOI] [PMC free article] [PubMed] [Google Scholar]
- (28).Koomen JM; Ruotolo BT; Gillig KJ; McLean JA; Russell DH; Kang M; Dunbar KR; Fuhrer K; Gonin M; Schultz AJ Oligonucleotide analysis with MALDI–ion-mobility–TOFMS. Anal. Bioanal. Chem 2002, 373, 612–617. [DOI] [PubMed] [Google Scholar]
- (29).Weston DJ; Bateman R; Wilson ID; Wood TR; Creaser CS Direct Analysis of Pharmaceutical Drug Formulations Using Ion Mobility Spectrometry/Quadrupole-Time-of-Flight Mass Spectrometry Combined with Desorption Electrospray Ionization. Anal. Chem 2005, 77, 7572–7580. [DOI] [PubMed] [Google Scholar]
- (30).Roscioli KM; Tufariello JA; Zhang X; Li SX; Goetz GH; Cheng G; Siems WF; Hill HH Desorption electrospray ionization (DESI) with atmospheric pressure ion mobility spectrometry for drug detection. Analyst 2014, 139, 1740–1750. [DOI] [PubMed] [Google Scholar]
- (31).Shrestha B; Vertes A High-Throughput Cell and Tissue Analysis with Enhanced Molecular Coverage by Laser Ablation Electrospray Ionization Mass Spectrometry Using Ion Mobility Separation. Anal. Chem 2014, 86, 4308–4315. [DOI] [PubMed] [Google Scholar]
- (32).Stopka SA; Agtuca BJ; Koppenaal DW; Paša-Tolić L; Stacey G; Vertes A; Anderton CR Laser-ablation electrospray ionization mass spectrometry with ion mobility separation reveals metabolites in the symbiotic interactions of soybean roots and rhizobia. Plant J. 2017, 91, 340–354. [DOI] [PubMed] [Google Scholar]
- (33).Stopka SA; Shrestha B; Maréchal É; Falconet D; Vertes A Metabolic transformation of microalgae due to light acclimation and genetic modifications followed by laser ablation electrospray ionization mass spectrometry with ion mobility separation. Analyst 2014, 139, 5945–5953. [DOI] [PubMed] [Google Scholar]
- (34).May JC; Dodds JN; Kurulugama RT; Stafford GC; Fjeldsted JC; McLean JA Broadscale resolving power performance of a high precision uniform field ion mobility-mass spectrometer. Analyst 2015, 140, 6824–6833. [DOI] [PMC free article] [PubMed] [Google Scholar]
- (35).Robichaud G; Barry JA; Muddiman DC IR-MALDESI Mass Spectrometry Imaging of Biological Tissue Sections Using Ice as a Matrix. J. Am. Soc. Mass Spectrom 2014, 25, 319–328. [DOI] [PMC free article] [PubMed] [Google Scholar]
- (36).Sampson JS; Murray KK; Muddiman DC Intact and Top-Down Characterization of Biomolecules and Direct Analysis Using Infrared Matrix-Assisted Laser Desorption Electrospray Ionization Coupled to FT-ICR Mass Spectrometry. J. Am. Soc. Mass Spectrom 2009, 20, 667–673. [DOI] [PMC free article] [PubMed] [Google Scholar]
- (37).Hwang J; Nguyen LT; Jeon YH; Lee CY; Kim MH Crystal structure of fully oxidized human thioredoxin. Biochem. Biophys. Res. Commun 2015, 467, 218–222. [DOI] [PubMed] [Google Scholar]
- (38).Shoichet BK; Baase WA; Kuroki R; Matthews BW A relationship between protein stability and protein function. Proc. Natl. Acad. Sci. U. S. A 1995, 92, 452. [DOI] [PMC free article] [PubMed] [Google Scholar]
- (39).Sullivan MP; Groessl M; Meier SM; Kingston RL; Goldstone DC; Hartinger CG The metalation of hen egg white lysozyme impacts protein stability as shown by ion mobility mass spectrometry, differential scanning calorimetry, and X-ray crystallography. Chem. Commun 2017, 53, 4246–4249. [DOI] [PubMed] [Google Scholar]
- (40).May JC; Jurneczko E; Stow SM; Kratochvil I; Kalkhof S; McLean JA Conformational landscapes of ubiquitin, cytochrome c, and myoglobin: Uniform field ion mobility measurements in helium and nitrogen drift gas. Int. J. Mass Spectrom 2018, 427, 79–90. [DOI] [PMC free article] [PubMed] [Google Scholar]
- (41).Folch J; Lees M; Stanley GHS A SIMPLE METHOD FOR THE ISOLATION AND PURIFICATION OF TOTAL LIPIDES FROM ANIMAL TISSUES. J. Biol. Chem 1957, 226, 497–509. [PubMed] [Google Scholar]
- (42).Leaptrot KL; May JC; Dodds JN; McLean JA Ion mobility conformational lipid atlas for high confidence lipidomics. Nat. Commun 2019, 10, 985. [DOI] [PMC free article] [PubMed] [Google Scholar]
- (43).Harris RA; May JC; Stinson CA; Xia Y; McLean JA Determining Double Bond Position in Lipids Using Online Ozonolysis Coupled to Liquid Chromatography and Ion Mobility-Mass Spectrometry. Anal. Chem 2018, 90, 1915–1924. [DOI] [PMC free article] [PubMed] [Google Scholar]
- (44).Poad BLJ; Zheng X; Mitchell TW; Smith RD; Baker ES; Blanksby SJ Online Ozonolysis Combined with Ion Mobility-Mass Spectrometry Provides a New Platform for Lipid Isomer Analyses. Anal. Chem 2018, 90, 1292–1300. [DOI] [PMC free article] [PubMed] [Google Scholar]
- (45).Klein DR; Brodbelt JS Structural Characterization of Phosphatidylcholines Using 193 nm Ultraviolet Photodissociation Mass Spectrometry. Anal. Chem 2017, 89, 1516–1522. [DOI] [PMC free article] [PubMed] [Google Scholar]
- (46).Bokhart MT; Rosen E; Thompson C; Sykes C; Kashuba ADM; Muddiman DC Quantitative mass spectrometry imaging of emtricitabine in cervical tissue model using infrared matrix-assisted laser desorption electrospray ionization. Anal. Bioanal. Chem 2015, 407, 2073–2084. [DOI] [PMC free article] [PubMed] [Google Scholar]
- (47).Nichols CM; Dodds JN; Rose BS; Picache JA; Morris CB; Codreanu SG; May JC; Sherrod SD; McLean JA Untargeted Molecular Discovery in Primary Metabolism: Collision Cross Section as a Molecular Descriptor in Ion Mobility-Mass Spectrometry. Anal. Chem 2018, 90, 14484–14492. [DOI] [PMC free article] [PubMed] [Google Scholar]
- (48).Schramm T; Hester Z; Klinkert I; Both J-P; Heeren RMA; Brunelle A; Laprévote O; Desbenoit N; Robbe M-F; Stoeckli M; Spengler B; Römpp A imzML — A common data format for the flexible exchange and processing of mass spectrometry imaging data. J. Proteomics 2012, 75, 5106–5110. [DOI] [PubMed] [Google Scholar]
- (49).Robichaud G; Garrard KP; Barry JA; Muddiman DC MSiReader: An Open-Source Interface to View and Analyze High Resolving Power MS Imaging Files on Matlab Platform. J. Am. Soc. Mass Spectrom 2013, 24, 718–721. [DOI] [PMC free article] [PubMed] [Google Scholar]
- (50).Bokhart MT; Nazari M; Garrard KP; Muddiman DC MSiReader v1.0: Evolving Open-Source Mass Spectrometry Imaging Software for Targeted and Untargeted Analyses. J. Am. Soc. Mass Spectrom 2018, 29, 8–16. [DOI] [PMC free article] [PubMed] [Google Scholar]
Associated Data
This section collects any data citations, data availability statements, or supplementary materials included in this article.


