

Abstract
BACKGROUND:
The current study was conducted to evaluate the patterns of care and survival of older adults with oligodendroglioma (OLI) and astrocytoma (AST) from a large population-based registry.
METHODS:
The authors identified a cohort of OLI and AST patients aged ≥65 years from Surveillance, Epidemiology and End Results (SEER) cancer registry data linked with Medicare claims between 1994 and 2002. Patients with a diagnosis of glioblastoma were excluded. The impact of demographic characteristics and comorbidities on the probability of undergoing surgical resection, radiotherapy (RT), and chemotherapy within 6 months of diagnosis was assessed using multivariate logistic regression.
RESULTS:
A total of 1067 patients (891 with AST and 176 with OLI) were included; the median survival was 9 months for patients with low-grade AST, 4 months for patients with anaplastic AST, 57 months for patients with low-grade OLI, and 9 months for patients with anaplastic OLI. Approximately 54% of patients underwent resection at the time of diagnosis; 66% received RT, and 13% received chemotherapy within 6 months of diagnosis. In a multivariate regression analysis, age and tumor grade were found to be the most significant predictors of resection, RT, or chemotherapy. Patients with anaplastic tumors were treated with resection, RT, and chemotherapy more often than patients with low-grade tumors, and OLI patients received chemotherapy more frequently than AST.
CONCLUSIONS:
Data from the current study suggested that histologic diagnosis and tumor grade retained significant prognostic value in this elderly AST and OLI population. Furthermore, age and tumor grade were found to influence the probability of undergoing surgery, RT, and chemotherapy in this cohort.
Keywords: glioma, astrocytoma, oligodendroglioma, radiotherapy, chemotherapy, elderly
The incidence of gliomas is highest among older adults, and glioblastoma (grade IV glioma) represents the overwhelming majority of cases in this age group.1,2 In contrast, grade II (low-grade) and III (anaplastic) astrocytomas (ASTs) and oligodendrogliomas (OLIs) are more common in younger patients; the peak incidence of grade II gliomas occurs between ages 30 and 40 years and the peak incidence of grade III gliomas occurs between ages 40 and 50 years. However, the elderly segment of the general population is growing faster than any other age group, and the number of both AST and OLI cases in older adults is expected to increase.3,4 One epidemiologic study has demonstrated that the peak incidence of anaplastic AST occurs in patients aged >65 years.5
Although maximal safe surgical resection is recommended for the majority of glioma patients when feasible, to our knowledge the role and timing of radiotherapy (RT) and chemotherapy remain unclear; this is especially true for the elderly population, which is relatively understudied and under-represented in clinical trials. Moreover, older patients with gliomas tend to have shorter survival and are at a higher risk of treatment toxicity. The National Comprehensive Cancer Network (NCCN) Clinical Practice Guidelines6 suggest that patients with grade II gliomas who are aged >45 years and who undergo maximal safe resection should be considered for RT,7 or adjuvant chemotherapy, due to a more aggressive tumor biology of these tumors in this age group; in contrast, younger patients may not require immediate therapy and can be followed with surveillance imaging. For patients with grade III gliomas, the NCCN recommends RT with or without chemotherapy followed by either observation or post-RT chemotherapy. OLI are more sensitive to chemotherapy, which some neuro-oncologists recommend as first-line treatment.8
The variability in treatment guidelines for patients with grade II and III OLI and AST makes it difficult to know which therapies are offered to older patients in the general population and which factors influence the administration of these therapies. Moreover, because the survival of older patients with grade II and III gliomas is perceived to be short, the value of histologic subtypes and grading to guide therapy in this population is disputed. Some authors argue that grade III gliomas in the elderly are as aggressive as grade IV tumors9 and that grade II gliomas in these patients have a rapid progression to high-grade histology and death and should be treated more aggressively. The objective of the current study was to evaluate the survival and patterns of care in patients aged ≥65 years with low-grade and anaplastic AST and OLI in a large population-based registry.
MATERIALS AND METHODS
Data Sources
Surveillance, Epidemiology, and End Results (SEER) registries are a comprehensive source of cancer data collected from population-based cancer registries covering 26% of the United States (US) population. Data collected includes individual demographics, tumor site, grade, and histology. Overall completeness of case ascertainment in SEER is 98%. Medicare, the primary health insurer for Americans aged ≥65 years, covers medical care including, but not limited to, inpatient hospital treatment and outpatient and physician services. Among individuals aged ≥65 years in SEER, approximately 93% also have been identified in the Medicare enrollment file. These linked registries provide an ideal data set for analyzing patterns of cancer care in the United States. Medicare claims from the following 3 sources were used: physician/supplier file, outpatient standard analytic file, and the Medicare provider analysis and review file. Data from the 2006 release of the linked SEER-Medicare database were used.10
Study Cohort
We identified a cohort of patients aged ≥65 years who were diagnosed with either AST or OLI from SEER registry data that were linked with Medicare claims between 1994 and 2002, which is the most recent period of SEER-Medicare linked data available. Using the second edition of the International Classification of Diseases for Oncology, a diagnosis of AST was defined as codes 9400 through 9420, and a diagnosis of OLI was defined as codes 9450 through 9451. Patients with glioblastoma multiforme (codes 9440–9444) were excluded in this study. Patients were excluded for any of the following: diagnosis made only at the time of death, missing month of diagnosis, patient in a health maintenance organization (HMO) at the time of diagnosis, or patient lacked Part B Medicare coverage. Medicare is not directly billed for services of patients in HMOs, and therefore data are incomplete in these patients. In addition, outpatient information regarding RT and chemotherapy are unavailable for individuals who lack Part B Medicare coverage.
Treatment
Inpatient, outpatient, and physician claims within the first 6 months of a diagnosis of either AST or OLI determined the initial treatment delivered. Treatments were identified by International Classification of Diseases–Ninth Revision–Clinical Modification diagnosis and procedure codes, Healthcare Common Procedure Coding System (HCPCS) codes, revenue center, and diagnosis-related group (Table 1). Treatments included surgical resection, RT, and chemotherapy.
Table 1.
Codes Used to Identify Claims for Surgery, Radiotherapy, and Chemotherapy
| Classification System | Surgery Codes | Radiotherapy Codes | Chemotherapy Codes |
|---|---|---|---|
| ICD-9 diagnosis | V58.0, V66.1, V67.1 | V58.1, V66.2, V67.2 | |
| ICD-9-CM procedures | 92.20–92.29 | 99.25 | |
| HCPCS level I (CPT) | 61510, 61516, 61518, 61520, 61521, 61524, 61526, 61530, 61534, 61536, 61544, 61545 | 77261–77431, 77750–77797, 77499 | 51720, 96400–96549 |
| HCPCS level II | J9000-J9999 Q0083-Q0085, J0640, J7150, J8530, J6600, J8610, J8999, J8510, J8520, J8521 | ||
| Revenue center | 012, 013, 015, 0124, 0125, 0139, 0159 | ||
| Diagnosis-related group | 409 | 410, 492 |
ICD-9 indicates The International Classification of Diseases-Ninth Revision; ICD-9-CM, International Classification of Diseases-Ninth Revision-Clinical Modification; HCPCS, Healthcare Common Procedure Coding System; CPT, Current Procedural Terminology.
Demographic Factors
Demographic characteristics were extracted from SEER registry data and included age at and year of diagnosis, gender, marital status, race, census tract poverty level, metropolitan/nonmetropolitan residence, prior cancers, comorbidity index, and tumor grade. Census tract poverty level was determined according to the percentage of population living at or below the federal poverty level in a patient’s census tract of residence. This was dichotomized (<10% vs ≥10%). Comorbidity was evaluated using the Romano modification of the Charlson comorbidity index based on inpatient Medicare claims in the 12 months before diagnosis. The Charlson comorbidity index is a reliable predictor of mortality in elderly patients; a higher comorbidity index is associated with lower survival.11,12 Tumor grade was dichotomized (low grade vs anaplastic), in which low grade was defined as either well-differentiated or moderately differentiated and anaplastic was defined as either poorly differentiated or undifferentiated according to SEER criteria.
Statistical Analysis
Multivariate logistic regression analysis was used to identify predictors of receipt of surgical resection, RT, and chemotherapy. Survival was calculated from the time of diagnosis until death from any cause or until the date of last follow-up. Date of death was identified from Medicare enrollment records, with complete follow-up for vital status through December 31, 2004. Patients alive at the time of last follow-up were censored. We used Kaplan-Meier analysis to evaluate overall survival in patients with AST and OLI. The log-rank test was used to measure differences in survival among groups. A P value <.05 was considered statistically significant. All statistical analyses were performed using SAS software (version 9.2; SAS Institute Inc, Cary, NC).
RESULTS
From the linked SEER-Medicare database, we identified a cohort of 1467 patients aged ≥65 years who were diagnosed with AST or OLI between 1994 and 2002. After exclusions were made for those with a diagnosis made at the time of death, those missing the month of diagnosis, those enrolled in an HMO at the time of diagnosis, or those lacking Medicare Part B coverage, the final cohort was comprised of 1067 patients. There were 891 patients with AST and 176 with OLI, and 68% of patients had a diagnosis of anaplastic glioma. The majority of the cohort was white (90.5%), and the group of patients most recently diagnosed between 2000 and 2002 was larger because of SEER’s expansion in 2000. Approximately 14% of patients had at least 1 prior cancer, and 26% had a Charlson comorbidity score of ≥1 (Table 2).
Table 2.
Patient Demographics and Predictors of Surgical Resection, Radiotherapy, and Chemotherapy Within 6 Months of Diagnosis
| Surgical Resection | Radiotherapy | Chemotherapy | |||||||||
|---|---|---|---|---|---|---|---|---|---|---|---|
| Characteristic | Level | No.(%) Total | No.(%) Treated | Adjusted OR* (95% CI) | P | No.(%) Treated | Adjusted OR* (95% CI) | P | No.(%) Treated | Adjusted OR* (95% CI) | P |
| Histology | Astrocytoma | 891 (83.5) | 478 (53.6) | 1 (reference) | .06 | 596 (66.9) | 1 (reference) | .90 | 103 (11.6) | 1 (reference) | .01 |
| Oligodendroglioma | 176 (16.5) | 101 (57.4) | 1.41 (0.99–2.02) | 108 (61.4) | 0.98 (0.67–1.42) | 34 (19.3) | 1.86 (1.16–3.01) | ||||
| Grade | Low | 180 (16.9) | 94 (52.2) | 1 (reference) | <.0001 | 102 (56.7) | 1 (reference) | <.0001 | 11 (6.1) | 1 (reference) | .002 |
| Anaplastic | 723 (67.8) | 425 (58.8) | 1.33 (0.94–1.86) | 536 (74.1) | 2.32 (1.62–3.31) | 108 (14.9) | 3.25 (1.65–6.38) | ||||
| Unknown | 164 (15.4) | 60 (36.6) | 0.53 (0.34–0.83) | 66 (40.2) | 0.57 (0.36–0.90) | 18 (11.0) | 1.93 (0.85–4.39) | ||||
| Age at diagnosis, y | 65–69 | 292 (27.4) | 172 (58.9) | 1 (reference) | .0003 | 222 (76.0) | 1 (reference) | <.0001 | 64 (21.9) | 1 (reference) | <.0001 |
| 70–74 | 288 (27.0) | 177 (61.5) | 1.09 (0.77–1.53) | 196 (68.1) | 0.61 (0.41–0.89) | 36 (12.5) | 0.50 (0.31–0.80) | ||||
| 75–79 | 280 (26.2) | 145 (51.8) | 0.75 (0.54–1.06) | 178 (63.6) | 0.52 (0.35–0.77) | 26 (9.3) | 0.37 (0.22–0.61) | ||||
| 80–84 | 132 (12.4) | 61 (46.2) | 0.62 (0.40–0.95) | 72 (54.5) | 0.39 (0.24–0.62) | 7 (5.3) | 0.18 (0.08–0.43) | ||||
| ≥85 | 75 (7.0) | 24 (32.0) | 0.36 (0.21–0.62) | 36 (48.0) | 0.33 (0.19–0.58) | <5 | 0.20 (0.07–0.60) | ||||
| Gender | Male | 525 (49.2) | 290 (55.2) | 1 (reference) | .98 | 343 (65.3) | 1 (reference) | .06 | 85 (16.2) | 1 (reference) | .008 |
| Female | 542 (50.8) | 289 (53.3) | 1.00 (0.76–1.30) | 361 (66.6) | 1.32 (0.99–1.77) | 52 (9.6) | 0.58 (0.39–0.87) | ||||
| Marital status | Married | 663 (62.1) | 376 (56.7) | 1 (reference) | .74 | 467 (70.4) | 1 (reference) | .004 | 103 (15.5) | 1 (reference) | .45 |
| Unmarried | 362 (33.9) | 181 (50.0) | 0.89 (0.66–1.19) | 215 (59.4) | 0.61 (0.45–0.84) | 29 (8.0) | 0.74 (0.46–1.19) | ||||
| Unknown | 42 (3.9) | 22 (52.4) | 0.96 (0.50–1.83) | 22 (52.4) | 0.53 (0.27–1.03) | 5 (11.9) | 0.95 (0.34–2.66) | ||||
| Race | White | 966 (90.5) | 530 (54.9) | 1 (reference) | .32 | 642 (66.5) | 1 (reference) | .22 | 131 (13.6) | 1 (reference) | .10 |
| Black | 35 (3.3) | 16 (45.7) | 0.64 (0.31–1.32) | 21 (60.0) | 0.65 (0.30–1.40) | <5 | 0.65 (0.34–2.66) | ||||
| Other | 66 (6.2) | 33 (50.0) | 0.77 (0.46–1.29) | 41 (62.1) | 0.67 (0.39–1.16) | <5 | 0.28 (0.18–2.28) | ||||
| Year of diagnosis | 1994–1996 | 312 (29.2) | 163 (52.2) | 1 (reference) | .63 | 212 (67.9) | 1 (reference) | .29 | 42 (13.5) | 1 (reference) | .46 |
| 1997–1999 | 283 (26.5) | 162 (57.2) | 1.17 (0.84–1.64) | 200 (70.7) | 1.00 (0.68–1.45) | 44 (15.5) | 1.10 (0.67–1.79) | ||||
| 2000–2002 | 472 (44.2) | 254 (53.8) | 1.12 (0.83–1.51) | 292 (61.9) | 0.80 (0.58–1.11) | 51 (10.8) | 0.83 (0.52–1.31) | ||||
| Census tract Poverty level | <10% | 674 (63.2) | 363 (53.9) | 1 (reference) | .33 | 442 (65.6) | 1 (reference) | .49 | 87 (12.9) | 1 (reference) | .004 |
| ≥10% | 359 (33.7) | 195 (54.3) | 1.15 (0.87–1.53) | 240 (66.9) | 1.20 (0.88–1.64) | 39 (10.9) | 0.95 (0.61–1.48) | ||||
| Unknown | 34 (3.2) | 21 (61.8) | 1.65 (0.74–3.67) | 22 (64.7) | 1.16 (0.50–2.66) | 11 (32.4) | 4.73 (1.86–12.0) | ||||
| Urban/rural | Big metropolitan or metropolitan | 913 (85.6) | 502 (55.0) | 1 (reference) | .06 | 602 (65.9) | 1 (reference) | .37 | 119 (13.0) | 1 (reference) | .28 |
| Urban, less urban, or rural | 154 (14.4) | 77 (50.0) | 0.70 (0.49–1.01) | 102 (66.2) | 0.83 (0.56–1.24) | 18 (11.7) | 0.73 (0.41–1.30) | ||||
| No. of prior cancers | 0 | 915 (85.8) | 497 (54.3) | 1 (reference) | .82 | 607 (66.3) | 1 (reference) | .72 | 111 (12.1) | 1 (reference) | .15 |
| 1 | 129 (12.1) | 69 (53.5) | 0.88 (0.58–1.32) | 83 (64.3) | 0.89 (0.57–1.39) | 24 (18.6) | 1.26 (0.71–2.24) | ||||
| ≥2 | 23 (2.2) | 13 (56.5) | 0.94 (0.37–2.36) | 14 (60.9) | 0.71 (0.27–1.86) | <5 | 0.26 (0.05–1.33) | ||||
| Comorbidity index | 0 | 790 (74.0) | 442 (55.9) | 1 (reference) | .17 | 540 (68.4) | 1 (reference) | .41 | 113 (14.3) | 1 (reference) | .52 |
| 1 | 177 (16.6) | 94 (53.1) | 0.97 (0.68–1.37) | 107 (60.5) | 0.82 (0.57–1.18) | 16 (9.0) | 0.74 (0.41–1.33) | ||||
| ≥2 | 100 (9.4) | 43 (43.0) | 0.66 (0.42–1.02) | 57 (57.0) | 0.79 (0.50–1.25) | 8 (8.0) | 0.78 (0.35–1.72) | ||||
OR indicates odds ratio; 95% CI, 95% confidence interval.
Based on a multivariate logistic regression model in which each variable was adjusted for all others.
As shown in Table 2, after adjusting for other factors, the odds of receiving surgical resection decreased with increasing age (P = .0003). Those patients with an anaplastic tumor underwent surgical resection more often (P < .0001). Within 6 months of the time of the initial diagnosis, 66% of patients received RT and 13% received chemotherapy. Patients who were older were less likely to receive RT or chemotherapy. Patients with a diagnosis of anaplastic glioma were more likely to receive RT and chemotherapy (Table 2). Unmarried patients were less likely to receive RT (P = .004). Women had lower odds of receiving chemotherapy (P = .008), and those with a diagnosis of OLI were more likely to receive chemotherapy (P = .01).
The median follow-up for the surviving patients was 43 months. During the period of observation, 92% of the cohort died. The median survival for all patients was 5 months; the median survival for patients with low-grade AST (n = 145) was 9 months (95% confidence interval [95% CI], 8–13 months), that for patients with anaplastic AST (n = 639) was 4 months (95% CI, 4s-5 months), that for patients with low-grade OLI (n = 35) was 57 months (95% CI, 19 months to not reached), and that for patients with anaplastic OLI (n = 84) was 9 months (95% CI, 6–11 months) (Fig. 1A). In addition, the overall survival of patients with AST and OLI was better compared with patients with glioblastoma in the SEER-Medicare linked data (P < .0001) (results not shown). Although patients with glioblastoma multiforme and high-grade AST both had median survivals of4 months,13 their survival curves were different (log-rank test, P = .002; results not shown). Older age was associated with shorter survival rates (P < .0001) (Fig. 1B). Unmarried patients had shorter survival rates compared with those who were married (P = .002) (Fig. 1C).
FIGURE 1.
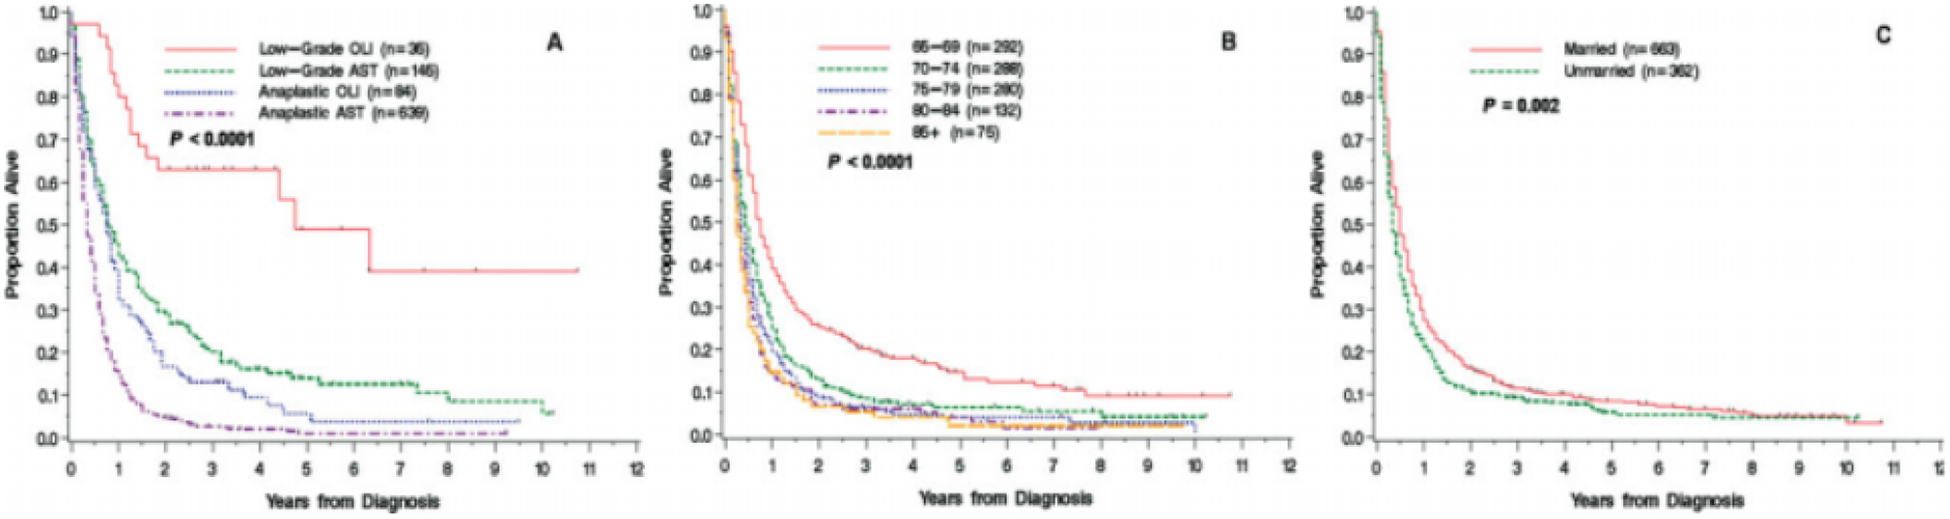
Survival of patients aged ≥65 years with astrocytoma (AST) or oligodendroglioma (OLI) according to (A) histology and grade, (B) age group, and (C) marital status is shown.
DISCUSSION
The SEER-Medicare database provided a unique opportunity to describe the patterns of care in elderly patients with low-grade and anaplastic gliomas. We found that, among elderly Medicare recipients with low-grade and anaplastic gliomas, age and tumor grade were associated with decisions regarding resection, RT, and chemotherapy use. Although the median survival for elderly patients with low-grade and anaplastic AST and OLI is shorter compared with younger patients, data from the current study clearly suggest that histologic diagnosis and tumor grading retains significant prognostic value in this age group. Increasing age is a known negative prognostic factor in both low-grade and high-grade gliomas, and it is not surprising that older patients had shorter survival times.14–16 However, older patients also underwent resection and RT and received chemotherapy at lower rates, which may also account for their shorter survival. It is interesting to note that age appears to affect the prognosis of low-grade AST more significantly than low-grade OLI. For example, a population study of patients of all ages found a median survival of 5.6 years in patients with low-grade AST and 11.6 years in patients with low-grade OLI,17 compared with 0.75 years and 4.75 years, respectively, in patients in the current study aged ≥65 years.
Maximum safe resection is considered a standard approach for both low-grade and anaplastic AST and OLI, although close observation for asymptomatic patients with low-grade gliomas is also acceptable6 and may explain the slightly lower rates of surgical resection for this group compared with patients with high-grade tumors (52% vs 59%) or the poor ability of magnetic resonance imaging/computed tomography to predict low-grade gliomas in the elderly. Another possibility is that low-grade gliomas are often more infiltrative and may be less easily resectable than high-grade tumors. RT has a definite therapeutic role in patients with anaplastic gliomas, and 74% of patients with high-grade tumors received RT within 6 months of diagnosis compared with 57% of patients with low-grade tumors. To the best our knowledge, the best timing for RT in patients with low-grade gliomas remains unclear; a phase 3 clinical trial indicated no significant difference in median survival among patients who received RT postoperatively or at the time of disease recurrence, and therefore the reduced use of RT in the population in the current study does not necessarily reflect an unwillingness to treat older patients.18
To our knowledge, the role and timing of chemotherapy are unclear for both low-grade and high-grade AST and OLI. For example, upfront adjuvant procarbazine, lomustine, and vincristine (PCV) was reported to demonstrate no survival benefit in patients with grade III AST or OLI.19–21 However, chemotherapy is widely used in the United States at the time of the initial diagnosis of anaplastic gliomas, especially in younger patients who can tolerate the treatment better. A study of a cohort of 147 patients aged >18 years with newly diagnosed anaplastic gliomas who were treated in North American academic and community settings between 1997 and 2000 demonstrated that 54% received systemic chemotherapy compared with 15% in the current SEER-Medicare cohort of patients aged ≥65 years.22 The availability of temozolomide, a well-tolerated oral alkylating agent with a better safety profile than PCV or nitrosoureas, may increase the use of chemotherapy in older patients with gliomas. There was a higher use of chemotherapy in OLI patients compared with patients with AST (19% vs 12%), likely reflecting the knowledge that OLIs are relatively more chemosensitive tumors.
Age was found to be 1 of the most important predictors of the receipt of any treatment modality in the current study; older age was associated with a lower odds of undergoing surgical resection, receipt of RT, or receipt of chemotherapy. Concerns regarding increased morbidity and toxicity in very elderly patients likely contribute to the lower rates of treatment noted in this group. Elderly patients may also decline more aggressive treatments because therapies are often only palliative. Although 26% of patients had a Charlson comorbidity index ≥1, which correlates with shorter survival, this index did not predict receipt of therapy. It is possible that other elderly features such frailty, which is not easily measured or captured in this index, influence treatment decisions more significantly than a comorbidity index.
We found an association between being unmarried and having an increased risk of death. Unmarried patients received RT less frequently, which may account for the disparity in survival noted between married and unmarried patients. Prior SEER and SEER-Medicare analyses of glioblastoma patients found that unmarried patients were less likely to be treated with surgical resection, RT, and chemotherapy and had a shorter survival than married patients.13,23 Because unmarried individuals may have less social support, a multidisciplinary approach with social workers and case managers might be warranted. Future research is indicated to determine whether targeted psychosocial interventions will improve outcomes for unmarried patients with glioma.
There are several limitations to the current analysis, including unavailable data regarding performance status, extent of surgical resection, and treatment-related toxicity. Performance status is an independent prognostic factor and frequently guides treatment. Consequently, the independent impact of resection, RT, and chemotherapy on survival could not be assessed because performance status is 1 of the most important factors in determining receipt of treatment. We also were unable to analyze the treatment preferences of individual patients or their physicians’ attitudes and recommendations. The grading of gliomas into low grade and anaplastic was not based on the more widely used World Health Organization (WHO) system, but we believe the SEER grading used herein (low grade and anaplastic) closely resembles the WHO (grade II and grade III) system as demonstrated by the survival rates of each group. Moreover, this study did not include the pathologic entity mixed glioma (oligoastrocytoma) described in the WHO system, cancer registries do not have central pathology review, and agreement among neuropathologists can vary significantly.24 Despite these limitations, SEER is considered the best cancer registry because the data are audited extensively for accuracy and completeness and have a high level of validity; this quality control has been an integral part of the program since its inception in 1973. Medicare claims data also have a high level of accuracy, especially for expensive reimbursed procedures such as neurosurgery, RT, and chemotherapy.
Tumor grading and histologic classification remain important prognostic factors for elderly glioma patients and should guide treatment in this population. Conservative management with more aggressive treatment at the time of disease recurrence or progression may be indicated for some patients, especially those with low-grade OLI who, even in this age group, demonstrated a median survival approaching 5 years. Further investigations into the role of tumor biology, better patient stratification for treatment, and more effective and less toxic therapies are needed for elderly patients with glioma.
Acknowledgments
We thank Judith Lampron for her expert editorial assistance and the Applied Research Program, National Cancer Institute; the Centers for Medicare & Medicaid Services; Information Management Services Inc; and the Surveillance, Epidemiology, and End Results (SEER) Program tumor registries for their efforts in the creation of the SEER-Medicare database. We also thank Joan Warren, PhD, of Applied Research Program, National Cancer Institute, for guidance in the use of these data.
Footnotes
Conflict of Interest Disclosures
Supported by the Memorial Sloan-Kettering Cancer Center Cancer and Aging Program, and the Seaver Fund.
References
- 1.Wrensch M, Minn Y, Chew T, Bondy M, Berger MS. Epidemiology of primary brain tumors: current concepts and review of the literature. Neuro Oncol. 2002;4:278–299. [DOI] [PMC free article] [PubMed] [Google Scholar]
- 2.Wrensch M, Rice T, Miike R, et al. Diagnostic, treatment, and demographic factors influencing survival in a population-based study of adult glioma patients in the San Francisco Bay Area. Neuro Oncol. 2006;8:12–26. [DOI] [PMC free article] [PubMed] [Google Scholar]
- 3.Elia-Pasquet S, Provost D, Jaffre A, et al. Incidence of central nervous system tumors in Gironde, France. Neuroepidemiology. 2004;23:110–117. [DOI] [PubMed] [Google Scholar]
- 4.Hoffman S, Propp JM, McCarthy BJ. Temporal trends in incidence of primary brain tumors in the United States, 1985–1999. Neuro Oncol. 2006;8:27–37. [DOI] [PMC free article] [PubMed] [Google Scholar]
- 5.Jukich PJ, McCarthy BJ, Surawicz TS, Freels S, Davis FG. Trends in incidence of primary brain tumors in the United States, 1985–1994. Neuro Oncol. 2001;3:141–151. [DOI] [PMC free article] [PubMed] [Google Scholar]
- 6.Brem SS, Bierman PJ, Black P, et al. Central nervous system cancers. J Natl Compr Cane Netw. 2008;6:456–504. [DOI] [PubMed] [Google Scholar]
- 7.Cairncross JG, Ueki K, Zlatescu MC, et al. Specific genetic predictors of chemotherapeutic response and survival in patients with anaplastic oligodendrogliomas. J Natl Cancer Inst. 1998;90:1473–1479. [DOI] [PubMed] [Google Scholar]
- 8.Abrey LE, Louis DN, Paleologos N, et al. Survey of treatment recommendations for anaplastic oligodendroglioma. Neuro Oncol. 2007;9:314–318. [DOI] [PMC free article] [PubMed] [Google Scholar]
- 9.Barnholtz-Sloan JS, Williams VL, Maldonado JL, et al. Patterns of care and outcomes among elderly individuals with primary malignant astrocytoma. J Neurosurg. 2008;108: 642–648. [DOI] [PubMed] [Google Scholar]
- 10.SEER-Medicare Linked Database. Available at: http://healthservices.cancer.gov/seermedicare/ Accessed October 7, 2008.
- 11.Charlson ME, Pompei P, Ales KL, MacKenzie CR. A new method of classifying prognostic comorbidity in longitudinal studies: development and validation. J Chronic Dis. 1987;40:373–383. [DOI] [PubMed] [Google Scholar]
- 12.Romano PS, Roos LL, Jollis JG. Adapting a clinical comorbidity index for use with ICD-9-CM administrative data: differing perspectives. J Clin Epidemiol. 1993;46:1075–1079; discussion 1081–1090. [DOI] [PubMed] [Google Scholar]
- 13.Iwamoto FM, Reiner AS, Panageas KS, Elkin EB, Abrey LE. Patterns of care in elderly glioblastoma patients. Ann Neurol. 2008;64:628–634. [DOI] [PubMed] [Google Scholar]
- 14.Compostella A, Tosoni A, Blatt V, Franceschi E, Brandes AA. Prognostic factors for anaplastic astrocytomas. J Neurooncol. 2007;81:295–303. [DOI] [PubMed] [Google Scholar]
- 15.Pignatti F, van den Bent M, Curran D, et al. Prognostic factors for survival in adult patients with cerebral low-grade glioma. J Clin Oncol. 2002;20:2076–2084. [DOI] [PubMed] [Google Scholar]
- 16.Pouratian N, Mut M, Jagannathan J, Lopes MB, Shaflrey ME, Schiff D. Low-grade gliomas in older patients: a retrospective analysis of prognostic factors. J Neurooncol. 2008;90:341–350. [DOI] [PubMed] [Google Scholar]
- 17.Ohgaki H, Kleihues P. Population-based studies on incidence, survival rates, and genetic alterations in astrocytic and oligodendroglial gliomas. J Neuropathol Exp Neurol. 2005;64:479–489. [DOI] [PubMed] [Google Scholar]
- 18.van den Bent MJ, Afra D, de Witte O, et al. Long-term efficacy of early versus delayed radiotherapy for low-grade astrocytoma and oligodendroglioma in adults: the EORTC 22845 randomised trial. Lancet. 2005;366:985–990. [DOI] [PubMed] [Google Scholar]
- 19.Medical Research Council Brain Tumor Working Party. Randomized trial of procarbazine, lomustine, and vincristine in the adjuvant treatment of high-grade astrocytoma: a Medical Research Council trial. J Clin Oncol. 2001;19:509–518. [DOI] [PubMed] [Google Scholar]
- 20.Cairncross G, Berkey B, Shaw E, et al. Phase III trial of chemotherapy plus radiotherapy compared with radiotherapy alone for pure and mixed anaplastic oligodendroglioma: Intergroup Radiation Therapy Oncology Group Trial 9402. J Clin Oncol. 2006;24:2707–2714. [DOI] [PubMed] [Google Scholar]
- 21.van den Bent MJ, Carpentier AF, Brandes AA, et al. Adjuvant procarbazine, lomustine, and vincristine improves progression-free survival but not overall survival in newly diagnosed anaplastic oligodendrogliomas and oligoastrocytomas: a randomized European Organisation for Research and Treatment of Cancer phase III trial. J Clin Oncol. 2006;24:2715–2722. [DOI] [PubMed] [Google Scholar]
- 22.Chang SM, Parney IF, Huang W, et al. Patterns of care for adults with newly diagnosed malignant glioma. JAMA. 2005;293:557–564. [DOI] [PubMed] [Google Scholar]
- 23.Chang SM, Barker FG Jr. Marital status, treatment, and survival in patients with glioblastoma multiforme: a population based study. Cancer. 2005;104:1975–1984. [DOI] [PubMed] [Google Scholar]
- 24.Castillo MS, Davis FG, Surawicz T, et al. Consistency of primary brain tumor diagnoses and codes in cancer surveillance systems. Neuroepidemiology. 2004;23:85–93. [DOI] [PubMed] [Google Scholar]