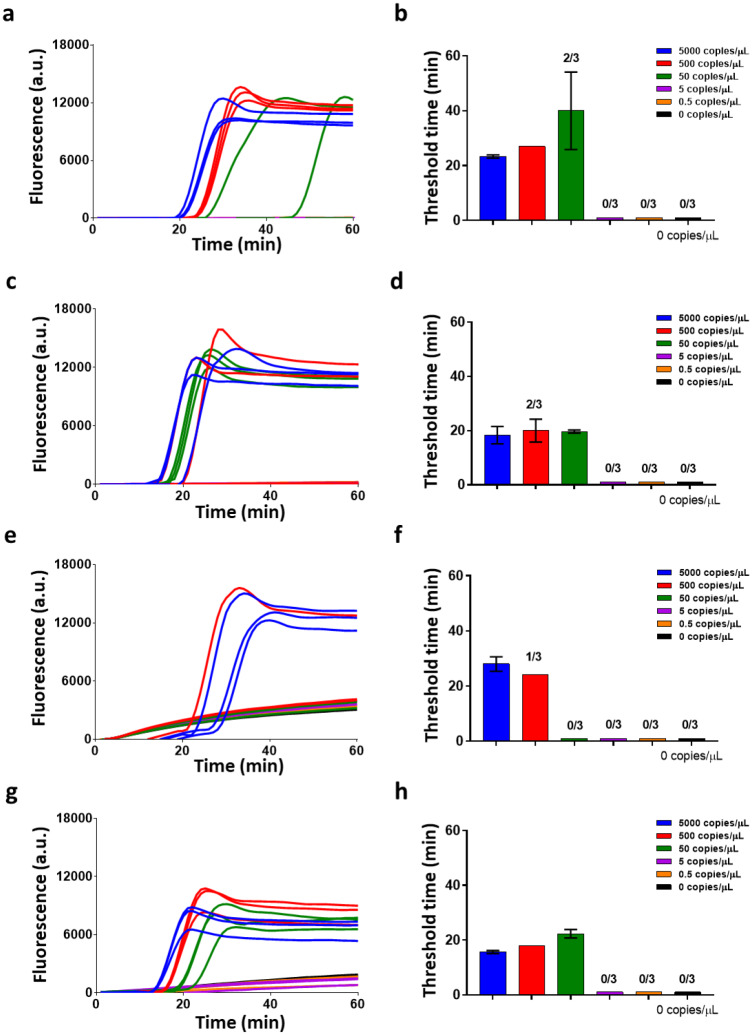
Fig. 2. Characterization of SARS-CoV-2 genomic RNA in buffer.
(a-h) Raw fluorescence data and amplification threshold times (for 3 replicates of data) for detection of genomic RNA using primer set 3 for Gene orf 1a (a-b), primer set 2 for Gene S (c-d), primer set 2 for Gene orf 8 (e-f), and primer set 1 for Gene N (g-h). The bar graphs show mean and standard deviation. The best detection limit was 50 copies/uL attained using Gene N primer set 1.

