

OBJECTIVES:
Biomarkers for optimizing the outcome of treatment with lenvatinib in patients with advanced hepatocellular carcinoma remain to be established despite intensive and comprehensive genomic research. Lenvatinib is characterized by its prominent inhibitory potency for fibroblast growth factor receptor (FGFR) 4 compared with earlier tyrosine kinase inhibitors. Thus, in this study, we focused on simplified quantification of FGFR4 in tumors as a potential predictive indicator.
METHODS:
According to The Cancer Genome Atlas data set curation, FGFR4 messenger RNA is broadly overexpressed in hepatocellular carcinoma in the absence of gene alteration. Gene set enrichment analysis revealed that the aggressiveness of the tumor was closely related to the FGFR4 level. To confirm the relationship between the benefits of lenvatinib and tumor addiction to the FGFR4 pathway, we analyzed protein levels in tumors and peripheral blood obtained from 57 prospectively registered patients treated with lenvatinib.
RESULTS:
Positive immunohistochemistry (>10% of tumor cells) for FGFR4 in biopsy samples before treatment was associated with a longer progression-free survival (2.5 vs 5.5 months, P = 0.01) and a favorable objective response rate (31% vs 81%, P = 0.006). By contrast, the concentration of soluble FGFR4 in peripheral blood as measured by an enzyme-linked immunosorbent assay was not associated with survival outcomes, because its fluctuations reflect hepatic fibrosis. Additional RNA sequencing analysis using archival surgical specimens (n = 90) suggested that alternative RNA splicing of FGFR4 in cancer may also explain this discrepancy.
DISCUSSION:
The tumor FGFR4 level was an independent predictor of response to lenvatinib.
INTRODUCTION
Liver cancer accounts for the sixth highest cancer incidence and is the fourth leading cause of cancer death worldwide (1). Developing molecular-targeted and biomarker-enriched therapeutic strategies against hepatocellular carcinoma (HCC), which is the most common type of liver cancer, has long been challenging because of the scarcity of druggable genomic alterations (2,3). The oral multikinase inhibitor, lenvatinib, which inhibits vascular endothelial growth factor (VEGF) receptors 1–3, fibroblast growth factor (FGF) receptors (FGFRs) 1–4, platelet-derived growth factor receptor α, RET proto-oncogene, and proto-oncogene c-KIT, was recently approved for the first-line treatment of advanced HCC, based on a global phase 3 trial (4). Lenvatinib not only shows noninferiority to the conventional standard therapy, sorafenib, in overall survival (OS) but also yields a higher objective response rate, which can provide clinical benefits of great magnitude (4). Consequently, its implementation into clinical practice is drastically changing the systemic treatment landscape for this lethal disease. However, patients with HCC often have vulnerable physical backgrounds compromised by fibrotic liver damage. Thus, the critical adverse events caused by lenvatinib treatment easily create a poor clinical course. Identifying precise predictive biomarkers for a better response to lenvatinib might optimize candidate subgroup separation, minimize unfavorable toxicities, and improve survival outcomes and is, therefore, warranted.
FGF and the FGFR signaling axis have been increasingly focused on as a potential driving pathway of HCC proliferation. Preclinical research suggests that the interaction between FGFR4 and its specific ligand, FGF19, on tumor cell surfaces contributes to tumorigenesis of HCC (5). Moreover, this pathway may play an essential role that leads to aggressive phenotypes and worse prognosis (6,7). The reported frequencies of amplifications, activating mutations, or translocations resulting in activating gene fusions of FGFR4 and FGFR19 are extremely low in HCC (8). However, a substantial portion of histopathological specimens intrinsically overexpresses FGFR4 (5,7) without harboring genetic alterations.
To date, the relationship between the intensity of FGFR signaling and the clinical efficacy of lenvatinib has not been completely analyzed. In many other solid cancers, aberrant FGFR activation induces a robust addiction to the pathway and a greater responsiveness to specific blocking agents (9). Lenvatinib is characterized by a prominent inhibitory potency for FGFR4 compared with sorafenib (10), and thus, a higher level of cellular FGFR4 expression might explain the sensitivity to lenvatinib (11). Lenvatinib also efficiently inhibits the VEGF pathways. However, the benefits from the shutdown of the angiogenesis axis are modest, as shown in recently conducted clinical trials (12,13).
The aim of this study is to determine the potential of FGFR4 expression as a predictive biomarker for guiding systemic therapy that includes lenvatinib for advanced HCC. We first examined the levels of expression of FGFR4 messenger RNA (mRNA) and the subsequent downstream molecular signatures in gastrointestinal cancers, by curating a publicly available data set. Next, we confirmed the relationship between the beneficial outcomes with lenvatinib and immunohistochemical protein expression of FGFR4 in tumor samples taken just before the start of therapy. We also explored the usefulness of measuring soluble FGFR4 levels in peripheral blood before treatment. Finally, we verified the correlation between the FGFR4 RNA sequencing data and FGFR4 protein abundance by analyzing archival surgical specimens from an independent cohort. We also provide some speculation about the unique biological features of HCC.
METHODS
Hypothesis generation based on The Cancer Genome Atlas database
We first performed exploratory analyses regarding the transcriptome of receptor tyrosine kinases (RTKs) and their ligands as follows (Figure 1a): The RNA sequencing data from The Cancer Genome Atlas (TCGA) were initially downloaded from the National Cancer Institute-Genomic Data Commons Data Portal (https://portal.gdc.cancer.gov/). To find a distinct expression pattern concealed in HCC biology, the figures of gene expression were compared across different types of gastrointestinal cancers using a modified normalized value of RNA sequencing called fragments per kilobase of transcript per million mapped reads upper quartile. The number of sequences for cancer tissues and matched noncancerous tissues were 371 and 50 in liver cancer (liver hepatocellular carcinoma), 375 and 32 in stomach cancer (stomach adenocarcinoma), and 566 and 44 in colorectal cancer (colon adenocarcinoma and rectum adenocarcinoma), respectively. Annotation and processing of data were performed using the GenePattern online platform (14). We also used Gene Set Enrichment Analysis software (15) and the HALLMARK gene sets obtained from the Molecular Signatures Database (MSigDB, v6.1) to assess downstream gene signatures. The link between gene expression and OS was examined using the repository in OncoLnc, which covers most cancer types in TCGA (16).
Figure 1.

Design of the study. (a) TCGA data sets and hypothesis generation. (b) Flow chart for the lenvatinib biomarker analysis. (c) Additional validation analysis using the ICGC cohort. ELISA, enzyme-linked immunosorbent assay; FGFR, fibroblast growth factor receptor; HCC, hepatocellular carcinoma; ICGC, International Cancer Genome Consortium; IHC, immunohistochemistry; mRNA, messenger RNA; TCGA, The Cancer Genome Atlas; WGS, whole genome sequencing.
Patients
Fifty-seven consecutive patients with unresectable HCC who were treated with lenvatinib between April 2018 and April 2019 at Hiroshima University Hospital were prospectively registered for our lenvatinib biomarker analysis study to confirm the predictive values of tumor and serum FGFR4 expression (Figure 1b). Patient characteristics are shown in Table 1. All patients received a standard dose of lenvatinib therapy and continued until the emergence of disease progression or intolerable toxicities. The best objective response and disease progression were determined by computed tomography in accordance with Response Evaluation Criteria in Solid Tumors (RECIST) version 1.1 and modified RECIST (mRECIST). Computed tomography was performed at least bimonthly. After exclusion of patients with an extremely short duration of lenvatinib use or without analyzable samples, 52 patients were evaluated to determine if soluble serum FGFR4 levels in the pretreatment period reflected survival outcomes or radiological objective responses. In 40 of these 52 patients, pretreatment tumor samples were available for the proteomics study. Immunohistochemical quantification of FGFR4 protein in tumors was performed and evaluated to establish a determinant for predicting treatment susceptibility as well. The Human Ethics Review Committees of Hiroshima University approved the study. All patients provided written an informed consent.
Table 1.
Clinicopathological features of the study patients

FGFR4 immunohistochemistry in pretreatment tumor samples
Primary tumor samples were acquired by percutaneous transhepatic biopsies before the start of lenvatinib treatment and were used to quantify FGFR4 protein expression with immunohistochemistry (IHC). Formalin-fixed paraffin embedded sections were rehydrated. Antigen retrieval was performed using a heat-mediated method (pH 6). Intrinsic peroxidase activity was quenched with 3% hydrogen peroxide. Sections were incubated in FGFR4 antibody (HPA027369, rabbit polyclonal, 1:50; Sigma-Aldrich, St. Louis, MO) as the primary antibody for 1 hour, followed by incubation for 1 hour in a secondary anti-rabbit/mouse horseradish peroxidase-conjugated antibody (K5007; Agilent Technologies, Santa Clara, CA) according to the manufacturer's instructions. After counterstaining with hematoxylin, 2 independent evaluators quantified the percentage of FGFR4-positive cells at ×400 magnification.
Detection of soluble FGFR4 in blood samples obtained before treatment
Five milliliters of peripheral venous blood were collected before the initiation of lenvatinib, and separated serum was stored at −80°C until batch analysis. The serum concentration of FGFR4 was evaluated using an enzyme-linked immunosorbent assay (ELISA) kit (OKDD00266; Aviva Systems Biology, San Diego, CA) according to the manufacturer's instructions. The median value obtained was defined as the boundary of the high vs low group in serum FGFR4 analysis.
Validation of ELISA results using control serum from patients with chronic liver diseases
Control serum samples from patients without HCC were selected from cryopreserved stocks in our hospital and used for ELISA. We enrolled age- and sex-matched patients from 3 distinct etiologies of liver diseases including chronic hepatitis B virus infection, chronic hepatitis C virus infection, and nonalcoholic steatohepatitis. All patients were required to not have HCC or other malignancies as determined with multiple imaging modalities. Patients' characteristics are shown in Table S1 (see Supplementary Digital Content 1, http://links.lww.com/CTG/A282). Five samples from hepatitis B virus-infected patients were collected at various clinical time points. Eleven samples from hepatitis C virus-infected patients were collected just before virus elimination therapy with a direct-acting antiviral. Eight samples from patients with nonalcoholic steatohepatitis were collected just before addition of treatment with a sodium glucose cotransporter 2 inhibitor to treat poorly controlled diabetes. The fibrosis-4 index of each case was calculated by using the formula (17): (age [years] × aspartate aminotransferase [U/L])/([PLT (109/L)] × [alanine aminotransferase (U/L)]1/2).
Validation and verification of results using the International Cancer Genome Consortium data
We assessed the validity of the hypothesis regarding FGFR4 by analyzing the independent transcriptome data set (Figure 1c). The data source was a cohort that consisted of 90 HCC samples from curative resection performed between 2005 and 2016 at our institution. Samples had been previously sequenced as part of the International Cancer Genome Consortium (3). In 30 of these 90 samples, the correlation between FGFR4 mRNA and FGFR4 protein levels as determined with IHC was assessed to corroborate the findings obtained with biomarker analyses.
Statistical analysis
The differences in mRNA expression levels were assessed with the Mann-Whitney U test. The differences in proportions of categorical variables were tested with the Fisher exact test. Correlations between the analytes were assessed using Spearman rank correlation. Progression-free survival (PFS) and OS were estimated using Kaplan–Meier methods, and differences between subgroups divided by candidate biomarkers were evaluated using the log-rank test. Univariate and multivariate Cox regression analyses were performed for potential biomarkers for predicting outcomes. All comparisons were considered significant if the P value was <0.05. All statistical analyses and graphical drawings were performed using R software (version 3.5.2) and its latest packages.
RESULTS
Rich FGFR4 expression in the absence of gene alteration
The clinicopathological background of the TCGA-liver hepatocellular carcinoma (HCC) cohort has been described in detail (8). We performed transcriptome analyses using these sequencing data, which were mainly derived from surgically resectable cases in a mixed Western and Asian population. Although the mRNA expression levels of any RTK were equiponderated in a tight range in adjacent liver tissues, strict regulations were disrupted in HCC. Consequently, FGFR3 and FGFR4 were significantly overexpressed (Figure 2a). Of note, HCC showed a distinct RTK expression pattern with increased levels of FGFR4 in the absence of gene amplifications or fusions. Only the median of FGFR4 in HCC exceeded the threshold line (1E+6 fragments per kilobase of transcript per million mapped reads upper quartile), despite the limited number of gene amplifications (3 of 244 cases [1.2%] above the threshold) (Figure 2b). Cross-cancer analysis showed that the level of upregulation was nearly equal to that of cancers harboring driver amplifications such as ERBB2-amplified colorectal cancer or EGFR-, ERBB2-, and FGFR2-amplified gastric cancer (Figure 2b). On the other hand, the mRNA levels of RTK ligands including FGF19 varied widely, and no organ-specific pattern was found among them (see Figure S1, Supplementary Digital Content 1, http://links.lww.com/CTG/A282).
Figure 2.

In silico approaches to The Cancer Genome Atlas transcriptome. (a) RTK mRNA expression in liver tumors and surrounding liver tissues. Asterisks show significant increases in FGFR3 and FGFR4 (P = 5.1E-10 and 2.2E-16, respectively). Each dot is a single case. (b) Comparisons with other gastrointestinal cancers. The red line indicates the threshold we set. In 16 of 63 cases (25%) above the line, ERBB2 was amplified in colorectal cancer. The RTK genes EGFR, ERBB2, and FGFR2 were also amplified in 9 of 10 (90%), 43 of 63 (68%), and 4 of 7 (57%) cases of gastric cancer, respectively. Each dot is a single case. (c) Hallmark gene sets enriched in samples with higher FGFR4 expression. MYC_TARGETS_V1 (top, ES = 0.72, FDR = 0.004), MYC_TARGETS_V2 (middle, ES = 0.75, FDR = 0.006), WNT_BETA_CATENIN_SIGNALING (bottom, ES = 0.57, FDR = 0.02). (d) Hallmark gene sets downregulated or upregulated in HCC according to FGFR4 levels. (e) Kaplan–Meier survival curves in colorectal cancer and HCC according to the FGFR4 level. Median overall survival did not differ in colorectal cancer. High FGFR4 expression in HCC showed a trend for shorter survival (5.8 vs 4.4 years). (f) Hazard ratios for death according to expression of RTKs and RTK ligands in HCC tumors. ES, enrichment score; FDR, false discovery rate q value; FGFR, fibroblast growth factor receptor; FPKM-UQ, fragments per kilobase of transcript per million mapped reads upper quartile; HCC, hepatocellular carcinoma; mRNA, messenger RNA; RTK, receptor tyrosine kinase.
Downstream signatures and tumor aggressiveness associated with FGFR4 overexpression
Gene set enrichment analysis revealed that a higher FGFR4 level was closely related to downstream signatures that conferred survival advantages on cancer cells (Figure 2c, d). In particular, c-Myc-associated signatures matched well to a previous report (18) in which a large microarray data set showed that c-Myc overexpression occurred in about one-third of HCC and led to an aggressive phenotype (Hoshida S2 signature). The same research group also performed cell line experiments and showed that FGFR4 protein is overexpressed in S2 signature cells (7). Accordingly, OS with high FGFR4 expression showed poor trends in HCC, whereas no difference was found in colorectal cancer (Figure 2e). By contrast, OS of gastric cancer with high FGFR4 expression was significantly extended (see Figure S2, Supplementary Digital Content 1, http://links.lww.com/CTG/A282). Cox regression analyses for RTKs and RTK ligands in HCC showed that FGFR4 and VEGFD expression were associated with worse OS with nearly significant hazard ratios (Figure 2f).
Tumor FGFR4 protein expression predicts better PFS and objective response
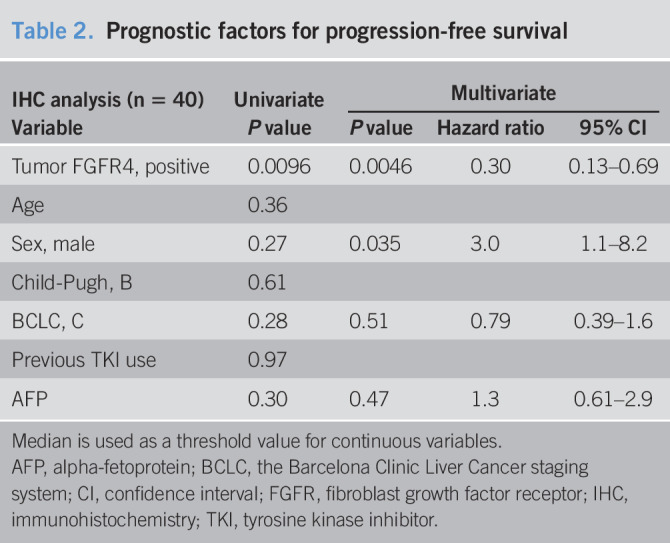
Remarkable dependence on the FGFR4 pathway as mentioned earlier might explain susceptibility to lenvatinib. Next, we quantified FGFR4 protein in pretreatment HCC samples with IHC. By contrast to adjacent liver tissues in which each liver cell was homogeneously stained, liver cancer tissues showed a wide range of IHC staining intensities. We focused on the percentage of FGFR4-positive tumor cells and divided tumor samples into 3 grades (Figure 3a). As expected, PFS clearly improved according to these IHC grades (Figure 3b). Considering the common use of lenvatinib in real-world clinical practice, we combined the moderate and high expression levels and considered these to be positive for FGFR4-IHC for establishing a clinically meaningful and usable indicator. As a result, the superiority in PFS remained statistically significant (2.5 vs 5.5 months, Figure 3c). FGFR4-IHC positivity was also associated with a favorable objective response as confirmed by mRECIST (31% vs 81%, P = 0.006, Figure 3d) but not by RECIST (15% vs 22%, P = 0.07, see Table S2, Supplementary Digital Content 1, http://links.lww.com/CTG/A282). OS after the start of lenvatinib administration did not show a particular trend among subgroups, probably because approximately 40% of this population received sorafenib or regorafenib as a previous line of systemic chemotherapy (see Figure S3A, B, Supplementary Digital Content 1, http://links.lww.com/CTG/A282). After multivariate analyses, FGFR4-IHC was regarded as a promising predictor of PFS (Table 2).
Figure 3.

FGFR4 IHC predicts treatment outcomes. (a) Representative images of graded FGFR4 protein expression by IHC (×400 magnification; scale bar = 50 μm). (b) Median progression-free survival (PFS) rates for low, moderate, and high FGFR4 expression were 2.5, 5.3, and 6.5 months, respectively. (c) PFS for FGFR4-IHC negative (low) and positive (moderate and high). (d) Tumor objective response in mRECIST according to FGFR4-IHC. FGFR, fibroblast growth factor receptor; IHC, immunohistochemistry; mRECIST, modified Response Evaluation Criteria in Solid Tumor; PD, progression of disease; PR, partial response; SD, stable disease.
Table 2.
Prognostic factors for progression-free survival
The blood FGFR4 level does not predict benefits of treatment
To confirm whether the serum assay would work as a less-invasive alternative for measuring the intensity of FGFR4 signaling molecules, we performed ELISA to detect soluble FGFR4 in the peripheral blood obtained at baseline. Unlike the IHC result, a high serum FGFR4 level above the median was not significantly associated with PFS (Figure 4a). Even when the survival data were limited to patients without previous tyrosine kinase inhibitor treatment, a high serum FGFR4 level did not predict a favorable PFS in this study (4.0 vs 4.8 months, Figure 4b). We found no association between tumor FGFR4-IHC and serum FGFR4-ELISA and no correlations between serum FGFR4 and conventional tumor markers (Figure 4c, d). The serum FGFR4 level also was not related to objective response as confirmed by mRECIST and RECIST (see Table S3, Supplementary Digital Content 1, http://links.lww.com/CTG/A282).
Figure 4.

Soluble FGFR4 level does not predict treatment outcomes. (a) Median progression-free survival rates for low and high levels of blood FGFR4 were 4.9 and 4.3 months, respectively. The boundary value of the low and high levels is the median of blood FGFR4. (c) The FGFR4 protein levels expressed on tumor cells did not correlate with the serum FGFR4 level. Each dot is a single case. (d) No correlation between serum FGFR4 and tumor markers. Each dot is a single case. (e) Correlation between serum FGFR4 and platelet counts, ALT, and FIB-4 in controls. Each dot is a single case. AFP, alpha-fetoprotein; ALT, alanine aminotransferase; DCP, des-gamma carboxyprothrombin; FGFR, fibroblast growth factor receptor; FIB-4, fibrosis-4 index.
Liver fibrosis and alternative RNA splicing may complicate interpretation of the level of soluble FGFR4 in peripheral blood
To explain the inconsistency between the result of tumor and blood FGFR4, we assessed the level of serum FGFR4 in control patients harboring specific liver conditions for active inflammation. Interestingly, the levels of serum FGFR4 differed widely according to background liver fibrosis. In particular, platelet counts in peripheral blood and the fibrosis-4 index index were moderately correlated with FGFR4-ELISA (Figure 4e), which suggested that the FGF19–FGFR4 signaling pathway is enriched in the fibrogenic environment and considerably affects the level of soluble FGFR4 in peripheral blood even in noncancerous populations.
The level of soluble FGFR4 in peripheral blood in other patients with cancer is elevated compared with healthy controls (18). Therefore, we further evaluated the possibility of extracellular release of FGFR4 protein from HCC by using the RNA expression data in archival surgical tissues in our institution. First, by processing RTK mRNA data provided by International Cancer Genome Consortium, we successfully duplicated an FGFR4-dominant expression pattern similar to TCGA (Figure 5a). Then, we performed IHC in 30 samples selected from this cohort. The level of mRNA was not associated with the level of FGFR4-IHC (Figure 5b, c). According to previous reports (19,20), FGFR4 variants that lack a transmembrane domain are released into the tumor microenvironment and bloodstream because of alternative splicing. Both this putative biology and our results suggest that we would observe tumor profiles and kinetics if we analyzed specific splice variants of FGFR4 that are derived from HCC; we plan to perform these analyses in the near future.
Figure 5.
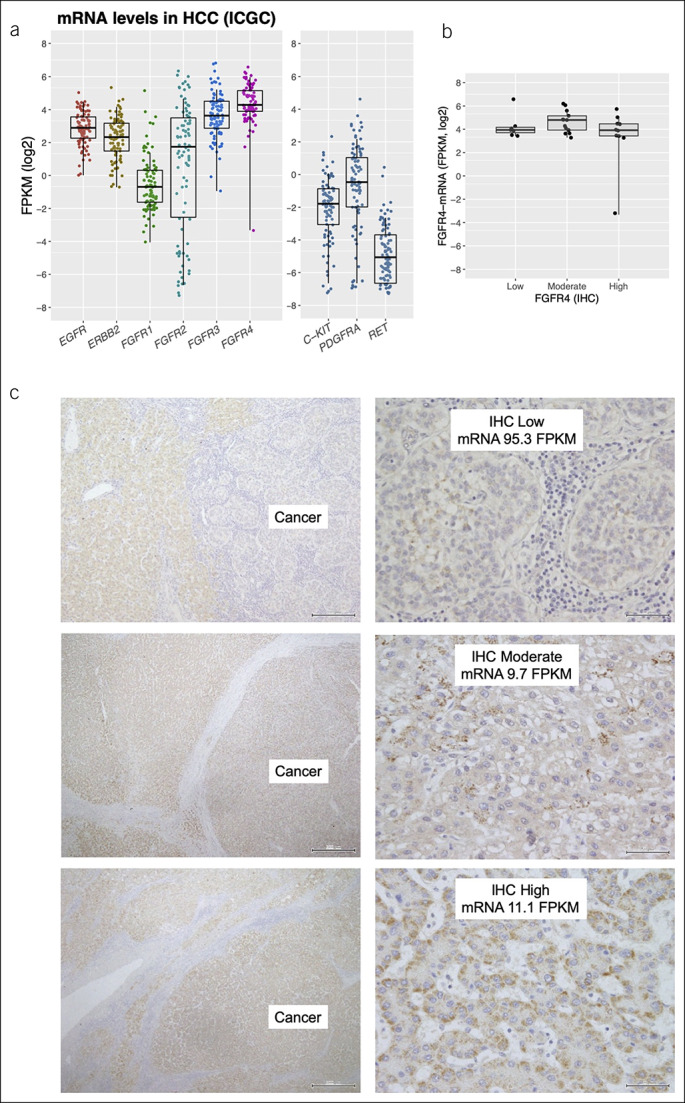
Additional analyses using surgical samples from ICGC. (a) Receptor tyrosine kinase mRNA expression in the ICGC cohort. The right panel shows relatively low expression of 3 genes, which encode molecules targeted by lenvatinib. When log expression is required for 0 FPKM, 0.01 is added as an offset. Each dot is a single case. (b) The FGFR4 protein levels expressed on tumor cells did not correlate with the amount of mRNA expression. Each dot is a single case. (c) Representative images of FGFR4 protein expression in surgically resected specimens (×100 and ×400 magnification). FGFR, fibroblast growth factor receptor; FPKM, fragments per kilobase of transcript per million mapped reads; HCC, hepatocellular carcinoma; ICGC, International Cancer Genome Consortium; IHC, immunohistochemistry; mRNA, messenger RNA.
DISCUSSION
This study demonstrated the importance of tumor profiling before the start of lenvatinib to determine likely treatment responders. IHC for tumors to detect FGFR4 might predict PFS and mRECIST response, which are the most reliable surrogates for OS of patients with advanced HCC (21). Our study identified tumor FGFR4 levels as independent predictors of lenvatinib responders. Therefore, we might be able to distinguish the FGFR4 phenotypes, and hence response to lenvatinib, with simple tumor analysis.
We first showed the biological feature of liver cancer driven by FGFR4 signaling by using TCGA data, a completely different approach. In normal liver cells, interactions between FGFR4 and its ligand FGF19 work to regulate bile acid synthesis (22,23). This characteristic of liver cells might affect the cells as they evolve into a neoplasm. Our hypothesis that liver cancer cells divert the FGFR4 pathway to cause dedifferentiation and proliferation was reasonable.
Our immunohistochemical experiments to quantify FGFR4 levels on cancer cells successfully identified responders. The result was based on a proof of concept in pharmacologic targeting and became the first evidence to support the profound benefit of lenvatinib. To date, biomarkers for multikinase inhibitors such as sorafenib and regorafenib have not been fully established in gastrointestinal and hepatobiliary oncology. Regarding sorafenib, an earlier standard chemotherapy for liver cancer, exceptional responders have a molecular background that includes FGF3/FGF4 amplification in 11q13 (24). Because this locus also encodes FGF19, its amplification might partially explain the favorable response to lenvatinib. However, the frequency of amplification in HCC is only 2%–3%, and therefore, the clinical value of targeted genomic sequencing is limited. In the case of adjuvant use of sorafenib after resection of liver cancer, some gene signatures strongly predict better recurrence-free survival (25). However, a nonbiased, comprehensive scheme using next-generation sequencing and complicated bioinformatics is problematic regarding costs and standardization of procedures. As shown in this analysis, the unique biology of liver cancer enables us to introduce a single-protein approach with high reproducibility.
The negative results of soluble FGFR4 as a biomarker in blood shed light on the complexity of its kinetics in peripheral blood. Underlying liver fibrosis and splice variants derived from the tumor might affect the concentrations of FGFR4 in blood. Obviously, liver fibrosis is linked to pharmacokinetics and the patients' response to lenvatinib. Furthermore, alternative RNA splicing may be a factor associated with cancer heterogeneity, aggressiveness, and therapeutic response (26). Although less-invasive biomarkers are needed in the field, blood FGFR4 at baseline is, currently, not feasible for patient selection. However, blood assessment can be performed repeatedly, and multianalytes and multiomics approaches in conjunction with serum FGFR4 over time might provide real-time information about the potent benefit from lenvatinib or the emergence of acquired resistance in the later treatment period.
Our study has several limitations. Although sample collection was performed prospectively, the sample size was relatively small, and the proportion of patients with analyzable tissue was limited. To truly observe drug efficacy, patients with extremely short exposure to lenvatinib were excluded. Therefore, multiinstitutional validation with adequate power for statistical analysis is warranted. The second limitation is the absence of an explanation for FGFR4 localization in cells. Many reports describe that immunohistochemical staining for FGFR4 shows not only membranous but also a cytoplasmic pattern (27,28). Our IHC findings also revealed dense granular deposits in the cytoplasm, especially in liver cancer cells. Rapid turnover with sequestration and internalization of RTKs might be related to this phenomenon. Further structural and functional analysis of FGFR4 is needed.
In conclusion, we propose the use of assessment of FGFR4 protein in the tumor as a biomarker to address an urgent clinical issue. We believe that not only genomic but also transcriptomic–proteomic profiling will contribute to establishment of precision medicine for patients with unresectable HCC.
CONFLICTS OF INTEREST
Guarantor of the article: Kazuaki Chayama, MD, PhD.
Specific author contributions: M.Y. and K.C. conceived the study. M.Y., A.O., D.M., A.H., C.N.H., M.F., and H.N. performed the analysis. K.K., S.U., Y.T., K.M., H.F., T.N., E.M., T.K., M.T., A.H., and M.I. contributed to collection of specimens and clinical data. A.I., P.Z., and W.Y. supported the immunohistochemical experiments. A.O. and H.H. performed the serum analysis.
Financial support: This work was partly supported by funding from Sumitomo Dainippon Pharma.
Potential competing interests: K.C. received lecture fees from Bristol-Myers Squibb, MSD, AbbVie, Gilead, and Sumitomo Dainippon Pharma and received grants from Bristol-Myers Squibb, Sumitomo Dainippon Pharma, MSD, AbbVie, TORAY, Eisai, Janssen Pharmaceutical, Daiichi-Sankyo, Roche, Otsuka Pharmaceutical, and Mitsubishi-Tanabe Pharma during the conduct of the study.
Study Highlights.
WHAT IS KNOWN
✓ Scarcity of druggable genomic alterations has long hindered the development of personalized treatment of HCC.
✓ Predictors of the efficacy of multikinase inhibitors have not been identified.
WHAT IS NEW HERE
✓ Distinct features of the liver cell transcriptome might affect the dependency on the FGFR4 pathway in HCC.
✓ Tumor FGFR4 protein expression with IHC predicts a better response and survival benefit of lenvatinib.
✓ Fluctuations in soluble FGFR4 in peripheral blood because of underlying liver fibrosis and splicing of secretory variants impact the clinical application as a less-invasive alternative to tumor FGFR4.
TRANSLATIONAL IMPACT
✓ The characteristic pattern of protein expression in liver cancer may provide information on the benefit of lenvatinib.
Supplementary Material
Footnotes
SUPPLEMENTARY MATERIAL accompanies this paper at http://links.lww.com/CTG/A282
REFERENCES
- 1.Global Burden of Disease Cancer Collaboration, Fitzmaurice C, Akinyemiju TF, et al. Global, regional, and national cancer incidence, mortality, years of life lost, years lived with disability, and disability-adjusted life-years for 32 cancer groups, 1990 to 2015: A systematic analysis for the global burden of disease study. JAMA Oncol 2017;3:524–48. [DOI] [PMC free article] [PubMed] [Google Scholar]
- 2.Schulze K, Imbeaud S, Letouzé E, et al. Exome sequencing of hepatocellular carcinomas identifies new mutational signatures and potential therapeutic targets. Nat Genet 2015;47:505–11. [DOI] [PMC free article] [PubMed] [Google Scholar]
- 3.Fujimoto A, Furuta M, Totoki Y, et al. Whole-genome mutational landscape and characterization of noncoding and structural mutations in liver cancer. Nat Genet 2016;48:500–9. [DOI] [PubMed] [Google Scholar]
- 4.Kudo M, Finn RS, Qin S, et al. Lenvatinib versus sorafenib in first-line treatment of patients with unresectable hepatocellular carcinoma: A randomised phase 3 non-inferiority trial. Lancet 2018;391:1163–73. [DOI] [PubMed] [Google Scholar]
- 5.Ho HK, Pok S, Streit S, et al. Fibroblast growth factor receptor 4 regulates proliferation, anti-apoptosis and alpha-fetoprotein secretion during hepatocellular carcinoma progression and represents a potential target for therapeutic intervention. J Hepatol 2009;50:118–27. [DOI] [PubMed] [Google Scholar]
- 6.Gauglhofer C, Paur J, Schrottmaier WC, et al. Fibroblast growth factor receptor 4: A putative key driver for the aggressive phenotype of hepatocellular carcinoma. Carcinogenesis 2014;35:2331–8. [DOI] [PubMed] [Google Scholar]
- 7.Schmidt B, Wei L, DePeralta DK, et al. Molecular subclasses of hepatocellular carcinoma predict sensitivity to fibroblast growth factor receptor inhibition. Int J Cancer 2016;138:1494–505. [DOI] [PMC free article] [PubMed] [Google Scholar]
- 8.Cancer Genome Atlas Research Network. Comprehensive and integrative genomic characterization of hepatocellular carcinoma. Cell 2017;169:1327–41. [DOI] [PMC free article] [PubMed] [Google Scholar]
- 9.Pearson A, Smyth E, Babina IS, et al. High-level clonal FGFR amplification and response to FGFR inhibition in a translational clinical trial. Cancer Discov 2016;6:838–51. [DOI] [PMC free article] [PubMed] [Google Scholar]
- 10.Kudo M. Lenvatinib may drastically change the treatment landscape of hepatocellular carcinoma. Liver Cancer 2018;7:1–19. [DOI] [PMC free article] [PubMed] [Google Scholar]
- 11.Hoshi T, Watanabe Miyano S, Watanabe H, et al. Lenvatinib induces death of human hepatocellular carcinoma cells harboring an activated FGF signaling pathway through inhibition of FGFR-MAPK cascades. Biochem Biophys Res Commun 2019;513:1–7. [DOI] [PubMed] [Google Scholar]
- 12.Zhu AX, Park JO, Ryoo BY, et al. Ramucirumab versus placebo as second-line treatment in patients with advanced hepatocellular carcinoma following first-line therapy with sorafenib (REACH): A randomised, double-blind, multicentre, phase 3 trial. Lancet Oncol 2015;16:859–70. [DOI] [PubMed] [Google Scholar]
- 13.Abou-Alfa GK, Meyer T, Cheng AL, et al. Cabozantinib in patients with advanced and progressing hepatocellular carcinoma. N Engl J Med 2018;379:54–63. [DOI] [PMC free article] [PubMed] [Google Scholar]
- 14.Reich M, Liefeld T, Gould J, et al. GenePattern 2.0. Nat Genet 2006;38:500–1. [DOI] [PubMed] [Google Scholar]
- 15.Subramanian A, Tamayo P, Mootha VK, et al. Gene set enrichment analysis: A knowledge-based approach for interpreting genome-wide expression profiles. Proc Natl Acad Sci USA 2005;102:15545–50. [DOI] [PMC free article] [PubMed] [Google Scholar]
- 16.Anaya J. OncoLnc: Linking TCGA survival data to mRNAs, miRNAs, and lncRNAs. PeerJ Computer Sci 2016;2:e67. [Google Scholar]
- 17.Sterling RK, Lissen E, Clumeck N, et al. Development of a simple noninvasive index to predict significant fibrosis in patients with HIV/HCV coinfection. Hepatology 2006;43:1317–25. [DOI] [PubMed] [Google Scholar]
- 18.Hoshida Y, Nijman SM, Kobayashi M, et al. Integrative transcriptome analysis reveals common molecular subclasses of human hepatocellular carcinoma. Cancer Res 2009;69:7385–92. [DOI] [PMC free article] [PubMed] [Google Scholar]
- 19.Takaishi S, Sawada M, Morita Y, et al. Identification of a novel alternative splicing of human FGF receptor 4: Soluble-form splice variant expressed in human gastrointestinal epithelial cells. Biochem Biophys Res Commun 2000;267:658–62. [DOI] [PubMed] [Google Scholar]
- 20.Motylewska E, Stępień T, Borkowska M, et al. Alteration in the serum concentrations of FGF19, FGFR4 and βKlotho in patients with thyroid cancer. Cytokine 2018;105:32–6. [DOI] [PubMed] [Google Scholar]
- 21.Lencioni R, Montal R, Torres F, et al. Objective response by mRECIST as a predictor and potential surrogate end-point of overall survival in advanced HCC. J Hepatol 2017;66:1166–72. [DOI] [PubMed] [Google Scholar]
- 22.Lin BC, Wang M, Blackmore C, et al. Liver-specific activities of FGF19 require Klotho beta. J Biol Chem 2007;282:27277–84. [DOI] [PubMed] [Google Scholar]
- 23.Jiao N, Baker SS, Chapa-Rodriguez A, et al. Suppressed hepatic bile acid signalling despite elevated production of primary and secondary bile acids in NAFLD. Gut 2018;67:1881–91. [DOI] [PubMed] [Google Scholar]
- 24.Arao T, Ueshima K, Matsumoto K, et al. FGF3/FGF4 amplification and multiple lung metastases in responders to sorafenib in hepatocellular carcinoma. Hepatology 2013;57:1407–15. [DOI] [PubMed] [Google Scholar]
- 25.Pinyol R, Montal R, Bassaganyas L, et al. Molecular predictors of prevention of recurrence in HCC with sorafenib as adjuvant treatment and prognostic factors in the phase 3 STORM trial. Gut 2019;68:1065–75. [DOI] [PMC free article] [PubMed] [Google Scholar]
- 26.Robinson TJ, Freedman JA, Al Abo M, et al. Alternative RNA splicing as a potential major source of untapped molecular targets in precision oncology and cancer disparities. Clin Cancer Res 2019;25:2963–8. [DOI] [PMC free article] [PubMed] [Google Scholar]
- 27.Desnoyers LR, Pai R, Ferrando RE, et al. Targeting FGF19 inhibits tumor growth in colon cancer xenograft and FGF19 transgenic hepatocellular carcinoma models. Oncogene 2008;27:85–97. [DOI] [PubMed] [Google Scholar]
- 28.Qian ZR, Sano T, Asa SL, et al. Cytoplasmic expression of fibroblast growth factor receptor-4 in human pituitary adenomas: Relation to tumor type, size, proliferation, and invasiveness. J Clin Endocrinol Metab 2004;89:1904–11. [DOI] [PubMed] [Google Scholar]
Associated Data
This section collects any data citations, data availability statements, or supplementary materials included in this article.