

OBJECTIVES:
The impact of genetic variants (single nucleotide polymorphisms [SNPs]) in the clinical heterogeneity of ulcerative colitis (UC) remains unclear. We showed that patients with UC exhibit a deficiency in MGAT5 glycogene transcription in intestinal T cells associated with a hyperimmune response. Herein, we evaluated whether MGAT5 SNPs might functionally impact on T cells glycosylation and plasma IgG glycome in patients with UC, as well as in UC clinical outcomes.
METHODS:
Three selected MGAT5 SNPs (rs3814022, rs4953911, and rs1257220), previously associated with severity of autoimmune disease or with plasma glycome composition in healthy individuals, were functionally evaluated in patients with UC through analysis of MGAT5 mRNA levels in colonic (n = 14) and circulating (n = 24) T cells and through profiling the plasma IgG Fc glycosylation (n = 152). MGAT5 SNPs were genotyped in 931 patients with UC from 2 European cohorts and further associated with patients' prognosis. Targeted next-generation sequencing for MGAT5 coding and regulatory regions was also performed.
RESULTS:
MGAT5 SNPs were shown to be functionally associated with low transcription levels of MGAT5 in colonic and circulating T cells from patients with UC and with agalactosylation of IgGs, often associated with a proinflammatory phenotype. The SNPs rs3814022 and rs4953911 were further associated with the need of biologics. Next-generation sequencing data further revealed a combination of MGAT5 SNPs that stratify patients with UC according to their severity.
DISCUSSION:
Our results revealed that MGAT5 SNPs have a phenotypic impact on T cells glycosylation and in plasma IgG glycome composition associated with UC pathogenesis. MGAT5 SNPs display a tendency in the association with a worse disease course in patients with UC.
INTRODUCTION
Inflammatory bowel disease (IBD), which includes ulcerative colitis (UC) and Crohn's disease (CD), is a multifactorial disorder in which genetically susceptible individuals develop an exacerbated immune response in the gut (1). The heterogeneity of IBD in terms of disease course, severity and therapeutic outcomes, highlights the urgent need in the clinics to identify reliable biomarkers that could help in patients' stratification, enabling a personalized medicine through optimized preventive and therapeutic strategies. Genome-wide association studies have revolutionized our understanding of complex diseases. In fact, susceptibility to IBD is unequivocally a complex genetic trait with around 240 distinct genetic risk loci identified so far (2), most of them is associated with both CD and UC, whereas 54 are CD specific and 31 are UC specific. These loci are enriched in genes related with the immune system and the predisposition for host–microbiome interactions. The disease course and response to therapy are, however, less clearly defined by genetic factors (3,4), which remain as a major challenge for IBD research and clinical practice. Associations with some clinical features such as age at onset and disease location (NOD2, MST1 3p21, and major histocompatibility complex [MHC]) (5), need for surgery (NOD2) (6), and nonresponse to therapy (major histocompatibility complex and MDR1) (7–9) were shown. Curiously, most of the IBD risk single nucleotide polymorphisms (SNPs) are located in the noncoding regions, which make up 98% of the DNA (10–13). This highlights the importance of these noncoding regions in IBD immunopathogenesis, which is supported by the fact that those SNPs may be in linkage disequilibrium with relevant coding variants, something especially true in the HLA region on Chromosome 6 as shown for HLA variants (10,14). In fact, IBD-associated risk SNPs were shown to be located in regulatory regions of immune and epithelial cells (15) and to be enriched in activated DNA regulatory elements such as enhancers and promoters, in active disease (16).
Glycosylation is considered a pleotropic event in which the addition of glycans to proteins and lipids is essential for the regulation of both innate and adaptive immune responses (17–20). In humoral response, N-glycosylation of the conserved fraction (Fc) of immunoglobulin G (IgG) is known to regulate the effector functions of the Igs by modulating the binding affinity to FcγRs, instructing either a proinflammatory or an antiinflammatory response (21,22). In fact, alterations on IgG N-glycosylation were shown to predict the onset of immune-mediated diseases such as rheumatoid arthritis (23) and were recently associated with IBD clinical features (24–27). The role of protein glycosylation in the immunopathogenesis of chronic inflammatory gastrointestinal diseases, such as IBD, has been well-documented (28). In particular, the β-1,6 GlcNAc branched N-glycans (catalyzed by the N-acetylglucosaminyltransferase [GnT]-V enzyme that is encoded by MGAT5) were demonstrated to act as a critical determinant for T-cell function and activity (17) in major diseases such as multiple sclerosis (MS) (29–31) and type-I diabetes (32). In the context of gut immunity, we demonstrated that patients with UC display a deficiency on these branched N-glycans at the surface of intestinal T cells owing to a significant downregulation of the MGAT5 glycogene (33), which encodes the GnT-V enzyme. This dysfunction in MGAT5/GnT-V–mediated branched N-glycosylation was associated with the hyperactivation of the T-cell–mediated immune response because of its effects in the regulation of the threshold of T-cell activation (34–36). We further showed that the levels of expression of branched N-glycans have prognostic applications by predicting the failure to standard therapy in UC (37).
Despite the clinical and pathogenic role of MGAT5-mediated glycosylation in UC, the underlying cause for the deficiency of MGAT5 glycogene expression associated with the pathogenesis of UC remains unknown. Interestingly, genetic variants (polymorphisms) of MGAT5 glycogene were associated with other immune-mediated disorders such as MS (38,39), which is a model for IBD understanding. Intronic variants of MGAT5 were significantly associated with the clinical outcome of MS (38) and with variations in the human plasma N-glycome composition of healthy European adults (40).
In this study, we explored whether genetic variants of MGAT5 gene are functionally correlated with the glycosylation alterations on T cells and with changes in plasma glycome composition associated with UC pathogenesis and clinical outcomes of patients, an issue that was never explored before.
METHODS
SNP genotyping
We have selected relevant MGAT5 genetic variants based on previous associations with the severity of other immune-mediated diseases (such as MS) and with plasma glycome variations. Through literature search terms “MGAT5” AND (“genetic” or “polymorphisms” or “association study” or “autoimmune disease”), we have selected 3 intronic MGAT5 SNPs: 2 SNPs (rs3814022 and rs4953911) previously associated with severity to MS (38,41) and 1 SNP (rs1257220) that was previously associated with alterations in human plasma N-glycome in a healthy European population (40). Genotyping of these 3 SNPs was performed using TaqMan SNP genotyping assays (c__7480346_10 for rs1257220; c__2163491_10 for rs3814022; and c__3258342_10 for rs4953911) and the ABI 7500 Fast real-time PCR system (Applied Biosystems, CA).
Quantification of mRNA from CD3+ T cells of the blood and biopsy
CD3+ T cells were isolated from 24 blood samples from patients with UC (18 with active disease—with Mayo endoscopic subscore > 0). A density gradient centrifugation (with Lymphoprep, STEMCELL) was used to obtain a peripheral blood mononuclear cells suspension, and CD3+ cells were magnetically sorted using the EasySep Human T Cell Enrichment Kit (STEMCELL) following the manufacturer's instructions. CD3+ T cells were also isolated from 14 fresh colon biopsies (12 with active disease), through mechanical dissociation (36) and posterior magnetically sorted with EasySep Human T Cell Enrichment Kit (STEMCELL).
RNA was isolated using RNAqueous-Mirco kit (Ambion), and MGAT5 and GAPDH (used as reference genes) expression levels were detected using the Hs00159136_m1 and Hs02758991_g1 probes, respectively, by TaqMan Real-time PCR as previously described (33). The MGAT5 expression levels were evaluated in patients who display different genetic variants of the SNPs rs1257220, rs3814022, and rs4953911 and were normalized to GAPDH housekeeping expression by delta-CT method, and the results are shown as relative expression.
IgG glycosylation evaluation
IgG was isolated from a human plasma using affinity chromatography coupled to mass spectrometry as described previously (42). Briefly, 100 μL of plasma was loaded onto Protein G monolithic plate (BIA Separations, Ljubljana, Slovenia) and washed 3 times with 1× PBS. IgG was eluted using 0.1% formic acid and immediately neutralized with 1 M ammonium bicarbonate. Isolated IgG was digested with trypsin, and glycopeptides were purified using solid phase extraction as described previously (43) with slight changes. Approximately 20 μg of IgG was treated with 200 ng of trypsin (Promega, Fitchburg, WI) and incubated overnight at 37°C. Tryptic digests were loaded onto Chromabond C-18 stationary phase (Marcherey-Nagel, Düren, Germany) and washed 3 times with 0.1% TFA. Glycopeptides were eluted using 20% ACN and dried completely using a vacuum centrifuge. IgG glycopeptides were analyzed using M-class ACUITY UPLC system (Waters, Milford, MA) coupled to Compact mass spectrometer (Bruker Daltonics, Bremen, Germany). Dried glycopeptides were reconstituted in 80 μL of ultrapure water, and 5 μL were loaded onto Acclaim PepMap100 C8 (5 mm × 300 μm i.d.) trap column (Thermo Fisher Scientific, Waltham, MA) and washed for 1 minute with 0.1% TFA (solvent A) at a flow rate of 40 μL/min. Subclass-specific glycopeptides were separated on a Halo C18 nano-LC column (150 mm × 75 μm i.d., 2.7 μm HALO fused core particles; Advanced Materials Technology, Wilmington, DE) using a 3.5-minute gradient at a flow rate of 1 μL/min from 18% to 28% solvent B (80% ACN). Column temperature was maintained at 30°C. LC was coupled to MS through CaptiveSpray (Bruker) ion source equipped with NanoBooster (Bruker) using acetonitrile as a dopant in nebulizing gas (nitrogen). Mass spectra were recorded from m/z 800 to 2000 with 2 averages at a frequency of 0.5 Hz. Quadrupole ion energy and collision energy of the MS were set at 5 eV. Argon was used as collision gas. M-class ACUITY UPLC system was operated under MassLynx software version 4.1 (Waters), whereas Compact was controlled by HyStar software, version 4.2 (Bruker). Obtained raw data were converted into mzXML file format using ProteoWizard version 3 MSConvert tool. Data were extracted with LacyTools version 1.0.1. Alignment Parameters: alignment time window—25; mass window—0.1; signal-to-noise ratio—9; and alignment minimal peak—5. Calibration Parameters: mass window—0.5; signal-to-noise cutoff—9; and minimal peak number—3. Extraction Parameters: sum spectrum resolution—33; mass window—0.2; time window—25; minimum charge—2; and maximum charge—3. Data extraction was performed separately for doubly and triply charged species without subtraction. Absolute intensities of doubly and triply charged species were manually summed, and relative abundance of each of 20 glycoforms within each IgG subclass was calculated. Determination of relative abundance of agalactosylation, monogalactosylation, digalactosylation, sialylation, bisecting GlcNAc, and fucosylation were performed as stated in Table S1, Supplementary Digital Content 1, http://links.lww.com/CTG/A272.
UC cohort
This study comprises a Portuguese discovery cohort with 432 patients with UC from Centro Hospitalar e Universitário do Porto/Hospital Santo António (CHUP/HSA) and Hospital São João and a Belgian validation cohort with 499 patients with UC from University Hospitals Leuven. In the discovery cohort, patients were diagnosed with UC between 1968 and 2014, with a median (interquartile range [IQR]) age at diagnosis of 35 (26–46) years and 55.8% female patients. Patients from the validation cohort were diagnosed between 1957 and 2012 with a median (IQR) age at diagnosis of 33 (24–43) years and 43.8% female patients. Family history of disease includes patients with at least one first-degree relative with IBD. All clinical information (need for colectomy and biologics) from both cohorts was collected through the hospital-based electronic medical record system and is provided in Table S2, Supplementary Digital Content 2, http://links.lww.com/CTG/A273. Patients were classified as having worse prognosis when there was the need to step up to biologics within 2 years after diagnosis (a time in disease course that was consider to be an early introduction of more aggressive therapy owing to a more severe disease (44,45)), whereas those who did not need biologics or only stepped up to biologics after this period were considered as having a better prognosis. For next-generation sequencing (NGS), patients who only received 5-ASA or corticosteroid therapy (without experiencing neither resistance, who did not respond within 1 month of oral or 1 week of intravenous corticosteroid therapy, nor dependency, who initially responded but were unable to maintain control of symptoms without corticosteroids and needed low doses to remain symptom free (46,47)) were classified as having low disease severity, whereas a severe/complicated disease was defined when there was corticosteroid dependency, and/or corticosteroids resistance, and/or nonresponders to immunosuppressors (classified as patients keeping the activity and severity of disease despite optimal dose of thiopurine/methotrexate), and/or with need for biologics and/or need for colectomy. All participants gave informed consent about all clinical procedures and research protocols were approved by the ethics committee of the hospital.
Next-generation sequencing targeting the MGAT5 gene
Patients with UC were sequenced by NGS for all coding (including few intronic nucleotides nearby the exons) and regulatory regions of the MGAT5 gene, including a described promoter (48) and the 3′UTR. Primers used to amplify the mentioned regions are presented in Table S3, Supplementary Digital Content 3, http://links.lww.com/CTG/A274. NGS was performed in 31 patients with UC with a high genetic influence including 12 with family history (first-degree relatives with IBD) and 19 with a disease onset ≤18 years old (with a median [IQR] age at diagnosis of 15 [14–18] years), 8 patients with UC with a low genetic influence (without family history and with a late onset disease; median age of 22 [19–32] years), and 6 healthy individuals.
Sample DNA was quantified using the Qubit 3.0 fluorometer S/N 2321600945—Qubit dsDNA HS Assay kit P/N Q32851. Libraries were constructed according to Ion Xpress Plus Fragment Library Kit protocol and pooled: each sample was ligated to a unique barcode for sample identification and tracking. The pooled libraries were processed on Ion Chef System and sequenced on an Ion 314 chip using the Ion PGM System. FASTQ and/or BAM files were generated using the Torrent Suit plugin FileExporter v5. Data from the PGM run were processed using the Ion Torrent platform-specific pipeline software Torrent Suite v5 (Life Technologies) to generate sequence reads, trim adapter sequences, filter and remove poor signal reads, and split the reads according to the barcode. Reads assembly was performed by default settings with SeqMan NGen v14 (DNAStar, Madison, WI) using the FastQ files containing sequence reads, and the template references were adjusted for the covered amplicons. SeqMan Pro v14 (DNAStar) was used as postassembly analysis tool for the analysis of overall amplicon coverage, individual base depth of coverage, and variant identification.
Statistical analysis
Differences between MGAT5 mRNA levels of the different genotypes were assessed with Dunn's multiple comparison test or Mann–Whitney test using GraphPad (7.0). For each genotype, the outliers were identified and excluded. In addition, a linear logistic regression analysis for MGAT5 expression levels was performed in SPSS (26), using dominant (at least 1 copy of the risk allele), recessive (2 copies of the risk allele), or additive (presenting 0, 1, or 2 copies of the risk allele) models (with the major allele from each SNP as reference) as variables. The model was also adjusted to disease activity based on Mayo endoscopic (E) subscore at the time of sample collection (MayoE = 0—inactive and MayoE ≥ 1—active). A linear logistic regression was also performed for IgG glycosylation, with dominant or recessive models as variables together with age at the time of sample collection and gender.
Association between the SNPs and the clinical parameters was independently assessed using the SNPassoc package in R (3.5.1) and considering additive, dominant, and recessive models. For each model, an unconditional logistic regression was performed adjusting for gender and age at diagnosis. Haplotype frequencies were inferred using the haplo.stats package in R. Multiple testing correction was performed using the false discovery rate (FDR) method (49). Any SNP association resists to multiple correction; thus, all the P values presented are uncorrected. Association of haplotypes with clinical features was assessed for those with a minimum haplotype frequency above 0.01 and using the most frequent haplotype as reference. NGS data were clustered in SPSS (25) using hierarchical clustering analysis to group patient with UC according to the identified genetic variants (0, 1, or 2 rare alleles), using the between-groups linkage method and the squared Euclidean distance as distance measure.
RESULTS
MGAT5 genetic variants are associated with lower MGAT5 transcription in circulating T cells and impact on plasma IgG glycome composition in patients with UC
Impact of MGAT5 genotypes on mRNA transcription levels of colonic and circulating T cells from patients with UC.
The deficiency on MGAT5 transcription was previously associated with T-cell hyperactivation and UC disease severity (33,36). Moreover, levels of MGAT5-mediated branched glycosylation on the intestinal inflammatory infiltrate predict the nonresponse to standard therapy (37). We analyzed whether specific genetic variants of MGAT5 gene, known to be associated with severity of autoimmune disease and with changes in glycome of healthy adults, are functionally correlated with changes in MGAT5 mRNA transcription on lamina propria and circulating T cells from patients with UC. A logistic linear regression analysis was performed and adjusted to MayoE subscore, and the results showed that rs3814022 and rs4953911 are significantly associated with lower mRNA levels of the MGAT5 glycogene both in situ (in colonic CD3+ T cells) and circulating CD3+ T cells from patients with UC (Table 1). The same result was observed in circulating T cells without adjusting to disease activity (Figure 1). No association was observed for SNP rs1257220. These results show the influence of MGAT5 SNPs in MGAT5 expression of T cells in patients with UC.
Table 1.
Associations of the polymorphisms rs1257220, rs3814022, and rs4953911 with MGAT5 mRNA expression levels of circulating (N = 24) and lamina propria CD3+ T cells (N = 14) from patients with UC

Figure 1.

MGAT5 mRNA expression levels on circulating CD3+ T cells from 24 blood samples of patients with UC determined for the different genotypes of rs1257220, rs3814022, and rs4953911. The mRNA of MGAT5 expression levels were normalized to GAPDH expression by delta-CT method, and the data are the relative expression. G and T risk alleles of rs3814022 and rs4953911 showed lower levels of MGAT5 mRNA than C and A alleles, respectively. Outliers in each genotype were identified and excluded. Dunn's multiple comparison test was used to determine the differences of MGAT5 mRNA levels between genotypes and Mann–Whitney test to assess differences in dominant and recessive models. P values < 0.05 were considered as significant. NS, not significant; UC, ulcerative colitis.
MGAT5 genetic variants influence plasma IgG Fc N-glycosylation profile of patients with UC.
We further analyzed the functional implications of the different MGAT5 genetic variants in IgG glycome composition of 152 patients with UC (see Table S1, Supplementary Digital Content 1, http://links.lww.com/CTG/A272, and Figure S1, Supplementary Digital Content 4, http://links.lww.com/CTG/A267). Interestingly, in linear regression analysis, we found that rs3814022 and rs4953911 are significantly correlated with lower levels of monogalactosylation of the Fc domain of IgG2 and IgG3 (rs3814022 dominant model [CG + GG vs CC], Beta = −0.164, R2 = 0.044, P = 0.044; rs4953911 dominant model [AT + TT vs AA], Beta = −0.184, R2 = 0.051, P = 0.024; Table 2). The SNP rs4953911 was also found to be associated with agalactosylation of IgG1 (dominant model [AT + TT vs AA], Beta = 0.154, R2 = 0.194, P = 0.040; Table 1), which is in accordance with the fact that agalactosylation of IgG is often associated with a proinflammatory effector functions of IgGs (50). In addition, rs4953911 is associated with higher levels of fucosylation on IgG2 and IgG3 (recessive model [TT vs AT + AA], Beta = 0.184; R2 = 0.015, P = 0.027; Table 2). Similar to what we observed in relationship with MGAT5 mRNA levels, the SNP rs1257220 did not show any association with IgG glycosylation profile in patients with UC.
Table 2.
Associations of the MGAT5 SNPs rs1257220, rs3814022, and rs4953911 with IgG Fc glycosylation profile (only the statistically significant associations are shown)

Taken together, these observations demonstrate for the first time a direct correlation between genetic variants in a specific glycogene and its functional/phenotypic impact, through modulation of the glycosylation profile of key molecules involved in UC pathogenesis, such as T cells (28,33,36) and plasma IgGs (24).
MGAT5 SNPs are associated with UC clinical and therapeutic outcomes
To gain further insights on the clinical and prognostic relevance of the 3 SNPs in UC clinical outcome, we have genotyped the 3 SNPs in a Portuguese discovery cohort and validated in a Belgium validation cohort (see Table S2, Supplementary Digital Content 2, http://links.lww.com/CTG/A273).
In the discovery cohort, SNP rs3814022, which phenotypically associates with alterations in the glycosylation of T cells and plasma IgG glycome in patients with UC, seemed to be associated with the need to step up to biologics (recessive model [GG vs CC + CG]: OR = 2.27, P = 0.032, and log-additive model: OR = 1.53, P = 0.021; Table 3 and see Table S4, Supplementary Digital Content 5, http://links.lww.com/CTG/A275). This observation was, at least indirectly validated in the Belgium cohort, as the same variant (rs3814022 dominant model [CG + GG vs CC], OR = 2.21, P = 0.027; Table 3 and see Table S4, Supplementary Digital Content 5, http://links.lww.com/CTG/A275), together with rs4953911 (dominant model [AT + TT vs AA]: OR = 2.51, P = 0.012; log-additive: OR = 1.84, P = 0.022; Table 3 and see Table S4, Supplementary Digital Content 5, http://links.lww.com/CTG/A275), were associated with the need to step up therapy to biologics within the first 2 years after diagnosis (defined as worse prognosis). The combination of both cohorts suggest the association between rs3814022 and the need of biologics (dominant model: G carriers, OR = 1.36, P = 0.046; log-additive: OR = 1.31, P = 0.022; Table 3 and see Table S4, Supplementary Digital Content 5, http://links.lww.com/CTG/A275) and rs4953911 with need to step up to biologics within 2 years of disease (recessive model: TT, OR = 1.75, P = 0.047). Once time—disease duration since diagnosis until the clinical and therapeutic characterization—was added in as a variable, the associations between rs3814022 and rs4953911 and the need of biologics remains and follow the same tendency (see Table S5, Supplementary Digital Content 6, http://links.lww.com/CTG/A276).
Table 3.
Associations between rs1257220, rs3814022, and rs4953911, which are significant for at least one of the clinical and therapeutic outcomes in patients with UC

Furthermore, rs1257220 SNP (not correlated with changes in glycosylation) seemed to be associated with family history of IBD in the discovery cohort (dominant model [GA + AA vs GG]: OR = 4.2, P = 0.022), further validated in the Belgium cohort (recessive model [AA vs GG + GA]: OR = 3.59, P = 0.021) (Table 3 and see Table S4, Supplementary Digital Content 5, http://links.lww.com/CTG/A275) and in the combination of both cohorts (dominant model [GA + AA vs GG]: OR = 2.13, P = 0.025; recessive model [AA vs GG + GA]: OR = 2.13, P = 0.025; log-additive model: OR = 1.91, P = 0.027). In the combined cohort, rs1257220 was further associated with the need for colectomy (dominant model [GA + AA vs GG]: OR = 0.71, P = 0.037; Table 3 and see Table S4, Supplementary Digital Content 5, http://links.lww.com/CTG/A275).
The differences between the discovery and validation cohorts might reflect the fact that Leuven IBD center should be a tertiary referral center for IBD. The proportion of patients with extensive disease (pancolitis) who needed biologics is higher compared with Porto center hospital (see Table S2, Supplementary Digital Content 2, http://links.lww.com/CTG/A273), which together with heterogeneity among some clinical/therapeutic features between both cohorts might contribute to explain the different associations between the 2 cohorts.
Haplotypes were further inferred for each cohort and associated with the same clinical parameters, using as a reference the most frequent haplotype—GCA (G for rs1257220; C for rs3814022; and A for rs4963911; Table 4). Two haplotypes were associated with clinical features: ACA haplotype (containing the A risk allele rs1257220) with family history (validation cohort: OR = 2.39, P = 0.021; combined study: OR = 2.26, P = 0.011; Table 4) and need of biologics within 2 years (discovery cohort: OR = 2.81, P = 0.023); and GGT haplotype with the need for biologics (discovery cohort: OR = 1.74 [1.03–2.94], P = 0.037; combined study: OR = 1.47, P = 0.023, Table 4). Taking into consideration that patients carrying the GGT haplotype have a higher chance to be refractory to the standard therapy than the ones with the GCA haplotype, we can infer that the combination of these 2 risk SNPs (rs3814022 (G) and rs4953911 (T)) is more valuable and accurate in the prediction of the therapeutic outcome than rs1257220 alone.
Table 4.
Associations between the haplotypes and the clinical parameters, with the most frequent haplotype, the GCA (G for rs1257220; C for rs3814022; and A for rs4963911), used as reference for the associations

Altogether, these results suggest the clinical relevance of MGAT5 genetic variants in UC clinical outcome and patients' stratification. Nevertheless, none of the SNPs survived after multiple testing correction (see Table S6, Supplementary Digital Content 7, http://links.lww.com/CTG/A277). These results, even if suggestive of MGAT5 involvement in development of a severe/complicated UC, require a bigger sample size to confirm the role of this locus in UC disease course.
MGAT5 genetic variants from the 3′UTR are able to cluster patients with UC according to their disease severity
To further investigate other genetic variants on MGAT5 that could be determining clinical outcomes of patients with UC, we screened coding (including few intronic nucleotides nearby the exons) and regulatory regions (including a described promoter (48) and the 3′UTR) of the gene. We selected patients with UC with a high genetic influence—patients with family history (first-degree relatives with IBD) and with age of IBD onset ≤ 18 years old, as well as UC patients with low genetic influence including late-onset patients without family history and healthy individuals.
Through targeted sequencing of all coding (including few intronic nucleotides nearby the exons) and regulatory regions (including a described promoter (48) and the 3′UTR) of the MGAT5 gene, we identified a total of 46 genetic alterations. These included 1 deletion and 45 single nucleotide variants: 7 in the promoter, 28 in the 3′UTR, 9 in intronic regions, and 2 in exon regions (see Figure S2-S3, Supplementary Digital Content 8 and 9, http://links.lww.com/CTG/A268, http://links.lww.com/CTG/A269 and see Table S7, Supplementary Digital Content 10, http://links.lww.com/CTG/A278). The 2 SNPs identified in exons 9 (rs34876684) and 16 (rs2230908) are synonymous variants.
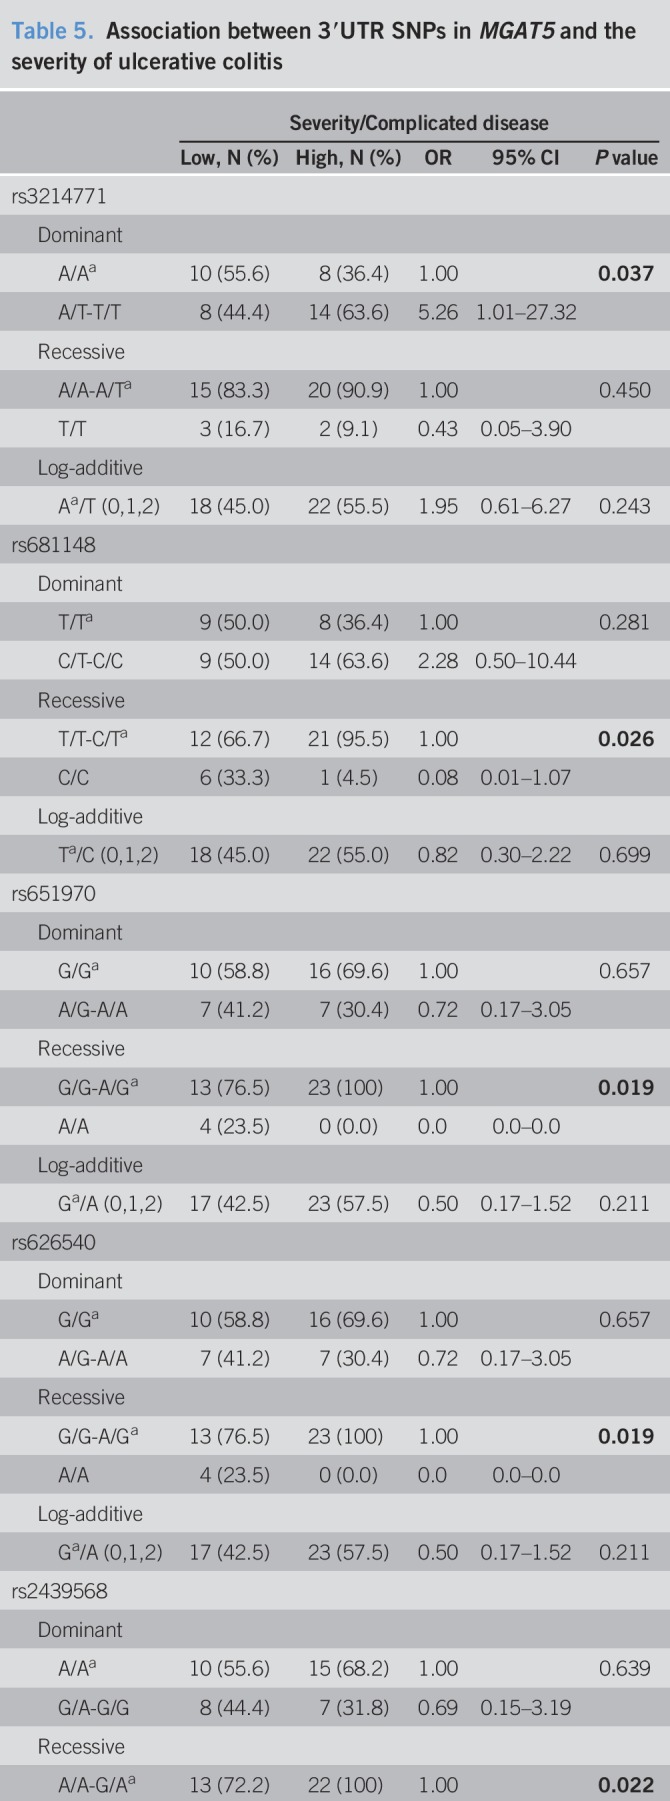
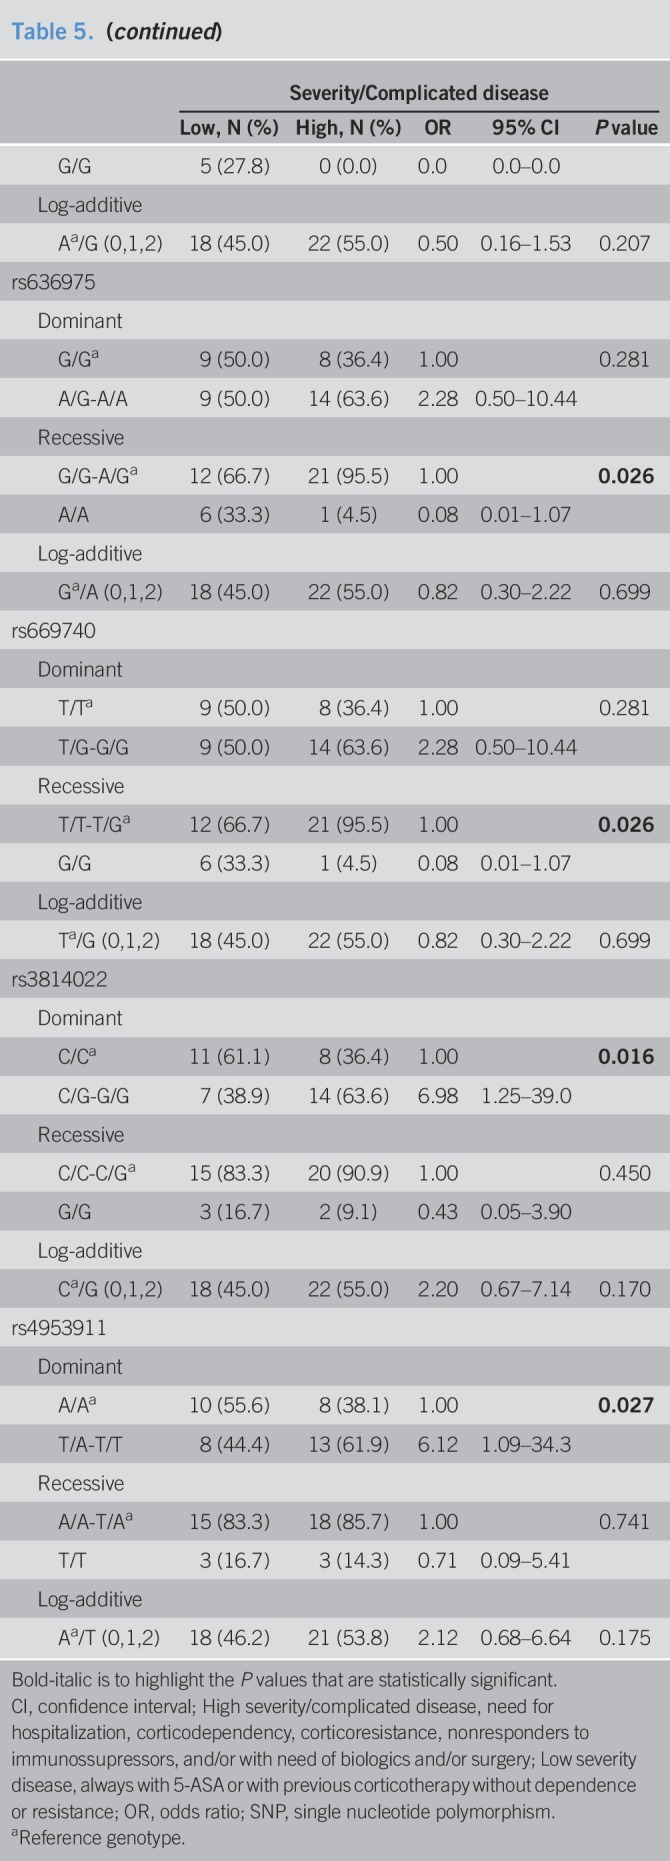
Clustering of the individuals according to genetic variants showed no discriminate pattern between healthy individuals and patients with UC (see Figure S3, Supplementary Digital Content 9, http://links.lww.com/CTG/A269). The distribution of the SNPs seems to be independent of the genetic burden of the patient (see Figure S3, Supplementary Digital Content 9, http://links.lww.com/CTG/A269). Focusing only on patients with UC, one of the main clusters (highlighted with a blue box; see Figure S4, Supplementary Digital Content 11, http://links.lww.com/CTG/A270) is completely (6 of 6) composed by patients with UC with low/mild severe disease (always on 5-ASA or previous corticosteroid therapy). The same is observed when including only genetic variants with a minor allele frequency ≥10% (Figure 2), which are predominantly constituted by SNPs from the 3′UTR region and the above-explored intronic SNPs. Moreover, another cluster (highlighted with an orange box; Figure 2 and see Figure S4, Supplementary Digital Content 11, http://links.lww.com/CTG/A270) was observed to be composed mainly by patients with UC with high severity/complicated disease. The specificity of the cluster increases when considering only the most frequent SNPs, from 68% (13/19; see Figure S4, Supplementary Digital Content 11, http://links.lww.com/CTG/A270) to 80% (12/15; Figure 2). Interestingly, the clustered group with patients with low severity is mainly composed by major alleles (rs3748900, rs34497810, rs62170036, rs7841, rs3762484, rs3214771, and rs1257198), including the 3 MGAT5 SNPs studied. The minor allele (in homozygosity) of 6 SNPs located in the 3′UTR (rs2439568, rs626540, rs651970, rs681148, rs669740, and rs636975; Figure 2) is also mainly present in patients developing a mild disease (Table 5). In addition, the logistic regression model shows that the minor allele from rs3214771 (intronic region before exon 8) and both studied risk alleles (rs3814022 (G) and rs4953911 (T)) are statistically associated with high severity/complicated UC (Table 5). Overall, these data support the identification of novel genetic variants, mainly in the regulatory 3′UTR region of MGAT5, which stratify patients with UC in accordance with disease severity.
Figure 2.

Genetic variants from regulatory and intron regions of MGAT5 (with a minor allele frequency higher than 10%) and the association with severity in patients with UC. Clustering of patients with UC (hierarchical cluster on the upper side) according to SNPs from the promoter and intron regions (hierarchical cluster on the right side). Each SNP is colored according to the genotype: green, homozygous for the frequent allele; yellow, heterozygous; and red, homozygous for the rare allele. The 3 studied SNPs (rs1257220, rs3814022, and rs4953911) are included in the clustering and highlighted in italic. UC disease of each patient is classified according to the severity as mild (always with 5-ASA or with the need of previous corticotherapy, in blue) and severe (need hospitalization, corticodependent, corticoresistant, no responder to immunossupressors, and need biologics or need surgery, in orange), shown in the line above the cluster of patients. Two distinct clinical clusters were created, one comprising 100% of patients with a low severity (highlighted with blue) and the other with 81% of patients with a high severity (highlighted with orange). SNP, single nucleotide polymorphism; UC, ulcerative colitis.
Table 5.
Association between 3′UTR SNPs in MGAT5 and the severity of ulcerative colitis
DISCUSSION
The susceptibility to IBD is unequivocally a complex genetic trait; however, the disease course, outcomes and response to therapy, is less clearly influenced by genes (51,52). In this study, we have identified a novel genetic risk locus that includes intronic SNPs in the glycogene MGAT5 that are functionally correlated with glycosylation alterations on T cells and plasma IgGs, both previously shown to be implicated in the regulation of the immune response in UC (33,36) and with clinical features in IBD (24), respectively. These MGAT5 genetic variants, together with other SNPs from regulatory regions of the gene, also display the potential to stratify patients with UC according to their likelihood of developing a severe/complicated disease. However, further confirmation in a bigger sample size and in a more recent cohort, avoiding possible historical bias of biologic management, is needed.
Glycosylation is fundamental for the fine-tuning of the immune system in general (18,53) and specifically in IBD (17,19,33,36,54). Genetic variants of specific glycogenes such as MGAT1 and MGAT5 were already correlated with susceptibility and severity of other immune-mediated diseases such as MS (31,38,39). Previous evidences from us have pinpointed the MGAT5/GnT-V–mediated branched N-glycosylation in the immunopathogenesis of UC. A deficiency in MGAT5 gene was observed in mucosal T cells from patients with UC and associated with hyperactivation of immune response and disease severity (33,36). However, the genetic cause underlying this altered transcription of MGAT5 glycogene associated with UC pathogenesis remained to be explored.
The observed functional impact of the SNPs on reduced expression levels of MGAT5 transcription on in situ (colonic T cells) and circulating T cells from patients with UC constitutes a genetic explanation for the deficiency on branched N-glycans on T cells associated with a hyperimmune T-cell response (34,36). This is also in accordance with our previous observations in which low levels of MGAT5-mediated branched N-glycans on the inflammatory infiltrate of colonic biopsies from patients with UC predict the failure to standard therapy and thus the need of biologics (37).
The studied MGAT5 SNPs are localized in a putative regulatory region because of the presence of histone and DNAse markers (55,56) (see Figure S5, Supplementary Digital Content 12, http://links.lww.com/CTG/A271), which suggest a putative function as an enhancer, although this needs to be further explored. Interestingly, a recent study identified regulatory modules that drive IBD associations for some risk loci and listed 3 regulatory models that operate specifically in MGAT5 and in T cells and monocytes (57), highlighting the importance of MGAT5 in IBD pathogenesis.
The functional relevance of MGAT5 genetic variants in UC is also demonstrated here through its impact on IgG glycome composition. In fact, the increased production of proinflammatory IgGs in IBD is a reflection of the increased number of plasma cells in the intestinal lamina propria (58–60), which can be activated in a T-cell–dependent manner. The glycans profile of the effector region of IgG (Fc domain) dictates its anti- or proinflammatory phenotype (22) through regulating the binding affinity to Fcγ receptors. Our results demonstrated for the first time that genetic variants of MGAT5 (particularly rs3814022 and rs4953911) are correlated with alterations in plasma IgG glycome composition. A general increase of agalactosylation of IgG Fc was observed, which match with a proinflammatory glycoprofile of IgGs. In fact, the loss of terminal galactose (agalactosylation) on IgG was shown to enhance antibody-dependent phagocytosis (ADCC) (61) and has been seen in the circulation in patients with systemic lupus erythematosus (57, 58) and in patients suffering from rheumatoid arthritis years preceding disease onset (23). Moreover, this IgG agalactosylation profile was found to be different when comparing patients with IBD and healthy controls being associated with clinical severity of the disease (24–27,54).
Taken together, our results revealed a novel genetic cause that explains the changes in protein glycosylation on key players in IBD immunopathogenesis, such as T cells and plasma IgGs. MGAT5 appears to be a common genetic factor that simultaneously regulates the function and activity of both humoral and adaptive components involved in IBD development through glycosylation modifications. We can here speculate that the role of MGAT5 genetic variants on the regulation of IgG glycosylation profile might occur through a T-cell–dependent mechanism that needs to be further clarified. Under inflammatory conditions, T-cell hyperactivation (triggered by a deficiency on MGAT5-mediated branched glycosylation) may instruct B cells to produce proinflammatory agalactosylated IgGs. In addition, we cannot exclude the possible effect of therapy in glycosylation modifications associated with an active disease, a topic that needs to be clarified.
These functional MGAT5 genetic variants exhibit a tendency in the association with UC clinical outcomes such as the likelihood of developing a severe/complicated disease, mainly because of the association with the need of biologics. In fact, the associations found between SNPs and the therapeutic outcomes are in the same trend in both discovery and validation cohorts. Moreover, the functional effects of the MGAT5 SNPs, associated with a hyperreactive T-cell phenotype (related with low levels of MGAT5 mRNA) and with a proinflammatory IgG glycome, biologically reinforce the relevance of these SNPs in UC clinical outcomes. Those associations need to be further validated in a larger and prospective cohort. In addition, MGAT5 genetic variants mainly in regulatory regions appear to be able to cluster and to discriminate patients according to their disease severity. These results, despite supportive of the influence of MGAT5 in UC disease course, outcomes and response to therapy, need further validation in a bigger sample size and in other cohorts.
In summary, our study identified a putative genetic cause for changes in protein glycosylation associated with the immunopathogenesis of IBD (28). MGAT5 genetic variants were revealed to be correlated with pathologic changes in the glycosylation profile of T cells and plasma IgGs, potentially associated with the development of a severe/complicated UC disease.
CONFLICTS OF INTEREST
Guarantor of the article: Salomé S. Pinho, PhD.
Specific author contributions: M.S.P.: SNP genotyping, NGS experiment and molecular analysis, data analysis and interpretation, and manuscript writing; C.D.: statistical analysis and data interpretation; T.A.C.: SNP genotyping; J.L.C.: conducted NGS experience and collected the data; I.C.: provided clinical data and revised critically the study; M.N., J.K., and J.S.: IgG glycome analysis; N.C.-N.: NGS analysis; J.C.M.: study discussion; R.M.-P., F.M., S.V., and P.L.: patient recruitment, clinical selection of samples, and clinical data collection; G.L.: intellectual content related with IgG glycome; S.S.P.: designed and conducted the study and critically revised the manuscript.
Financial support: Financial support from Portugal: Institute of Molecular Pathology and Immunology of University of Porto (IPATIMUP) integrates the i3S research unit, which is partially supported by the Portuguese Foundation for Science and Technology (FCT). This article is a result of the project NORTE-01-0145-FEDER-000029, supported by the Norte Portugal Regional Programme (NORTE 2020) under the PORTUGAL 2020 Partnership Agreement through the European Regional Development Fund (ERDF). This work was also funded by FEDER—Fundo Europeu de Desenvolvimento Regional funds through the COMPETE 2020—Operacional Programme for Competitiveness and Internationalisation (POCI), Portugal 2020, and by Portuguese funds through FCT—Fundação para a Ciência e a Tecnologia/Ministério da Ciência, Tecnologia e Inovação in the framework of the projects (POCI-01/0145-FEDER-016601; PTDC/DTP-PIC/0560/2014; POCI-01-0145-FEDER-028772). S.S.P. also acknowledges the European Crohn's and Colitis Organization (ECCO) for ECCO Grant; the Broad Medical Research Program at the Crohn's and Colitis Foundation of America, and the Portuguese Group of Study in IBD (GEDII) for funding. S.S.P. also acknowledges the US Department of Defense, US Army Medical Research Acquisition Activity, FY18 Peer Reviewed Medical Research Program Investigator-Initiated Research Award (award number W81XWH1920053). M.S.P. (SFRH/BD/110148/2015) acknowledges FCT for funding.
Potential competing interests: None to report.
Study Highlights.
WHAT IS KNOWN
✓ MGAT5 glycogene and its encoded branched N-glycan structure regulate the immunopathogenesis of IBD, in which low levels of MGAT5-mediated branching N-glycans on intestinal T cells result in a hyperimmune response and increased disease severity.
WHAT IS NEW HERE
✓ MGAT5 genetic variants have a functional impact in the modulation of T cells glycosylation and plasma IgG glycome composition in patients with ulcerative colitis and show association with disease prognosis.
TRANSLATIONAL IMPACT
✓ Identification of a genetic risk locus in patients with ulcerative colitis, which is associated with immunopathogenesis of the disease and with clinical prognosis.
Footnotes
SUPPLEMENTARY MATERIAL accompanies this paper at: http://links.lww.com/CTG/A267, http://links.lww.com/CTG/A268, http://links.lww.com/CTG/A269, http://links.lww.com/CTG/A270, http://links.lww.com/CTG/A271, http://links.lww.com/CTG/A272, http://links.lww.com/CTG/A273, http://links.lww.com/CTG/A274, http://links.lww.com/CTG/A275, http://links.lww.com/CTG/A276, http://links.lww.com/CTG/A277, http://links.lww.com/CTG/A278
REFERENCES
- 1.Kaplan GG. The global burden of IBD: From 2015 to 2025. Nat Rev Gastroenterol Hepatol 2015;12(12):720–7. [DOI] [PubMed] [Google Scholar]
- 2.Mirkov MU, Verstockt B, Cleynen I. Genetics of inflammatory bowel disease: Beyond NOD2. Lancet Gastroenterol Hepatol 2017;2(3):224–34. [DOI] [PubMed] [Google Scholar]
- 3.Kopylov U, Boucher G, Waterman M, et al. Genetic predictors of benign course of ulcerative colitis-A North American inflammatory bowel disease genetics consortium study. Inflamm Bowel Dis 2016;22(10):2311–6. [DOI] [PMC free article] [PubMed] [Google Scholar]
- 4.Ananthakrishnan AN, Huang H, Nguyen DD, et al. Differential effect of genetic burden on disease phenotypes in crohn's disease and ulcerative colitis: Analysis of a North American cohort. Am J Gastroenterol 2014;109(3):395–400. [DOI] [PMC free article] [PubMed] [Google Scholar]
- 5.Cleynen I, Boucher G, Jostins L, et al. Inherited determinants of crohn's disease and ulcerative colitis phenotypes: A genetic association study. Lancet 2016;387(10014):156–67. [DOI] [PMC free article] [PubMed] [Google Scholar]
- 6.Yarur AJ, Strobel SG, Deshpande AR, et al. Predictors of aggressive inflammatory bowel disease. Gastroenterol Hepatol (NY) 2011;7(10):652–9. [PMC free article] [PubMed] [Google Scholar]
- 7.Kolho KL, Paakkanen R, Lepisto A, et al. Novel associations between major histocompatibility complex and pediatric-onset inflammatory bowel disease. J Pediatr Gastroenterol Nutr 2016;62(4):567–72. [DOI] [PubMed] [Google Scholar]
- 8.Haritunians T, Taylor KD, Targan SR, et al. Genetic predictors of medically refractory ulcerative colitis. Inflamm Bowel Dis 2010;16(11):1830–40. [DOI] [PMC free article] [PubMed] [Google Scholar]
- 9.Potocnik U, Ferkolj I, Glavac D, et al. Polymorphisms in multidrug resistance 1 (MDR1) gene are associated with refractory Crohn disease and ulcerative colitis. Genes Immun 2004;5(7):530–9. [DOI] [PubMed] [Google Scholar]
- 10.Jostins L, Ripke S, Weersma RK, et al. Host-microbe interactions have shaped the genetic architecture of inflammatory bowel disease. Nature 2012;491(7422):119–24. [DOI] [PMC free article] [PubMed] [Google Scholar]
- 11.Franke A, McGovern DP, Barrett JC, et al. Genome-wide meta-analysis increases to 71 the number of confirmed Crohn's disease susceptibility loci. Nat Genet 2010;42(12):1118–25. [DOI] [PMC free article] [PubMed] [Google Scholar]
- 12.Anderson CA, Boucher G, Lees CW, et al. Meta-analysis identifies 29 additional ulcerative colitis risk loci, increasing the number of confirmed associations to 47. Nat Genet 2011;43(3):246–52. [DOI] [PMC free article] [PubMed] [Google Scholar]
- 13.Elgar G, Vavouri T. Tuning in to the signals: Noncoding sequence conservation in vertebrate genomes. Trends Genet 2008;24(7):344–52. [DOI] [PubMed] [Google Scholar]
- 14.Goyette P, Boucher G, Mallon D, et al. High-density mapping of the MHC identifies a shared role for HLA-DRB1*01:03 in inflammatory bowel diseases and heterozygous advantage in ulcerative colitis. Nat Genet 2015;47(2):172–9. [DOI] [PMC free article] [PubMed] [Google Scholar]
- 15.Mokry M, Middendorp S, Wiegerinck CL, et al. Many inflammatory bowel disease risk loci include regions that regulate gene expression in immune cells and the intestinal epithelium. Gastroenterology 2014;146(4):1040–7. [DOI] [PubMed] [Google Scholar]
- 16.Boyd M, Thodberg M, Vitezic M, et al. Characterization of the enhancer and promoter landscape of inflammatory bowel disease from human colon biopsies. Nat Commun 2018;9(1):1661. [DOI] [PMC free article] [PubMed] [Google Scholar]
- 17.Pereira MS, Alves I, Vicente M, et al. Glycans as key checkpoints of T cell activity and function. Front Immunol 2018;9:2754. [DOI] [PMC free article] [PubMed] [Google Scholar]
- 18.Marth JD, Grewal PK. Mammalian glycosylation in immunity. Nat Rev Immunol 2008;8(11):874–87. [DOI] [PMC free article] [PubMed] [Google Scholar]
- 19.Dias AM, Pereira MS, Padrao NA, et al. Glycans as critical regulators of gut immunity in homeostasis and disease. Cell Immunol 2018;333:9–18. [DOI] [PubMed] [Google Scholar]
- 20.Pinho SS, Reis CA. Glycosylation in cancer: Mechanisms and clinical implications. Nat Rev Cancer 2015;15(9):540–55. [DOI] [PubMed] [Google Scholar]
- 21.Raju TS. Terminal sugars of Fc glycans influence antibody effector functions of IgGs. Curr Opin Immunol 2008;20(4):471–8. [DOI] [PubMed] [Google Scholar]
- 22.Biermann MH, Griffante G, Podolska MJ, et al. Sweet but dangerous—the role of immunoglobulin G glycosylation in autoimmunity and inflammation. Lupus 2016;25(8):934–42. [DOI] [PubMed] [Google Scholar]
- 23.Ercan A, Cui J, Chatterton DE, et al. Aberrant IgG galactosylation precedes disease onset, correlates with disease activity, and is prevalent in autoantibodies in rheumatoid arthritis. Arthritis Rheum 2010;62(8):2239–48. [DOI] [PMC free article] [PubMed] [Google Scholar]
- 24.Simurina M, de Haan N, Vuckovic F, et al. Glycosylation of immunoglobulin G associates with clinical features of inflammatory bowel diseases. Gastroenterology 2018;154(5):1320–33 e1310. [DOI] [PMC free article] [PubMed] [Google Scholar]
- 25.Shinzaki S, Kuroki E, Iijima H, et al. Lectin-based immunoassay for aberrant IgG glycosylation as the biomarker for Crohn's disease. Inflamm Bowel Dis 2013;19(2):321–31. [DOI] [PubMed] [Google Scholar]
- 26.Miyoshi E, Shinzaki S, Fujii H, et al. Role of aberrant IgG glycosylation in the pathogenesis of inflammatory bowel disease. Proteomics Clin Appl 2016;10(4):384–90. [DOI] [PubMed] [Google Scholar]
- 27.Trbojevic Akmacic I, Ventham NT, Theodoratou E, et al. Inflammatory bowel disease associates with proinflammatory potential of the immunoglobulin G glycome. Inflamm Bowel Dis 2015;21(6):1237–47. [DOI] [PMC free article] [PubMed] [Google Scholar]
- 28.Verhelst X, Dias AM, Colombel JF, et al. Protein glycosylation as a diagnostic and prognostic marker of chronic inflammatory gastrointestinal and liver diseases. Gastroenterology 2019;158(6):95–110. [DOI] [PubMed] [Google Scholar]
- 29.Grigorian A, Demetriou M. Mgat5 deficiency in T cells and experimental autoimmune encephalomyelitis. ISRN Neurol 2011;2011:374314. [DOI] [PMC free article] [PubMed] [Google Scholar]
- 30.Lee SU, Grigorian A, Pawling J, et al. N-glycan processing deficiency promotes spontaneous inflammatory demyelination and neurodegeneration. J Biol Chem 2007;282(46):33725–34. [DOI] [PubMed] [Google Scholar]
- 31.Mkhikian H, Grigorian A, Li CF, et al. Genetics and the environment converge to dysregulate N-glycosylation in multiple sclerosis. Nat Commun 2011;2:334. [DOI] [PMC free article] [PubMed] [Google Scholar]
- 32.Grigorian A, Lee SU, Tian W, et al. Control of T cell-mediated autoimmunity by metabolite flux to N-glycan biosynthesis. J Biol Chem 2007;282(27):20027–35. [DOI] [PubMed] [Google Scholar]
- 33.Dias AM, Dourado J, Lago P, et al. Dysregulation of T cell receptor N-glycosylation: A molecular mechanism involved in ulcerative colitis. Hum Mol Genet 2014;23(9):2416–27. [DOI] [PubMed] [Google Scholar]
- 34.Demetriou M, Granovsky M, Quaggin S, et al. Negative regulation of T-cell activation and autoimmunity by Mgat5 N-glycosylation. Nature 2001;409(6821):733–9. [DOI] [PubMed] [Google Scholar]
- 35.Morgan R, Gao G, Pawling J, et al. N-acetylglucosaminyltransferase V (Mgat5)-mediated N-glycosylation negatively regulates Th1 cytokine production by T cells. J Immunol 2004;173(12):7200–8. [DOI] [PubMed] [Google Scholar]
- 36.Dias AM, Correia A, Pereira MS, et al. Metabolic control of T cell immune response through glycans in inflammatory bowel disease. Proc Natl Acad Sci USA 2018;115(20):E4651–E4660. [DOI] [PMC free article] [PubMed] [Google Scholar]
- 37.Pereira MS, Maia L, Azevedo LF, et al. A [Glyco]biomarker that predicts failure to standard therapy in ulcerative colitis patients. J Crohns Colitis 2019;13(1):39–49. [DOI] [PubMed] [Google Scholar]
- 38.Brynedal B, Wojcik J, Esposito F, et al. MGAT5 alters the severity of multiple sclerosis. J Neuroimmunol 2010;220(1-2):120–4. [DOI] [PubMed] [Google Scholar]
- 39.Li CF, Zhou RW, Mkhikian H, et al. Hypomorphic MGAT5 polymorphisms promote multiple sclerosis cooperatively with MGAT1 and interleukin-2 and 7 receptor variants. J Neuroimmunol 2013;256(1-2):71–6. [DOI] [PMC free article] [PubMed] [Google Scholar]
- 40.Huffman JE, Knezevic A, Vitart V, et al. Polymorphisms in B3GAT1, SLC9A9 and MGAT5 are associated with variation within the human plasma N-glycome of 3533 European adults. Hum Mol Genet 2011;20(24):5000–11. [DOI] [PubMed] [Google Scholar]
- 41.Esposito F, Wojcik J, Rodegher M, et al. MGAT5 and disease severity in progressive multiple sclerosis. J Neuroimmunol 2011;230(1–2):143–7. [DOI] [PubMed] [Google Scholar]
- 42.Pucic M, Knezevic A, Vidic J, et al. High throughput isolation and glycosylation analysis of IgG-variability and heritability of the IgG glycome in three isolated human populations. Mol Cell Proteomics 2011;10(10):M111.010090. [DOI] [PMC free article] [PubMed] [Google Scholar]
- 43.Keser T, Vuckovic F, Barrios C, et al. Effects of statins on the immunoglobulin G glycome. Biochim Biophys Acta Gen Subj 2017;1861(5 Pt A):1152–8. [DOI] [PMC free article] [PubMed] [Google Scholar]
- 44.Pillai N, Lupatsch JE, Dusheiko M, et al. Evaluating the cost-effectiveness of early compared to late or no biologic treatment to manage Crohn's disease using real world data. J Crohns Colitis 2019. [DOI] [PubMed] [Google Scholar]
- 45.Ben-Horin S, Zhao Y, Guo J, et al. Efficacy of biological drugs in short-duration versus long-duration inflammatory bowel disease: A protocol for a systematic review and an individual-patient level meta-analysis of randomised controlled trials. BMJ Open 2019;9(1):e024222. [DOI] [PMC free article] [PubMed] [Google Scholar]
- 46.Faubion WA, Jr, Loftus EV, Jr, Harmsen WS, et al. The natural history of corticosteroid therapy for inflammatory bowel disease: A population-based study. Gastroenterology 2001;121(2):255–60. [DOI] [PubMed] [Google Scholar]
- 47.Bianchi Porro G, Cassinotti A, Ferrara E, et al. Review article: The management of steroid dependency in ulcerative colitis. Aliment Pharmacol Ther 2007;26(6):779–94. [DOI] [PubMed] [Google Scholar]
- 48.Ko JH, Miyoshi E, Noda K, et al. Regulation of the GnT-V promoter by transcription factor Ets-1 in various cancer cell lines. J Biol Chem 1999;274(33):22941–8. [DOI] [PubMed] [Google Scholar]
- 49.Benjamini Y, Hochberg Y. Controlling the false discovery rate—a practical and powerful approach to multiple testing. J R Stat Soc B 1995;57(1):289–300. [Google Scholar]
- 50.Dekkers G, Rispens T, Vidarsson G. Novel concepts of altered immunoglobulin G galactosylation in autoimmune diseases. Front Immunol 2018;9:553. [DOI] [PMC free article] [PubMed] [Google Scholar]
- 51.Magro F, Dias CC, Portela F, et al. Development and validation of risk matrices concerning ulcerative colitis outcomes-Bayesian network analysis. J Crohns Colitis 2019;13(4):401–9. [DOI] [PubMed] [Google Scholar]
- 52.Ananthakrishnan AN, Xavier RJ. How does genotype influence disease phenotype in inflammatory bowel disease? Inflamm Bowel Dis 2013;19(9):2021–30. [DOI] [PMC free article] [PubMed] [Google Scholar]
- 53.Rudd PM, Elliott T, Cresswell P, et al. Glycosylation and the immune system. Science 2001;291(5512):2370–6. [DOI] [PubMed] [Google Scholar]
- 54.Clerc F, Novokmet M, Dotz V, et al. Plasma N-glycan signatures are associated with features of inflammatory bowel diseases. Gastroenterology 2018;155(3):829–43. [DOI] [PubMed] [Google Scholar]
- 55.Maurano MT, Humbert R, Rynes E, et al. Systematic localization of common disease-associated variation in regulatory DNA. Science 2012;337(6099):1190–5. [DOI] [PMC free article] [PubMed] [Google Scholar]
- 56.Schaub MA, Boyle AP, Kundaje A, et al. Linking disease associations with regulatory information in the human genome. Genome Res 2012;22(9):1748–59. [DOI] [PMC free article] [PubMed] [Google Scholar]
- 57.Momozawa Y, Dmitrieva J, Theatre E, et al. IBD risk loci are enriched in multigenic regulatory modules encompassing putative causative genes. Nat Commun 2018;9(1):2427. [DOI] [PMC free article] [PubMed] [Google Scholar]
- 58.Uzzan M, Colombel JF, Cerutti A, et al. B cell-activating factor (BAFF)-Targeted B cell therapies in inflammatory bowel diseases. Dig Dis Sci 2016;61(12):3407–24. [DOI] [PubMed] [Google Scholar]
- 59.Zhou G, Song Y, Yang W, et al. ASCA, ANCA, ALCA and many more: Are they useful in the diagnosis of inflammatory bowel disease? Dig Dis 2016;34(1-2):90–7. [DOI] [PubMed] [Google Scholar]
- 60.Magro F, Langner C, Driessen A, et al. European consensus on the histopathology of inflammatory bowel disease. J Crohns Colitis 2013;7(10):827–51. [DOI] [PubMed] [Google Scholar]
- 61.Nakajima S, Iijima H, Shinzaki S, et al. Functional analysis of agalactosyl IgG in inflammatory bowel disease patients. Inflamm Bowel Dis 2011;17(4):927–36. [DOI] [PubMed] [Google Scholar]