

Abstract
We built a low-cost and hand-held device to image and analyze microfluidic droplets mainly for educational/teaching purposes in laboratory settings of universities. The device was assembled based on a Raspberry Pi with a camera attached on the back and an LCD screen on the top. We evaluated the performance of this device to capture images and videos to visualize high-throughput droplet generation in a microfluidic device. The qualities of imaging resolution and speed were sufficient for us to perform subsequent droplet analysis quantitatively through automatic image possessing. Droplet characteristics including droplet size, volume, and dispersity, as well as droplet intensity, have been measured, showing the potential of this device to analyze droplet-based assays. Most importantly, in addition to learning the knowledge and principles from classroom lectures, students can thus gain practice of using an advanced, state-of-the-art technology in a laboratory course. It will also open up opportunities to train students with skills of interdisciplinary thinking and learning.
Keywords: Upper-Division Undergraduate, Graduate Education/Research, Analytical Chemistry, Interdisciplinary/Multidisciplinary, Hands-On Learning/Manipulatives, Microscale Lab, Laboratory Equipment/Apparatus
Graphical abstract
INTRODUCTION
Droplet microfluidics has attracted an increasing amount of interests in recent years in chemical, biological, and medical analyses.1,2 It offers high throughput and high resolution for the analyses at relatively low sample and reagent consumption rates and low cost.3,4 Thus, it has been engaged in a broad range of applications covering from academia to industry for research studies and making commercialized products. Most pronounced and revolutionary applications include but are not limited to using droplets for drug screening,5 single-cell/ molecule analysis,6,7 digital PCR,8 DNA/RNA seq,9,10 and creating artificial synthetic cells.11 Despite the great chances for undergraduate students to be introduced to droplet micro-fluidics from lectures, currently implementing droplet micro-fluidic experiments in a laboratory course is unfortunately limited largely by the lack of low-cost visualization and detection methods for tiny droplets.
Droplets are oftentimes generated at a relatively high throughput around tens to thousands of droplets per second in microchannels of 100 μm or under.12,13 The size of droplets is on a μm scale, and the volume is in the pL to nL range. It is almost impossible to visualize droplet generation without the aids of a pricey high-speed camera and a microscope. Both could cost at least a few grand for building only one single set of the instrument. In addition to coupling with a high-throughput, high-resolution, and high-sensitivity detector for droplet analysis, it becomes unrealistic for a college laboratory to invest multiple sets of the equipment for groups of students in a laboratory classroom.
Recently, incorporating portable microcomputers and sensors in chem-and bioanalysis has been proven to be an efficient alternative for running low-budget projects in research-and teaching-centered laboratories.14–20 Herein, we developed a low-cost Raspberry-Pi-based imager and analyzer for droplet microfluidic experiments. It allows both viewing microfluidic droplet generation and performing basic droplet analysis on a single, portable, and hand-held device. It did not rely upon any bulky and expensive instrument. Thus, it would be practical to be multiplied for the purposes of research or education in the college laboratory settings. With the experiments demonstrated below, the primary pedagogical objectives expected to be achieved in this work are listed as follows: (i) The students should learn the concept and the practice of a cutting-edge high-throughput analysis technology, i.e., droplet microfluidics, to perform image-based chemical analysis. (ii) The students will take food dyes and sugars as sample analytes in the experiments to learn Beer’s law and differentiate the two most commonly used sugars (i.e., glucose and sucrose) on dining tables. In addition to these two major objectives, the students can also practice two good examples of the application of chemistry in the real world. Furthermore, they should be able to gain a sense of interdisciplinary studies and learn to bridge the knowledge of chemistry, mechanical engineering, and electrical and computer science to solve problems in their participation of future projects and experiments.
EXPERIMENTAL SECTION
Material and Methods
We used 1% 008-FluoroSurfactant in HFE7500 (Ran Biotechnologies, Inc., Beverly, MA) as the oil phase. Preparations of aqueous solutions should follow the instructor’s and student’s notes in the Supporting Information. The oil and aqueous fluids were driven by a dual-channel syringe pump (78–0388, KD Scientific, Holliston, MA) using Microbore PTFE tubings (0.3 mm i.d., 0.76 mm o.d., Cole Parmer, Vernon Hills, IL) as connections of syringes (1 mL, BD, Franklin Lakes, NJ) to a microfluidic device. The device was made with 40 μm deep channels by using traditional photolithography and soft lithography methods.21 The flow rate for oil infusion was between 2 and 8 μL/min and for water ranged from 1 to 9 μL/min for the tests performed in this study. After the droplet generation was established, the camera was either hand-held from isometric view for taking videos or from right on top of the device for taking images.
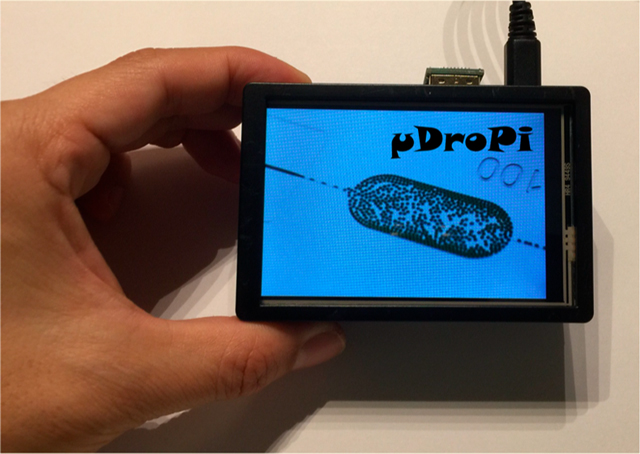
The main components used to assemble a device for droplet imaging and analysis are shown in Figure 1A: a Raspberry Pi(3, Model B+) for running the programs and data storage; a Raspberry Pi camera (Module V2) for taking images with a coupled macrolens (20×, AUKEY) for zoom-in viewing of inside microchannels; and an LCD (UCTRONICS 3.5 in. touch screen) for displaying live and captured images and videos. Cables and case are not shown. Figure 1B shows an assembly of the device with a front view of the LCD screen displaying an image of droplet generation in a microfluidic device and the attached camera and lens at the back (inset picture). The price of each component is listed in Table S1, and the overall cost is about 100 USD.
Figure 1.

Raspberry-Pi-based microfluidic droplet imager and analyzer. (A) Components of the device. (B) Front and back views of an assembled device. (C) Picture captured by the device showing its two main functions: (I) view droplet generation; (II) perform droplet analysis.
Image-Based Droplet Analysis
An image-based analysis method could image and analyze droplets statically, offering extreme simplicity in both concept and application in practice. Here, we compiled an automatic droplet analysis script based on a Hough circle transform algorithm, which could detect and segment all the circular droplets in an image, measure the droplet properties (e.g., size and intensity), and plot them into figures (see Figures S1 and S2). We had also fabricated a 2 × 4.5 mm2 2D chamber downstream of the microfluidic device, allowing for holding and capturing a significantly greater number of droplets than in a 1D channel in a single view of image acquisition. By combining these two, performing high-throughput analysis of thousands of droplets took only a few minutes. Thus, the students can learn to use droplet and image analysis methods to complete a couple sets of chemical analyses in one laboratory class session.
RESULTS AND DISCUSSION
The Raspberry Pi camera has the capacity to capture a few images at an interval of 5 ms. However, to better visualize and demonstrate the generation of individual droplets without any lost frames, we chose to take videos at a lower frame rate of 120 fps for 10 s using the following command line: raspivid -rot 270 –w 640 –h 480 –fps 120 –t 10000 –pts * .txt –o *.h2 64, where “raspivid” is the command for Raspberry Pi to take videos, with its following parameters of “–rot” to set image rotation, “–w” and “– h” to set image resolution, “–fps” to set image frame rate (fps stands for frames per second), “–t” to set the capture time (in ms), “–pts” to output time codes for each captured image in the video, and “–o” to output a video file (“*” represents a filename).22
Table S2 lists the time codes of the captured images in the first 0.5 s of a typical 10 s video. The time interval between frames is about 8.3 ms. An example video (Movie S1, recommended to be viewed in VLC Media Player) that was slowed down 20× clearly demonstrates individual droplets pinching off from the flow-focusing intersection. This will present to students a visual sense of droplet generation in a microfluidic device. With an on-device LCD, the raw video can be directly played using the command of omxplayer or converted to individual images with the ffmpeg command for views at desired play speeds.
With a microfluidic device at fixed dimensions, droplets size can still be tuned with varied flow rates, showing the flexibility of droplet microfluidics to generate microvessels in various volumes. In Figure 2, at a fixed oil rate, we changed the flow rate of the dye. Higher flow rates of the dye induce higher water-to-oil fractions (1:4, 3:4, 5:4, respectively, in Figure 2A– C). Pictures were taken with focusing on the viewing chamber at different conditions using the command raspistill –rot 270 –o * .jpg, which could output an image at the default resolution of 3280 × 2464 by the camera. Two phenomena could be clearly observed from this set of pictures (Figure 2A–C): (i) The size of the droplets increases with the flow rates of the dye. (ii) The transparent area of oil is shrinking while the black droplets are becoming more compact in the chamber. In addition to visualize this experiment by eye, we used an automatic droplet analysis script to analyze the droplets and obtained the measurements of droplet number, diameter, and intensity with these captured pictures, offering quantitative analysis for droplet microfluidic experiments.
Figure 2.

Droplet characteristics analysis. (A-C) Images captured by the device showing droplets generated at different flow rates of the dye: O6W1.5, O6W4.5, and O6W7.5 represent the oil flow rate fixed at 6 μL/min, while water flow rates varied from 1.5, 4.5, to 7.5 μL/ min. (D) Histogram of the three groups of droplets shown in parts A–C. The enlarged view from a portion of droplets in part C demonstrates the segmentation (blue circle) of droplets by the automatic droplet analysis script (see also Figure S1). N, the number of droplets; Mean, the averaged value of the droplet diameter (μm); SD, standard deviation. (E) Side-by-side view of the sub-nL-scale droplets in volume plot and images. Each circle represents one droplet. Scale bar: 200 μm. The color codes in parts D and E are used to demonstrate the analysis results obtained from the images of parts A, blue; B, red; and C, yellow; respectively: the horizontal spreading of the circles on the x-axis does not mean that flow rate changes, but is present only for better viewing of the distribution of droplet volumes.
First, the diameters of droplets were plotted in histograms showing high monodispersity in the size distribution of the droplets generated at each different flow rate. In each chamber, there were about 500–700 total droplets detected according to the flow rates they were produced. From Figure 2D we could see that, at different flow rates of the dye, the diameter of droplets (d) increases from an average (mean) of 78.3 to 94.1 to 107.6 μm with standard deviations (SD) of 5.2, 4.5, and 3.8 μm, respectively. The dispersities of these droplets could be estimated by the polydispersity index (PDI),23 which is defined as SD2/mean2. Values less than 0.04 indicate that droplets are monodisperse. At a channel depth of 40 μm (h), where h < d, the droplet volume (V) could be approximately calculated via the equation . The results (Figure 2E) show that three groups of droplets are distinguishable by their individual volumes with mean values of 193.4, 279.1, and 364.5 pL, respectively; thus, subnanoliter droplets could be generated, and their sizes could be tuned by changing the flow rate. This experiment could be the first one for which students use droplets as analytical vessels. Therefore, the significance of quantifying droplet characteristics should be taught to students for their better understanding that the droplet size and dispersity are strongly correlated to reaction volume, concentration, and the uniformity of reaction replicas in chemistry. Additionally, making a chamber of several hundreds of droplets took only about 10–30 s; therefore, after completing this set of measurements, the students should notice that they would use very tiny volumes to achieve high-throughput chemical analysis in the later sections.
We further explored the potential of using this device to capture and analyze images for droplet-based assays. As a proof of concept, we measured the gray scale intensities of droplets in three different dilutions of a black dye. Images in Figure 3A–C show that the color of droplets becomes darker as the concentration increased from a 40-fold to a 10-fold dilution. The gray scale intensity of each droplet was measured by averaging all pixel intensities inside the droplet area segmented by the script. At each concentration of the dye, 496, 535, and 597 droplets were detected and analyzed. With their intensity plotted versus concentration in three groups as the results show in Figure 3D, it suggests that the imaging and analysis tool can be used to demonstrate Beer’s law as the gray scale intensities are inversely proportional to the concentrations of the black dye in a linear range (y = –720.36x + 143.32, R2 = 0.9906). The total volume of all the droplets for this specific set of measurements was less than 1 μL. Although the dye we used here was inexpensive, it would be straightforward to explain to students that making hundreds of parallels in a high-throughput and low-consumption manner would be extremely valuable when dealing with samples that are either precious or volume-limited in modern chemical, biological, and medical analysis. In addition, the food dyes are FDA-regulated substances that are consumed along with foods and beverages in everyday life and can unintentionally exceed the recommended acceptable daily intake if one were not aware. Therefore, measuring a food dye sample obtainable on grocery store shelves can make connections between chemistry and the real world, and educate students about the toxicity and potential health risks of these chemicals consumed with their diets.
Figure 3.
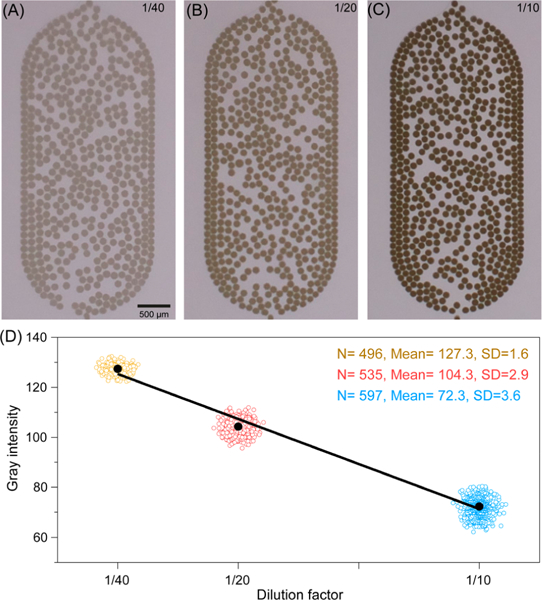
Droplet intensity analysis. (A–C) Images captured by the device showing three concentrations of droplets: ¼0, ½0, and 1/ 10 dilution of the original black dye. (D) Plot of droplet intensities vs dye concentrations with a linear regression curve (black solid line). The color circles represent droplets, and the black dots represent the averaged values of the intensity (Mean). The color codes of yellow, red, and blue are used to demonstrate the analytical results of parts A–C: the horizontal spreading of the circles on the x-axis does not mean that concentration changes, but is present only for better viewing of the distribution of droplet intensities.
We then moved forward to use this device and method to test reducing and nonreducing sugars. Sugar belongs to another type of chemical the students could have been dealing with in their everyday life. In this experiment section, we tested and differentiated two most commonly used table sugars: glucose and sucrose with Fehling reagents. Reducing sugar, glucose, contains an aldehyde functional group that can be oxidized by Cu2+, presenting a positive result to produce Cu2O precipitates (Figure 4A), while nonreducing sugar, sucrose, without such functional group presents a negative result with droplets remaining clear (Figure 4B). The experiment was carried out by mixing Fehling reagent A and B and sugar solution at a volume ratio of 2:2:1 (see the for details), which immediately fragmented into microdroplets and then were incubated on a hot plate at 85 °C for 1 min. The reaction would not be initiated until heated up, and the precipitates were stable after the completion of the reaction, thus leaving plenty of time to make the droplets and take the images. The students should be able to distinguish these two types of sugars through the Fehling reaction simply by viewing the precipitants in the pictures taken by the Raspberry Pi on the LCD screen, which otherwise would hardly be seen with unaided eyes in the tiny droplets. The images of droplets could also be analyzed by the script to obtain gray scale values of individual droplets. Figure 4C shows the average intensities of glucose droplets versus sucrose droplets, demonstrating the differentiation of these two sugars by the automatic droplet analysis script. Students can further explore the chemical structures of sugars, and should be able to learn by analogy and predict the reducibility of all the other kinds of sugars.
Figure 4.

Differentiation of reducing and nonreducing carbohydrates. (A) Brick-red Cu2O precipitates in droplets of glucose. (B) Droplets remain clear with sucrose. (C) Droplet intensity analysis of parts A and B showing the mean intensity and SD of the droplets containing either glucose or sucrose. P < 0.0001 in a t test suggests that the two groups of droplets are significantly different.
CONCLUSION
In this work, we present a hand-held device to visualize and analyze droplet microfluidic experiments. This device enables observations of high-throughput droplet generation in microchannels and allows automatic droplet analysis for droplet-based assays. The device costs only a hundred dollars and would be ideal for educational/teaching purposes in demonstrating an advanced modern technology in performing high-throughput analysis. Since droplet microfluidics is interdisciplinary, the experiment could be introduced to the lab courses in biophysics, chemistry, and engineering departments. Each student group can have their own device to conduct the experiment, possess the acquired data, and generate lab reports. After the lab experiments demonstrated above, the students should have learned to create micro-droplets for chemical analysis of food coloring and sugars with a Raspberry-Pi-based imager and analyzer. The analytes themselves should be interesting to the students because they could make strong connections between chemistry and the real world. The Raspberry Pi imaging device and the droplet analysis method could also be unique to the students compared to using other traditional instrument and methods. Future improvement for the implementation of this device in college education could be the replacement of the PDMS-based device with 3D-printed devices, which will be easier to make and replicate. Further, beyond this, the device could also benefit various entry-level and low-budget research projects, which were previously hindered by the lack of a costly high-speed camera, but have to rely upon using droplet microfluidic technology, and/or a fast imaging and analysis technique for certain critical investigations.
Supplementary Material
droplet generation at flow rate of 2 and 1 μL/ min for oil and water (AVI)
ACKNOWLEDGMENTS
This work was supported by the National Science Foundation (Early CAREER Grant 1553031), the National Science Foundation (MCB 1817909), the National Institutes of Health (MIRA GM119688), and a Sloan Research Fellowship. We thank the Xuewei Wang and Mark Meyerhoff Lab for free CuSO4 5H2O and KNaC4H4O6−4H2O. We appreciate the assistance of Alexander Gaenko, Marcio Mourao and Manish Verma from “Consulting for Statistics, Computing & Analytics Research (CSCAR)” at the Univeristy of Michigan for code deployment.
Footnotes
ASSOCIATED CONTENT
Supporting Information
The Supporting Information is available on the ACS Publications website at DOI: 10.1021/acs.jchemed.8b00975.
Price list of components and time codes of image captures; segmentation of droplets and direct output of the analysis results on a Raspberry Pi; instructor’s notes; and notes for students (PDF)
Notes
The authors declare no competing financial interest.
REFERENCES
- (1).Zhu Y; Fang Q Analytical Detection Techniques for Droplet Microfluidics–A Review. Anal. Chim. Acta 2013, 787, 24–35. [DOI] [PubMed] [Google Scholar]
- (2).Theberge AB; Courtois F; Schaerli Y; Fischlechner M; Abell C; Hollfelder F; Huck WTS Microdroplets in Microfluidics: An Evolving Platform for Discoveries in Chemistry and Biology. Angew. Chem., Int. Ed. 2010, 49 (34), 5846–5868. [DOI] [PubMed] [Google Scholar]
- (3).Sun M; Fang Q High-Throughput Sample Introduction for Droplet-Based Screening with an on-Chip Integrated Sampling Probe and Slotted-Vial Array. Lab Chip 2010, 10 (21), 2864–2868. [DOI] [PubMed] [Google Scholar]
- (4).Sun M; Vanapalli SA Generation of Chemical Concentration Gradients in Mobile Droplet Arrays via Fragmentation of Long Immiscible Diluting Plugs. Anal. Chem. 2013, 85 (4), 2044–2048. [DOI] [PubMed] [Google Scholar]
- (5).Miller OJ; Harrak AE; Mangeat T; Baret JC; Frenz L; Debs BE; Mayot E; Samuels ML; Rooney EK; Dieu P; et al. High-Resolution Dose-Response Screening Using Droplet-Based Microfluidics. Proc. Natl. Acad. Sci U. S. A. 2012, 109 (2), 378–383. [DOI] [PMC free article] [PubMed] [Google Scholar]
- (6).Mazutis L; Gilbert J; Ung WL; Weitz DA; Griffiths AD; Heyman JA Single-Cell Analysis and Sorting Using Droplet-Based Microfluidics. Nat. Protoc. 2013, 8 (5), 870–891. [DOI] [PMC free article] [PubMed] [Google Scholar]
- (7).Guan Z; Zou Y; Zhang M; Lv J; Shen H; Yang P; Zhang H; Zhu Z; James Yang C A Highly Parallel Microfluidic Droplet Method Enabling Single-Molecule Counting for Digital Enzyme Detection. Biomicrofluidics 2014, 8 (1), 014110. [DOI] [PMC free article] [PubMed] [Google Scholar]
- (8).Chen WW; Balaj L; Liau LM; Samuels ML; Kotsopoulos SK; Maguire CA; LoGuidice L; Soto H; Garrett M; Zhu LD; et al. BEAMing and Droplet Digital PCR Analysis of Mutant IDH1MRNA in Glioma Patient Serum and Cerebrospinal Fluid Extracellular Vesicles. Mol. Ther.--Nucleic Acids 2013, 2 (7), No. e109. [DOI] [PMC free article] [PubMed] [Google Scholar]
- (9).Abate AR; Hung T; Sperling RA ; Mary P; Rotem A; Agresti JJ; Weiner MA; Weitz DA. DNA Sequence Analysis with Droplet-Based Microfluidics. Lab Chip 2013, 13 (24), 4864–4869. [DOI] [PMC free article] [PubMed] [Google Scholar]
- (10).Macosko EZ; Basu A; Satija R; Nemesh J; Shekhar K; Goldman M; Tirosh I; Bialas AR; Kamitaki N; Martersteck EM; et al. Highly Parallel Genome-Wide Expression Profiling of Individual Cells Using Nanoliter Droplets. Cell 2015, 161 (5), 1202–1214. [DOI] [PMC free article] [PubMed] [Google Scholar]
- (11).Guan Y; Li Z; Wang S; Barnes PM; Liu X; Xu H; Jin M; Liu AP; Yang Q A Robust and Tunable Mitotic Oscillator in Artificial Cells. eLife 2018, 7, No. e33549. [DOI] [PMC free article] [PubMed] [Google Scholar]
- (12).Teh SY; Lin R; Hung LH; Lee AP Droplet Microfluidics. Lab Chip 2008, 8 (2), 198–220. [DOI] [PubMed] [Google Scholar]
- (13).Berthier J; Kenneth BA The Physics of Microdroplets; Scrivener Publishing LLC: Beverly, MA, 2012; pp 161–181. [Google Scholar]
- (14).Urban PL Open-Source Electronics As a Technological Aid in Chemical Education. J. Chem. Educ. 2014, 91 (5), 751–752. [Google Scholar]
- (15).Urban PL Universal Electronics for Miniature and Automated Chemical Assays. Analyst 2015, 140 (4), 963–975. [DOI] [PubMed] [Google Scholar]
- (16).Grinias JP; Whitfield JT; Guetschow ED; Kennedy RT An Inexpensive, Open-Source USB Arduino Data Acquisition Device for Chemical Instrumentation. J. Chem. Educ. 2016, 93 (7), 1316–1319. [DOI] [PMC free article] [PubMed] [Google Scholar]
- (17).Kubfnova S; Slegr J ChemDuino: Adapting Arduino for Low-Cost Chemical Measurements in Lecture and Laboratory. J. Chem. Educ. 2015, 92 (10), 1751–1753. [Google Scholar]
- (18).Frot C; Taccoen N; Baroud CN Frugal Droplet Microfluidics Using Consumer Opto-Electronics. PLoS One 2016, 11 (8), No. e0161490. [DOI] [PMC free article] [PubMed] [Google Scholar]
- (19).Stephenson W; Donlin LT; Butler A; Rozo C; Bracken B; Rashidfarrokhi A; Goodman SM; Ivashkiv LB; Bykerk VP; Orange DE; et al. Single-Cell RNA-Seq of Rheumatoid Arthritis Synovial Tissue Using Low-Cost Microfluidic Instrumentation. Nat. Commun. 2018, 9 (1), 791. [DOI] [PMC free article] [PubMed] [Google Scholar]
- (20).Urban PL Prototyping Instruments for the Chemical Laboratory Using Inexpensive Electronic Modules. Angew. Chem., Int. Ed. 2018, 57 (34), 11074–11077. [DOI] [PubMed] [Google Scholar]
- (21).Duffy DC; McDonald JC; Schueller OJ; Whitesides GM Rapid Prototyping of Microfluidic Systems in Poly-(Dimethylsiloxane). Anal. Chem. 1998, 70 (23), 4974–4984. [DOI] [PubMed] [Google Scholar]
- (22).Raspberry Pi Camera Module—Raspberry Pi Documentation. https://www.raspberrypi.org/documentation/raspbian/applications/camera.md (accessed Feb, 2019).
- (23).Hackley VA; Clogston JD Measuring the Size of Nanoparticles in Aqueous Media Using Batch-Mode Dynamic Light Scattering; Special Publication SP 1200–6 for NIST, 2015. [Google Scholar]
Associated Data
This section collects any data citations, data availability statements, or supplementary materials included in this article.
Supplementary Materials
droplet generation at flow rate of 2 and 1 μL/ min for oil and water (AVI)