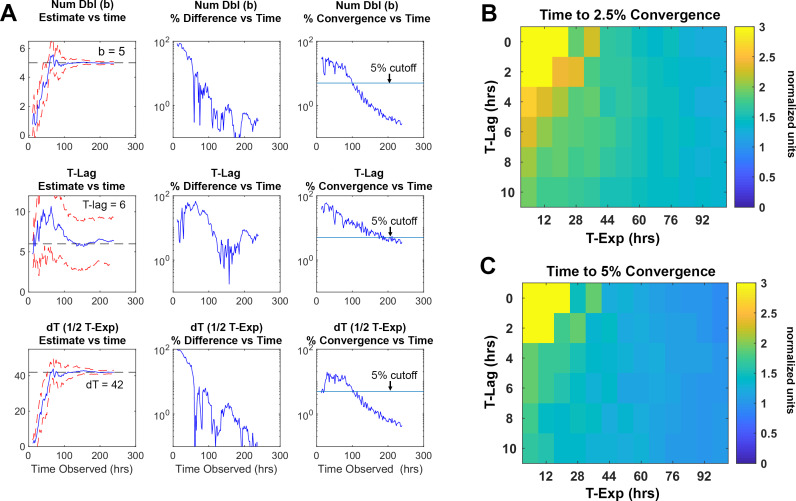
Figure 12. Time required for reliably determining the kinetic parameters in silico.
(A) Column 1, the difference between the true parameter, in this case Num Dbl = 5, T-Lag = 6, and dT = 42, and the estimated parameter are plotted as more of the growth curve is observed over time. As more timepoints of the growth curve are included or “observed” in the fit algorithm, the estimated parameters approach their true values. The red dashed lines are 1 standard deviation of 25 growth curves each with random noise added. Column 2, the percent difference between the true value and the estimated value are unstable and do not decrease consistently as more time points are included in the estimation. Column 3, percent convergence given by the difference between two consecutive time point estimations and divided by the true parameter value and decreases steadily over time. The blue line represents a convergence threshold of 5% between consecutive estimations and this threshold is met when all parameters fall below the convergence threshold. (B–C) Heat maps showing the ratio of time needed for the parameter to converge to a given precision, divided by the total time for the growth curve to begin to plateau . The ratio is given explicitly as . The heatmaps indicate that for given lag times and time in exponential phase the parameters converge after the growth curve begins to plateau. This means that for a drug that causes growth cessation at 20 hours, a measurement of roughly 1.5× that, or 30 hrs of observation, is required for the parameter to converge to less 5% precision.

