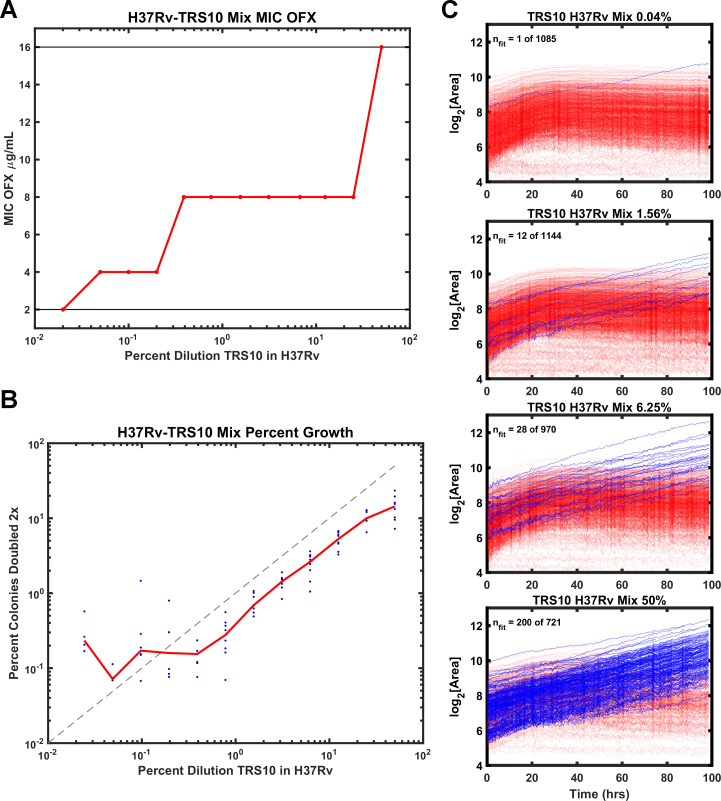
Figure 5. Comparison of ODELAM and MIC assay in detecting heteroresistance.
(A) Dilution of TRS10 into H37Rv and the corresponding MICs obtained from a bulk culture assay. (B) Comparison of the percentage of TRS10 in H37Rv generated by dilution against the percentage of CFUs observed to grow more than 2× by ODELAM. The blue dots are replicate measurements from a given dilution and the red line is the mean of each replicate. (C) ODELAM growth curves for TRS10/H37Rv mixtures. Blue traces are resistant and red traces are sensitive to OFX.

