

Abstract
Purpose:
To generate a preclinical model of isocitrate dehydrogenase (IDH) mutant gliomas from glioma patients and design a MRS method to test the compatibility of 2-hydroxyglutarate (2HG) production between the preclinical model and patients.
Methods:
Five patient-derived xenograft (PDX) mice were generated from two glioma patients with IDH1 R132H mutation. A PRESS sequence was tailored at 9.4T, with computer simulation and phantom analyses, for improving 2HG detection in mice. 2HG and other metabolites in the PDX mice were measured using the optimized MRS at 9.4T and compared with 3T MRS measurements of the metabolites in the parental-tumor patients. Spectral fitting was performed with LCModel using in-house basis spectra. Metabolite levels were quantified with reference to water.
Results:
The PRESS TE was optimized to be 96 ms, at which the 2HG 2.25-ppm signal was narrow and inverted, thereby leading to unequivocal separation of the 2HG resonance from adjacent signals from other metabolites. The optimized MRS provided precise detection of 2HG in mice compared to short-TE MRS at 9.4T. The 2HG estimates in PDX mice were in excellent agreement with the 2HG measurements in the patients.
Conclusion:
The similarity of 2HG production between PDX models and parental-tumor patients indicates that PDX tumors retain the parental IDH metabolic fingerprint and can serve as a preclinical model for improving our understanding of the IDH-mutation associated metabolic reprogramming.
Keywords: 2-Hydroxyglutarate (2HG), Isocitrate dehydrogenase (IDH) mutation, Gliomas, Patient-derived xenograft (PDX), Mouse, 1H magnetic resonance spectroscopy (MRS), Point-resolved spectroscopy (PRESS)
INTRODUCTION
2-Hydroxyglutarate (2HG), which is normally present in minute quantities (μM level), is elevated by orders of magnitude in gliomas harboring mutations in metabolic enzyme isocitrate dehydrogenase (IDH) (1). Importantly, 2HG is predictive of patient survival since IDH mutation carries a favorable prognosis (2,3). In vivo detection of 2HG in patients therefore provides a noninvasive diagnostic and prognostic biomarker in IDH mutant gliomas. Recent 1H MRS studies in glioma patients showed that 2HG level increases with tumor progression and falls in response to chemoradiation therapy (4,5). A patient-derived xenograft (PDX) mouse model of IDH mutant gliomas may provide a preclinical system for improving our understanding of 2HG associated metabolic reprogramming in IDH mutant gliomas. Development of a robust MRS methodology for 2HG evaluation in preclinical models will provide an effective tool for studying tumor growth and response to treatments in IDH mutant gliomas.
In vivo detection of 2HG by short-TE MRS is often elusive due to extensive spectral overlaps with adjacent signals from other metabolites. The 2HG 2.25 ppm signal, which is attributed to the proximate C4 proton resonances that are coupled to the C3 protons, is larger than other 2HG signals but very proximate to the resonances of glutamate (Glu), glutamine (Gln) and γ-aminobutyric acid (GABA). The presence of underlying broad macromolecule (MM) signals (6,7) may interfere with 2HG estimation, particularly when 2HG elevation is moderate. Reliable measurement of 2HG without considerable spectral complication therefore requires rigorous tailoring of the MRS data acquisition and analysis protocol. A recent study used a short-TE approach to measure 2HG at 9.4 T in a rodent model of IDH mutant glioma(8), employing additional data processing with metabolite-nulled data to minimize the spectral complexity arising from the background MM signals.
Since the signal pattern of J-coupled spin resonances changes with time, the spectral resolution of coupled resonances can be improved by TE optimization, with additional benefits that the MM signals diminish rapidly with increasing TE. In this study, we generated PDX mouse models from IDH mutant glioma patients and developed a long-TE 1H MRS method for improving the distinction of the 2HG 2.25 ppm signal at 9.4 T. We present 2HG evaluation in five PDX mice generated from two IDH-mutant glioma patients, together with 2HG measurements in the parental-tumor patients obtained with our previously-published MRS method at 3 T (9,10).
METHODS
Mouse tumor model and patient recruitment
PDX mice were generated from surgically removed tumors from IDH1-R132H mutant glioma patients who had in vivo 1H MRS at 3 T. Under the institutional review board approval, human glioma tissue, obtained from surgical resection, was stereotactically injected into the subcortical region of severe combined immuno-deficiency (SCID) mice for generating PDX lines, as described previously (11–13). Tumor cells were injected in the brain of four mice for each of the patient tumors, which included glioblastoma (patient 1) and anaplastic astrocytoma (patient 2). Two mice of glioblastoma died 2 - 3 weeks after the implantation and one mouse with anaplastic astrocytoma died during the preparation for an MRS scan. Five PDX mice (two from patient 1 and three from patient 2) and three young healthy mice were tested for 2HG measurement at 9.4 T in vivo. PDX mice generated from patient 1 were grouped as Line 1 (n = 2) and those from patient 2 were grouped as Line 2 (n = 3). The Line-1 mice were imaged approximately 35 days after the implantation and the Line-2 mice had MRS after 65 - 70 days of tumor implantation. We sacrificed the mice immediately after the MRS scan and conducted H&E and IDH1 R132H immunohistochemical staining in the mouse tumor tissues. All animal experiments were performed under a protocol approved by the Institutional Animal Care and Use Committee of the University of Texas Southwestern Medical Center. The two patients, whose tumors were used for generating the PDX lines, had a biopsy proven glioblastoma (patient 1) and an anaplastic astrocytoma (patient 2). In addition, 4 healthy volunteers (male; mean age 30±4 years) were enrolled to obtain reference MRS data. The protocol was approved by the Institutional Review Board of the University of Texas Southwestern Medical Center. Written informed consent was obtained prior to the scans.
1H MRS optimization for 2HG at 9.4 T
The subecho times, TE1 and TE2, of a PRESS sequence (90° - TE1/2 - 180° - TE1/2 - TE2/2 - 180° - TE2/2 - Acquisition) were tailored, with numerical and phantom analyses, to improve the spectral resolution of the 2HG resonance at 2.25 ppm. The 90° and 180° RF pulses were 0.55 and 3.0 ms long (bandwidth 10.7 and 5.5 kHz) at an RF field intensity of 60 μT, respectively. The 90° pulse had a 5-lobe sinc-type envelope and the 180° pulses had the same envelope as in Figure 1d of our prior 3 T 2HG MRS paper (10). Density-matrix simulations were conducted incorporating the slice-selective RF and gradient pulses of the PRESS sequence. 3D volume-localized spectra of 2HG, Glu and GABA were numerically calculated for subecho times between minimum values and 100 ms (1 ms increments for each of TE1 and TE2), using a product-operator based transformation-matrix algorithm (9,14). Transformation matrices were created for the slice-selective 90° and 180° RF and gradient pulses and used for PRESS simulations. The effect of the slice-selective gradient pulse during the RF pulse was incorporated in such a manner that an object length 1.5 times longer than slice thickness was divided into 150 even-spaced pixels, in each of which the magnetic field strength was assumed to be uniform. The carrier frequency of the RF pulses was set to 2.8 ppm. Published chemical shift and J-coupling constants were used in the simulations (15). The computer simulation was programmed with MATLAB® (The MathWorks, Inc., Natick, MA).
The optimized PRESS sequence was tested in an aqueous solution with 2HG and glycine (Gly) at 7.5 and 10 mM, respectively (pH 7). MRS data was obtained from a 3×3×3 mm3 voxel within a phantom, using TE-optimized PRESS and short-TE PRESS (TR 9 s for both).
MR experimentation and data analysis
Animal MRS
In vivo 1H MR experiments were carried out on the PDX mice in a 9.4 T horizontal-bore animal MR scanner (Agilent Technologies, Santa Clara, CA), equipped with a home-built 15-mm diameter single-loop transmit/receive surface coil. The mouse was anesthetized using 1-2% isoflurane in oxygen throughout the experiments. The respiration was monitored with a pressure pillow while hot air was blown into the magnet bore to maintain the mouse body temperature. Following survey imaging, anatomical images were acquired in the axial direction using a T2-weighted (T2w) fast spin-echo sequence. A 3×3×3 mm3 voxel was positioned in a subcortical region in healthy mouse scans and within the T2w hyper-intensity region in PDX mouse scans. Water-suppressed metabolic data were acquired with the TE-optimized PRESS. The PRESS scan parameters included 3 s TR, 96 ms TE, 512 signal averages, 5 kHz sweep width, and 4096 sampling points. Metabolite signals from chemical-shift displaced voxels were included in the data acquisitions, without using outer-volume suppression. The entire signal averaging was undertaken in the scanner. The RF pulses of PRESS were the same as those in the computer simulations. First- and second-order B0 shimming was performed using FASTMAP (16), followed by manual refinement of first-order shimming. Following flip angle calibration, which was conducted using the RF pulses of the PRESS sequence, 1D gradient-echo imaging of the PRESS-localized volume was performed along three directions to ensure acceptable volume localization (Supporting Information Figure S1). A variable flip-angle four-pulse scheme (17) was used for water suppression. In addition, water suppressed short-TE (14.7 ms) PRESS data were acquired with 128 signal averages. Unsuppressed water was acquired with the TE-optimized and short-TE PRESS sequences.
MRS data were corrected for eddy current effects using the unsuppressed water signal and subsequently apodized with a 1-Hz exponential function. Spectral fitting was performed with LCModel (18). The basis set included numerically-calculated spectra of 23 metabolites; 2HG, Glu, Gln, GABA, Gly, myo-inositol (mI), lactate (Lac), taurine, scyllo-inositol, aspartate, serine, ethanolamine, phosphoethanolamine, alanine, N-acetylaspartate, N-acetylaspartylglutamate (NAAG), glutathione, citrate, succinate, glucose α-anomer, glucose β-anomer, total creatine (tCr = creatine + phosphocreatine), and total choline (tCho = glycerophosphocholine + phosphocholine). The effect of chemical shift displacements on the signal strength and pattern was taken into account in the numerical simulations of basis spectra, similarly as in the 2HG MRS simulations described above. The basis signals of lipids and macromolecules were created using LCModel built-in functions. Cramer-Rao lower bounds (CRLBs), returned as a percentage standard deviation (%SD) by LCModel, were used as the precision of the metabolite signal estimates. The spectral fitting was conducted between 0.5 and 4.1 ppm, using the default baseline option of LCModel. For validation purpose, additional spectral fitting was performed without 2HG in the basis set. The metabolite levels were quantified by normalizing the LCModel estimates to the unsuppressed water signal and subsequently referencing to tCr in the normal mouse brain at 8 mM. The T2 relaxation times of metabolites were assumed to be equal. Data are presented as mean ± SD.
Human MRS
1H MR scans of human subjects were carried out on a whole-body 3 T MR scanner (Philips Medical Systems, Best, The Netherlands). The MRS data acquisition and analysis were conducted similarly as in our prior study (10). Briefly, T2-weighted fluid-attenuated inversion recovery (T2w-FLAIR) images were acquired to identify the tumor mass. Water-suppressed PRESS spectra were acquired using 97 ms TE, 2 s TR, 2500 Hz sweep width, and 2048 sampling points. The number of signal averages was 128 - 256, depending on the voxel size (4 - 8 mL). Unsuppressed water was acquired, with STEAM (TE 13 ms, TR 2 s) from the same voxel. Spectral fitting was performed with LCModel, using basis spectra that were generated incorporating the PRESS slice-selective RF pulses. Metabolites were quantified with normalization to water and reference to tCr in the healthy brain at 8 mM, similarly as in the mouse data analysis.
Immunohistochemistry
IDH mutation was identified in standard assessment of tumor tissue using immunohistochemistry (IHC) for IDH1 R132H mutation, using a previously described method (9). IHC for IDH1 mutation in mouse tumors was obtained after the MRS experiments.
RESULTS
The numerical simulations of PRESS at 9.4 T indicated that the signal strength and pattern of the 2HG C4-proton resonances at ~2.25 ppm depend on the subecho times, TE1 and TE2 (Figure 1A). The 2HG signal had positive polarity at short TE (< 40 ms) but was inverted for 70 ms < TE < 110 ms. PRESS simulations versus TE1 and TE2 indicated that a pair of subecho times, TE1 = 19 ms and TE2 = 77 ms (TE=96 ms), gives a temporally large inverted signal that is narrower compared to short-TE signals. This subecho time set was tested in a phantom solution with 2HG and Gly. The 2HG signal strengths and patterns at TEs of 14.7 ms (TE1 = 8 ms, TE2 = 6.7 ms) and 96 ms (TE1 = 19 ms, TE2 = 77 ms) were in excellent agreement between calculation and experiment (Figure 1B,C). The phantom data from TE 96 ms showed an inverted narrow peak of 2HG at 2.25 ppm, as predicted by simulations. The 2HG signals at TE 96 and 14.7 ms were both closely reproduced by LCModel fits. Spectral fitting of the phantom spectra reproduced the prepared 2HG-to-Gly concentration ratio of 0.75, with experimental T2 values of 2HG and Gly at 110 and 980 ms respectively. A simulation indicated that line narrowing similarly occurs to the signals of Glu, Gln and GABA at the 96 ms TE (Supporting Information Figure S2). While the C4-proton signals of 2HG, Glu, Gln and GABA between 2.2 and 2.5 ppm at TE 14.7 ms were all broad and overlapped extensively, the inverted narrow signal of 2HG at TE 96 ms was clearly distinguishable from the adjacent signals in the sum spectrum.
Figure 1.

(A) Numerically calculated signal of the 2HG C4-proton resonance versus PRESS subecho times TE1 and TE2. Density-matrix simulations were conducted, at 9.4 T, incorporating the slice-selective RF and gradient pulses used for experiments. Spectra were broadened to singlet linewidth (FWHM) of 14 Hz. Highlighted is a TE1 and TE2 range that gave the largest inverted 2HG signal, ignoring T2 relaxation effects. (B,C) In vitro data obtained with PRESS TE 14.7 ms (TE1 = 8 ms, TE2 = 6.7 ms) and 96 ms (TE1 = 19 ms, TE2 = 77 ms) are presented together with LCModel spectral fits, obtained with a numerically calculated basis set of Gly and 2HG. The spectrum was normalized to the Gly 3.55 ppm signal for each TE.
The optimized TE 96 ms PRESS at 9.4 T was tested in vivo in healthy mouse brain and IDH-mutant PDX mouse generated from an IDH-mutant glioblastoma patient. While the healthy mouse brain data did not show measurable 2HG (Figure 2A), a large inverted signal was observed at 2.25 ppm in the spectrum from the IDH mutant mouse tumor (Figure 2B). The inverted 2HG peak at 2.25 ppm was well reproduced by LCModel fit, giving a 2HG level at 25 mM with high precision (CRLB 1%). When 2HG was excluded from the basis set, the spectral fit of the normal mouse brain spectrum was unaffected, but the fit of the mouse tumor data was very different from the in vivo spectrum, resulting in large residuals (Residuals-2) at 2.25 and 4.0 ppm and extensive distortion in the LCModel baseline (Baseline-2), compared to the with-2HG fitting (Residuals-1 and Baseline-1). This result indicated that the 2.25 and 4.0 ppm signals in the tumor data were primarily attributed to the 2HG C4- and C2-proton resonances, respectively. The inverted 2HG signal at 2.25 ppm remained readily discernible up to singlet linewidth (FWHM) of 40 Hz (Supporting Information Figure S3). The metabolite concentrations of normal mouse brain and healthy human brain, estimated using the long-TE methods, fell within the range of previously-reported values for normal rodents (13,21) and healthy human brain (22,23) (Supporting Information Figure S4).
Figure 2.

In vivo spectra from (A) healthy mouse brain and (B) IDH1-mutant PDX mouse brain, obtained with 2HG-optimized TE 96 ms PRESS at 9.4 T, are shown together with LCModel fits, baseline and residuals. Residuals-1 and Baseline-1 were results from LCModel fitting with 2HG in the basis set while Residuals-2 and Baseline-2 were results from fitting without 2HG in the basis set. Dashed horizontal lines (black) indicate the zero levels. The voxel size was 3×3×3 mm3 in both cases, as shown in T2 weighted (T2w) images. A vertical line is drawn at the 2HG C4-proton resonance (2.25 ppm). Immunohistochemical staining with IDH1 R132H antibody showed positively stained IDH1 R132H mutant tumor cells. The average linewidth of the singlet resonances (tCho, tCr, tNAA) in the healthy mouse brain data was 22±1 Hz while the linewidth of the tCho singlet in the tumor data was 12 Hz. The SNR (peak amplitude to background noise ratio) of tCr in the healthy brain data was 61 while the tCho SNR in the tumor data was 347. Here the background noise level was calculated as the standard deviation of the residuals between 0.5 and 1 ppm.
Figure 3 presents in vivo TE 96 ms PRESS spectra obtained at 9.4 T from the two IDH-mutant PDX lines, together with in vivo spectra obtained at 3 T from the respective parental-tumor patients. The Line-1 PDX mouse showed a high level of 2HG (25 mM), very close to the 2HG estimation from the corresponding patient (24 mM). tCho was also estimated to be similar between the tumor mouse (11 mM) and the patient (11.6 mM). Line-2 PDX mouse showed moderate level of 2HG (2.3 mM), similar to the 2HG estimate from the corresponding patient (1.9 mM). For each of Line-1 and Line-2, the mean 2HG estimate was about the same as the estimation in the corresponding parental human tumor (Supporting Information Figure S5). tCho was not significantly different between PDX mice and the parental-tumor patients. Also, tNAA (NAA+NAAG) and tCr did not show large differences between PDX and patients, whilst the differences in mIns and Glx (Glu + Gln) levels between PDX and patients were relatively large. 2HG was not detectable in healthy mouse brain or healthy human brain (Figure 2, Supporting Information Figure S5).
Figure 3.
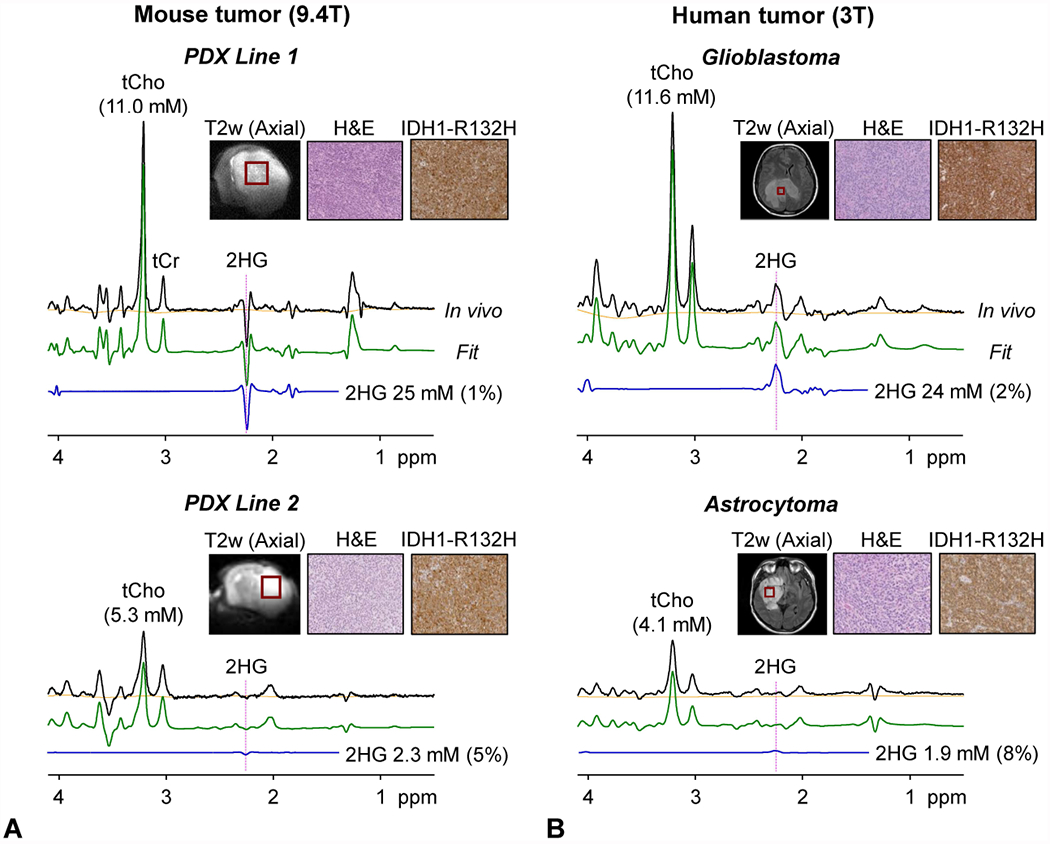
In vivo TE 96 ms PRESS spectra from (A) PDX mouse lines at 9.4 T and (B) the parental-tumor patients at 3 T are presented together with LCModel fits, baselines, 2HG signals, and immunohistochemical pictures of H&E and IDH1 R132H staining. MRS voxels are shown in T2 weighted (T2w) images. The voxel size was 3×3×3 mm3 in Line-1 mouse, 3×2.5×3 mm3 in Line-2 mouse, 16×16×16 mm3 in Patient-1 (256 averages), and 20×20×20 mm3 in Patient-2 (128 averages). Vertical dotted lines are drawn at 2.25 ppm.
We compared the performance of short-TE (14.7 ms) MRS and the optimized long-TE (96 ms) MRS in PDX Line-2 mice. Long-TE MRS showed 2HG presence when fitted with 2HG in the basis set (Figure 4A). When spectral fitting was performed without 2HG in the basis set, nonzero residuals were noticeable at 2.25 ppm (Figure 4B), indicating that a signal at 2.25 ppm in the in-vivo spectrum was attributed to 2HG. 2HG was estimated as 2.3 mM with CRLB at 5%. For short-TE MRS, 2HG was estimated as 2.5 mM with a larger CRLB (9%) (Figure 4C). When the short-TE data was fitted without 2HG in the basis set, the residuals at ~2.25 ppm remained essentially unchanged (Figure 4D), implying that the 2HG signal from the with-2HG fitting was not entirely attributable to 2HG. The baselines from the spectral fitting were relatively uneven in the short-TE data, possibly due to discrepancy between macromolecule signals at 9.4 T and the LCModel built-in macromolecule basis functions (7).
Figure 4.

In vivo MRS data from Line-2 PDX mouse obtained using (A, B) TE 96 ms PRESS and (C, D) short-TE (14.7 ms) PRESS. The data were analyzed (A, C) with 2HG in the basis set and (B, D) without 2HG in the basis set. Residuals are magnified two fold. The linewidth and SNR of the tCho singlet in the TE 96 ms spectra were 17 Hz and 112, respectively.
DISCUSSION AND CONCLUSIONS
The current work reports in vivo measurements of an oncometabolite 2HG in preclinical model of IDH-mutant tumors at 9.4 T. Because the 2HG 2.25 ppm resonance, which gives the largest signal in 2HG, is extensively overlapped with the neighboring GABA and Glu resonances and the underlying macromolecule signals at short TE, a long-TE MRS method was designed and tested in PDX mouse models of IDH-mutant gliomas. The data clearly showed that the 2HG-optimized PRESS TE 96 ms method improves 2HG signal selectivity compared to short-TE MRS. The 2HG 2.25 ppm peak was narrow and inverted at the optimized TE at 9.4 T, giving rise to high contrast to the upright and narrow signals of GABA, Glu and Gln and thereby leading to precise detection of 2HG in PDX mouse tumors. 2HG measurements in PDX mice agreed well with the 2HG estimations in the parental-tumor patients.
In a recent study (8), in which 2HG was measured using a very short-TE (2.83 ms) in rat brain tumors developed from F98 glioma cells, 2HG levels of 3.3 - 6.7 mM were reported with a mean CRLB of 17.5±3.5%. In our long-TE MRS study, although the signal reduction due to the T2 relaxation effects was considerable, a smaller 2HG CRLB (4.6±2.7%) was accomplished (2HG estimates 1.9 - 25 mM), which was most likely due to the effects of line narrowing and signal polarity contrast of 2HG with respect to adjacent resonances as well as attenuation of the background MM signals. The small 2HG CRLBs in our optimized long-TE approach suggests that the benefit from the improved signal selectivity at the long TE outweighs the effect of T2 signal loss and may increase the capability to monitor 2HG in preclinical 2HG studies. In addition, although the 2HG-optimized TE is very similar between 9.4 T and 3 T (96 vs. 97 ms), the polarity of the resulting 2HG 2.25 ppm signal is markedly different between the field strengths (i.e., negative vs. positive), which is because of the difference in the coherence terms responsible for the 2HG 2.25 ppm signals at the TEs. The 2HG signal inversion at relatively long TEs (70 - 110 ms) also occurs at 7 T (19–21). As discussed in our prior 7 T 2HG MRS paper (20), the C4-proton spin coherence evolution of 2HG is different than those of GABA and Glu at high fields, resulting in signal polarity contrast of 2HG with respect to the adjacent resonances at long TEs.
For single-loop surface coil transmit, the change in B1 may be most rapid in the direction perpendicular to the coil plane (dorsoventral direction in our case). The chemical-shift displacement of the slice in the dorsoventral direction was minimized by using the 90° RF pulse (bandwidth 10.7 kHz) for slice selection along the direction. Given that changes in flip angle of the first RF pulse of PRESS may have equal effects on the signal strengths of uncoupled and J-coupled spin resonances without altering the coupled-spin signal pattern (21), the effect of non-uniform flip angles across the slice selected by the PRESS 90° RF pulse on metabolite quantification was likely negligible in our study, in which the quantification was undertaken via normalization of metabolite signals to a water singlet. However, the spectral pattern and strength of coupled resonances are sensitive to the flip angle of the refocusing RF pulses of PRESS. The effect of the refocusing pulse flip angle is pronounced in strongly-coupled resonances such as the 2HG C4-proton spins. A simulation indicated that, when normalized to a singlet, the 2HG C4-proton signal is reduced as the flip angle deviates from 180º (Figure 5). The 2HG 2.25 ppm signal to singlet ratios at flip angles of 160º and 200º were respectively 78% and 82% with respect to the signal ratio at the 180º flip angle. We used the 180° RF pulses for slice selection along the directions parallel to the surface coil plane, along which the B1 variation may not be extensive for slice thickness small compared to the surface-coil diameter (3 vs. 15 mm).
Figure 5.

Numerically-calculated PRESS volume-localized spectra of 2HG and Cr CH3 protons for various flip angles of the refocusing RF pulses. The flip angle, which was varied by changing the RF pulse amplitude in the simulation, is shown at the top of each spectrum. The 2HG signal was normalized to the Cr CH3 singlet for each flip angle. The 2HG-to-Cr concentration ratio was 5:1 in the simulation. Spectra were broadened to the Cr linewidth of 14 Hz. Dashed horizontal lines (in pink) indicate the amplitudes of the 2HG 2.25 ppm signal at the 180° flip angle.
There are several pitfalls and precautions in the present study. First, a major caveat with respect to quantification of 2HG, which is a primary metabolite in the present study, may be the T2 relaxation effect on the 2HG signal strength because 2HG was measured at relatively long TEs (96 and 97 ms at 9.4 T and 3 T, respectively). Since the T2 of 2HG is unknown, the 2HG T2 was assumed to be identical to the tCr T2. The 2HG estimation may therefore contain errors depending upon the 2HG T2 difference from the tCr T2. For both mouse and human MRS, errors arising from metabolite T2 differences between tumors and healthy brain may not be large since metabolite T2s were not very different between tumors and healthy brain in a prior 3 T study (22). Second, volume localization by adiabatic RF pulses is often employed in high field MRS and/or surface-coil transmit MRS. The performance of PRESS localization may not be extensively inferior to adiabatic localization (e.g., semi-LASER), depending upon the PRESS 180° RF pulse envelope and the flip angle calibration. The in-vivo PRESS-localized voxel profiles deemed acceptable (Supporting Information Figure S1) and adiabatic localization was not pursued in the present study. The phantom experimental profiles of the PRESS-localized volume were uniform, in good agreement with the theoretical profiles of the pulses. This suggests that the non-uniform asymmetric profiles in mouse brain could be largely due to non-uniform water content in the mouse brain. Third, the 2HG measurements in Line-2 PDX mice were not as reliable as the data in Line-1 mice. The 2HG signal was not readily discernible in spectra from Line-2 mice most likely due to relatively low levels of 2HG as well as large linewidth. The performance of the MRS was not uniform across the 2HG concentration range noticed in human tumors, with more reliable estimations in tumors that produce high concentration of 2HG (e.g., > 5 mM). It is noteworthy, however, that the difference in 2HG estimations between Line-1 and Line-2 mice was in excellent agreement with the 2HG level difference in the patient data. Lastly, the small sample size is a significant limitation in the present study. Data from additional PDX mice, including other types of IDH mutation and IDH wildtype, would strengthen the observations of the present study. It is worthwhile to note that IDH1 R132H mutation is highly prevalent in patients (85% (4)) and thus the PDX modeling of IDH1 R132H mutation may be more clinically applicable in patients compared to other types of IDH mutation.
Tumors develop in a tumor microenvironment (TME), which is comprised of proliferating tumor cells, tumor stroma, blood vessels and infiltrating inflammatory cells (23,24). The tumor cells and stromal cells are in constant crosstalk and have several metabolic interactions (23,25). The present study showed high consistency of 2HG level between PDX mice and patients, suggesting that the 2HG production activity of the IDH-mutant tumor cells is not significantly altered in PDX mouse models. TME, which may differ between mouse brain and human brain, may not influence the IDH mutant activity of the tumor cells considerably. Given the well-preserved IDH mutant activity, PDX models of IDH-mutant gliomas appear to be suitable for evaluating a drug targeting inhibition of 2HG production.
In conclusion, the optimized TE 96 ms PRESS provides reliable detection of 2HG at 9.4 T. In the light of current research involving IDH-mutant PDX mice, this is the first study that demonstrates evaluation of 2HG in patient-derived mouse tumors in comparison to parental-tumor patients. The similarity of metabolic profile between PDX models and patients suggests that the IDH-mutant activity of tumor cells remains unaltered in preclinical models and that our optimized MRS can provide an effective tool for testing drugs in preclinical models targeted for modulation of 2HG metabolism in IDH mutant gliomas.
Supplementary Material
Supporting Information Figure S1. Voxel positioning in a tumor mouse and the in-vivo slice profiles of the PRESS-localized volume (3×3×3 mm3) are presented together with phantom and Bloch-simulated profiles of the PRESS RF pulses. The slice selection along the dorsoventral axis (DV) was obtained with a 90° RF pulse (0.55 μs long; 5-lobe sinc type) and the slices along the left-right (LR) and anteroposterior (AP) axes were selected using 180° RF pulses (3-ms long; amplitude-modulated).
Supporting Information Figure S2. Numerically-calculated PRESS spectra of 2HG, GABA, Glu and Gln at identical concentrations for (A) TE = 14.7 ms (TE1 = 8.0 ms and TE2 = 6.7 ms), and (B) 2HG-optimized TE (TE = 96 ms; TE1 = 19 ms and TE2 = 77 ms) at 9.4 T. Spectra were broadened to singlet linewidth of 14 Hz. Vertical lines are drawn at 2.25 ppm.
Supporting Information Figure S3. Data from an IDH1-mutant PDX Line-1 mouse (shown in Fig. 2B) following apodization with various exponential functions (1 - 25 Hz) are presented. The resulting singlet linewidth (total choline peak at 3.21 ppm) ranged from 12 - 40 Hz. The underlined linewidth value (21.4 Hz) is approximately equal to the singlet linewidth of the normal mouse brain spectrum in Figure 2A (linewidth ~ 22 Hz). LCModel estimation of the 2HG-to-tCho concentration ratio was markedly decreased as the filtering Hz value increased (e.g., 1.82 vs. 1.48 in the 1-Hz and 11-Hz apodized data). Shown in the right panel are apodized spectra followed by normalization to the tCho 3.21 ppm peak amplitude.
Supporting Information Figure S4. In vivo PRESS spectra from (A) healthy mouse brain at 9.4 T and (B) a healthy human brain at 3 T. LCModel fits, baseline and estimates are shown together with metabolite estimates and percentage CRLBs. Data were acquired from a 3×3×3 mm3 voxel in the mouse brain using TE 96 ms PRESS at 9.4 T and from a 20×20×20 mm3 voxel in the human brain using TE 97 ms PRESS at 3 T.
Supporting Information Figure S5. MRS estimations of 2HG, tCho, tNAA, tCr and Glx (Glu + Gln) concentrations are bar graphed for mice (normal mice and PDX lines) and for human subjects (healthy subjects and tumor patients). The PDX Lines 1 and 2 were generated from the IDH-mutant tumors of patients 1 and 2, respectively. Error bars indicate standard deviations.
ACKNOWLEDGMENTS
This study was supported by Cancer Prevention Research Institute of Texas grants (CPRIT) RP14021-P04 and RP130427, and a National Institutes of Health award R01CA184584. We thank Ms. Jeannie Baxter, Lucy Christie, and Kelley Derner for coordinating research MR scans and for human subject care during MR scanning.
REFERENCES
- 1.Dang L, White DW, Gross S, Bennett BD, Bittinger MA, Driggers EM, Fantin VR, Jang HG, Jin S, Keenan MC, Marks KM, Prins RM, Ward PS, Yen KE, Liau LM, Rabinowitz JD, Cantley LC, Thompson CB, Vander Heiden MG, Su SM. Cancer-associated IDH1 mutations produce 2-hydroxyglutarate. Nature. 2009;462:739–744. [DOI] [PMC free article] [PubMed] [Google Scholar]
- 2.Parsons DW, Jones S, Zhang X, Lin JC, Leary RJ, Angenendt P, Mankoo P, Carter H, Siu IM, Gallia GL, Olivi A, McLendon R, Rasheed BA, Keir S, Nikolskaya T, Nikolsky Y, Busam DA, Tekleab H, Diaz LA Jr., Hartigan J, Smith DR, Strausberg RL, Marie SK, Shinjo SM, Yan H, Riggins GJ, Bigner DD, Karchin R, Papadopoulos N, Parmigiani G, Vogelstein B, Velculescu VE, Kinzler KW. An integrated genomic analysis of human glioblastoma multiforme. Science. 2008;321:1807–1812. [DOI] [PMC free article] [PubMed] [Google Scholar]
- 3.Yan H, Parsons DW, Jin G, McLendon R, Rasheed BA, Yuan W, Kos I, Batinic-Haberle I, Jones S, Riggins GJ, Friedman H, Friedman A, Reardon D, Herndon J, Kinzler KW, Velculescu VE, Vogelstein B, Bigner DD. IDH1 and IDH2 mutations in gliomas. N Engl J Med. 2009;360:765–773. [DOI] [PMC free article] [PubMed] [Google Scholar]
- 4.Choi C, Raisanen JM, Ganji SK, Zhang S, McNeil SS, An Z, Madan A, Hatanpaa KJ, Vemireddy V, Sheppard CA, Oliver D, Hulsey KM, Tiwari V, Mashimo T, Battiste J, Barnett S, Madden CJ, Patel TR, Pan E, Malloy CR, Mickey BE, Bachoo RM, Maher EA. Prospective Longitudinal Analysis of 2-Hydroxyglutarate Magnetic Resonance Spectroscopy Identifies Broad Clinical Utility for the Management of Patients With IDH-Mutant Glioma. J Clin Oncol. 2016;34:4030–4039. [DOI] [PMC free article] [PubMed] [Google Scholar]
- 5.Andronesi OC, Loebel F, Bogner W, Marjanska M, Vander Heiden MG, Iafrate AJ, Dietrich J, Batchelor TT, Gerstner ER, Kaelin WG, Chi AS, Rosen BR, Cahill DP. Treatment Response Assessment in IDH-Mutant Glioma Patients by Noninvasive 3D Functional Spectroscopic Mapping of 2-Hydroxyglutarate. Clin Cancer Res. 2016;22:1632–1641. [DOI] [PMC free article] [PubMed] [Google Scholar]
- 6.Behar KL, Rothman DL, Spencer DD, Petroff OA. Analysis of macromolecule resonances in 1H NMR spectra of human brain. Magn Reson Med. 1994;32:294–302. [DOI] [PubMed] [Google Scholar]
- 7.Lee HH, Kim H. Parameterization of spectral baseline directly from short echo time full spectra in (1) H-MRS. Magn Reson Med. 2017;78:836–847. [DOI] [PubMed] [Google Scholar]
- 8.Heo H, Kim S, Lee HH, Cho HR, Xu WJ, Lee SH, Park CK, Park S, Choi SH, Kim H. On the Utility of Short Echo Time (TE) Single Voxel 1H-MRS in Non-Invasive Detection of 2-Hydroxyglutarate (2HG); Challenges and Potential Improvement Illustrated with Animal Models Using MRUI and LCModel. PLoS One. 2016;11:e0147794. [DOI] [PMC free article] [PubMed] [Google Scholar]
- 9.Choi C, Ganji SK, Deberardinis RJ, Hatanpaa KJ, Rakheja D, Kovacs Z, Yang XL, Mashimo T, Raisanen JM, Marin-Valencia I, Pascual JM, Madden CJ, Mickey BE, Malloy CR, Bachoo RM, Maher EA. 2-hydroxyglutarate detection by magnetic resonance spectroscopy in IDH-mutated patients with gliomas. Nat Med. 2012;18:624–629. [DOI] [PMC free article] [PubMed] [Google Scholar]
- 10.Choi C, Ganji S, Hulsey K, Madan A, Kovacs Z, Dimitrov I, Zhang S, Pichumani K, Mendelsohn D, Mickey B, Malloy C, Bachoo R, Deberardinis R, Maher E. A comparative study of short- and long-TE (1)H MRS at 3 T for in vivo detection of 2-hydroxyglutarate in brain tumors. NMR Biomed. 2013;26:1242–1250. [DOI] [PMC free article] [PubMed] [Google Scholar]
- 11.Hulsey KM, Mashimo T, Banerjee A, Soesbe TC, Spence JS, Vemireddy V, Maher EA, Bachoo RM, Choi C. (1)H MRS characterization of neurochemical profiles in orthotopic mouse models of human brain tumors. NMR Biomed. 2015;28:108–115. [DOI] [PubMed] [Google Scholar]
- 12.Marin-Valencia I, Yang C, Mashimo T, Cho S, Baek H, Yang XL, Rajagopalan KN, Maddie M, Vemireddy V, Zhao Z, Cai L, Good L, Tu BP, Hatanpaa KJ, Mickey BE, Mates JM, Pascual JM, Maher EA, Malloy CR, Deberardinis RJ, Bachoo RM. Analysis of tumor metabolism reveals mitochondrial glucose oxidation in genetically diverse human glioblastomas in the mouse brain in vivo. Cell Metab. 2012;15:827–837. [DOI] [PMC free article] [PubMed] [Google Scholar]
- 13.Mashimo T, Pichumani K, Vemireddy V, Hatanpaa KJ, Singh DK, Sirasanagandla S, Nannepaga S, Piccirillo SG, Kovacs Z, Foong C, Huang Z, Barnett S, Mickey BE, DeBerardinis RJ, Tu BP, Maher EA, Bachoo RM. Acetate is a bioenergetic substrate for human glioblastoma and brain metastases. Cell. 2014;159:1603–1614. [DOI] [PMC free article] [PubMed] [Google Scholar]
- 14.Thompson RB, Allen PS. Sources of variability in the response of coupled spins to the PRESS sequence and their potential impact on metabolite quantification. Magn Reson Med. 1999;41:1162–1169. [DOI] [PubMed] [Google Scholar]
- 15.Govind V 1H-NMR Chemical Shifts and Coupling Constants for Brain Metabolites. eMagRes. 2016;5:1347–1362. [Google Scholar]
- 16.Gruetter R. Automatic, localized in vivo adjustment of all first- and second-order shim coils. Magn Reson Med. 1993;29:804–811. [DOI] [PubMed] [Google Scholar]
- 17.Ogg RJ, Kingsley PB, Taylor JS. WET, a T1- and B1-insensitive water-suppression method for in vivo localized 1H NMR spectroscopy. J Magn Reson B. 1994;104:1–10. [DOI] [PubMed] [Google Scholar]
- 18.Provencher SW. Estimation of metabolite concentrations from localized in vivo proton NMR spectra. Magn Reson Med. 1993;30:672–679. [DOI] [PubMed] [Google Scholar]
- 19.Emir UE, Larkin SJ, de Pennington N, Voets N, Plaha P, Stacey R, Al-Qahtani K, McCullagh J, Schofield CJ, Clare S, Jezzard P, Cadoux-Hudson T, Ansorge O. Noninvasive Quantification of 2-Hydroxyglutarate in Human Gliomas with IDH1 and IDH2 Mutations. Cancer Res. 2016;76:43–49. [DOI] [PMC free article] [PubMed] [Google Scholar]
- 20.Ganji SK, An Z, Tiwari V, McNeil S, Pinho MC, Pan E, Mickey BE, Maher EA, Choi C. In vivo detection of 2-hydroxyglutarate in brain tumors by optimized point-resolved spectroscopy (PRESS) at 7T. Magn Reson Med. 2017;77:936–944. [DOI] [PMC free article] [PubMed] [Google Scholar]
- 21.An Z, Tiwari V, Ganji SK, Baxter J, Levy M, Pinho MC, Pan E, Maher EA, Patel TR, Mickey BE, Choi C. Echo-planar spectroscopic imaging with dual-readout alternated gradients (DRAG-EPSI) at 7 T: Application for 2-hydroxyglutarate imaging in glioma patients. Magn Reson Med. 2018;79:1851–1861. [DOI] [PMC free article] [PubMed] [Google Scholar]
- 22.Madan A, Ganji SK, An Z, Choe KS, Pinho MC, Bachoo RM, Maher EM, Choi C. Proton T2 measurement and quantification of lactate in brain tumors by MRS at 3 Tesla in vivo. Magn Reson Med. 2015;73:2094–2099. [DOI] [PMC free article] [PubMed] [Google Scholar]
- 23.Whiteside TL. The tumor microenvironment and its role in promoting tumor growth. Oncogene. 2008;27:5904–5912. [DOI] [PMC free article] [PubMed] [Google Scholar]
- 24.Hanahan D, Coussens LM. Accessories to the crime: functions of cells recruited to the tumor microenvironment. Cancer Cell. 2012;21:309–322. [DOI] [PubMed] [Google Scholar]
- 25.Reina-Campos M, Moscat J, Diaz-Meco M. Metabolism shapes the tumor microenvironment. Curr Opin Cell Biol. 2017;48:47–53. [DOI] [PMC free article] [PubMed] [Google Scholar]
Associated Data
This section collects any data citations, data availability statements, or supplementary materials included in this article.
Supplementary Materials
Supporting Information Figure S1. Voxel positioning in a tumor mouse and the in-vivo slice profiles of the PRESS-localized volume (3×3×3 mm3) are presented together with phantom and Bloch-simulated profiles of the PRESS RF pulses. The slice selection along the dorsoventral axis (DV) was obtained with a 90° RF pulse (0.55 μs long; 5-lobe sinc type) and the slices along the left-right (LR) and anteroposterior (AP) axes were selected using 180° RF pulses (3-ms long; amplitude-modulated).
Supporting Information Figure S2. Numerically-calculated PRESS spectra of 2HG, GABA, Glu and Gln at identical concentrations for (A) TE = 14.7 ms (TE1 = 8.0 ms and TE2 = 6.7 ms), and (B) 2HG-optimized TE (TE = 96 ms; TE1 = 19 ms and TE2 = 77 ms) at 9.4 T. Spectra were broadened to singlet linewidth of 14 Hz. Vertical lines are drawn at 2.25 ppm.
Supporting Information Figure S3. Data from an IDH1-mutant PDX Line-1 mouse (shown in Fig. 2B) following apodization with various exponential functions (1 - 25 Hz) are presented. The resulting singlet linewidth (total choline peak at 3.21 ppm) ranged from 12 - 40 Hz. The underlined linewidth value (21.4 Hz) is approximately equal to the singlet linewidth of the normal mouse brain spectrum in Figure 2A (linewidth ~ 22 Hz). LCModel estimation of the 2HG-to-tCho concentration ratio was markedly decreased as the filtering Hz value increased (e.g., 1.82 vs. 1.48 in the 1-Hz and 11-Hz apodized data). Shown in the right panel are apodized spectra followed by normalization to the tCho 3.21 ppm peak amplitude.
Supporting Information Figure S4. In vivo PRESS spectra from (A) healthy mouse brain at 9.4 T and (B) a healthy human brain at 3 T. LCModel fits, baseline and estimates are shown together with metabolite estimates and percentage CRLBs. Data were acquired from a 3×3×3 mm3 voxel in the mouse brain using TE 96 ms PRESS at 9.4 T and from a 20×20×20 mm3 voxel in the human brain using TE 97 ms PRESS at 3 T.
Supporting Information Figure S5. MRS estimations of 2HG, tCho, tNAA, tCr and Glx (Glu + Gln) concentrations are bar graphed for mice (normal mice and PDX lines) and for human subjects (healthy subjects and tumor patients). The PDX Lines 1 and 2 were generated from the IDH-mutant tumors of patients 1 and 2, respectively. Error bars indicate standard deviations.