

Abstract
Coronavirus disease (Covid‐19) has reached unprecedented pandemic levels and is affecting almost every country in the world. Ramping up the testing capacity of a country supposes an essential public health response to this new outbreak. A pool testing strategy where multiple samples are tested in a single reverse transcriptase‐polymerase chain reaction (RT‐PCR) kit could potentially increase a country's testing capacity. The aim of this study is to propose a simple mathematical model to estimate the optimum number of pooled samples according to the relative prevalence of positive tests in a particular healthcare context, assuming that if a group tests negative, no further testing is done whereas if a group tests positive, all the subjects of the group are retested individually. The model predicts group sizes that range from 11 to 3 subjects. For a prevalence of 10% of positive tests, 40.6% of tests can be saved using testing groups of four subjects. For a 20% prevalence, 17.9% of tests can be saved using groups of three subjects. For higher prevalences, the strategy flattens and loses effectiveness. Pool testing individuals for severe acute respiratory syndrome coronavirus 2 is a valuable strategy that could considerably boost a country's testing capacity. However, further studies are needed to address how large these groups can be, without losing sensitivity on the RT‐PCR. The strategy best works in settings with a low prevalence of positive tests. It is best implemented in subgroups with low clinical suspicion. The model can be adapted to specific prevalences, generating a tailored to the context implementation of the pool testing strategy.
Keywords: coronavirus, modeling, pool testing, public health, strategy
Highlights
-
‐
Increasing testing capacity of a country is a key Public Health strategy in the pandemic.
-
‐
A pool testing strategy could potentially increase a country's testing capacity, especially when implemented in lower clinical suspicion groups.
-
‐
We provide a mathematical model to estimate the optimum number of subjects to include in a pool test, based on historical prevalences of positive results.
1. INTRODUCTION
In late December of 2019, several cases of pneumonia of apparent viral origin were reported in Wuhan, China. 1 , 2 Subsequently, a novel coronavirus was identified as the causative pathogen, 3 this new pathogen was identified as severe acute respiratory syndrome coronavirus 2 (SARS‐CoV‐2). The disease (coronavirus disease [COVID‐19]) rapidly spread to neighboring countries and overseas, reaching pandemic proportions and was declared by the World Health Organization (WHO) as a Public Health Emergency of International Concern on 30 January, 2020. 4 As of 19 April, 2020, the WHO has reported 2 241 359 confirmed cases with 152 551 deaths worldwide, 5 a total of 185 countries affected, while 10 still remain with no reported cases. 6
The main diagnostic test that has been implemented worldwide to confirm the infection by this novel coronavirus is the real‐time reverse transcriptase‐polymerase chain reaction (RT‐PCR) from respiratory samples with satisfactory levels of sensibility and specificity. 7 However, there might be other clinical specimens where the virus could be detected as well, using the same technique. 8 , 9 , 10 The procedure takes about a day to come up with a result 11 ; however, more efficient methods are being developed as the pandemic progresses. A crucial part of the public health response to this new threat is to rapidly diagnose and isolate infected individuals to prevent further spreading. 12 , 13 Therefore, amplifying the testing capacity of a country experiencing a massive outbreak, is a key strategy for facing this new public health emergency. 14 Nowadays, the United States is the country with a greater number of confirmed cases worldwide and performs as of 19 April, 2020, 167 330 tests daily, with a total of 3 865 864 tests performed since the beginning of the outbreak 15 with all states currently testing. 16 Other largely affected countries are also performing thousands of confirmatory tests on a daily basis. 17 However, due to the overwhelming number of rapidly growing cases, a considerably large number of suspected cases cannot be properly tested and isolated due to the lack of logistics of a progressively collapsing healthcare system. Therefore, it becomes urgent to optimize the standard operating procedures to confirm the infection by SARS‐CoV‐2. 18
Since the clinical presentation of the disease is often mild or asymptomatic, 19 , 20 and that it has been reported that asymptomatic individuals could transmit the virus, 21 , 22 it becomes crucial to implement an efficient testing strategy to screen that population and properly isolate them to prevent the further spread of the virus. However, as the healthcare systems around the world are progressively collapsing due to the increasing demand of moderate to severe patients that every day present to the emergency room, the testing of individuals with low clinical suspicion has been left behind, in order to prioritize the available resources for the patients with moderate to severe symptoms. Although it becomes quite logical to prioritize testing for patients with higher clinical suspicion, there is a considerable segment of the population that is not being screened and become vectors of the virus, contributing even more to the spread of the disease and further collapse the healthcare system with the new cases yet to come. 23
On the other hand, as proposed by Seifried and Ciesek, 24 a pool testing strategy could potentially increase worldwide testing capacity many times over, thus, boosting a country's capacity to test mild to asymptomatic individuals. This strategy proposes that instead of individually testing patients with low clinical suspicion of SARS‐CoV‐2, samples are pooled together in what is called a minipool, and then tested together running a single RT‐PCR for all the unified samples. Preliminary results show that there is no dilution and no decrease on test sensitivity when minipools of five samples each are used, 24 and since the RT‐PCR looks directly at the viral ARN, a negative result in a pool test is reliable. Thus, discarding the infection in all the patients included in the pooled sample. On the other hand, if a group tests positive, then a round of individual tests to each patient is performed to track the individuals with the infection in that specific pool of samples. With this strategy, mass testing becomes a not so prohibitive public health measure, especially in settings where access to the tests is not optimal. This way, massive savings on particular test kits can be done and can quickly enable to better estimate the number of people that are actually infected. This methodology has shown to be an effective strategy for screening other pathogens that affected humans before the outbreak, such as HIV, malaria, chlamydia, and influenza. 25 However, some studies suggest that the pooling of the sample should be kept as low as possible to reduce dilution and maintain the sensitivity of the test. 26 , 27
Since the scope of this strategy could potentially increase multiple times the testing capacity of a country, it becomes prudent to explore how to optimize the implementation of it in the healthcare setting. Therefore, the aim of this study is to provide a mathematical model to estimate the optimum number of pooled samples according to the specific prevalences of positive tests in a particular country context, in order to save as many tests as possible and cover as many people as possible, knowing that if a group tests out positive, all the individuals of the sample would have to be individually tested. It is important to highlight that this model is based on the prevalence of positive tests and can be adapted to each country's specific prevalence. However, it is best implemented for countries with a large number of confirmed cases and relatively large number of tests performed on a daily basis, since more data on the specific prevalence of positive yielding results are available and more accurate estimations can be done based on this; rather than countries with a low number of confirmed cases or where the implementation of testing the population has not been the most adequate.
The manuscript is arranged in the following way: in Section 2, the materials and methods are introduced. In Section 3, the results are given together with the discussion. Finally, the final remarks are presented in Section 4.
2. MATERIALS AND METHODS
Thoughtful description of the process and reasoning for obtaining a formula that represents the benefit of performing a pool test of the most optimum size assuming in advance that if a group tests out positive, all the subjects in the group have to be individually tested, in order to track down the positive case or cases, while if a group tests out negative, then no further testing in that specific group is needed. All the computations were performed with the software Wolfram Mathematica. 28
2.1. Model
Considering that the sample of each suspected individual tested for the infection of SARS‐CoV‐2 with the RT‐PCR could yield either a negative or positive result, and that performing a pool testing strategy could yield a negative result only when all the samples included in the pool sample are negative, and that it will yield a positive result when at least one of the individual samples is positive, the possible diagnostic scenarios for the pool test can be expressed by the binomial expression of
| (1) |
where x represents the probability of subjects with an individual positive test (prevalence of positives), y represents the probability of subjects with an individual negative test (prevalence of negatives), and n is size of the pool group. Such that n > 1, 0 < x < 1, and y = 1 − x. Under these assumptions, we obtain that D = 1. Note that the breakdown of this expression will hold all the possible events. This will be represented by the addends, and the combination present in these will be determined by x and y and its respective exponent, which will indicate the number of subjects with a positive or negative sample, respectively. The distribution of the possibilities will depend on the prevalence of the disease, in this case, being the percentage of positive test results obtained from the recent historical data available. For this reason, the probability of each expressed event occurring, will be determined by the substitution of x and y by the respective prevalences of positive and negative tests. Now, let us separate Equation (1) in two parts
| (2) |
Here, the negative groups for the pool test and its probability will be represented by y n , while the pool tests that yield a positive will correspond to all the other cases where there is at least one individual positive sample in the pool, having, therefore, a 1 − y n probability of becoming true. To facilitate the use of Equation (3), it will be expressed as a function of x, which relates to the direct prevalence of positive historical testing for each country, so that it can be inputted in the equation. Therefore, considering that every time a pool test yields a negative result, no further testing will be performed to that group, the saved tests of the otherwise individually tested subjects, will be expressed as n − 1, while if the pool test yields a positive result, every subject in the pooled group will have to be tested individually, thus wasting one test. Based on this, the number of saved tests for each group can be expressed as a net gain per group of pool test (NGpt):
| (3) |
Developing further, if the NGpt strategy is divided by the subjects included in the group, then the net gain per subject tested (NGst) is obtained:
| (4) |
Finally, to obtain the average minimum number of tests needed to diagnose one person using a pool testing strategy (z), the NGst has to be subtracted from 1 (the total):
| (5) |
To obtain the optimum group size given the prevalence of positive tests (x) in a determined setting, the minimal global of Equation (5) must be obtained. This minimum value is calculated using x as the input, because x is a continuous variable, while n is a discrete one.
Figure 1 shows a contour plot of the average minimum number of tests in, z, as a function of x and n. The color code represents the different values of the z function. We can observe different regimes with higher values for large values of x and n.
Figure 1.
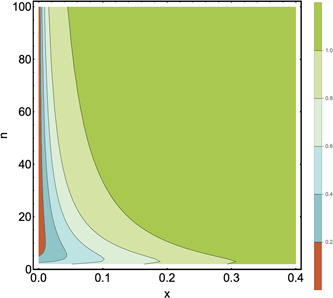
Contour plot of the average minimum number of tests per subject to diagnose one subject. Horizontal‐axis: prevalence of positive tests, x, the interval ranges from 0 to 0.4. Vertical‐axis: group size, n. The interval ranges from 2 to 100. The average minimum number of tests per subject to diagnose one subject is represented by the colors, where higher and better values go from green to orange, being orange the closest to the optimum
Figure 2 shows the average minimum number of tests as a function of the size group n for different values of x. It is clear that there is an optimal value of n in which the function z has a global minimum. We have numerically tested that the minimum for finite value of n is only until x = 0.3. For higher values of x, the minimum of z is when n tends to infinity, and therefore the model is no longer useful.
Figure 2.
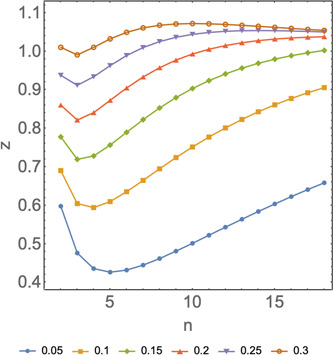
Average minimum number of tests as a function of the group size n for different values of x. Horizontal axis: number of subjects included in a pooled sample, n. Vertical axis: average minimum number of tests per subject to diagnose 1 subject, z. Different colors represent the different prevalences, x, and the shape of the curve represents how the model behaves in function of n at the specific prevalences listed on the figure
Let us remark that, knowing the average minimum number of tests per subject needed to diagnose one subject, then the population covered by one test using a pool testing strategy according to the optimal pool size previously calculated (and addressing the fact that when a group yields a positive result, the whole group has to be individually tested), can be expressed as
3. RESULTS AND DISCUSSION
With the model proposed above, different scenarios were tested according to different prevalences of positive tests. This was done to address the fact that each country presents a unique distribution of daily performed tests and positive results. According to this, the optimum size and average minimum tests per subject to detect a positive for the diverse chosen prevalence scenarios were calculated. Then, it was further compared to the individual testing strategy and how many more positive results could be detected using pool testing, with the same amount of tests, thus, addressing the efficiency of the strategy over individual testing, as shown on Table 1.
Table 1.
Optimum group size and additional subjects diagnosed for every 100 tests using pool testing strategy compared as to individual testing
| Prevalence of positive tests using historical data (x) | Optimum group size(n) | Average minimum number of tests per subject to diagnose 1 subject (z) | Positive subjects detected for every 100 individual tests performed | Positive subjects detected for every 100 tests performed using test and retest strategy | Additional positive subjects detected for every 100 tests using pooled samples rather that individual samples |
|---|---|---|---|---|---|
| 0.01 | 11 | 0.196 | 1 | 5.12 | 4.12 |
| 0.02 | 8 | 0.274 | 2 | 7.29 | 5.29 |
| 0.03 | 6 | 0.334 | 3 | 8.99 | 5.99 |
| 0.04 | 6 | 0.384 | 4 | 10.42 | 6.42 |
| 0.05 | 5 | 0.426 | 5 | 11.73 | 6.73 |
| 0.06 | 5 | 0.466 | 6 | 12.88 | 6.88 |
| 0.07 | 4 | 0.502 | 7 | 13.95 | 6.95 |
| 0.08 | 4 | 0.534 | 8 | 14.99 | 6.99 |
| 0.09 | 4 | 0.564 | 9 | 15.95 | 6.95 |
| 0.1 | 4 | 0.594 | 10 | 16.84 | 6.84 |
| 0.15 | 3 | 0.719 | 15 | 20.86 | 5.86 |
| 0.2 | 3 | 0.821 | 20 | 24.35 | 4.35 |
| 0.25 | 3 | 0.911 | 25 | 27.43 | 2.43 |
| 0.3 | 3 | 0.99 | 30 | 30.29 | 0.29 |
On the other hand, given the optimum group sizes calculated for the chosen prevalence scenarios, the population covered by a 100 tests was calculated using the average minimum test per subject to detect a positive, and was compared the 100 subjects that an individual testing strategy would cover, as it is exposed in Table 2.
Table 2.
Population covered using both strategies according to the optimum group size and average minimum test needed to detect a positive result
| Prevalence of positive tests using historical data (x) | Average minimum number of tests per subject to diagnose 1 subject (z) | Subjects tested in 100 tests using individual testing | Subjects tested in 100 tests using pool testing according to optimum group number |
|---|---|---|---|
| 0.01 | 0.196 | 100 | 511.5 |
| 0.02 | 0.274 | 100 | 364.7 |
| 0.03 | 0.334 | 100 | 299.8 |
| 0.04 | 0.384 | 100 | 260.5 |
| 0.05 | 0.426 | 100 | 234.6 |
| 0.06 | 0.466 | 100 | 214.6 |
| 0.07 | 0.502 | 100 | 199.2 |
| 0.08 | 0.534 | 100 | 187.4 |
| 0.09 | 0.564 | 100 | 177.2 |
| 0.1 | 0.594 | 100 | 168.4 |
| 0.15 | 0.719 | 100 | 139.0 |
| 0.2 | 0.821 | 100 | 121.8 |
| 0.25 | 0.911 | 100 | 109.7 |
| 0.3 | 0.99 | 100 | 101.0 |
As exposed in the results, the lower the prevalence of positive tests for a particular country is, the more tests that can be saved and the larger the pool groups will be. From prevalences ranging from 0.03 to 0.07, the testing capacity of a country using a pool testing strategy is increased by a factor of two or by a factor three, rather than using individual testing. This could bring unprecedented advances in better understanding the disease and how it distributes on a particular population. From prevalence ranging from 0.08 to 0.2, the net saving of test kits using pool testing strategy is still significant, saving around 46.6% to 17.9% of the tests if an individual testing strategy were to be performed in the same number of subjects, thus, covering a greater portion of the population. However, as prevalence rises, the efficiency of the strategy flattens. Reaching a prevalence over 0.25, the net saving of tests is still significant. However, separating the samples, creating pool groups, tracking individuals in the groups that yielded a positive result, and retesting all those subjects individually, suppose logistical challenges that every healthcare center must weigh to implement this strategy over the most likely already implemented individual testing strategy. Finally, reaching a prevalence near 0.3, the pool testing strategy becomes similar to the individual testing strategy, thus losing its effectiveness and becoming a logistical problem, rather than optimizing the testing protocols. This is mainly because in the model proposed, whenever a group tests positive, all the individuals of the group should get retested to track the positive subject or subjects in the pooled sample. Therefore, the more positive individuals there are in the population, the highest positive pool tests there will be. Thus, more tests will be lost, and more tests will be used in retesting the positive pool samples. Notice that for large positive groups, further subgrouping and pool testing of those subgroups could be implemented. This could potentially save even more tests; however, it is believed that this approach might suppose a difficult logistical challenge that the progressively collapsing healthcare systems worldwide might not be able to cope for now.
As of 19 April 2020, most countries have prevalences of positive tests that range around 0.1 to 0.2 of all the tests daily performed 29 so a pool testing strategy is still a plausible strategy to implement on a national level. However, for the analysis, the overall historical prevalence was used as a country scenario, but when subjects are further stratified according to clinical suspicion, a lower prevalence of positive tests are expected in lower clinical suspicion groups, so the pool testing strategy could be best implemented in this stratified subgroup rather than the whole population. As it was previously exposed, lower prevalence of positive tests, show greater efficiency in the test use, however, with larger group sizes. One of the main critiques to the pool testing strategy, is the dilution that occurs when pooling the samples together, and how this dilution might affect the test sensitivity. Previous studies have shown that there is no decrease in sensitivity for RT‐PCR in detecting other viruses when using pool samples of 10 and 20 subjects, 30 however, as far as the available evidence on SARS‐CoV‐2 show, samples of five subjects do not affect sensibility of RT‐PCR for detecting the virus. 24
The model proposes optimum group numbers that range from 11 to 3 subjects, depending on the individual prevalence. This exquisitely copes with the possibility that larger groups might decrease RT‐PCR sensitivity due to the dilution of the pooled sample and it has been proposed that to effectively implement poll testing strategy, the pooled samples should be kept as low as possible. 26 , 27 Further developing on this, the model predicts optimum groups of four and three subjects for the prevalence of positive tests that range from 0.1 to 0.2, which are the prevalence that most countries are reporting nowadays. Therefore, it adapts to the clinical reality that the frontline workers all over the world are experiencing on a daily basis.
Finally, as more information becomes available on how big the group sizes can be without compromising the test sensitivity, further stratifying subjects according to clinical suspicion and testing those patients with low clinical suspicion via pool testing strategy should become the goal. This, because the model shows greater optimization of test usage with low prevalence of positive tests, and as it should be expected, patients with lower clinical suspicion, will most likely show lower prevalence of positive tests, thus increasing the efficiency of the strategy. Thus, pool testing individuals for SARS‐CoV‐2 is a valuable strategy that could considerably boost a country's testing capacity, however, further studies are needed to address how large these groups can be, without losing sensitivity on the RT‐PCR.
4. FINAL REMARKS
This article proposed a simple and landed model to estimate the most optimum group number to implement pool testing strategy for SARS‐CoV‐2, according to the specific historical positive tests prevalence for a determined healthcare context. The aim of this model is to be implemented in different levels of healthcare facilities fighting the pandemic, given its flexibility to estimate the optimum group number, according to specific prevalence. These particular prevalences might differ from a healthcare facility to another, from one a city to another and might also differ from the country's overall outbreak status. Therefore, it helps to create a tailored to the context implementation of the pool testing strategy for testing individuals with suspected infection by SARS‐CoV‐2.
One of the main limitations of this study is that it assumes that the RT‐PCR for detecting SARS‐CoV‐2 has a 100% sensitivity to the viral ARN, when the evidence available shows sensitivity to be around 70%. 31 However, astonishing work is currently being done to improve test sensitivity; and addressing this non perfect sensitivity would greatly increase the complexity of the model.
Finally, it is worth mentioning the social implications that implementing pool testing might have. As the pandemic grows and more people get tested, implementing this testing strategy might not be well received by the general public, since patients most likely will want to know if their particular test yielded a positive or a negative result as soon as possible and will likely not accept their particular sample to be mixed with other samples. Therefore, it becomes crucial to develop a strong public health policy to inform the population, secure equal access, and best implement the strategy for the greater good.
CONFLICT OF INTERESTS
The authors declare that there are no conflict of interests.
ACKNOWLEDGMENTS
The authors are thankful to Dr Ricardo Segovia, MD (Hospital Regional de Arica Dr. Juan Noé Crevani), Prof Dr Gonzalo Valdés (Universidad de Tarapacá), and Prof Dr Rafael González (Universidad Mayor) for useful discussions and their critical reading of the manuscript. DL acknowledges partial financial support from Centers of excellence with BASAL/CONICYT financing, Grant AFB180001, CEDENNA.
Aragón‐Caqueo D, Fernández‐Salinas J, Laroze D. Optimization of group size in pool testing strategy for SARS‐CoV‐2: A simple mathematical model. J Med Virol. 2020;92:1988–1994. 10.1002/jmv.25929
REFERENCES
- 1. Zhou P, Yang XL, Wang XG, et al. A pneumonia outbreak associated with a new coronavirus of probable bat origin. Nature. 2020;579(7798):270‐273. 10.1038/s41586-020-2012-7 [DOI] [PMC free article] [PubMed] [Google Scholar]
- 2. Andersen KG, Rambaut A, Lipkin WI, Holmes EC, Garry RF. The proximal origin of SARS‐CoV‐2. Nat Med. 2020;26(April):450‐452. 10.1038/s41591-020-0820-9 [DOI] [PMC free article] [PubMed] [Google Scholar]
- 3. Lu R, Zhao X, Li J, et al. Genomic characterisation and epidemiology of 2019 novel coronavirus: implications for virus origins and receptor binding. Lancet. 2020;395(10224):565‐574. 10.1016/S0140-6736(20)30251-8 [DOI] [PMC free article] [PubMed] [Google Scholar]
- 4. World Health Organization . Statement on the second meeting of the International Health Regulations (2005) Emergency Committee regarding the outbreak of novel coronavirus (2019‐NCoV). Available from: www.who.int/news‐room/detail/30‐01‐2020‐sta
- 5. World Health Organization . Novel Coronavirus (2019‐ nCoV). Situation report – 90. Geneva: WHO; 19 April, 2020. Available from: https://www.who.int/docs/default‐source/coronaviruse/situation‐reports/20200419‐sitrep‐90‐covid‐19.pdf?sfvrsn=551d47fd_2 [Google Scholar]
- 6. Johns Hopkins Coronavirus Resource Center . COVID‐19 Map. Available from: https://coronavirus.jhu.edu/map.html. Accessed 19 April, 2020.
- 7. Corman VM, Landt O, Kaiser M, et al. Detection of 2019 novel coronavirus (2019‐nCoV) by real‐time RT‐PCR. Euro Surveill. 2020;25(3):1‐8. 10.2807/1560-7917.ES.2020.25.3.2000045 [DOI] [PMC free article] [PubMed] [Google Scholar]
- 8. Wang W, Xu Y, Gao R, et al. Detection of SARS‐CoV‐2 in different types of clinical specimens. JAMA. 2020:3‐4. 10.1001/jama.2020.3786 [DOI] [PMC free article] [PubMed] [Google Scholar]
- 9. Lu B, Liu J, Xiao Y, Shen Y, Shi C, Chen Y. Detection of SARS‐CoV‐2 by RT‐PCR in anal from patients who have recovered from coronavirus disease 2019. J Med Virol. 2019:0‐2. 10.1002/jmv.25875 [DOI] [PMC free article] [PubMed] [Google Scholar]
- 10. Zhang K, Jiang Y, Wang Y, et al. The presence of SARS‐CoV‐2 RNA in feces of COVID‐19 patients. J Med Virol. 2020:0‐2. http://www.ncbi.nlm.nih.gov/pubmed/32243607 [DOI] [PubMed] [Google Scholar]
- 11. Bachman J. Reverse‐transcription PCR (RT‐PCR). Methods in enzymology. 530, 1st ed. Elsevier Inc; 2020:67‐74. 10.1016/B978-0-12-420037-1.00002-6 [DOI] [PubMed] [Google Scholar]
- 12. Studdert DM, Hall MA. Disease control, civil liberties, and mass testing—Calibrating restrictions during the Covid‐19 pandemic. N Engl J Med. 2020:NEJMp2007637. 10.1056/NEJMp2007637 [DOI] [PubMed] [Google Scholar]
- 13. Peng L, Liu K, Xue F, Miao Y, Tu P, Zhou C. Improved early recognition of coronavirus disease‐2019 (COVID‐19): single‐center data from a Shanghai screening hospital. Arch Iran Med. 2020;23(4):272‐276. 10.34172/aim.2020.10 [DOI] [PubMed] [Google Scholar]
- 14. World Health Organization . Laboratory testing strategy recommendations for COVID‐19, 21 March, 2020. Available from: https://apps.who.int/iris/bitstream/handle/10665/331509/WHO‐COVID‐19‐lab_testing‐2020.1‐eng.pdf
- 15. The COVID Tracking Project . US Historical Data. Available from: https://www.covidtracking.com/data/us‐daily. Accessed 19 April, 2020.
- 16. Centers for Disease Control and Prevention, CDC . Testing in the U.S. Available from: www.cdc.gov/coronavirus/2019‐ncov/cases‐updates/testing‐in‐us.html. Accessed 19 April, 2020.
- 17. Hasell J, Ortiz‐Ospina E, Mathieu E, et al. To Understand the Global Pandemic, We Need Global Testing – the Our World in Data COVID‐19 Testing Dataset. Our World in Data, Oxford Martin School. Available from: https://www.ourworldindata.org/covid‐testing#source‐information‐country‐by‐country. Accessed 19 April, 2020.
- 18. Wang Y, Kang H, Liu X, Tong Z. Combination of RT‐qPCR testing and clinical features for diagnosis of COVID‐19 facilitates management of SARS‐CoV‐2 outbreak. J Med Virol. 2020:0‐2. 10.1101/2020.02.07.937862 [DOI] [PMC free article] [PubMed] [Google Scholar]
- 19. Wu Z, McGoogan JM. Characteristics of and important lessons from the coronavirus disease 2019 (COVID‐19) outbreak in China: Summary of a report of 72314 cases from the Chinese Center for Disease Control and Prevention. JAMA. 2020;2019, 10.1001/jama.2020.2648 [DOI] [PubMed] [Google Scholar]
- 20. Cai X, Xu Y, Yu K, et al. The clinical feature of silent infections of novel coronavirus infection (COVID‐19) in Wenzhou. J Med Virol. 2020;84:0‐3. http://www.ncbi.nlm.nih.gov/pubmed/32275074 [DOI] [PMC free article] [PubMed] [Google Scholar]
- 21. Rothe C, Schunk M, Sothmann P, et al. Transmission of 2019‐nCoV infection from an asymptomatic contact in Germany. N Engl J Med. 2020;382(10):970‐971. 10.1056/NEJMoa2001017 [DOI] [PMC free article] [PubMed] [Google Scholar]
- 22. Ye Q, Wang B, Mao J, et al. Epidemiological analysis of COVID‐19 and practical experience from China. J Med Virol. 2020;(March):1‐15. 10.1002/jmv.25813 [DOI] [PMC free article] [PubMed] [Google Scholar]
- 23. Ferguson NM, Laydon D, Nedjati‐Gilani G. Impact of non‐pharmaceutical interventions (NPIs) to reduce COVID‐ 19 mortality and healthcare demand. Imp Coll COVID‐19 Response Team. 2020;(March). https://www.imperial.ac.uk/mrc‐global‐infectious‐disease‐analysis/news‐‐wuhan‐coronavirus/ [DOI] [PMC free article] [PubMed] [Google Scholar]
- 24. Seifried E, Ciesek S. Pool testing of SARS‐CoV‐02 samples increases worldwide test capacities many times over. Aktuelles Aus Der Goethe Universitt Frankfurt. Available from: https://www.aktuelles.uni‐frankfurt.de/englisch/pool‐testing‐of‐sars‐cov‐02‐samples‐increases
- 25. Narayanan KR, Frost I, Heidarzadeh A, et al. Pooling RT‐PCR or NGS samples has the potential to cost‐effectively generate estimates of COVID‐19 prevalence in resource limited environments. medRxiv. 2020. 10.1101/2020.04.03.20051995 [DOI] [Google Scholar]
- 26. Muniesa A, Ferreira C, Fuertes H, Halaihel N, De Blas I. Estimation of the relative sensitivity of qPCR analysis using pooled samples. PLoS One. 2014;9(4):8‐12. 10.1371/journal.pone.0093491 [DOI] [PMC free article] [PubMed] [Google Scholar]
- 27. Westreich DJ, Hudgens MG, Fiscus SA, Pilcher CD. Optimizing screening for acute human immunodeficiency virus infection with pooled nucleic acid amplification tests. J Clin Microbiol. 2008;46(5):1785‐1792. 10.1128/JCM.00787-07 [DOI] [PMC free article] [PubMed] [Google Scholar]
- 28. Wolfram Research . Wolfram Mathematica V 12.1.0 (2019). Cambridge, United Kingdom. [Google Scholar]
- 29. Our World in Data . COVID‐19: Confirmed cases vs. tests conducted. Oxford Martin School, Available from: https://ourworldindata.org/grapher/covid‐19‐total‐confirmed‐cases‐vs‐total‐tests‐conducted. Accessed 19 April, 2020.
- 30. Silva J, Fernandes C, Marques A, et al. Evaluation of saliva pools method for detection of congenital human cytomegalovirus infection. J Virol Methods. 2020;275(October 2019):113759. 10.1016/j.jviromet.2019.113759 [DOI] [PubMed] [Google Scholar]
- 31. Zhao J, Yuan Q, Wang H, et al. Antibody responses to SARS‐CoV‐2 in patients of novel coronavirus disease 2019. SSRN Electron J. 2020. 10.1101/2020.03.02.20030189 [DOI] [PMC free article] [PubMed] [Google Scholar]