

Abstract
Objective
We systematically reviewed the computed tomography (CT) imaging features of coronavirus disease 2019 (COVID‐19) to provide reference for clinical practice.
Methods
Our article comprehensively searched PubMed, FMRS, EMbase, CNKI, WanFang databases, and VIP databases to collect literatures about the CT imaging features of COVID‐19 from 1 January to 16 March 2020. Three reviewers independently screened literature, extracted data, and assessed the risk of bias of included studies, and then, this meta‐analysis was performed by using Stata12.0 software.
Results
A total of 34 retrospective studies involving a total of 4121 patients with COVID‐19 were included. The results of the meta‐analysis showed that most patients presented bilateral lung involvement (73.8%, 95% confidence interval [CI]: 65.9%‐81.1%) or multilobar involvement (67.3%, 95% CI: 54.8%‐78.7%) and just little patients showed normal CT findings (8.4%). We found that the most common changes in lesion density were ground‐glass opacities (68.1%, 95% CI: 56.9%‐78.2%). Other changes in density included air bronchogram sign (44.7%), crazy‐paving pattern (35.6%), and consolidation (32.0%). Patchy (40.3%), spider web sign (39.5%), cord‐like (36.8%), and nodular (20.5%) were common lesion shapes in patients with COVID‐19. Pleural thickening (27.1%) was found in some patients. Lymphadenopathy (5.4%) and pleural effusion (5.3%) were rare.
Conclusion
The lung lesions of patients with COVID‐19 were mostly bilateral lungs or multilobar involved. The most common chest CT findings were patchy and ground‐glass opacities. Some patients had air bronchogram, spider web sign, and cord‐like. Lymphadenopathy and pleural effusion were rare.
Keywords: computed tomography, coronavirus disease 2019, imaging features, meta‐analysis, pneumonia, systematical review
Highlights
COVID‐19 cases now confirmed in multiple countries. It is critical to understand and identify the CT imaging features of COVID‐19 patients in order to help in early detection and isolation of infected individuals, as well as minimize the spread of the disease. Our comprehensive CT imaging features of COVID‐19 will inform healthcare providers in their efforts to treat patients and contain the current outbreak.
1. INTRODUCTION
Wuhan, China, became the center of an outbreak of the coronavirus disease 2019 (COVID‐19) in late December 2019. The epidemic of COVID‐19 has spread to the whole world within a short time. According to reports from the World Health Organization (WHO), up to 24:00 on 16 March 2020, a total of 80 881 confirmed cases and 3226 deaths were reported in China. 1 In addition, COVID‐19 has affected 150 countries, with 86 438 confirmed cases and 3388 deaths outside China. 2 With the further spread of COVID‐19, the confirmed cases of COVID‐19 in Korea, Japan, Spain, Italy, Iran, and other countries increased rapidly. The number of new confirmed cases, the cumulative number of confirmed cases, and deaths reported in the world outside China have surpassed that in China. COVID‐19 has become a serious threat to global health and a significant challenge to healthcare systems worldwide.
As a new infectious disease, there is no effective drugs and the vaccine is under development. Early detection, isolation, and treatment can maximize the control the spread of the disease among population. The current gold standard for COVID‐19 diagnosis is positive results of the nucleic acid amplification test (NAAT). However, there were many cases of positive results be confirmed after repeated NAAT negative, 3 and there were asymptomatic infections in patients with COVID‐19. 4 , 5 Asymptomatic infections may also become a new source of infection. Therefore, quickly and effectively diagnosing infections play a key role in preventing and controlling the epidemic. The guideline for the diagnosis and treatment of COVID‐19 (Trial edition Fifth), issued on 4 February, added clinical diagnostic criteria, that was, the suspected cases with typical imaging features in Hubei were clinically diagnosed cases. 6 Integrating the first to seventh edition of the guideline, imaging has been playing a pivotal role in the diagnosis and treatment of this disease. Especially in hospitals that cannot perform NAAT, imaging can be a powerful tool for admission screening. Therefore, grasping the imaging features of patients with COVID‐19 is of great significance for early screening and diagnosis, curbing the occurrence and development of the disease, and suppressing the speed of transmission.
Although many studies have been published on CT imaging of patients with COVID‐19, most of them were single‐center, and in the same hospital or region. Due to the different design and insufficient sample size, the imaging features of the published studies were different. Moreover, there is still lack evidence‐based medical evidence on the CT imaging features in patients with COVID‐19 to guide clinical practice. Therefore, we carried out this study to summarize the CT imaging features of COVID‐19, to provide reference for further clinical practice.
2. MATERIALS AND METHODS
2.1. Search databases and search strategies
This meta‐analysis was carried out according to Preferred Reporting Items for Meta‐Analyses of Observational Studies in Epidemiology (MOOSE) Statement. 7 PubMed, FMRS, EMbase, CNKI, WanFang databases, and VIP databases were electronically searched to collect studies about the CT imaging features of COVID‐19 from 1 January 2020 to 16 March 2020. We also manually searched the lists of included studies to avoid missing any eligible study. When duplicate studies describing the same population, the most detailed or recent study was included. There was no language restriction placed on the searches, but only literatures published online were included. The search used a combination of subject words and free words, and adjusted according to different database characteristics. The search terms included: “Coronavirus” OR “2019‐nCoV” OR “COVID‐19” OR “SARS‐CoV‐2.”
2.2. Inclusion and exclusion criteria
The inclusion criteria were as follows: (a) cohort studies, case‐control studies, and case series studies; (b) the study population was patients diagnosed with COVID‐19; and (c) the observation indicators were the imaging findings of chest CT or HRCT.
The exclusion criteria were as follows: (a) overlapping or duplicate studies; (b) had no clinical indicators or lacking necessary data which cannot be obtained even by contacting the author; and (c) case reports and studies with a sample size less than 30.
2.3. Data extraction and quality assessment
Three researchers independently searched and screened the studies, collected data, and cross‐checked. If there was a dispute, it was resolved through discussion or consultation with another researcher. The content of the data extraction included: the first author's surname, the date of publication of the article, study region/country, study design, sample size, age, and CT imaging features; relevant elements of bias risk assessment.
The included studies of this meta‐analyses were observational studies, so the British National Institute for Clinical Excellence (NICE) 8 was used to evaluate the study quality by two independent reviewers. This evaluation was conducted based on a set of eight criteria, and studies with a score greater than 4 were considered to be of high quality (total score = 8).
2.4. Statistical analysis
Meta‐analysis was performed using STATA 12 (StataCorp, College Station, TX). Original incidence rates r were transformed by the double arcsine method to make them conformed to normal distribution, and the resulting transformed rate tr was used in meta‐analysis. The heterogeneity between studies was analyzed using a χ 2 test (P < .10) and quantified using the I 2 statistic. When no statistical heterogeneity was observed, a fixed effects model was utilized. Otherwise, potential sources of clinical heterogeneity were identified using subgroup analysis and sensitivity analyses, these sources were eliminated and the meta‐analysis was repeated using a random effects model. Pooled incidence rates R were back‐calculated from transformed rates tr using the R = [sin (tr/2)]2. A two‐tailed P < .05 was considered statistically significant. Publication bias was evaluated using a funnel plot along with Egger's regression test and Begg's test.
3. RESULTS
3.1. Literature retrieval
A total of 4532 related articles were obtained in the initial retrieval. After a detailed assessment based on the inclusion and exclusion criteria, 34 retrospective studies including 4121 patients with COVID‐19 were included 9 , 10 , 11 , 12 , 13 , 14 , 15 , 16 , 17 , 18 , 19 , 20 , 21 , 22 , 23 , 24 , 25 , 26 , 27 , 28 , 29 , 30 , 31 , 32 , 33 , 34 , 35 , 36 , 37 , 38 , 39 , 40 , 41 , 42 (Figure 1).
Figure 1.
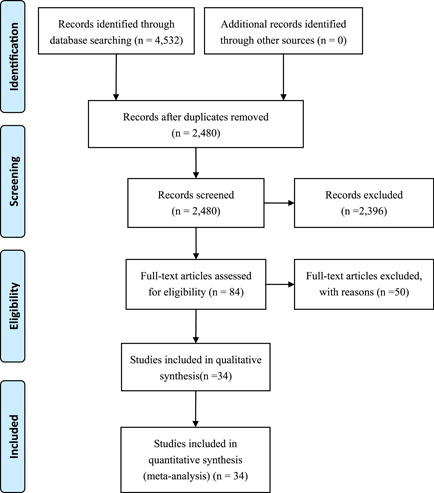
Flow chart of literature screening
3.2. Basic characteristics of included studies and quality evaluation
A total of 34 retrospective studies 9 , 10 , 11 , 12 , 13 , 14 , 15 , 16 , 17 , 18 , 19 , 20 , 21 , 22 , 23 , 24 , 25 , 26 , 27 , 28 , 29 , 30 , 31 , 32 , 33 , 34 , 35 , 36 , 37 , 38 , 39 , 40 , 41 , 42 that publicated from 6 February 2020 to 12 March 2020 were included. All studies were conducted in China, 16 of the studies included patients in Hubei Province, and the remaining 18 studies included patients in other provinces. All studies received quality scores of 5 to 8, indicating high quality (Table 1).
Table 1.
Basic characteristics of included studies
| Study | Publication date | Region (China) | Sample size (n) | Study population | Age, a y | Male (n) | Outcomes | Quality score |
|---|---|---|---|---|---|---|---|---|
| Guan et al 9 | Feb 28 | 31 Provinces | 1099 | COVID‐19 patients in 552 hospitals in 31 provinces/province‐level municipalities | 47.0 | 640 | ①②③ | 6 |
| Cheng et al 10 | Mar 12 | Hubei | 463 | COVID‐19 patients in wuhan Jinyintan Hospital | 15‐90 | 244 | ①②③④ | 6 |
| Gong et al 11 | Mar 9 | Chongqing | 225 | COVID‐19 patients in Chongqing University Three Gorges Hospital | 46.35 ± 16.1 | 125 | ①②③ | 6 |
| Yuan et al 12 | Mar 6 | Chongqing | 223 | COVID‐19 patients in Chongqing Public Health Medical Center | 46.5 ± 16.1 | 105 | ①③ | 6 |
| Zhou et al 13 | Mar 9 | Wuhan | 191 | COVID‐19 patients in Jinyintan Hospital and Wuhan Pulmonary Hospital | 18‐87 | 119 | ①②③ | 7 |
| Yang et al 14 | Feb 26 | Wenzhou | 149 | COVID‐19 patients in three tertiary hospitals of Wenzhou | 45.1 ± 13.4 | 81 | ①②③④ | 7 |
| Wu et al 15 | Mar 3 | Provinces | 130 | COVID‐19 patients in seven hospitals of China | 25‐80 | 78 | ①②③④ | 7 |
| Bernheim et al 16 | Feb 20 | 4 Provinces | 121 | COVID‐19 patients in four centers in China | 45(18‐80) | 61 | ①③④ | 8 |
| Zhao et al 17 | Feb 19 | Hubei | 101 | COVID‐19 patients in four cities in Hunan, China | 17‐75 | 56 | ①②③④ | 6 |
| Chen et al 18 | Feb 15 | Wuhan | 99 | COVID‐19 patients in Wuhan Jinyintan Hospital | 55.5 ± 13.1 | 67 | ①③ | 6 |
| Xu et al 19 | Feb 28 | Guangzhou | 90 | COVID‐19 patients in Guangzhou Eighth People's Hospital | 18‐86 | 39 | ①③④ | 6 |
| Li et al 20 | Feb 29 | Chongqing/Jinan | 83 | COVID‐19 patients in Chongqing/Jinan provinces | 45.5 | 44 | ①②③④ | 8 |
| Shi et al 21 | Feb 24 | Wuhan | 81 | COVID‐19 patients in Wuhan Jinyintan hospital or Union Hospital of Tongji Medical College | 49.5 | 42 | ①②③④ | 7 |
| Wu et al 22 | Feb 21 | Chongqing | 80 | COVID‐19 patients in Chongqing province | 44 ± 11 | 42 | ①②③④ | 7 |
| Wu et al 23 | Feb 29 | Jiangsu | 80 | COVID‐19 patients in the First and Second People's Hospital of Yancheng City, the Fifth People's Hospital of Wuxi | 46.1 | 39 | ① | 8 |
| Fang et al 24 | Feb 25 | Anhui | 79 | COVID‐19 patients in Infection Hospital of Anhui Provincial Hospital | 45.1 ± 16.1 | 45 | ① | 5 |
| Chen et al 25 | Mar 10 | Wuhan | 76 | COVID‐19 patients in Wuhan Puren Hospital | 28‐86 | 40 | ①③④ | 6 |
| Ma et al 26 | Mar 10 | Anhui | 75 | COVID‐19 patients in 4 hospitals in Fuyang city, Anhui province | 43.9 ± 15.1 | 46 | ①③④ | 7 |
| Pan et al 27 | Feb 6 | Wuhan | 63 | COVID‐19 patients in Tongji hospital | 44.9 ± 15.2 | 33 | ①②③ | 6 |
| Zhou et al 28 | Feb 19 | Wuhan | 62 | COVID‐19 patients in Tongji hospital | 52.8 ± 12.2 | 39 | ①②③④ | 6 |
| Wang et al 29 | Feb 25 | Zhejiang | 52 | COVID‐19 patients in the First Affiliated Hospital, Zhejiang University School of Medicine | 13‐73 | 29 | ①②③④ | 6 |
| Xu et al 30 | Feb 25 | Beijing/Hebei | 50 | COVID‐19 patients in 4 hospitals in Beijing/Hebei provinces | 43.9 ± 16.8 | 29 | ①③④ | 6 |
| Liao et al 31 | Feb 26 | Wuhan | 42 | COVID‐19 patients in Zhongnan Hospital of Wuhan University | 51.6 | 29 | ①②③④ | 6 |
| Xiong et al 32 | Mar 3 | Wuhan | 42 | COVID‐19 patients in Tongji Hospital | 49.5 ± 14.1 | 25 | ①②③④ | 5 |
| Liu et al 33 | Feb 18 | Hubei | 41 | COVID‐19 patients in Xiao chang First People's Hospital | 48.45 | 32 | ①②③④ | 6 |
| Huang et al 34 | Jan 24 | Wuhan | 41 | COVID‐19 patients in the designated hospital in Wuhan | 41‐58 | 30 | ① | 6 |
| Yu et al 35 | Feb 26 | Zhejiang | 40 | COVID‐19 patients in Wenzhou Sixth People's Hospital | 45.9 | 22 | ①②③ | 6 |
| Yu et al 36 | Feb 17 | Beijing | 40 | COVID‐19 patients in the 5th Medical Centre of Chinese PLA General Hospital | 39.9 ± 18.2 | 26 | ① | 6 |
| Zhang et al 37 | Mar 6 | Hebei | 40 | COVID‐19 patients in Hebei provinces | 49.33 ± 14.19 | 20 | ①④ | 5 |
| Cao et al 38 | Feb 28 | Wuhan | 36 | COVID‐19 patients in Zhongnan Hospital of Wuhan University | 72.45 ± 6.82 | 20 | ①②③④ | 6 |
| Huang et al 39 | Feb 28 | Guangdong | 35 | COVID‐19 patients in Guangdong Second People′s Hospital | 44.0 ± 15.2 | 19 | ①②③ | 6 |
| Wang et al 40 | Feb 19 | Wuhan | 32 | COVID‐19 patients in The Central Hospital of Xiaogan | 27‐78 | 16 | ①②③ | 6 |
| Zhong et al 41 | Feb 13 | Wuhan | 30 | COVID‐19 patients in Zhongnan Hospital of Wuhan University | 50.17 ± 17.6 | 18 | ①②③④ | 5 |
| Liu et al 42 | Feb 17 | Wuhan | 30 | COVID‐19 patients in the Affiliated Hospital of Jianghan University | 21‐59 | 10 | ①②③ | 6 |
Note: ① lesion distribution; ② lesion shapes; ③ lesion density; ④ accompanying signs.
Abbreviations: COVID‐19, coronavirus disease 2019; SD, standard deviation.
Reported variously as range or mean ± SD or median, and interquartile range (IQR) values.
3.3. Meta‐analysis results
3.3.1. Lesion distribution
There were 73.8% of the COVID‐19 patients presented bilateral lung involvement (95% CI: 65.9%‐81.1%) and multilobar involvement 67.3% (95% CI: 54.8%‐78.7%) (Figures 2 and 3). Single lung involvement (18.7%) and single lobe involvement (14.9%) were rare. A few patients showed normal CT manifestations(8.4%) (Figure 4 and Table 2).
Figure 2.
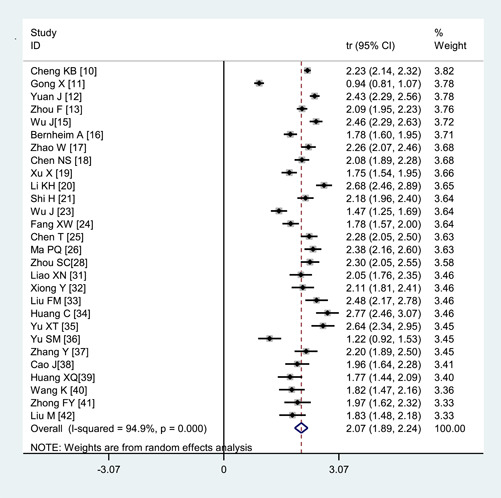
Transformed incidence rate of the indicator of bilateral lung involvement in patients with COVID‐19. COVID‐19, coronavirus disease 2019
Figure 3.
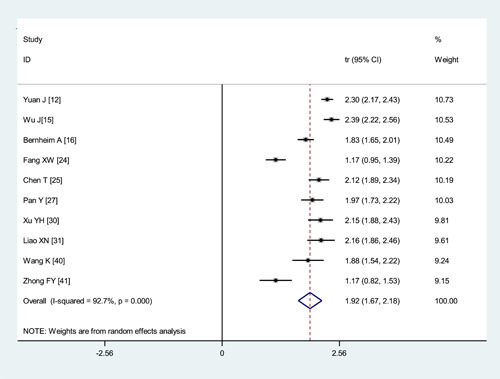
Transformed incidence rate of the indicator of multilobar involvement in patients with COVID‐19. COVID‐19, coronavirus disease 2019
Figure 4.
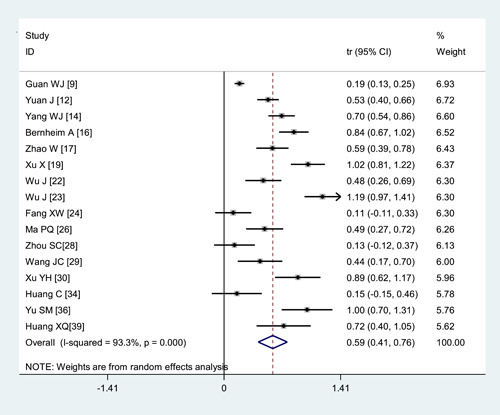
Transformed incidence rate of the indicator of normal CT manifestation in patients with COVID‐19. COVID‐19, coronavirus disease 2019
Table 2.
Meta‐analysis of different CT Imaging features in COVID‐19 patients
| Heterogeneity | Meta‐analysis | ||||||
|---|---|---|---|---|---|---|---|
| Outcomes | No. studies | No. patients | P | I 2 | Model | R (95% CI) | P |
| Lesion distribution | |||||||
| Single lung lesions | 22 | 1977 | <.001 | 81.6% | Random | .187 (0.147, 0.231) | <.001 |
| Bilateral lung lesions | 28 | 2628 | <.001 | 94.9% | Random | .738 (0.659, 0.811) | <.001 |
| Multilobar lesions | 10 | 846 | <.001 | 92.7% | Random | .673 (0.548, 0.787) | <.001 |
| Single lobe lesions | 9 | 629 | <.001 | 79.6% | Random | .149 (0.092, 0.217) | <.001 |
| Normal CT manifestation | 13 | 2195 | <.001 | 93.3% | Random | .084 (0.042, 0.139) | <.001 |
| Lesion shapes | |||||||
| Nodular | 8 | 739 | <.001 | 96.8% | Random | .205 (0.068, 0.391) | <.001 |
| Patchy | 8 | 2009 | <.001 | 94.1% | Random | .403 (0.298, 0.514) | <.001 |
| Cord‐like | 6 | 267 | <.001 | 87.3% | Random | .368 (0.217, 0.534) | <.001 |
| Spider web sign | 11 | 806 | <.001 | 92.9% | Random | .395 (0.272, 0.526) | <.001 |
| Lesion density | |||||||
| Ground‐glass opacities | 26 | 3574 | <.001 | 97.7% | Random | .681 (0.569, 0.782) | <.001 |
| Consolidation | 14 | 1637 | <.001 | 95.4% | Random | .320 (0.215, 0.434) | <.001 |
| Air bronchogram sign | 15 | 1075 | <.001 | 93.9% | Random | .447 (0.329, 0.568) | <.001 |
| Crazy‐paving pattern | 4 | 264 | <.001 | 95.8% | Random | .356 (0.113, 0.648) | <.001 |
| Accompanying signs | |||||||
| Pleural effusion | 17 | 1627 | .024 | 44.8% | Random | .053 (0.037, 0.073) | <.001 |
| Pleural thickening | 9 | 1077 | <.001 | 95.6% | Random | .271 (0.156, 0.405) | <.001 |
| Lymphadenopathy | 8 | 622 | <.001 | 82.0% | Random | .054 (0.022, 0.098) | <.001 |
Abbreviations: CI, confidence interval; COVID‐19, coronavirus disease 2019; CT, computed tomography.
3.3.2. Lesion shapes
The lesion shapes included patchy (40.3%, 95%CI: 29.8%‐51.4%), cord‐like (36.8%, 95% CI: 21.7%‐53.4%), nodular(20.5%, 95% CI: 6.8%‐39.1%), and spider web sign (39.5%, 95% CI: 27.2%‐52.6%) (Table 2).
3.3.3. Lesion density
The most common lesion density change was ground‐glass opacities (68.1%, 95% CI: 56.9%‐78.2%) (Figure 5). Other changes included air bronchogram sign (44.7%, 95% CI: 32.9%‐56.8%), crazy‐paving pattern(35.6%, 95% CI: 11.3%‐64.8%), and consolidation (32.0%, 95% CI: 21.5%‐43.4%) (Table 2).
Figure 5.
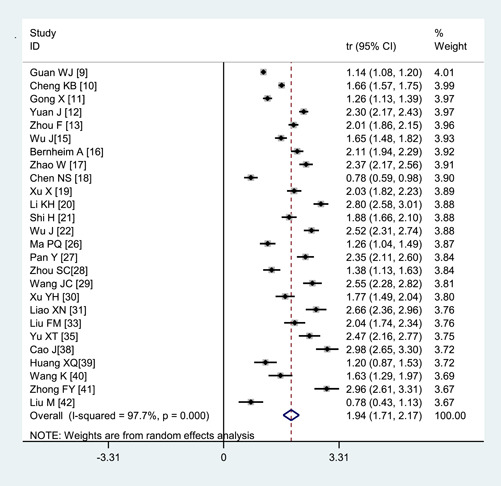
Transformed incidence rate of the indicator of ground‐glass opacities in patients with COVID‐19. COVID‐19, coronavirus disease 2019
3.3.4. Accompanying signs
Pleural thickening (27.1%, 95% CI: 15.6%‐40.5%) was found in some patients. Lymphadenopathy (5.4%, 95% CI: 0.022‐0.098), and pleural effusion (5.3%, 95% CI: 3.7%‐7.3%) were rare (Figure 6 and Table 2).
Figure 6.
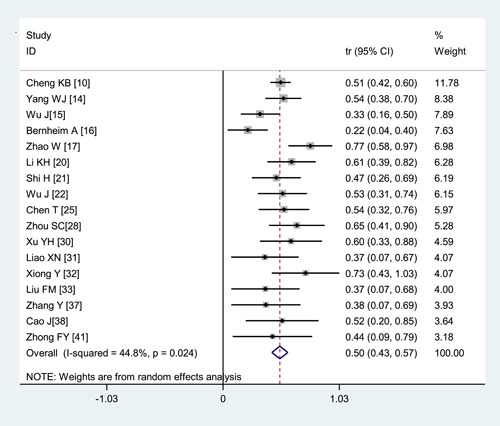
Transformed incidence rate of the indicator of pleural effusion in patients with COVID‐19. COVID‐19, coronavirus disease 2019
3.3.5. Subgroup analysis
This study showed significant heterogeneity. To explore the source of heterogeneity, subgroup analysis was performed. The results showed that the analysis results of the subgroups were basically consistent with the overall results, and there was no significant difference between the heterogeneity of the subgroups and the overall heterogeneity, which indicated that the study subject's location and sample size were not the main sources of heterogeneity (Table 3).
Table 3.
Subgroup analysis of different CT manifestations in COVID‐19 patients
| Heterogeneity | Meta‐analysis | ||||||
|---|---|---|---|---|---|---|---|
| Outcomes | No. studies | No. patients | P | I 2 | Model | R (95%CI) | P |
| Normal CT manifestation | |||||||
| Hebei province | 1 | 101 | <.001 | 94.4% | Random | .103 (0.050,0.174) | .067 |
| Other provinces | 12 | 094 | <.001 | 80.8% | Random | .022 (0.042,0.139) | <.001 |
| Bilateral lung lesions | |||||||
| Hebei province | 15 | 1367 | .001 | 61.5% | Random | .784 (0.743,0.822) | <.001 |
| Other provinces | 13 | 1261 | <.001 | 97.3% | Random | .690 (0.524,0.834) | <.001 |
| Ground‐glass opacities | |||||||
| Hebei province | 13 | 1271 | <.001 | 96.5% | Random | .688 (0.536,0.821) | <.001 |
| Other provinces | 13 | 2303 | <.001 | 98.3% | Random | .674 (0.503,0.823) | <.001 |
| Pleural effusion | |||||||
| Hebei province | 10 | 974 | .249 | 21.3% | Random | .036 (0.017,0.063) | <.001 |
| Other provinces | 7 | 653 | .002 | 66.8% | Random | .073 (0.054,0.095) | <.001 |
Abbreviations: CI, confidence interval; COVID‐19, coronavirus disease 2019; CT, computed tomography.
3.3.6. Sensitivity analysis
Sensitivity analysis was performed for the observation indicators of bilateral lung involvement, and statistics were recombined after excluding each study in turn. The results did not change substantially, suggesting that the results were stable (Figure 7).
Figure 7.
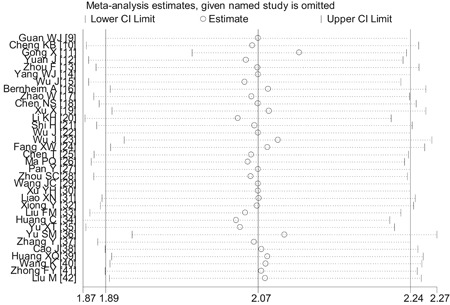
Sensitivity analysis of the indicator of bilateral lung involvement in patients with COVID‐19. COVID‐19, coronavirus disease 2019
3.4. Publication bias
The P values derived using Egger's and Begg's tests for all the observation indicators showed no obvious publication bias (Table 4). A funnel plot regarding the observation indicators of bilateral lung involvement showed the P values of Egger's and Begg's tests were .859 and .277, respectively, suggesting that the publication bias was not existed (Figure 8).
Table 4.
Evaluation of publication bias using Egger's and Begg's tests
| Characteristic | P (Egger's) | P (Begg's) | Characteristic | P (Egger's) | P (Begg's) |
|---|---|---|---|---|---|
| Single lung lesions | .037 | .090 | Ground‐glass opacities | .003 | .552 |
| Bilateral lung lesions | .859 | .277 | Consolidation | .053 | .228 |
| Multilobar lesions | .160 | .210 | Air bronchogram sign | .616 | .960 |
| Single lobe lesions | .952 | .754 | Crazy‐paving pattern | .429 | .734 |
| Nodular | .667 | .902 | Pleural effusion | .854 | .869 |
| Patchy | .328 | .386 | Pleural thickening | .062 | .910 |
| Cord‐like | .995 | .851 | Lymphadenopathy | .121 | .386 |
| Spider web sign | .049 | .138 | Normal CT manifestation | .404 | .964 |
Abbreviation: CT, computed tomography.
Figure 8.
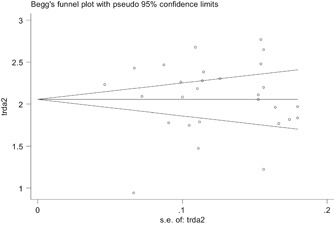
Evaluation of publication bias using a funnel plot based on the incidence rate of bilateral lung involvement
4. DISCUSSION
2019‐nCoV is one type of β‐coronavirus with a positive‐stranded single‐stranded RNA. 43 In the past two decades, humans have experienced three fatal coronavirus infections, including severe acute respiratory syndrome (SARS) in 2002, Middle East respiratory syndrome (MERS) in 2012, and COVID‐19. 44 The fatality rate of COVID‐19 was lower than SARS (9.6%) and MERS (35%), 45 , 46 , 47 but it's transmission ability was stronger. 48 Therefore, early diagnosis, isolation, and treatment of suspected or infected patients are of great significance for the prevention and control of COVID‐19. The current gold standard for COVID‐19 diagnosis is positive results of NAAT, viral gene sequencing, positive serum novel coronavirus‐specific Immunoglobulin M antibodies and Immunoglobulin G antibodies. However, such diagnostic methods also have some limitations, and not all hospitals can implement them. For example, NAAT can only make a positive diagnosis, but cannot judge the severity of the patients; when the viral load is low, it would make a false‐negative results; due to the sudden increase of a large number of suspected cases and the shortage of nucleic acid testing reagents, many patients will not be diagnosed in time. 49 However, compared with various limitations of NAAT, the lung CT examinations is timely, rapid, and has a high positive rate. 49 , 50 Most important of all, CT can be carried out in most hospitals. So thin‐layer CT scan of the lung is of great significance for the early diagnosis and assessment of COVID‐19.
In this study, we collected the latest articles up to 16 March 2020, included 34 retrospective studies 9 , 10 , 11 , 12 , 13 , 14 , 15 , 16 , 17 , 18 , 19 , 20 , 21 , 22 , 23 , 24 , 25 , 26 , 27 , 28 , 29 , 30 , 31 , 32 , 33 , 34 , 35 , 36 , 37 , 38 , 39 , 40 , 41 , 42 involving 4121 patients with COVID‐19 distribution in 31 provincial‐level regions in China. The results of meta‐analysis showed that most patients presented bilateral lung involvement or multilobar involvement. The most typical manifestations of chest CT were ground‐glass opacities, patchy, cord‐like, and nodular. Pleural thickening was found in some patients. Lymphadenopathy and pleural effusion were rare. These were basically consistent with the guideline for the diagnosis and treatment of COVID‐19. 6 Lin et al 51 also pointed out that the imaging findings of lungs appeared earlier than clinical symptoms, and the CT findings of lungs changed dynamically as the disease progressed, so CT imaging can reveal disease progression. Therefore, in different stages of the disease, CT can be used to evaluate the severity of the disease and efficacy of the treatment. 17 For patients with an epidemiological history, a CT scan of the lung should be performed even if there are no clinical symptoms or NAAT negative. If patients with epidemiological history are found that the CT of the lung has typical features such as ground‐glass opacities of the bilateral lungs or multiple lobes, they should be highly suspected they are with COVID‐19. The faster isolation measures should be taken, and further diagnosis and treatment should be performed as soon as possible to avoid the widespread of the disease or loss of treatment opportunities.
This study has several strengths including its large sample size and high quality of included studies. We conducted subgroup analysis according to studies' region and sample size. We also conducted sensitivity analysis by excluding each study one by one. The results did not change significantly, indicating the reliability and stability of our results. Nevertheless, some limitations should be noted in our meta‐analysis. First, most of our included studies are single‐center, which may have admission bias and selection bias. Second, most of our included studies did not clarify the inclusion or exclusion criteria, the course and severity of disease were not the same. Third, all the included studies were retrospective studies, we were unable to control the influence of confounding factors. Lastly, this meta‐analysis indicated a significant heterogeneity between the studies. But the subgroup analysis fails to eliminate all sources of heterogeneity, which may affect the accuracy of the results of meta‐analysis.
5. CONCLUSION
To sum up, most patients presented bilateral lung involvement or multilobar involvement. The most common changes were ground‐glass opacities and air bronchogram sign. Other common changes included patchy, spider web sign, and so forth. Lymphadenopathy and pleural effusion were rare. But due to the quality and quantity of included studies, the above conclusions need to be confirmed by more high‐quality studies.
AUTHOR CONTRIBUTIONS
Data curation was done by JP, PJ, and HL. JZ contributed to funding acquisition. JZ, ZZ, BL, and JZ contributed to methodology. PJ, HL, and JP provided the software. BL and JZ were involved in supervision. JZ and ZZ wrote the original draft. Reviewing and editing were done by BL and JZ.
CONFLICT OF INTERESTS
The authors declare that there are no conflict of interests.
ACKNOWLEDGMENTS
This study was supported by grants from the National Natural Science Foundation of China (81960343); the Emergency Science and Technology Brainstorm Project for the Prevention and Control of COVID‐19, which is part of the Guangxi Key Research and Development Plan (2020AB39028).
Zhu J, Zhong Z, Li H, et al. CT imaging features of 4121 patients with COVID‐19: A meta‐analysis. J Med Virol. 2020;92:891–902. 10.1002/jmv.25910
Jieyun Zhu and Zhimei Zhong contributed equally to this study.
Contributor Information
Bocheng Li, Email: lbc1550193401@163.com.
Jianfeng Zhang, Email: zhangjianfeng930@163.com.
REFERENCES
- 1. National Health Commission of the People's Republic of China . Update on the Novel Coronavirus Pneumonia Outbreak up to 24:00, March 16. 2020. Retrieved from http://www.nhc.gov.cn/xcs/yqfkdt/202003/28d026a0422844969226913ee3d56d77.shtml
- 2. WHO . Coronavirus disease 2019 (COVID‐19) Situation Report‐56. 2020. https://www.who.int/docs/default‐source/coronaviruse/situation‐reports/20200316‐sitrep‐56‐covid‐19.pdf?sfvrsn=9fda7db2_6
- 3. Chinese Medical Association . Some Opinions on the Low Positive Rate of Novel Coronavirus Nucleic Acid Detection. 2020. Retrieved from https://www.cma.org.cn/art/2020/2/18/art_2928_32767.html. Accessed 17 March 2020.
- 4. Xiao KF, Shui LL, Pang XH, et al. The clinical features of the 143 patients with COVID‐19in North‐East of Chongqing. J Third Mil Med Univ. 2020;1–6. 10.16016/j.1000-5404.202002097 [DOI] [Google Scholar]
- 5. Xiang TX, Liu JM, Xu F, et al. Analysis of clinical characteristics of 49 patients with novel coronavirus pneumonia in Jiangxi province. Chin J Respir CritCare Med. 2020;19(02):154–160. [Google Scholar]
- 6. National Health Commission Office . The Guideline for the Diagnosis and Treatment of Novel Coronavirus Pneumonia (Trial Edition Fifth). 2020. Retrieved from http://www.nhc.gov.cn/yzygj/s7653p/202002/3b09b894ac9b4204a79db5b8912d4440/files/7260301a393845fc87fcf6dd52965ecb.pdf. Accessed 17 March 2020.
- 7. Stroup DF. Meta‐analysis of observational studies inepidemiology: a proposal for reporting. JAMA. 2000;283(15):2008‐2012. 10.1001/jama.283.15.2008 [DOI] [PubMed] [Google Scholar]
- 8. Nice. Appendix 4 Quality of Case Series Form. 2020. Retrieved from https://www.nice.org.uk/guidance/cg3/documents/appendix‐4‐quality‐of‐case‐series‐form2
- 9. Guan W, Ni Z, Hu Y, et al. Clinical characteristics of 2019 novel corona virus infection in China. N Engl J Med. 2020;1–12. 10.1056/NEJMoa2002032 [DOI] [Google Scholar]
- 10. Cheng KB, Wei M, Shen H, et al. Clinical characteristics of 463 patients with common and severe type coronavirus disease 2019. Shanghai Med J. 2020;1–14. http://kns.cnki.net/kcms/detail/31.1366.r.20200312.1254.004.html [Google Scholar]
- 11. Gong X, Mou FZ, Wei DR, et al. The clinical characteristics and medication analysis of Corona Virus Disease 2019. World Chin Med. 2020;15(06):819–826. http://kns.cnki.net/kcms/detail/11.5529.R.20200309.1431.004.html [Google Scholar]
- 12. Yuan J, Sun YL, Zuo YJ, et al. Clinical characteristics of 223 novel coronavirus pneumonia cases in Chongqing. J Southwest Univ (Natural Sci Ed). 2020;1–7. http://kns.cnki.net/kcms/detail/50.1189.N.20200305.1429.004.html [Google Scholar]
- 13. Zhou F, Yu T, Du R, et al. Clinical course and risk factors for mortality of adult inpatients with COVID‐19 in Wuhan, China: a retrospective cohort study. Lancet. 2020;395:1054‐1062. 10.1016/S0140-6736(20)30566-3 [DOI] [PMC free article] [PubMed] [Google Scholar]
- 14. Yang W, Cao Q, Qin L, et al. Clinical characteristics and imaging manifestations of the 2019 novel coronavirus disease (COVID‐19): a multi‐center study in Wenzhou city, Zhejiang, China. J Infect. 2020;80:388‐393. 10.1016/j.jinf.2020.02.016 [DOI] [PMC free article] [PubMed] [Google Scholar]
- 15. Wu J, Feng CL, Xian XY, et al. Study on CT distribution characteristics and signs of 130 cases of coronavirus disease‐19. Chin J Tuberc Respir Dis. 2020;43(00):E030. 10.3760/cma.j.cn112147-20200217-00106 [DOI] [Google Scholar]
- 16. Bernheim A, Mei X, Huang M, et al. Chest CT findings in coronavirus disease‐19 (COVID‐19): relationship to duration of infection. Radiology. 2020.1–19. 10.1148/radiol.2020200463 [DOI] [PMC free article] [PubMed] [Google Scholar]
- 17. Zhao W, Zhong Z, Xie X, Yu Q, Liu J. Relation between chest CT findings and clinical conditions of coronavirus disease (COVID‐19) pneumonia: a multicenter study. AJR. 2020;214(5):1072–1077. 10.2214/AJR.20.22976 [DOI] [PubMed] [Google Scholar]
- 18. Chen N, Zhou M, Dong X, et al. Epidemiological and clinical characteristics of 99 cases of 2019 novel coronavirus pneumonia in Wuhan, China: a descriptive study. Lancet. 2020;395(10223):507‐513. [DOI] [PMC free article] [PubMed] [Google Scholar]
- 19. Xu X, Yu C, Qu J, et al. Imaging and clinical features of patients with 2019 novel coronavirus SARS‐CoV‐2. Eur J Nucl Med Mol Imaging. 2020;47(5):1275–1280. 10.1007/s00259-020-04735-9 [DOI] [PMC free article] [PubMed] [Google Scholar]
- 20. Li K, Wu J, Wu F, et al. The clinical and chest CT features associated with severe and critical COVID‐19 Pneumonia. Invest Radiol. 2020;1–29. 10.1097/RLI.0000000000000672 [DOI] [PMC free article] [PubMed] [Google Scholar]
- 21. Shi H, Han X, Jiang N, et al. Radiological findings from 81 patients with COVID‐19 pneumonia in Wuhan, China: a descriptive study. The Lancet. Infect Dis. 2020;20:425‐434. 10.1016/S1473-3099(20)30086-4 [DOI] [PMC free article] [PubMed] [Google Scholar]
- 22. Wu J, Wu X, Zeng W, et al. Chest CT findings in patients with corona virus disease 2019 and its relationship with clinical features. Investi Radiol. 2020;55:257‐261. 10.1097/RLI.0000000000000670 [DOI] [PMC free article] [PubMed] [Google Scholar]
- 23. Wu J, Liu J, Zhao X, et al. Clinical characteristics of imported cases of COVID‐19 in Jiangsu province: a multicenter descriptive study. Clin Infect Dis. 2020.1–23. http://nc.yuntsg.com/one1.do [DOI] [PMC free article] [PubMed] [Google Scholar]
- 24. Fang XW, Mei Q, Yang TJ, et al. Clinical characteristics and treatment analysis of 79 cases of COVID‐19. Chin Pharmacol Bull. 2020;36. (04):453–459. [Google Scholar]
- 25. Chen T, Jiang ZY, Xu W, et al. Clinical features and CT imaging analysis of 76 patients with corona virus disease 2019. J Jinan Univ (Natural Sci Medi Ed). 2020.1–5. http://kns.cnki.net/kcms/detail/44.1282.N.20200309.1228.002.html [Google Scholar]
- 26. Ma PQ, Yuan YS, Zhang L, et al. Manifestations of the initial chest CT and its association with laboratory tests in 75 COVID‐19 patients. Int J Med Radiol. 2020;1–4. 10.19300/j.2020.L18021 [DOI] [Google Scholar]
- 27. Pan Y, Guan H, Zhou S, et al. Initial CT findings and temporal changes in patients with the novel coronavirus pneumonia (2019‐nCoV): a study of 63 patients in Wuhan, China. Eur Radiol. 2020.1–4. http://nc.yuntsg.com/one1.do [DOI] [PMC free article] [PubMed] [Google Scholar]
- 28. Zhou S, Wang Y, Zhu T. CT features of coronavirus disease 2019 (COVID‐19) pneumonia in 62 patients in Wuhan, China. Am J Roentgenol. 2020;1–8. 10.2214/AJR.20.22975 [DOI] [PubMed] [Google Scholar]
- 29. Wang JC, Liu JP, Wang YY, et al. Dynamic changes of chest CT imaging in patients with corona virus disease‐19 (COVID‐19). J Zhejiang Univ (Med Sci). 2020.1–13. http://kns.cnki.net/kcms/detail/33.1248.R.20200225.1528.004.html [DOI] [PMC free article] [PubMed] [Google Scholar]
- 30. Xu YH, Dong JH, An WM, et al. Clinical and computed tomographic imaging features of novel coronavirus pneumonia caused by SARS‐CoV‐2. J Infect. 2020;80:394‐400. 10.1016/j.jinf.2020.02.017 [DOI] [PMC free article] [PubMed] [Google Scholar]
- 31. Liao XN, Zhou J, Cao J, et al. Chest CT features comparison between COVID⁃19 and bacterial pneumonia. Med J Wuhan Univ. 2020.41(03):349–352. [Google Scholar]
- 32. Xiong Y, Sun D, Liu Y, et al. Clinical and high‐resolution CT features of the COVID‐19 infection: comparison of the initial and follow‐up changes. Invest Radiol. 2020;1–36. 10.1097/RLI.0000000000000674 [DOI] [PMC free article] [PubMed] [Google Scholar]
- 33. Liu FM, Ding HL, Gong XM, et al. Chest CT performance and clinical characteristics of coronavirus disease 2019 (COVID‐19). Radiol Pract. 2020;(03):266–268. 10.13609/j.cnki.1000-0313.2020.03.001 [DOI] [Google Scholar]
- 34. Huang C, Wang Y, Li X, et al. Clinical features of patients infected with 2019 novel coronavirus in Wuhan, China. Lancet. 2020;395(10223):497‐506. 10.1016/S0140-6736(20)30183-5 [DOI] [PMC free article] [PubMed] [Google Scholar]
- 35. Yu XT, Ye H, Yang SF, et al. Chest CT features of COVID‐19. The J Pract Med. 2020.(02):106–112. [Google Scholar]
- 36. Yu SM, Cui YF, Wang ZX, et al. Analysis of the relationship between clinical features and tongue manifestations of 40 cases with novel coronavirus pneumonia. Beijing J Tradit Chin Med. 2020.(02):1–8. http://kns.cnki.net/kcms/detail/44.1193.R.20200225.1621.002.html 32227761 [Google Scholar]
- 37. Yan Z, Nan CR, Liu HX, et al. Re‐discussion about CT signs of novel coronavirus pneumonia. Clinical Focus. 2020.35(02):106–112. [Google Scholar]
- 38. Cao J, Zhou J, Liao XN, et al. Clinical characteristics and CT signs of corona virus disease 2019(COVID‐19) in the elderly. Med J Wuhan Univ. 2020.(02):1–4. http://kns.cnki.net/kcms/detail/42.1677.R.20200227.1000.002.html [Google Scholar]
- 39. Huang XQ, Nie LH, Li FM, et al. Analysis of Chinese medical characteristics of 35 patients with novel coronavirus pneumonia. J Emergen Tradit Chin Med. 2020.26(03):381–383+398. [Google Scholar]
- 40. Wang K, Kang SR, Tian RH, et al. CT characteristic appearances of patients with novel coronavirus pneumonia. Chin J Clin Med. 2020;27:27‐31. [Google Scholar]
- 41. Zhong FY, Zhang HF, Wang BC, et al. CT findings in 2019 novel coronavirus disease (COVID‐19) patients. Med J Wuhan Univ. 2020.41(03):345–348. [Google Scholar]
- 42. Liu M, He P, Liu HG, et al. Clinical characteristics of 30 medical workers infected with new coronavirus pneumonia. Zhonghua Jie He He Hu Xi Za Zhi. 2020;43:E016. [DOI] [PubMed] [Google Scholar]
- 43. Su S, Li XC, Hao H, et al. Advances in research on SARS‐CoV‐2. J Xi'an Jiaotong Univ (Med Sci). 2020.(02):1–8. http://kns.cnki.net/kcms/detail/61.1399.R.20200224.0944.010.html [Google Scholar]
- 44. Munster VJ, Koopmans M, van Doremalen N, van Riel D, de Wit E. A novel coronavirus emerging in China—key questions for impact assessment. N Engl J Med. 2020;382(8):692‐694. [DOI] [PubMed] [Google Scholar]
- 45. Special expert group for control of the epidemic of novel coronavirus pneumonia of the Chinese preventive medicine association . An update on the epidemiological characteristics of novel coronavirus pneumoniaCOVID‐19. Zhonghua Liu Xing Bing Xue Za Zhi. 2020;41(2):139‐144. [DOI] [PubMed] [Google Scholar]
- 46. Hui DSC, Zumla A. Severe acute respiratory syndrome: historical, epidemiologic, and clinical features. Infect Dis Clin North Am. 2019;33(4):869‐889. [DOI] [PMC free article] [PubMed] [Google Scholar]
- 47. Azhar EI, Hui DSC, Memish ZA, Drosten C, Zumla A. The Middle East respiratory syndrome(MERS). Infect Dis Clin North Am. 2019;33(4):891‐905. [DOI] [PMC free article] [PubMed] [Google Scholar]
- 48. Corman VM, Landt O, Kaiser M, et al. Detection of 2019 novel coronavirus (2019‐nCoV) by real‐time RT‐PCR. Euro Surveill. 2020;25(3):2000045. 10.2807/1560-7917 [DOI] [PMC free article] [PubMed] [Google Scholar]
- 49. Dai WC, Zhang HW, Yu J, et al. CT imaging and differential diagnosis of COVID‐19. Can Assoc Radiol J. 2020;71:195‐200. 10.1177/0846537120913033 [DOI] [PMC free article] [PubMed] [Google Scholar]
- 50. Li Y. Coronavirus disease 2019 (COVID‐19): role of chest CT in diagnosis and management. AJR. 2020;1–7. 10.2214/AJR.20.22954 [DOI] [PubMed] [Google Scholar]
- 51. Lin C, Ding Y, Xie B, et al. Asymptomatic novel coronavirus pneumonia patient outside Wuhan: the value of CT images in the course of the disease. Clin Imaging. 2020;63(2):7‐9. 10.1016/j.clinimag.2020.02.008 [DOI] [PMC free article] [PubMed] [Google Scholar]