

Abstract
The coronavirus disease 2019 epidemic started in Italy by the end of January 2020 and, after 1 month, it affected 1049 persons. Based on the Italian Ministry of Health data, we reconstructed the daily course of virus‐positive cases and deaths over March 2020 for the whole of Italy, 19 regions and 2 provinces. From 29 February to 31 March, there was a 100.9‐fold increase in the cumulative number of cases and a 428.6‐fold increase in the number of deaths in Italy. When plotted on a semilogarithmic scale, the curves tended to diverge from linearity with 23%, 16%, and 7% average daily increases during the three decades of March. Similarly, the number of deaths decreased from an average daily growth of 19% over the second decade to 10% over the third decade. The correlation coefficients relating the days to cases or deaths over each one of the three decades approached unity. As inferred from the equations of the regression lines relative to the three decades, the doubling times of cases were 3.4, 5.1, and 9.6 days, respectively. The doubling times of deaths over the second and third decades were 4.9 and 7.0 days, respectively. There was a broad geographic variability, with a striking gradient from the North, where 40.8% of cases and 57.9% of deaths occurred in Lombardy, to the South. On the whole, over March there was a trend to epidemic growth decline but the time for the end of the epidemic will depend on a variety of factors and, at present, it is unpredictable.
Keywords: coronavirus disease 2019 (COVID‐19), epidemic, geographic variability, Italy, severe acute respiratory syndrome coronavirus 2 (SARS‐CoV‐2)
Highlights
Italy was the first western country to experience the coronavirus disease 2019 (COVID‐19) epidemic.
A 100,000‐fold increase in cumulative cases and a 429‐fold increase in the cumulative number of deaths were recorded in Italy over the month of March 2020.
Even on a semilogarithmic scale, the curves showing the cumulative numbers of both cases and deaths tended to diverge from linearity.
The average daily increases of cumulative cases during the 3 decades of March were 23%, 16%, and 7%, whereas those of deaths during the 2nd and 3rd decades were 19% and 10%, respectively.
As inferred from the equations of the regression lines relative to the 3 decades, the doubling times of cases were 3.4, 5.1 and 9.6 days, respectively, whereas the number of deaths doubled every 4.9 days during the 2nd decade and every 7.0 days during the 3rd decade.
Drawing morbidity and mortality data individually in 19 Italian regions and 2 provinces showed a broad geographic variability, with a striking gradient from North to South.
1. INTRODUCTION
The coronavirus disease 2019 (COVID‐19) epidemic, caused by severe acute respiratory syndrome coronavirus 2 (SARS‐CoV‐2), officially started on 31 December 2019 in the city of Wuhan, in the Hubei province of China, 1 and thereafter spread to many other countries in the world according to asynchronous patterns, which is typical for infectious diseases due to multiple contagion sources. On 30 January 2020, the outbreak was declared a Public Health Emergency of International Concern; on 11 March, it was characterized as a pandemic by WHO, and in a matter of weeks, it affected over 100 countries. 2 The earliest appearance of COVID‐19 in Italy was on 30 January, when a couple of Chinese tourists were found to be positive for SARS‐CoV‐2 in Rome. 3 Thereafter, an outbreak of SARS‐CoV‐2 infections started in Lombardy on 21 February and it grew progressively over the national territory with striking regional differences. On 29 February, 1049 persons were positive for the presence of the virus in Italy. 4 Since 28 February, the national and regional authorities have implemented a series of directives concerning extraordinary interventions and hygienic guidelines. More and more stringent protocols have involved exceptional and unprecedented lockdown measures and the shutdown of most industrial and commercial activities, which is having a massive impact from social and economic standpoints.
The goal of the present study was to reconstruct the course and trends of the COVID‐19 epidemic in Italy and in all individual Italian regions over the month of March 2020.
2. METHODS
The number of COVID‐19 cases, confirmed by positivity for SARS‐CoV‐2 of nasopharyngeal swabs analyzed by reverse transcriptase‐polymerase chain reaction (RT‐PCR), and the number of deaths ascribed to COVID‐19 were taken from the daily reports of the Italian Ministry for Health. 4 The data were recorded for Italy (60 359 546 inhabitants as to January 2019) and for each Italian region. The monitored Northern Italian regions included Lombardia (Lombardy), Emilia Romagna, Veneto, Piemonte (Piedmont), Liguria (Ligury), Friuli Venezia Giulia (Friuli Venice Julia), and Valle d'Aosta (Aosta Valley). The two autonomous provinces of Trento and Bolzano were also included in the Northern Italian statistics. Central Italian regions included Marche (Marches), Toscana (Tuscany), Lazio (Latium), Abruzzo, and Umbria. Southern Italian regions included Campania, Puglia (Apulia), Calabria, Basilicata and Molise, and the Islands of Sicilia (Sicily) and Sardegna (Sardinia).
The available 1364 data were plotted on a semilogarithmic scale in 22 graphs reporting the daily course of cumulative cases and deaths for Italy and all the individual regions and provinces. The average daily increases in cases and deaths in Italy were evaluated by relating the data of each day to those of the previous day. The curves generated in Italy were subjected to regression analysis, and the doubling times of cases and deaths were inferred from the regression lines.
3. RESULTS
The graph reported in Figure 1 shows the cumulative numbers of COVID‐19 cases from 1 to 31 March and of deaths from 3 to 31 March over the whole national territory. The curve relative to cases (in blue) started with 1577 cases on 1 March and ended with 105 792 cases on 31 March. Even on a logarithmic scale, the curves tend to diverge from an exponential line by bending down with time. We divided the curve for cases into three periods, approximately corresponding to three decades, from 1 to 10 March, 11 to 21, and 22 to 31. The equations of the three regression lines were y = 1344.5e0.204×, y = 2787.9e0.137×, and y = 10 899e0.0721×, respectively. These regression lines are superimposed in blue color to the curve of cases in Figure 1. At a glance, they show that important changes in the slope of the regression lines occurred during the three periods. The determination coefficients turned out to be highly significant for all three periods (P < .001), with R 2 values of 0.998, 0.995, and 0.999, respectively. During the period from 1 to 10 March the ratio of cases recorded on each day to those on the previous day ranged between 1.11 and 1.46; during the period from 11 to 21 March they ranged between 1.13 and 1.23; during the period from 22 to 31 March they ranged between 1.04 and 1.10. The average values calculated for the first period are 1.23, for the second period they are 1.16, and for the third period, they are 1.07, which means that during the three periods there were average daily increases of 23%, 16%, and 7%, respectively.
Figure 1.
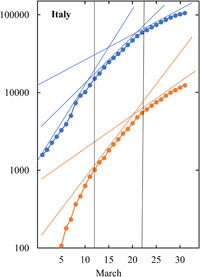
The graph shows the cumulative numbers of COVID‐19 cases (blue symbols), confirmed by positivity of nasopharyngeal swabs for SARS‐CoV‐2, and of deaths (red symbols) ascribed to COVID‐19 in Italy from 1 to 31 March 2020. The data are plotted on a semilogarithmic scale. Two vertical lines were traced in correspondence of 10 and 21 March, thus dividing the month into three periods, from 1 to 10 March, 11 to 21, and 22 to 31. The straight lines are the three regression lines for cases (in blue) and the two regression lines for deaths (in red). See text for details. COVID‐19, coronavirus disease 2019; SARS‐CoV‐2, severe acute respiratory syndrome coronavirus 2
The curve relative to deaths (in red) started with 52 deaths on 3 March and ended with 12 428 deaths on 31 March. We analyzed the data for the second and third decades according to the same criteria applied for the cases. The equations of the two regression lines were y = 2562.4e0.1418× and y = 587.32e0.0996×, respectively. These regression lines are superimposed in red color to the curve of deaths in Figure 1. At a glance, they show that an important change in the slope of the regression lines occurred during the two periods from 11 to 21 March and 22 to 31. The regression coefficients turned out to be highly significant over both periods (P < .001), with R 2 values of 0.993 and 0.997, respectively. Over the period from 11 to 21 March, the ratio of deaths recorded on each day to those on the previous day ranged between 1.13 and 1.31; over the period from 22 to 31 March, they ranged between 1.07 and 1.13. The average values calculated for the second period are 1.19 and those for the third period are 1.10, which means that there were average increases of 19%, and 10%, respectively. As inferred from the regression lines, the doubling times of cases in the periods from 1 to 10 March, 11 to 21, and 22 to 31 were 3.4, 5.1, and 9.6 days, respectively. The doubling times of deaths in the periods from 11 to 21 March and 22 to 31 were 4.9 and 7.0 days, respectively. The interval between the two curves ranged between 13 and 21 days, which should not be taken as the time elapsing between the diagnosis of the disease and death because the curve relative to cases also includes a 90% of survivors.
The map of Italy represented in Figure 2 reports the rank in the number of COVID‐19 cases in Italian regions and provinces by the end of March and shows their geographical localization. Detailed curves relative to cases and deaths, plotted on a semilogarithmic scale, are shown in Figure 3 for seven regions and two provinces in Northern Italy, in Figure 4 for five regions in Central Italy, and in Figure 5 for seven regions, two of which are insular, in Southern Italy. Note that different logarithmic scales were adopted for different pairs of panels due to graphical reasons. There is an evident gradient of both cases and deaths from the North to South. In particular, as of 31 March, four Northern regions accounted altogether for as much as 71.5% of cases and 81.8% of deaths. Specifically, 40.8% of cases and 57.9% of deaths occurred in Lombardy, 13.3% of cases and 13.2% of deaths occurred in Emilia Romagna, 8.6% of cases and 3.8% of deaths occurred in Veneto, and 8.8% of cases and 6.9% of deaths occurred in Piedmont. In the two autonomous provinces of Trento and Bolzano and in the nine regions of Valle d'Aosta, Abruzzo, Marche, Campania, Sicily, Sardinia, Calabria, Basilicata, and Molise, the earliest COVID‐19‐related deaths occurred after 10 March. In any case, no Italian region was free of cases after 5 March. The tabulated data for all regions are available daily in the dedicated website of the Italian Ministry of Health. 4 Although we could not proceed to a detailed analysis of regional data as we did for the whole national territory, the observation of the graphs reported in Figures 3, 4, 5 clearly shows that the curves diverged from linearity and tended to flatten with time in all regions or provinces.
Figure 2.
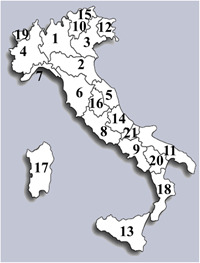
The map of Italy shows the geographical localization of the regions and provinces for which epidemiological data are given in Figures 3, 4, 5. Numbering follows the rank of COVID‐19 cases over the national territory by the end of March. COVID‐19, coronavirus disease 2019
Figure 3.
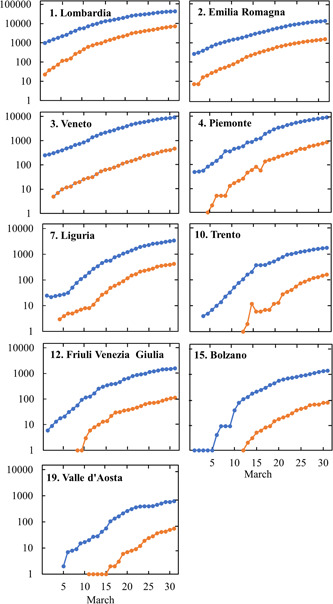
Cumulative numbers of COVID‐19 cases (blue symbols), confirmed by positivity of nasopharyngeal swabs for SARS‐CoV‐2, and of deaths (red symbols) ascribed to COVID‐19 in Northern Italian regions and provinces from 1 to 31 March 2020. The data are plotted on a semilogarithmic scale. The numbers next to the name of the region or province follow the rank of COVID‐19 cases over the national territory by the end of March. COVID‐19, coronavirus disease 2019; SARS‐CoV‐2, severe acute respiratory syndrome coronavirus 2
Figure 4.
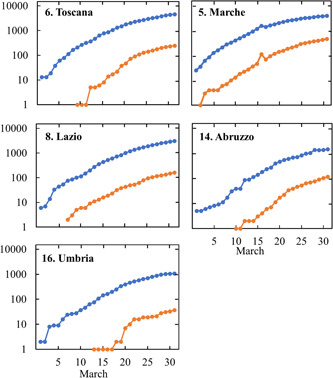
Cumulative numbers of COVID‐19 cases (blue symbols), confirmed by positivity of nasopharyngeal swabs for SARS‐CoV‐2, and of deaths (red symbols) ascribed to COVID‐19 in Central Italian regions from 1 to 31 March 2020. The data are plotted on a semilogarithmic scale. The numbers next to the name of the region follow the rank of COVID‐19 cases over the national territory by the end of March. COVID‐19, coronavirus disease 2019; SARS‐CoV‐2, severe acute respiratory syndrome coronavirus 2
Figure 5.
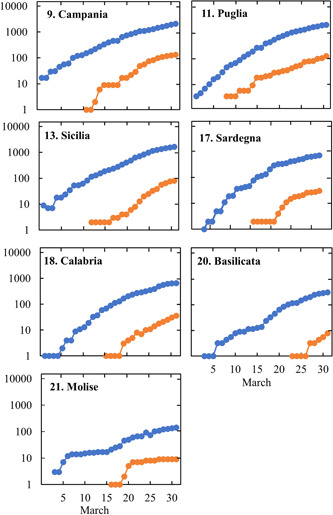
Cumulative numbers of COVID‐19 cases (blue symbols), confirmed by positivity of nasopharyngeal swabs for SARS‐CoV‐2, and of deaths (red symbols) ascribed to COVID‐19 in Southern Italian regions and islands from 1 to 31 March 2020. The data are plotted on a semilogarithmic scale. The numbers next to the name of the region follow the rank of COVID‐19 cases over the national territory by the end of March. COVID‐19, coronavirus disease 2019; SARS‐CoV‐2, severe acute respiratory syndrome coronavirus 2
4. DISCUSSION
At the end of March 2020, with 105 792 cases, Italy ranked second in the world after the United States and, with 12 428 fatal events, it was the first country in the world in terms of deaths ascribed to COVID‐19. 5 Of those cases, 14.9% recovered and 11.7% died. 4 From 29 February to 31 March there was a 100.9‐fold increase in the cumulative number of notified cases and a 428.6‐fold increase in the cumulative number of deaths.
With 100 000 cases in 1 month, the morbidity data for COVID‐19 are impressive and depict a dramatic scenario also for reasons that we discuss below, the actual numbers are likely to be substantially higher than the official ones. The magnitude of these figures should be evaluated in conjunction with the burden of seasonal influenza‐like illnesses (ILI). From the 42nd week of 2019 to the 11th week of 2020, more than 7 million ILI cases were reported in Italy. 6 Note that the estimated ILI cases during the past cold season would indicate that about 12% of Italians had been affected by ILI, which does not appear to be a particularly high proportion compared to other previous seasons.
A major problem with COVID‐19 is that, besides a bulk of mild cases, SARS‐CoV‐2 is a pneumotropic virus that causes a number of severe pneumonia requiring intensive hospital care. It is noteworthy that pneumonia of various etiologies, either bacterial or viral, is already an important cause of death in the Italian population. The World Health Rankings data published in 2017 reported that influenza and pneumonia deaths reached 13 823 or 2.61% of total deaths in Italy. 7 SARS‐COVIR‐2 is a highly contagious and aggressive agent that spreads freely in populations devoid of any specific immunological defences and is responsible for a quite high number of severe acute respiratory distress syndrome (ARDS) cases during a short period of time, which resulted in Italy in about 10% of patients requiring intensive care and respiratory support. 2 This circumstance results in high mortality and involves a tremendous overload of health structures and staff and of the general population as well.
The herein reported data suffer from several uncertainties and limitations. The first one is that the number of cases is affected by fluctuations due to problems in accuracy in the daily reports of new notifications from the individual Italian regions. Moreover, it just refers to the cases that were confirmed by molecular analyses, which is not feasible in all suspected situations. On 25 February, the Italian Ministry of Health moved to the decision of testing just the patients with more severe COVID‐19‐related symptoms and required hospitalization. 8 Accordingly, patients with less severe symptoms were no longer tested, which resulted in an apparent increase of fatality from 24 February (3.1%) to 17 March (7.2%). As to the end of March 2020, more than half a million swab tests were carried out in Italy. 4 , 9 Paucisymptomatic illnesses are not tested for the presence of SARS‐COVIR‐2 and, even more, a so‐far unquantifiable proportion of infections are fully asymptomatic. The iceberg phenomenon is a common event in many infectious diseases due to the presence of either healthy carriers, who do not develop any symptoms, or early carriers, who start to be contagious during the incubation period of the disease before the clinical onset. At the end of the epidemic, with the development of reliable and validated methodologies, it will be possible to carry out seroepidemiological studies and to analyze specific antibodies in broad population strata thereby evaluating the spread of the infection as related to gender, age, geographical distribution, working activities, etc. This will also be extremely useful to design preventive strategies for the future.
Another issue is that the number of deaths depends on how death certificates notify the ultimate cause of demise. The fact that death may be ascribed either to COVID‐19 or to pre‐existing pathological conditions has been a matter of debate. In fact, especially in the early phases of the epidemics, most deaths in SARS‐COVIR‐2‐infected individuals occurred in high‐risk old people suffering from severe polypathological conditions and in the elderly. As of 17 March, 87.9% of deaths in Italy had occurred in subjects over 70. 8 Countries other than Italy chose the option to ascribe most deaths in subjects affected by COVID‐19 to pre‐existing pathological conditions, which apparently leads to grossly different fatality rates in different geographical areas.
The comparison of cases and deaths in the Italian regions showed striking variations, which are likely to depend on the different timing in the onset of the local outbreaks before the implementation of national containment measures. Thus, the epidemic was much more important in Northern regions. Lombardy heavily contributed to the Italian burden of both cases (41.4% of all Italian cases at the end of March) and deaths (58.8%), with the first outbreak starting on 20 February in the municipality of Codogno in the province of Lodi. 10 The molecular characterization and phylogenetic analysis of the first three complete genomes of SARS‐CoV‐2 isolated from three patients in Lombardy suggested that SARS‐CoV‐2 could have been present in Italy weeks before the first reported cases of infection. 11
It should be noted that both national and regional data are the composite results of multiple outbreaks and clusters of cases, which often affect certain working categories, such as health personnel and people involved in public utility services, and communities, such as protected residences for the elderly. Every day the Italian Ministry of Health reports the updated number of SARS‐COVIR‐2‐positive cases in the individual provinces of each region. 4 For instance, within Lombardy an outstanding number of cases was recorded not only in the province of Milan, the regional capital (8911 cases as to 31 March, 3.26 million inhabitants, accounting for 273 cases/100 000), but even more in smaller provinces, such as Bergamo (8803 cases, 1.12 million inhabitants, accounting for 791 cases/100 000) and Brescia (8367 cases, 1.27 million inhabitants, accounting for 658 cases/100 000). We refer to reports communicated by the Italian Ministry of Health 4 and by the Italian National Institute of Health (Istituto Superiore di Sanità) 12 for a detailed analysis and graphical representation of data in all the individual Italian provinces.
As it is evident from the graphs shown in Figures 3, 4, 5, the dynamics of the epidemics followed a geographical differentiation, with a strong North to South gradient, although no region was free of cases and deaths at the end of March. In all regions, both morbidity and mortality curves tended to depart from linear lines and, even on a semilogarithmic scale, they flattened with time, thus highlighting a clear trend to an attenuation of the epidemic. The most heavily affected regions were those in which the earliest outbreaks had occurred, whereas other regions could benefit from the containment measures adopted at the national level. Over the whole national territory, the trend to an attenuation of the epidemic is documented by a progressive elongation of the time needed to double the cases, which was 3.4 days from 1 to 10 March, 5.1 days from 11 to 21 March, and 9.6 days from 22 to 31 March. Therefore, the doubling time of COVID‐19 cases confirmed by molecular analyses was extended 2.8 times from the first to the third decade of March. A similar trend was observed for the curve of deaths ascribed to COVID‐19 in Italy. In fact, the doubling time was 4.9 days in the second decade and 7.0 days in the third decade.
In conclusion, by the end of March 2020 the numbers of COVID‐19 cumulative cases and deaths were still growing in Italy. However, the herein reported data provide evidence that there is a time‐related trend of a progressive horizontalization of the regression lines. The regression line will hopefully become horizontal in the future thereby testifying to a zero growth in the number of cumulative cases. At present, the time for such an achievement is unpredictable. It will depend on how Northern regions will be able to attenuate the spread of SARS‐CoV‐2 in the population and on how the other Italian regions will avoid the risk of contagion by respecting the containment measures even at the expense of enormous familiar, social, productive, and economic sacrifices.
ACKNOWLEDGMENTS
We thank Alberto Abbondandolo (Fakultät für Mathematik, Ruhr‐Universität Bochum, Germany) for assistance in the mathematical analysis of data.
La Maestra S, Abbondandolo A, De Flora S. Epidemiological trends of COVID‐19 epidemic in Italy over March 2020: From 1000 to 100 000 cases. J Med Virol. 2020;92:1956–1961. 10.1002/jmv.25908
REFERENCES
- 1. Li Q, Guan X, Wu P, et al. Early transmission dynamics in Wuhan, China, of novel coronavirus‐infected pneumonia. N Engl J Med. 2020;382:1199‐1207. [DOI] [PMC free article] [PubMed] [Google Scholar]
- 2. Remuzzi A, Remuzzi G. COVID‐19 and Italy: what next? Lancet. 2020;395:1225‐1228. 10.1016/S0140-6736(20)30627-9 [DOI] [PMC free article] [PubMed] [Google Scholar]
- 3. Giovanetti M, Benvenuto D, Angeletti S, Ciccozzi M. The first two cases of 2019‐nCoV in Italy: where they come from? J Med Virol. 2020;92:518‐521. [DOI] [PMC free article] [PubMed] [Google Scholar]
- 4. Ministero della Sanità (Italian Ministry of Health) . http://www.salute.gov.it/imgs/C_17_notizie_4370_0_file.pdf
- 5. Johns Hopkins University of Medicine . Coronavirus Research Center. https://coronavirus.jhu.edu/map.html
- 6. Istituto Superiore di Sanità (Italian National Institute of Health) . Epicentro. https://www.epicentro.iss.it/influenza/stagione-in-corso
- 7. World Health Rankings . Italy: influenza and pneumonia. https://www.worldlifeexpectancy.com/italy-influenza-pneumonia
- 8. Onder G, Rezza G, Brusaferro S. Case‐fatality rate and characteristics of patients dying in relation to COVID‐19 in Italy. JAMA. 2020 Mar 23. 10.1001/jama.2020.4683 [DOI] [PubMed] [Google Scholar]
- 9. Livingston E, Bucher K. Coronavirus disease 2019 (COVID‐19) in Italy. JAMA. 2020 Mar 17;323:1335. 10.1001/jama.2020.4344 [DOI] [PubMed] [Google Scholar]
- 10. Grasselli G, Pesenti A, Cecconi M. Critical Care Utilization for the COVID‐19 outbreak in Lombardy, Italy: early experience and forecast during an emergency response. JAMA. 2020 Mar 13. 10.1001/jama.2020.4031 [DOI] [PubMed] [Google Scholar]
- 11. Zehender G, Lai A, Bergna A, et al. Genomic characterization and phylogenetic analysis of SARS‐COV‐2 in Italy. J Med Virol. 2020 Mar 29. 10.1002/jmv.25794 [DOI] [PMC free article] [PubMed] [Google Scholar]
- 12. Brusaferro S. COVID‐19. Epidemiological update. http://www.quotidianosanita.it/allegati/allegato9758575.pdf