

SUMMARY
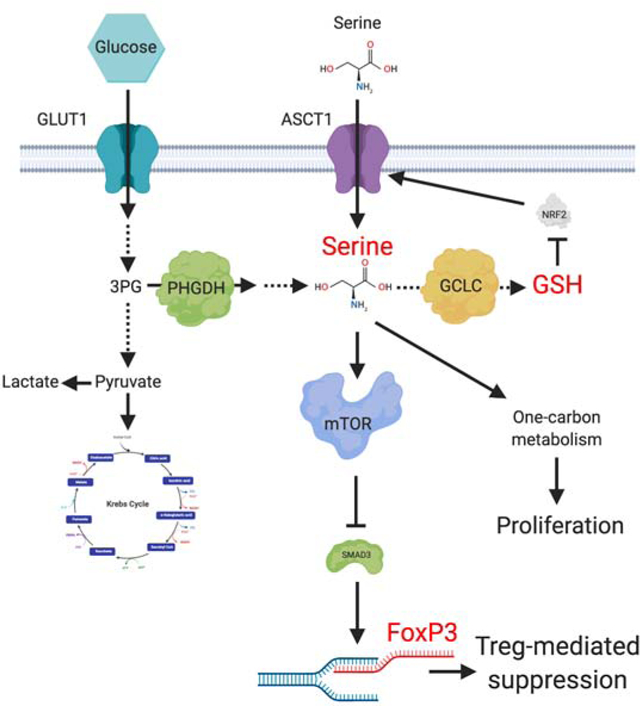
Regulatory T cells (Tregs) maintain immune homeostasis and prevent autoimmunity. Serine stimulates glutathione (GSH) synthesis and feeds into the one-carbon metabolic network (1CMet) essential for effector T cell (Teff) responses. However, serine’s functions, linkage to GSH, and role in stress responses in Tregs are unknown. Here we show, using mice with Treg-specific ablation of the catalytic subunit of glutamate cysteine ligase (Gclc), that GSH loss in Tregs alters serine import and synthesis, and that the integrity of this feedback loop is critical for Treg suppressive capacity. Although Gclc ablation does not impair Treg differentiation, mutant mice exhibit severe autoimmunity and enhanced anti-tumor responses. Gclc-deficient Tregs show increased serine metabolism, mTOR activation and proliferation but downregulated FoxP3. Limitation of cellular serine in vitro and in vivo restores FoxP3 expression and suppressive capacity to Gclc-deficient Tregs. Our work reveals an unexpected role for GSH in restricting serine availability to preserve Treg functionality.
Graphical Abstract
eTOC blurb
Regulatory T cells (Tregs) rely on oxidative metabolism, which triggers the generation of reactive oxygen species (ROS). Accumulating ROS are controlled by the antioxidant glutathione (GSH). Kurniawan et al. reveal an unexpected subset-specific role of GSH in serine metabolism and Treg function.
INTRODUCTION
Tregs suppress Teffs to maintain peripheral tolerance and prevent autoimmunity (Wing and Sakaguchi, 2010). Metabolic reprogramming in activated Tregs is distinct from that in Teffs (Dang et al., 2011; Delgoffe et al., 2009; Shi et al., 2011), implying that specific nutrients may affect the function/differentiation of T cell subsets differently.
Serine is a non-essential amino acid (NEAA) essential for Teff function (Ma et al., 2017; Ron-Harel et al., 2016) but its role in Tregs is unknown. Serine is either taken up directly by cells or synthesized de novo from the glycolytic metabolite 3-phosphoglycerate (3-PG). Intracellular serine is the major carbon source for folate-mediated one-carbon metabolism (1CMet), which operates in the cytosol and mitochondria to provide building blocks for S-adenosylmethionine (SAM), nucleotides, NAD(P)H, and ATP. 1CMet thus supports AA homeostasis, epigenetic maintenance, and redox defense (Ducker and Rabinowitz, 2017; Tibbetts and Appling, 2010). Serine is also a source of glycine and cysteine used to synthesize glutathione (GSH), the main antioxidant preserving intracellular redox balance (Meister, 1983; Ye et al., 2014). GSH, composed of glycine, glutamine and cysteine, is synthesized by glutamate cysteine ligase (GCL; containing Gclc and Gclm subunits) and glutathione synthase (Lu, 2009). GSH is vital for Teff functions and proliferation (Mak et al., 2017).
We report here using Treg-specific Gclc-deficient mice that a feedback loop involving GSH and serine unexpectedly regulates Treg functionality. GSH-deficient Tregs display increased serine uptake and de novo synthesis, enhancing 1CMet. Inhibition of serine uptake restores the suppressive capacity in Gclc-deficient Tregs. GSH not only controls a Treg’s redox state but also acts as negative feedback regulator to restrict serine import/synthesis. Strikingly, GSH-deficient Tregs are linked to both autoimmunity and increased tumor rejection in vivo. Our results demonstrate a novel role for GSH in restricting serine metabolism to support Treg’s suppressive capacity.
RESULTS
Gclc ablation in Tregs leads to multi-organ autoimmunity
Because Tregs rely on oxidative metabolism (Almeida et al., 2016; Pearce et al., 2013), we investigated if wild type (WT) Tregs generate more ROS than WT Teffs. Naïve T cells isolated from C57/BL6 mice were treated in vitro with anti (α)-CD3 antibody (Ab), αCD28 Ab, and interleukin (IL)2, with or without transforming growth factor (TGF)β, to trigger the differentiation of induced Tregs (iTregs) or Th0 cells, respectively. Unexpectedly, ROS were lower (Figure 1A), but mitochondrial membrane potential and maximal oxygen consumption rate (OCR) were higher, in WT iTregs compared to WT Th0 cells (Figure 1B, C), suggesting that ROS-scavenging is very efficient in iTregs. In line, iTregs contained ~3-fold more GSH than Th0 cells (Figure 1D), conferring superior buffering of oxidative stress.
Figure 1. Gclc deficiency does not affect Treg homeostasis but does lead to multi-organ inflammation.
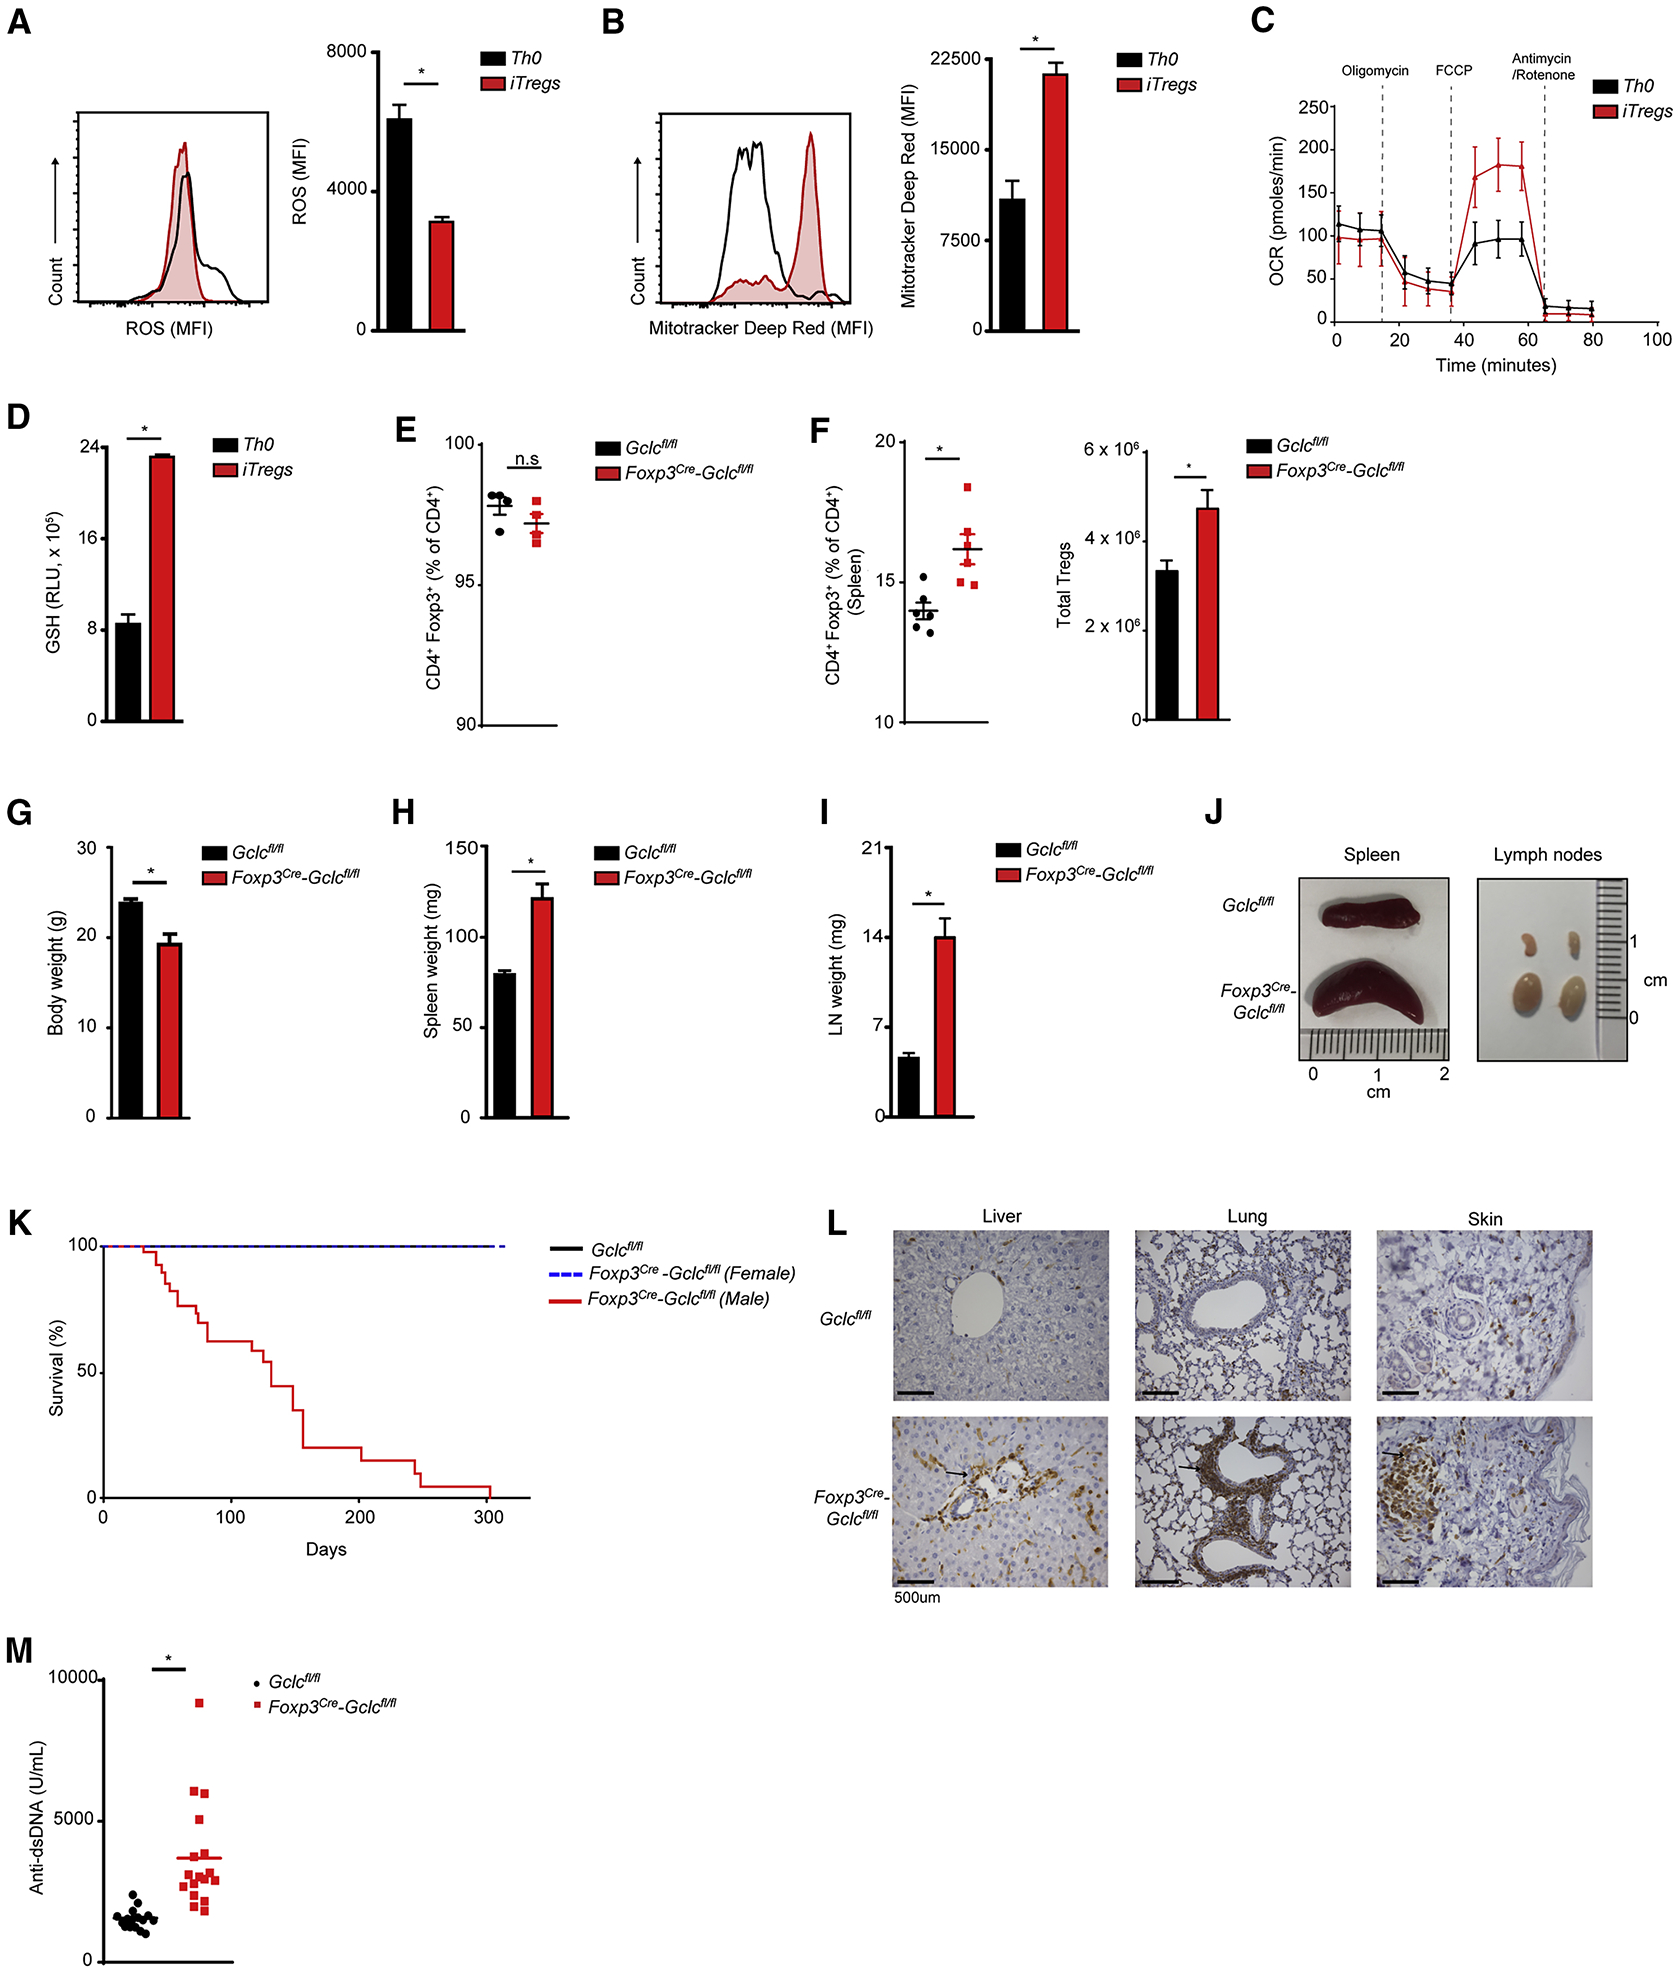
(A-D) Splenic naïve T cells from C57/BL6 mice were treated with αCD3+αCD28+IL2, with/without TGFβ, to generate iTreg or Th0 cells, respectively. Cells were stained with (A) DCF-DA to detect ROS, or (B) Mitotracker Deep Red to assess mitochondrial function, followed by flow cytometry (FC). (C) Seahorse determination of OCR. (D) Luminescence-based quantification of intracellular GSH. Data are mean±SEM (n=3) and representative of 3 independent trials. (E) FC quantitation of CD4+Foxp3+ iTregs among splenic naïve T cells isolated from Gclcfl/fl (control) or Foxp3cre-Gclcfl/fl mice and treated in vitro with αCD3+αCD28+IL2+TGF-β. Data are mean±SEM (n=3); 5 trials. (F) Flow cytometric analysis (FCA) of CD4+Foxp3+ nTregs from spleen of Gclcfl/fl and Foxp3cre-Gclcfl/fl mice. Data are mean±SEM (n=3); 5 trials. (G-I) Weights of (G) whole body, (H) spleen, and (I) LN from Gclcfl/fl and Foxp3cre-Gclcfl/fl mice at age 8–12wk. Data are mean±SEM (n=13). (J) Images of spleens and LN from Gclcfl/fl and Foxp3cre-Gclcfl/fl mice (8wk). (K) Survival of Gclcfl/fl (n=48) and Foxp3cre-Gclcfl/fl (male n=38, female=21) mice. (L) Histology of the indicated tissues resected from one Gclcfl/fl and one Foxp3cre-Gclcfl/fl mouse and stained with αCD3. Scale bars, 500 μm. Results are representative of 5 mice/group; 2 trials. (M) ELISA of anti-dsDNA Ab in serum of Gclcfl/fl (n=17) and Foxp3cre-Gclcfl/fl (n=17) mice (8–12 wk). *p<0.05.
To explore GSH loss specifically in Tregs, we crossed Gclcfl/fl mice with Foxp3cre mice to generate Foxp3cre-Gclcfl/fl animals (Rubtsov et al., 2008). We isolated naïve T cells from male mutants (6wk old) and Gclcfl/fl littermate controls and generated iTregs in vitro. Under conditions of optimal TCR stimulation, iTreg differentiation was not impaired by Gclc ablation (Figure 1E), and STAT5 phosphorylation (Figure S1A) and cell size (Figure S1B) were normal. In accordance with a previous report, suboptimal TCR stimulation of Gclc-deficient naive T cells led to more iTregs than in controls (Figure S1C) (Lian et al., 2018). Quantitative RT-PCR and mass spectrometry confirmed loss of Gclc mRNA and GSSG/GSH in mutant FoxP3+ iTregs (Figure S1D, E), in line with their higher ROS (Figure S1F). Gclc deletion in all T cell subsets reduces CD4+ and CD8+ T cell numbers and homeostasis (Mak et al., 2017). However, Treg-specific Gclc deletion did not impair natural Treg (nTreg) homeostasis in spleen or thymus of male mice. Indeed, percentages and absolute numbers of peripheral nTregs were slightly increased (Figure 1F, S1G).
By age 8wk, male Foxp3cre-Gclcfl/fl mice showed inflammation and reduced body weight and size (Figure 1G, S1H). By 12wk, most exhibited severe lymphadenopathy and splenomegaly (Figure 1H, I, J) and a shorter lifespan (Figure 1K). Female Foxp3cre-Gclcfl/fl mice, which possess a Foxp3cre-expressing or WT X chromosome and so retain some Gclc+ nTregs, did not develop disease and had a normal lifespan (Figure 1K). Diseased male mice showed organ infiltration by T cells and macrophages (Figure 1L; S1I, J) and increased serum anti-dsDNA Abs (Figure 1M). Thus, although Gclc ablation in Tregs does not impair Treg homeostasis, mice bearing these mutated cells develop multi-organ autoimmunity.
Teff accumulation and increased IFNγ drive lethal auto-inflammation
Diseased male Foxp3cre-Gclcfl/fl mice showed increased lymphocytic cellularity in spleen and lymph nodes (LN) (Figure 2A). Relative and absolute numbers of naïve T cells (CD62LhighCD44low) were decreased in the mutants, whereas the frequency and absolute numbers of activated CD4+ and CD8+ Teffs (CD62LlowCD44high) were increased (Figure 2B, C; S2A, B). These differences were not observed in female Foxp3cre-Gclcfl/fl mice indicating that non-targeted Tregs can suppress the inflammatory disease (Figure S2C). T cells from male Foxp3cre-Gclcfl/fl mice produced more IFNγ, IL2 (CD4+) and TNF (CD8+), but not IL17 (CD4+) (Figure 2D, E). Tbet expression was enhanced in mutant CD4+ T cells (Figure S2D). ELISA confirmed high systemic levels of IFNγ, TNF and IL2 in serum of male mutants (Figure 2F). T cell frequencies, activation and IFNγ production were increased in the lamina propria (Figure S2E, F, G). T follicular helper cells (PD1+CXCR5+) and germinal center B cells (GL-7+CD95+) were elevated in mutant spleen (Figure S2H, I), and serum concentrations of IgG1, IgG2a, IgG3 and IgA were elevated (Figure S2J).
Figure 2. Treg-specific Gclc deletion impairs homeostasis.
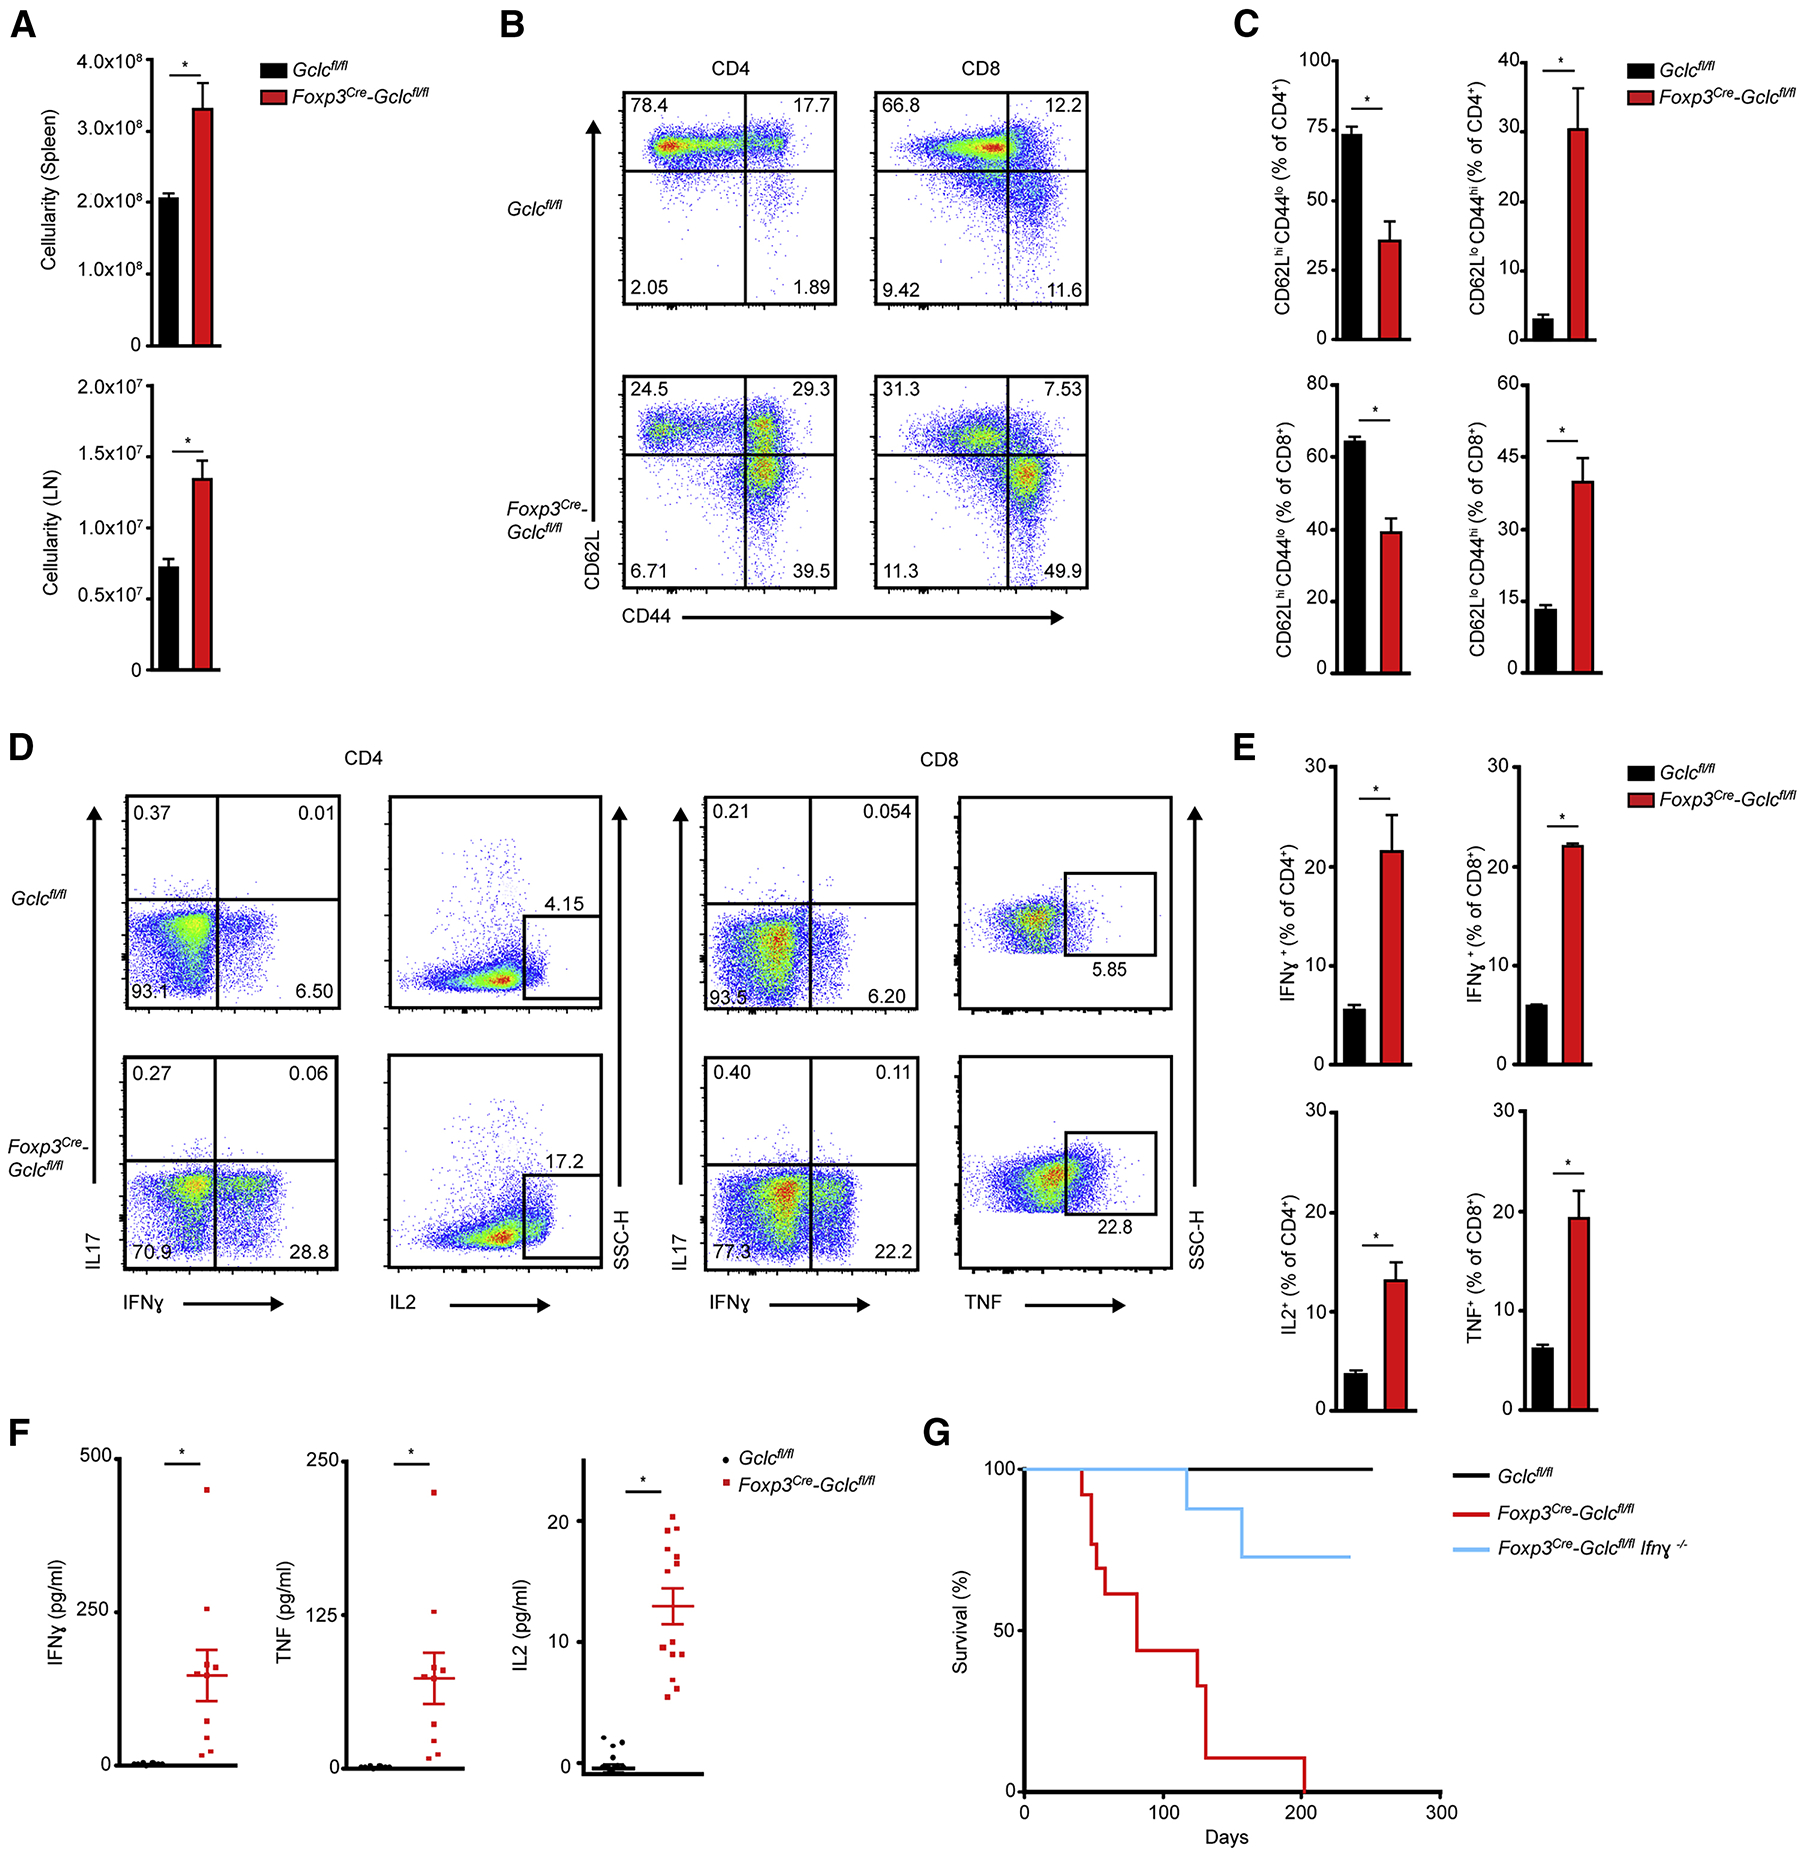
(A) Total lymphocyte numbers in spleen and LN of Gclcfl/fl and Foxp3cre-Gclcfl/fl mice. Data are mean±SEM (n=6); 2 trials. (B, C) FCA of naïve (CD44loCD62Lhi), central memory (CD44hiCD62Lhi), and effector (CD44hiCD62Llo) subsets (B), and quantification within the CD4+ population (top) and CD8+ population (bottom) (C), from Gclcfl/fl and Foxp3cre-Gclcfl/fl mice as in (A). Data are mean±SEM (n=3); 5 trials. (D, E) Intracellular staining and FCA of IFNγ, IL17, IL2 and TNF production by purified CD4+ (left) and CD8+ (right) splenic Gclcfl/fl and Foxp3cre-Gclcfl/fl T cells re-stimulated in vitro with 50 ng PMA + 750 ng Iono for 6hr. Data are mean±SEM (n=3); 3 trials. (F) ELISA of IFNγ, TNF and IL2 in serum of Gclcfl/fl and Foxp3cre-Gclcfl/fl mice (8–12wk). Each symbol = individual mouse. Data are mean±SEM (Gclcfl/fl n=10; Foxp3cre-Gclcfl/fl n=17); 2 trials. (G) Survival of Gclcfl/fl (n=23), Foxp3cre-Gclcfl/fl (n=13), and Foxp3cre-Gclcfl/fl × Ifnγ−/− (n=14) mice. *p<0.05.
We next crossed male Foxp3cre-Gclcfl/fl mice to Ifnγ−/− mice and monitored autoimmune disease onset in the progeny. Ifnγ deletion significantly reduced disease burden and prolonged survival (Figure 2G). Thus, Gclc function allows Tregs to suppress IFNγ-mediated autoimmunity and spontaneous Teff activation in vivo.
GSH in Tregs is crucial for their suppressive capacity
Flow cytometric analysis of splenic nTregs from Foxp3cre-Gclcfl/fl and control mice revealed that surface levels of CD25, ICOS, CTLA4, GITR and OX40 were comparable (Figure 3A). However, CD44 and CD69 were elevated on Gclc-deficient nTregs and iTregs (Figure S3A), indicating enhanced activation. PD1 was also higher on mutant nTregs. Although PD1 supports nTregs in normal tissues of WT mice (Francisco et al., 2009), PD1 is linked to Treg dysfunction and increased IFNγ in tumors (Lowther et al., 2016). Notably, Gclc-deficient nTregs did not produce more IFNγ after restimulation (Figure 3B), implying that they are stable and do not become Teffs. Helios (Kim et al., 2015; Nakagawa et al., 2016) and IRF4 expression were normal in mutant splenic nTregs (Figure S3B). We next co-cultured control conventional T cells (Tconv) with control or Foxp3cre-Gclcfl/fl iTregs or freshly isolated nTregs and measured Tconv proliferation. Gclc-deficient nTregs and iTregs suffered a dramatic reduction in suppressive capacity independent of the Treg:Tconv ratio (Figure 3C, S3C, S3D) and expressed less IL10 and TGFβ (Figure S3E).
Figure 3. GSH modulates Treg functionality in vitro and in vivo.
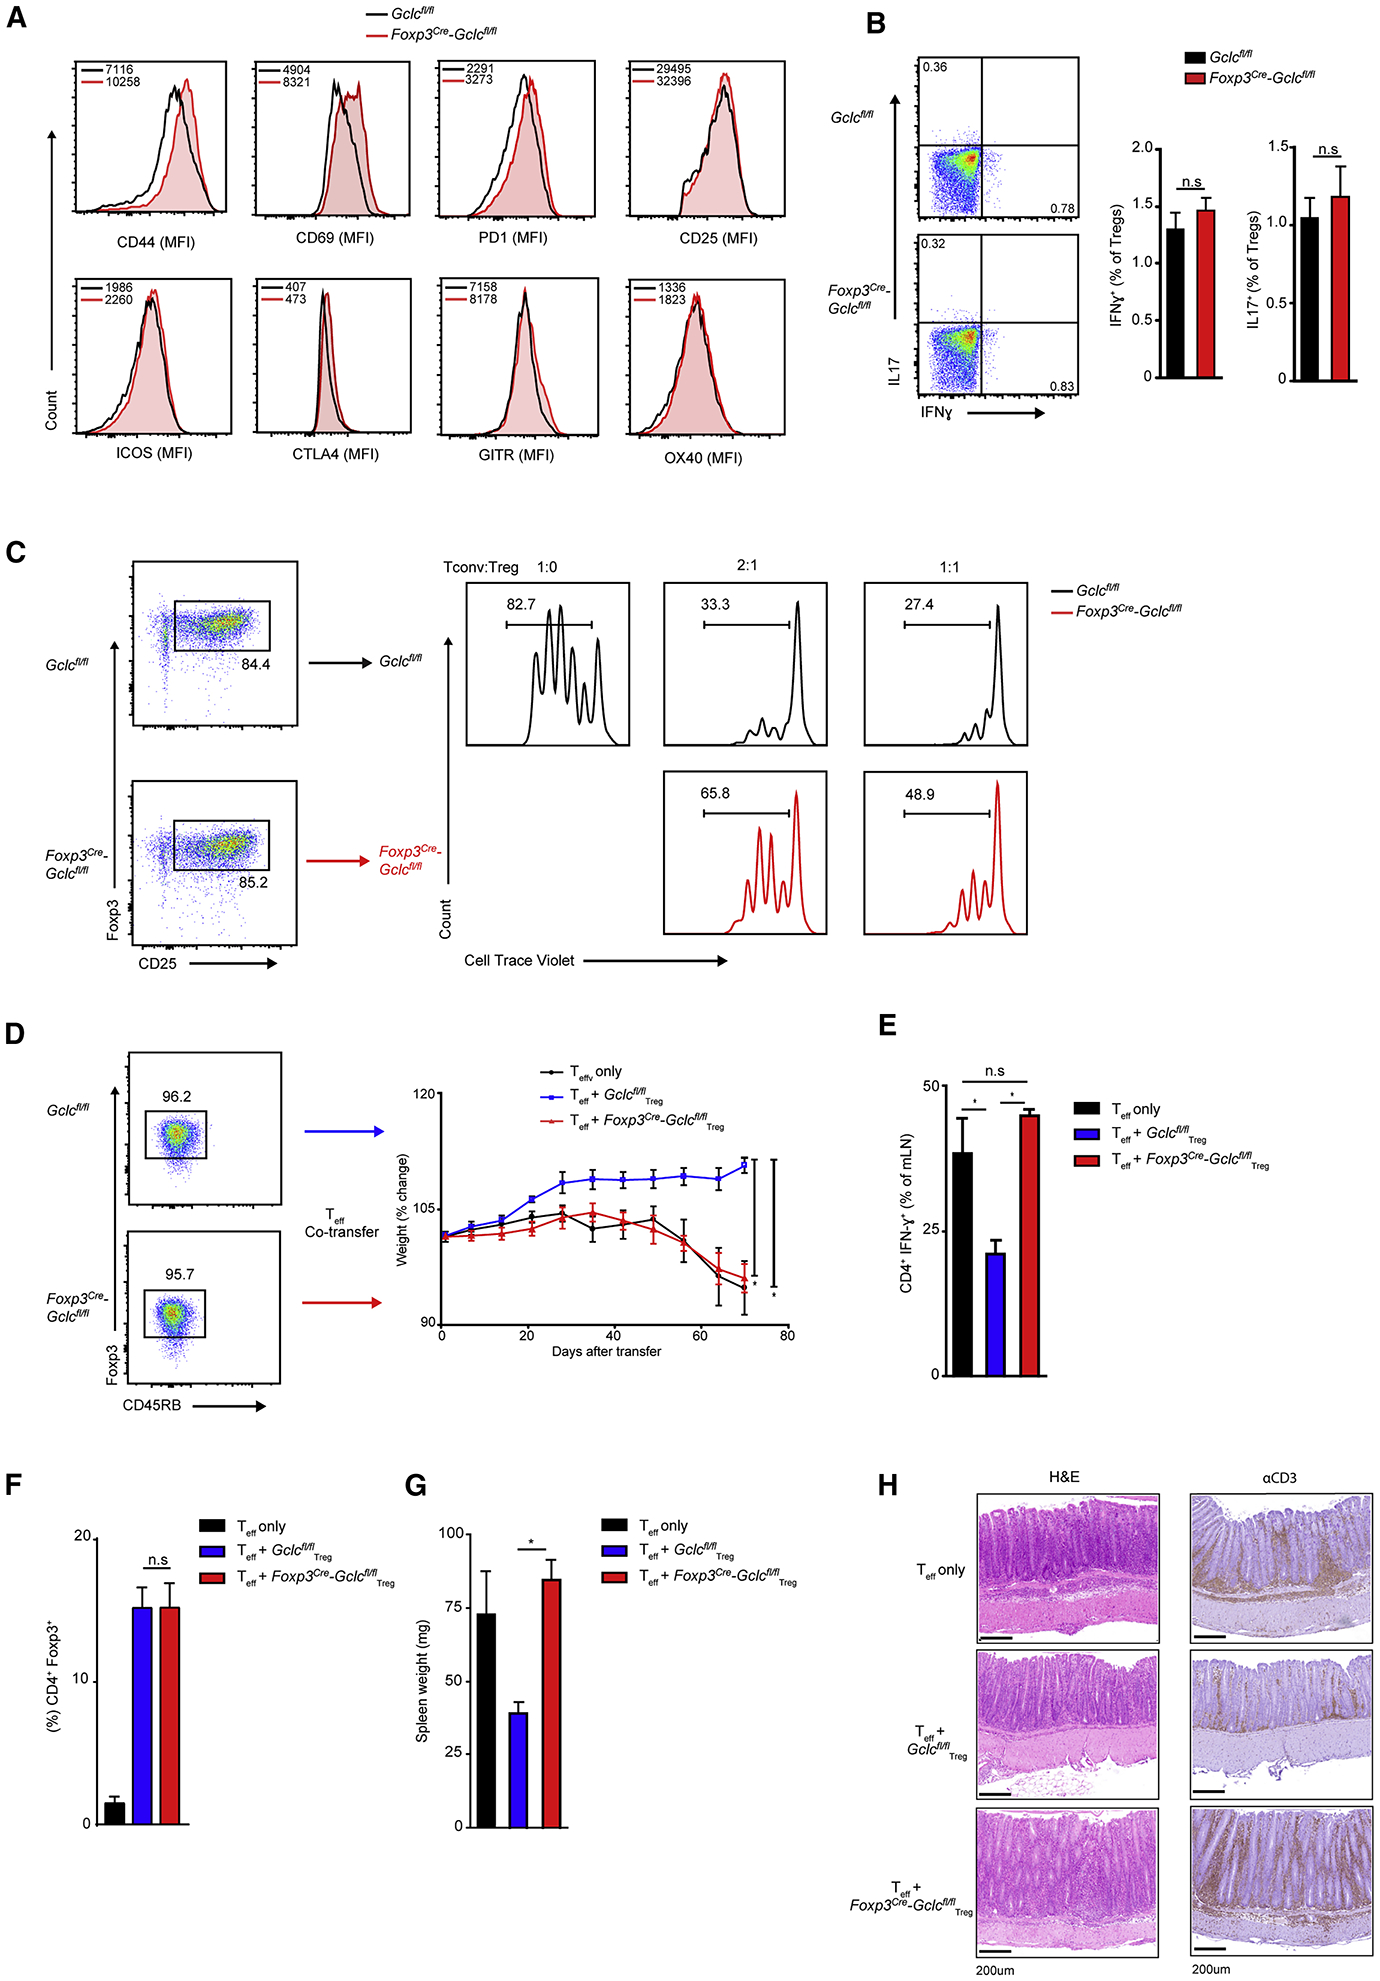
(A) FCA of the indicated surface markers on splenic nTregs from Gclcfl/fl and Foxp3cre-Gclcfl/fl mice (n=3); 4 trials. (B) FC quantification of intracellular IFNγ and IL17 in splenic nTregs of Gclcfl/fl and Foxp3cre-Gclcfl/fl mice re-stimulated in vitro with PMA+Iono for 6hr. Data are mean±SEM (n=3); 3 trials. (C) In vitro suppression assay of splenic nTregs from Gclcfl/fl and Foxp3cre-Gclcfl/fl mice incubated at the indicated ratios with Tconv labeled with 5 μM Cell-Trace Violet (CTV). Suppresion was determined by FC as a decrease in Tconv proliferation; 5 trials. (D) In vivo assay of Treg suppression using a T cell adoptive transfer-based induced colitis model. Rag1−/− mice received WT Teff (CD4+CD45RBhigh) alone or together with FACS-sorted nTregs (CD4+ CD45RBlow) from Gclcfl/fl or Foxp3cre-Gclcfl/fl mice. Results are presented as post-transfer body weight relative to initial weight of recipients. Data are mean±SEM (n=4); 2 trials. (E) Intracellular staining and FCA of IFNγ produced by CD4+ Teff isolated from mesenteric LN of the mice in (D) at day70 post-transfer and re-stimulated in vitro with PMA+Iono. Data are mean±SEM (n=4); 2 trials. (F) Quantification of nTregs in peripheral blood of Rag1−/− recipients treated as in (D) at 50 days post-transfer. Data are mean±SEM (n=2–3). 2 trails. (G) Quantification of spleen weights of the Rag1−/− recipients in (D) at experimental endpoint. Data are mean±SEM (n=4); 2 trials. (H) Histology of large intestine of the mice in (D) after staining with H&E or αCD3. Scale bars, 200 μm. Data are mean±SEM (n=4); 2 trials. *p<0.05.
To explore these data in vivo, we employed a T cell-dependent colitis model (Reardon et al., 2011). WT Teffs (CD4+CD45RBhigh) were adoptively transferred alone, or with control or Gclc-deficient nTregs (CD4+CD45RBlow), into Rag1−/− recipient mice. Colitis (mouse weight loss) was induced by control Teffs alone but not if control nTregs were co-transferred (Figure 3D). In contrast, mice receiving control Teffs plus Gclc-deficient nTregs developed colitis (Figure 3D). Teffs from mice receiving control Teffs only, or control Teffs plus Gclc-deficient nTregs, produced more IFNγ (Figure 3E). Numbers of nTregs in all recipients after 50 days were equal, ruling out colitis due to mutant Treg death (Figure 3F). Recipients of control Teffs plus Gclc-deficient nTregs exhibited splenomegaly (Figure 3G), and intestinal crypts of these recipients showed T cell infiltration (Figure 3H). Thus, Gclc in Tregs is indispensable for suppression in vitro and in vivo.
FoxP3 is reduced in Gclc-deficient Tregs due to increased mTOR activation
To determine if Gclc deficiency alters Tregs gene transcription, we used RNA sequencing (RNAseq) and principal component analysis (PCA) to examine Foxp3cre-Gclcfl/fl and Gclcfl/fl iTreg transcriptomes (Figure S4A). Foxp3 was the most downregulated gene in mutant iTregs (Figure 4A) and splenic nTregs (Figure S4B). Although FoxP3+ nTregs were slightly increased in Foxp3cre-Gclcfl/fl mice (Figure 1E, 1F), intracellular FoxP3 was reduced in mutant nTregs and iTregs (Figure 4B).
Figure 4. Lack of GSH alters mTOR signaling and impairs FoxP3 expression.
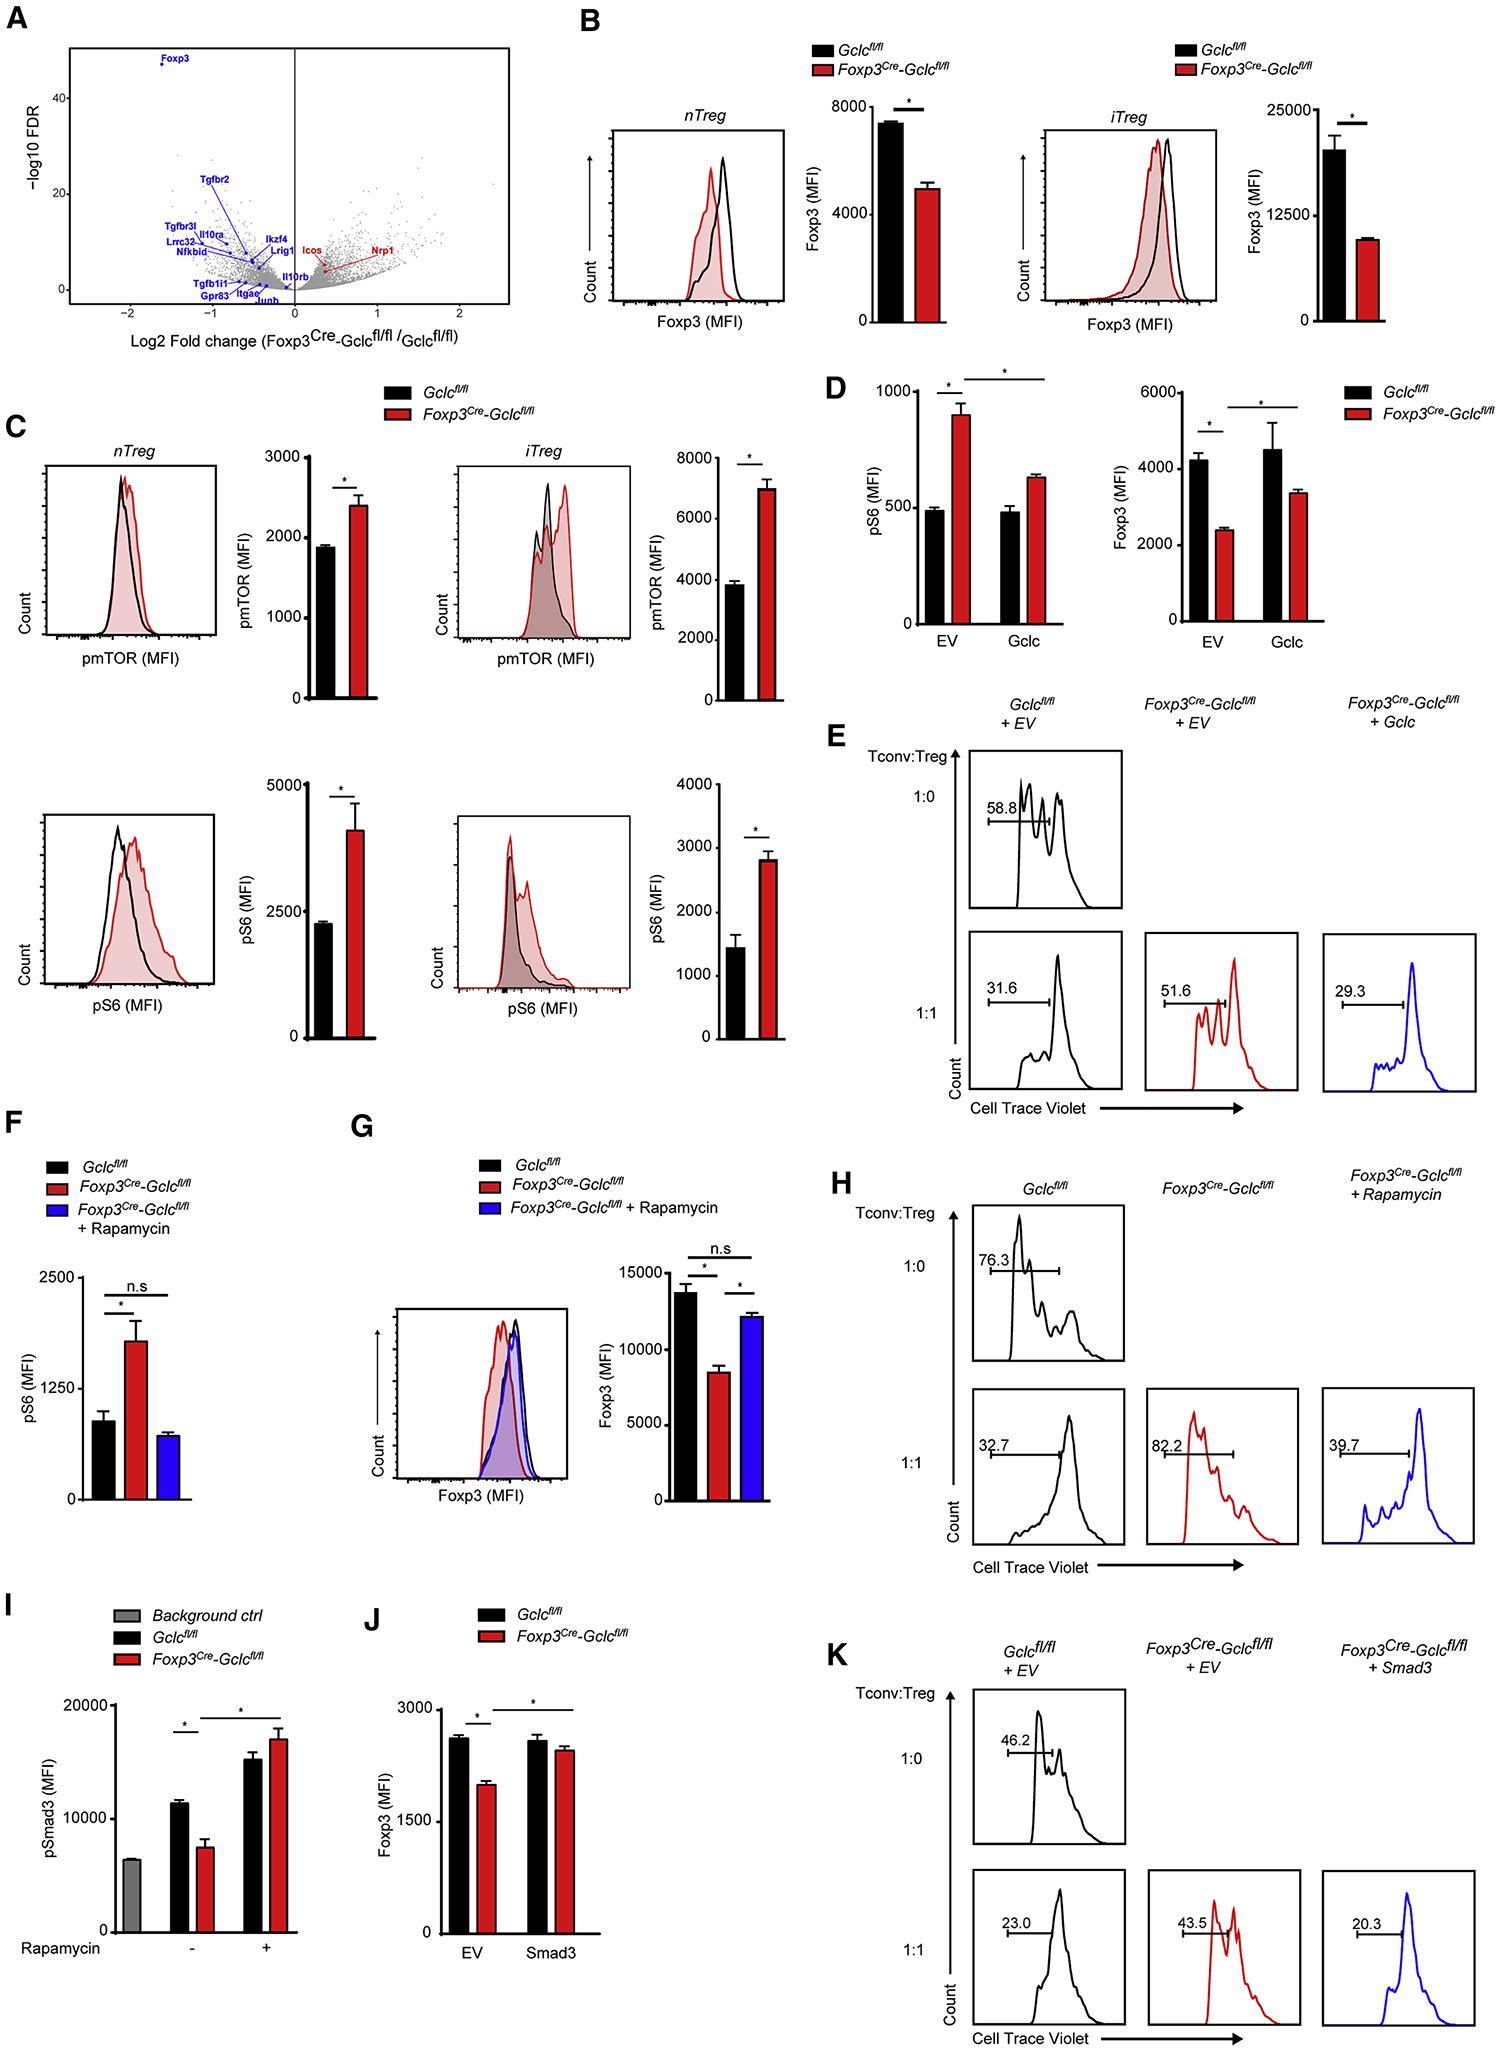
(A) Volcano plot comparing mRNAs of the indicated Treg-associated genes in Foxp3cre-Gclcfl/fl and Gclcfl/fl iTregs. Downregulated (blue) and upregulated (red) transcripts are shown. (B) FCA of FoxP3 in Foxp3cre-Gclcfl/fl and Gclcfl/fl Tregs isolated from spleen (left) or induced in vitro (right). Data are mean±SEM (n=3); 5 trials. (C) Intracellular staining and FCA of pmTOR and pS6 in Gclcfl/fl and Foxp3cre-Gclcfl/fl Tregs as in (B). Data are mean±SEM (n=3); 5 trials. (D) Intracellular staining and FCA of pS6 and Foxp3 in Gclcfl/fl and Foxp3cre-Gclcfl/fl iTregs transduced with retrovirus expressing EV or Gclc. Data are mean±SEM (n=3); 3 trials. (E) In vitro suppression assay of Gclcfl/fl and Foxp3cre-Gclcfl/fl iTregs transduced with retrovirus expressing EV or Gclc. Transduced Tregs were FACS-sorted and incubated with CTV-labeled Tconv at the indicated ratios; 2 trials. *p<0.05. (F) FCA of pS6 in Foxp3cre-Gclcfl/fl and Gclcfl/fl iTregs incubated with/without Rap. Data are mean±SEM (n=3); 3 trials. (G) Intracellular staining and FCA of FoxP3 in Foxp3cre-Gclcfl/fl and Gclcfl/fl iTregs incubated with/wihout 100 nM Rap. Data are mean±SEM (n=3); 3 trials. (H) In vitro suppression assay of splenic nTregs from Gclcfl/fl and Foxp3cre-Gclcfl/fl mice that were incubated with/without Rap for 24hr and mixed with Tconv at the indicated ratios; 5 trials. (I) Intracellular staining and FCA of pSmad3 in Foxp3cre-Gclcfl/fl and Gclcfl/fl iTregs incubated with/without Rap. Data are mean±SEM (n=3); 2 trials. (J) Intracellular staining and FCA of Foxp3 in Gclcfl/fl and Foxp3cre-Gclcfl/fl iTregs transduced with retrovirus expressing EV or Smad3. Data are mean±SEM (n=3); 3 trials. (K) In vitro suppression assay of Gclcfl/fl and Foxp3cre-Gclcfl/fl iTregs transduced with retrovirus expressing EV or Smad3. Transduced Tregs were FACS-sorted and incubated with CTV-labeled Tconv at the indicated ratios; 2 trials. *p<0.05.
Reciprocity exists between mTOR and Foxp3 in Tregs (Delgoffe et al., 2009; Gerriets et al., 2015; Huynh et al., 2015). Phosphorylation (p) of mTOR and its target S6 were increased in nTregs and iTregs from male Foxp3cre-Gclcfl/fl mice (Figure 4C). To rule out any effects of inflammation, we analyzed nTregs from female mutants heterozygously expressing a Foxp3cre-YFP+ reporter gene. Due to random X chromosome inactivation, these disease-free animals contain YFP+ nTregs (activated Cre, Gclc absent) and YFP− nTregs (no Cre, Gclc intact). Higher pS6 and pmTOR were detected in YFP+ nTregs than in YFP− nTregs (Figure S4C). To confirm this result, we generated tamoxifen (TAM)-inducible Treg-specific Gclc-deficient mice (Foxp3ER-cre-Gclcfl/fl), which showed no inflammation without TAM. We isolated naive T cells from these mutants and controls, and induced iTregs in vitro. In parallel we triggered acute Gclc deletion by adding 4-hydroxytamoxifen (4-OHT). Again, we observed increased pS6, decreased FoxP3, and reduced iTreg mediated suppression (Figure S4D, S4E). Conversely, retroviral transduction of Gclc into Gclc-deficient iTregs reduced pS6, increased FoxP3 and restored their suppressive capacity (Figure 4D, E). Thus, Gclc’s effects on mTOR and FoxP3 are not compromised by an inflammatory environment.
When we treated Gclc-deficient iTregs with the mTOR inhibitor rapamycin (Rap) (Dumont and Su, 1996), pS6 was reduced and FoxP3 was restored (Figure 4F, G), confirming that increased mTOR in GSH-deficient cells decreases FoxP3. We isolated nTregs from spleen and LN of male Foxp3cre-Gclcfl/fl and control mice, incubated these cells with/without Rap for 24hr, removed Rap, and measured nTreg’s suppressive capacity. Again, Rap normalized Gclc-deficient nTreg mediated suppression (Figure 4H). Smad3 is linked to FoxP3 induction in Tregs (Tone et al., 2008), suppressed by mTOR, and inactivated and hyperphosphorylated in mTOR-deficient cells (Delgoffe et al., 2009). Our Gclc-deficient iTregs showed increased mTOR activation and reduced pSmad3, which was reversed by Rap (Figure 4I). We next infected control and Gclc-deficient iTregs with retrovirus expressing Smad3. FoxP3 increased in Smad3-transduced mutant cells, which regained their suppressive function (Figure 4J, K). Retroviral expression of constitutively active STAT5 had no effect (Figure S4F). Thus, mTOR inactivation mediated by GSH is critical for Smad3-dependent FoxP3 induction and iTreg’s suppressive capacity.
To explore these findings in vivo, we intraperitoneally (i.p.) injected male control and Foxp3cre-Gclcfl/fl mice (6wk) with Rap or vehicle every other day for 30 days. Rap ameliorated inflammatory disease in the mutants due to its immunosuppressive effect (Figure S4G–L). Rap also restored Gclc-deficient nTreg function such that Teff proliferation was suppressed in vitro (Figure S4M). To determine if FoxP3 reconstitution alone in Gclc-deficient Tregs could rescue their suppressive capacity, we transduced Foxp3cre-Gclcfl/fl Tregs with control or Foxp3-expressing retrovirus and subjected transduced CD90.1+ iTregs to in vitro suppression assays. Indeed, retroviral Foxp3 expression restored FoxP3 and the suppressive activity of Gclc-deficient Tregs (Figure S4N, S4O). Thus, GSH is crucial in vitro and in vivo for maintaining Treg suppression through effects on mTOR and FoxP3.
Regulation of serine availability by GSH is required for Treg function
mTOR is an energy sensor that is activated by AA levels (Goberdhan et al., 2016). Gene set enrichment analysis revealed that Gclc-deficient iTregs and nTregs showed elevated expression of genes associated with AA metabolism or 1CMet (Figure 5A, 5B, S5A, S5B). Heightened 1CMet is linked to increased Teff proliferation (Ma et al., 2017; Ron-Harel et al., 2016). Gclc-deficient iTregs proliferated more vigorously than controls (Figure 5C), in striking contrast to Gclc-deficient Tconv where GSH loss blocks proliferation (Mak et al., 2017). Thus, GSH has a surprising, subset-specific role in Tregs.
Figure 5. GSH-mediated regulation of the serine pool is required for Treg function.
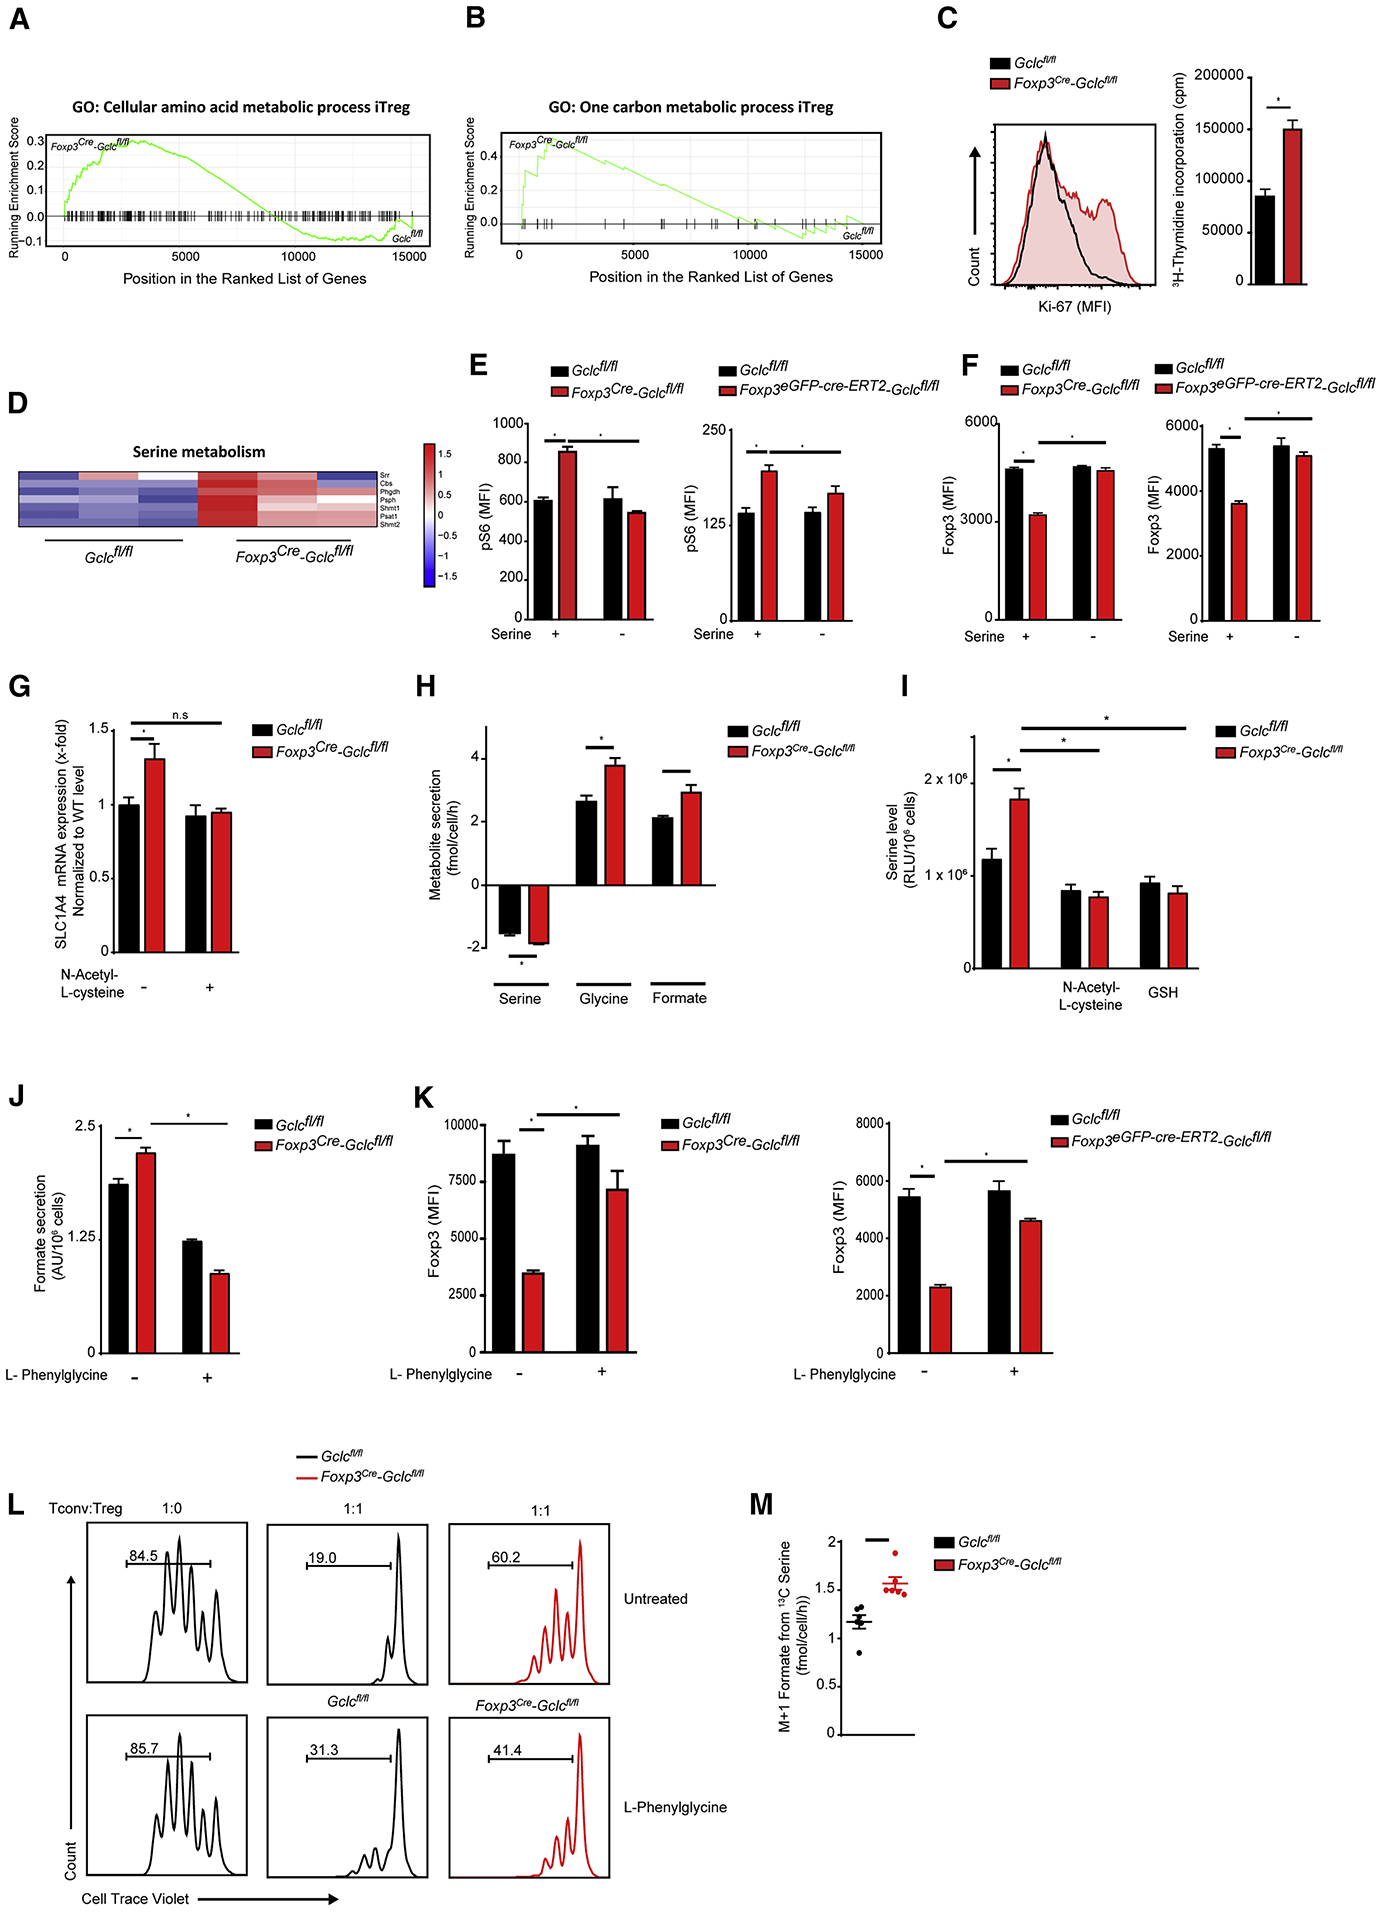
(A) Barcode enrichment plot of KEGG pathway GO:0006520 (Cellular amino acid metabolic processes) for Gclcfl/fl and Foxp3cre-Gclcfl/fl iTregs. (B) Barcode enrichment plot of KEGG pathway GO:0006730 (1CMet) for Gclcfl/fl and Foxp3cre-Gclcfl/fl iTregs. (C) Determination of proliferation of Gclcfl/fl and Foxp3cre-Gclcfl/fl iTregs by Ki-67 staining (left) and 3H-thymidine incorporation (right). Data are mean±SEM (n=3); 3 trials. (D) Heat map showing normalized differential gene expression patterns of genes associated with serine metabolism in Gclcfl/fl vs. Foxp3cre-Gclcfl/fl iTregs. (E, F) Intracellular staining and FCA of (E) pS6 and (F) Foxp3 in Gclcfl/fl vs Foxp3cre-Gclcfl/fl (left) and Gclcfl/fl vs Foxp3eGPF-cre-ERT2-Gclcfl/fl (right) iTregs cultured in normal or serine-deficient medium. Gclcfl/fl vs Foxp3eGPF-cre-ERT2-Gclcfl/fl iTregs were co-incubated with 1μM 4-OHT. Data are mean±SEM (n=3); 3 trials. (G) RT-qPCR of ASCT1 mRNA in Gclcfl/fl and Foxp3cre-Gclcfl/fl iTregs. Data are mean±SEM (n=7); 2 trials. (H) LC/MS quantification of serine uptake from, and glycine and formate secretion into, culture medium of Gclcfl/fl and Foxp3cre-Gclcfl/fl iTregs. Data are mean±SEM (n=3); 2 trials. (I) Quantification of intracellular serine in Gclcfl/fl and Foxp3cre-Gclcfl/fl iTregs treated with/without 200 μM NAC or 0.5 mM GSH. Data are mean±SEM (n=3); 2 trials. (J) Quantification of formate secretion into culture medium of Gclcfl/fl and Foxp3cre-Gclcfl/fl iTregs treated with/without 50 μM L-phenylglycine. Data are mean±SEM (n=3); 2 trials. (K) Intracellular staining and FCA of Foxp3 in Gclcfl/fl vs Foxp3cre-Gclcfl/fl (left), and Gclcfl/fl vs Foxp3eGPF-cre-ERT2-Gclcfl/fl (right), iTregs treated with/without L-phenylglycine. Gclcfl/fl vs Foxp3eGPF-cre-ERT2-Gclcfl/fl iTregs were co-incubated with 4-OHT. Data are mean±SEM (n=3); 3 trials. (L) In vitro suppression assay of nTregs that were isolated from Gclcfl/fl and Foxp3cre-Gclcfl/fl mice, incubated with/without L-phenylglycine, and mixed in vitro with Tconv at the indicated ratios; 3 trials. (M) Mass isotopomer distribution of M+1 formate following incubation of Gclcfl/fl and Foxp3cre-Gclcfl/fl iTregs with [U-13C3]-serine for 24hr. Data are mean±SEM (n=3); 2 trials. *p<0.05.
Serine drives 1CMet because it provides its hydroxymethyl group as a one-carbon unit to tetrahydrofolate (Ducker and Rabinowitz, 2017; Herbig et al., 2002; Tibbetts and Appling, 2010). Gclc-deficient iTregs showed increased expression of genes involved in serine metabolism (Figure 5D). When we cultured Gclc-deficient iTregs or 4-OHT-inducible Gclc-deficient iTregs without serine, pS6 was reduced to control levels (Figure 5E) while FoxP3 was increased (Figure 5F). Serine deprivation had only minor effects on pS6 and Foxp3 in control iTregs. Although glycine is also a 1CMet donor, its deprivation did not decrease pS6 nor restore FoxP3 in Gclc-deficient iTregs (Figure S5C). To assess when serine suppresses FoxP3 in GSH-deficient Tregs, we cultured Gclc-deficient iTregs with/without serine for various times. When mutant iTregs were induced from naïve T cells in the absence of serine for 96hr, FoxP3 rose (Figure S5D). However, serine deprivation for only 48hr (followed by serine supplementation for the next 48hr) had no effect and FoxP3 remained low in mutant iTregs. Conversely, mutant iTregs incubated with serine for the first 48hr followed by serine starvation for 48hr showed increased FoxP3. Thus, serine exerts its effect during later stages of Treg differentiation.
Cells import serine via the alanine-serine-cysteine transporters (ASCT) 1 and 2, which are encoded by the SLC1A4 and SLC1A5 genes, respectively (Broer and Broer, 2017; Kaplan et al., 2018; Yamamoto et al., 2004). SLC1A4 and SLC1A5 are expressed by T cells (Ren et al., 2017). SLC1A4 (but not SLC1A5) mRNA was upregulated in Gclc-deficient iTregs (Figure 5G, S5E). SLC1A4 is a target of the master antioxidant transcription factor NRF2 (Christensen, 1990; Fu et al., 2019; Hirotsu et al., 2012; Schafer et al., 2010), and NRF2 responses are triggered by increased intracellular ROS (Kong and Chandel, 2018). Thus, cells with elevated ROS might increase SLC1A4. Both iTregs and nTregs lacking Gclc (which have high ROS; Figure S1E) exhibited enriched expression of ROS metabolism genes (Figure S5F) and increased NRF2 target gene activation (Figure S5G). SLC1A4 mRNA was normalized in Gclc-deficient iTregs treated with the ROS scavenger N-acetyl-cysteine (NAC) (Figure 5G). In line with increased SLC1A4, Gclc-deficient iTregs consumed more serine and secreted more glycine and formate than controls (Figure 5H) and antioxidant treatment of these cells decreased intracellular serine (Figure 5I) and restored FoxP3 (Figure S5H).
The ASCT AA transporters are inhibited by L-phenylglycine (Foster et al., 2017). We treated control and Gclc-deficient iTregs with L-phenylglycine to block ASCTs and detected reduced intracellular serine in the mutant cells (Figure S5I) as well as decreased formate secretion (Figure 5J). L-phenylglycine restored FoxP3 in Gclc-deficient iTregs and 4OHT-inducible Gclc-deficient iTregs (Figure 5K). CRISPR/Cas9-mediated downregulation of ASCT1 increased FoxP3 in mutant iTregs (Figure S5J). ASCT blockade also reinstated Gclc-deficient nTregs suppressive function (Figure 5L). Thus, restriction of serine uptake is crucial for maintaining Tregs suppressive capacity.
Serine hydroxymethyltransferase (SHMT) mediates serine’s contribution to 1CMet. Isotopic tracing with [U-13C3]-serine confirmed increased M1-labeling of formate in mutant iTregs (Figure 5M). While formate secretion by Gclc-deficient iTregs decreased upon SHMT inhibition (Figure S5K), Foxp3 did not increase (Figure S5L), but proliferation was normalized (Figure S5M). Thus, serine stimulates 1CMet to increase mutant Treg proliferation, but also acts to decrease Foxp3 and Treg mediated suppression independently of SHMT and 1CMet.
GSH restricts Treg metabolism and controls Treg function via effects on FoxP3
Increased glycolysis is linked to decreased FoxP3 and diminished Tregs suppressive capacity (Gerriets et al., 2015; Huynh et al., 2015). Indeed, Gclc-deficient iTregs consumed more glucose, secreted more lactate, and expressed more of the glucose transporter Glut1 than did controls (Figure 6A, S6A). Glycolysis stress testing of Gclc-deficient iTregs and 4-OHT-inducible Gclc-deficient iTregs revealed that the extracellular acidification rate (ECAR) of culture medium and cellular glycolytic capacity were increased whether Gclc ablation was constitutive or 4-OHT-induced (Figure 6B, C). We then determined [U-13C6]-glucose incorporation into TCA cycle metabolites in Gclc-deficient and control iTregs over 24hr and measured mass isotopomer distributions (MIDs) by GC-MS. M2 isotopologues of citrate were elevated in mutant iTregs (Figure S6B), demonstrating an increased relative flux of glucose-derived carbon into the TCA cycle. Accordingly, OCR values in Gclc-deficient iTregs and 4-OHT-inducible Gclc-deficient iTregs were increased (Figure 6D, E).
Figure 6. Gclc expression is required to modulate Treg metabolism supporting Treg function.
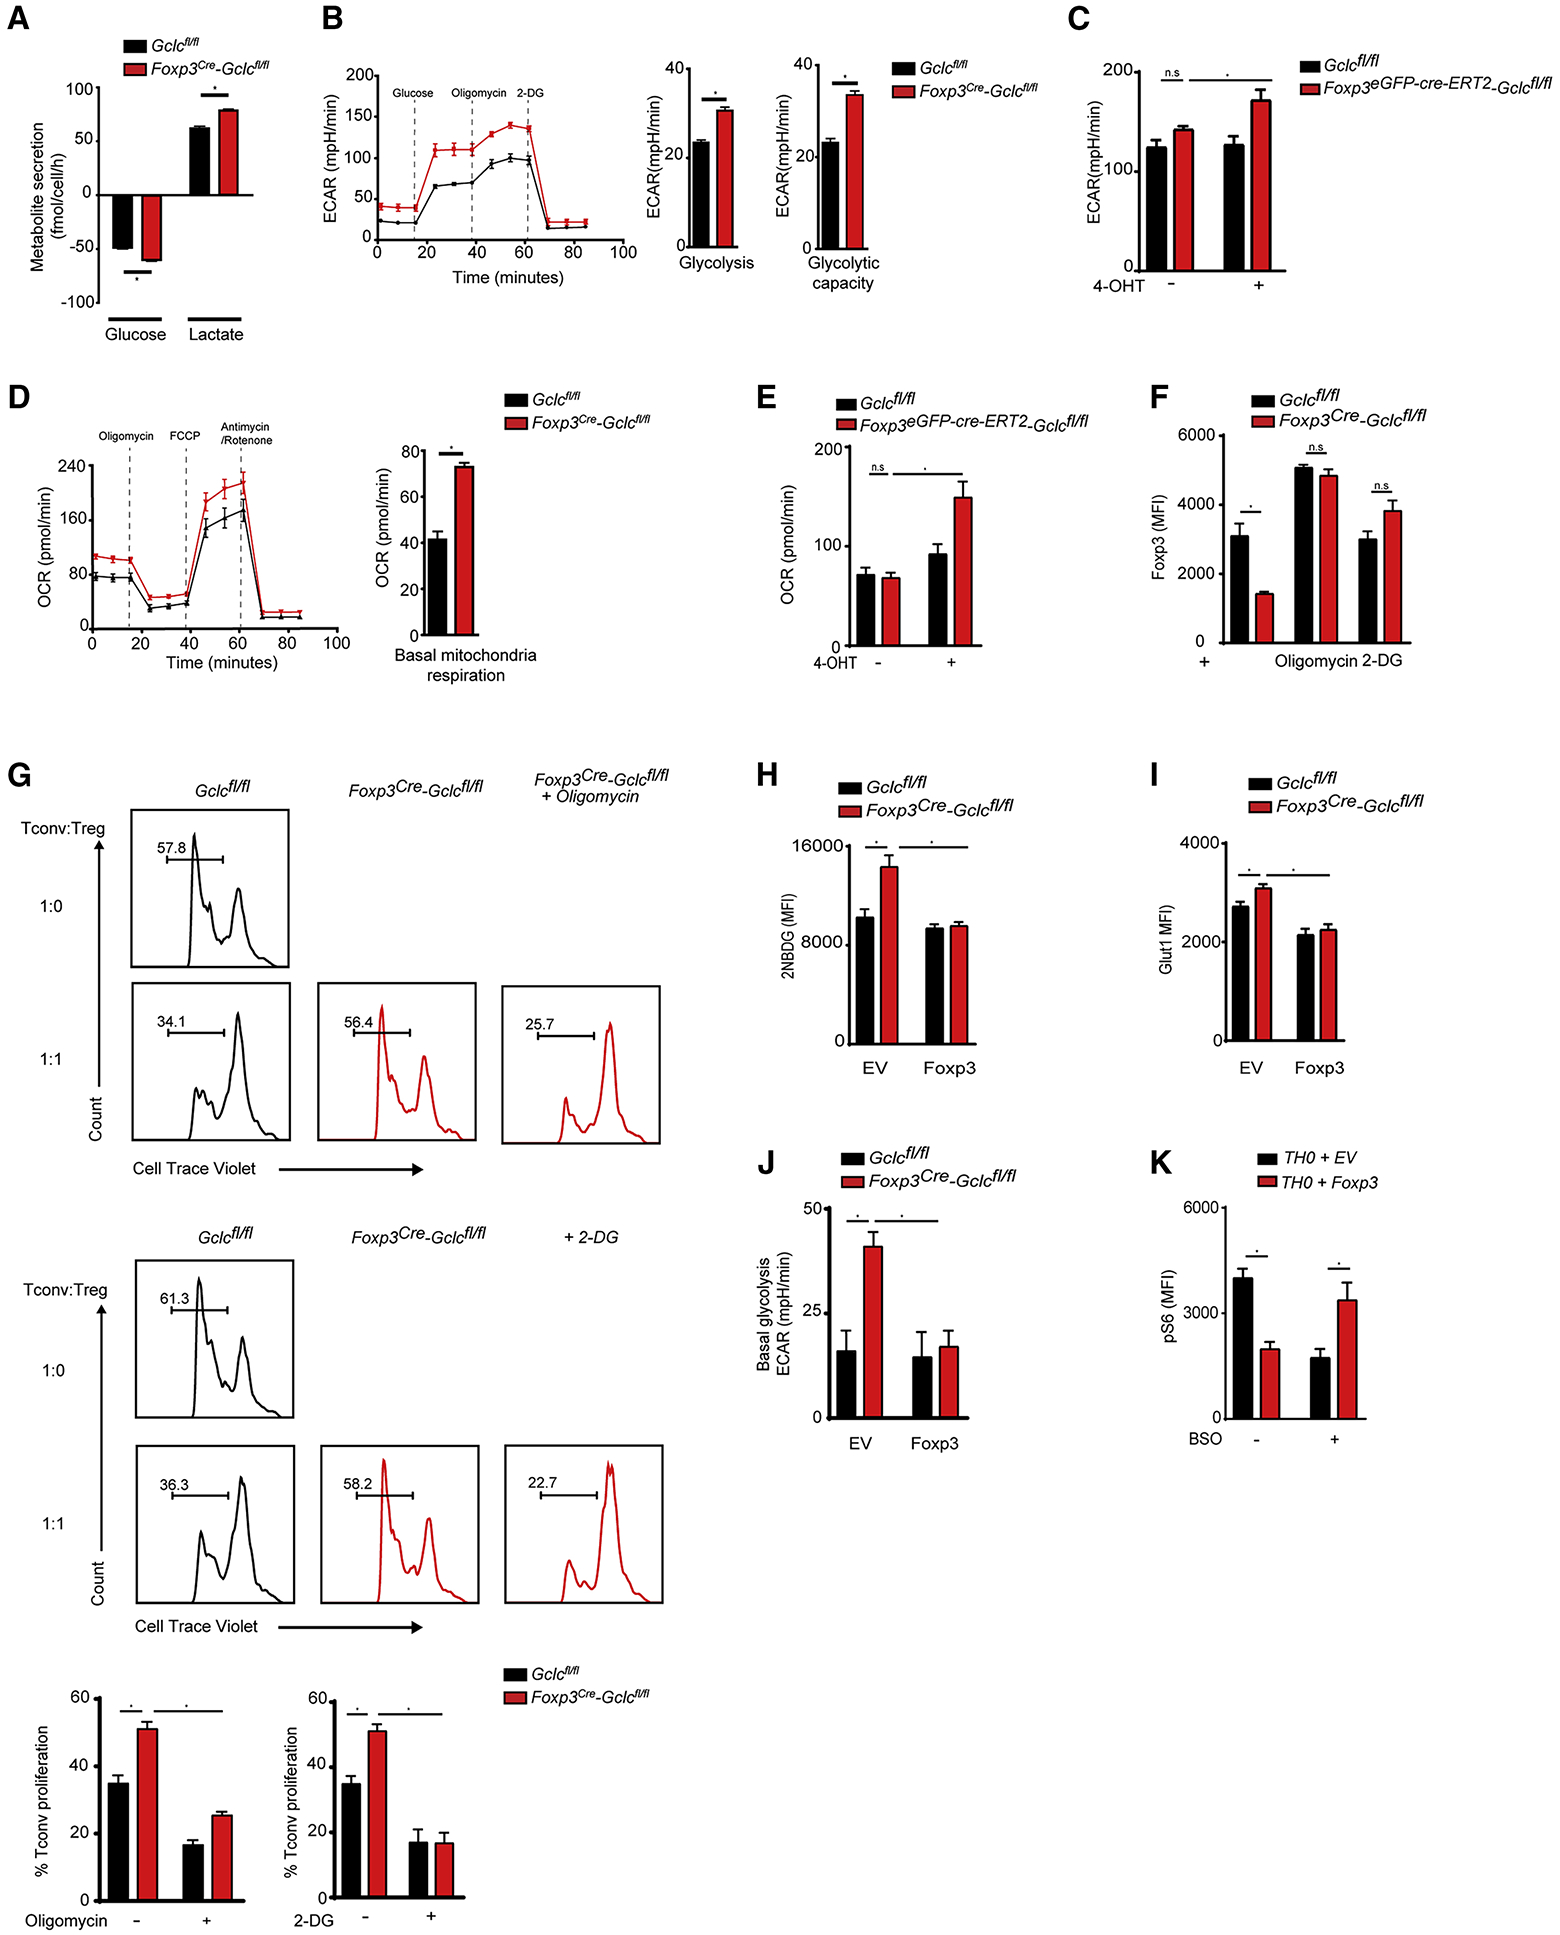
(A) Quantification of glucose uptake from and lactate secretion into culture medium of Gclcfl/fl and Foxp3cre-Gclcfl/fl iTregs. Data are mean±SEM (n=3); 3 trials. (B) Quantification of ECAR of Gclcfl/fl vs Foxp3cre-Gclcfl/fl iTregs. Data are mean±SEM (n=4); 4 trials. (C) Quantification of ECAR of Gclcfl/fl vs Foxp3eGPF-cre-ERT2-Gclcfl/fl iTregs incubated with 4-OHT. Data are mean±SEM (n=3); 2 trials. (D) Quantification of OCR of Gclcfl/fl vs Foxp3cre-Gclcfl/fl iTregs. Data are mean±SEM (n=4); 4 trials. (E) Quantification of OCR of Gclcfl/fl vs Foxp3eGPF-cre-ERT2-Gclcfl/fl iTregs incubated with 4-OHT. Data are mean±SEM (n=3); 2 trials. (F) Intracellular staining and FCA of FoxP3 in Gclcfl/fl vs Foxp3cre-Gclcfl/fl iTregs treated with suboptimal doses of 0.5 nM oligomycin or 100 μM 2-DG for 24hr. Data are mean±SEM (n=3); 3 trials. (G) In vitro suppression assay of Gclcfl/fl vs Foxp3cre-Gclcfl/fl iTregs treated (or not) with suboptimal doses of oligomycin (top) or 2-DG (bottom) prior to incubation with CTV-labeled Tconv at the indicated ratios; 3 trials. (H, I) FCA of (H) 2-NBDG uptake and (I) Glut-1 expression by Gclcfl/fl vs. Foxp3cre-Gclcfl/fl iTregs transduced with retrovirus expressing EV or Foxp3. (J) Quantification of ECAR for the iTregs in (H) as determined in (B). For (H-J), data are the mean±SEM (n=3); 2 trials. (K) Intracellular staining and FCA of pS6 in activated WT Tconv transduced with retrovirus expressing EV or FoxP3 as in (H) and treated with BSO for 48hr. Data are mean±SEM (n=3); 3 trials. *p<0.05.
To determine if enhanced metabolism interfered with iTreg mediated suppression, we incubated Gclc-deficient and control iTregs with 2-deoxyglucose (2DG) or oligomycin to restrict glycolysis or oxidative phosphorylation (OXPHOS), respectively. Restriction of either pathway induced control levels of FoxP3 in the mutant cells and restored their suppressive function (Figure 6F, G). To investigate a direct link between FoxP3 and increased metabolism, we transduced Gclc-deficient and control iTregs with retrovirus expressing FoxP3 or empty vector (EV). In mutant iTregs, FoxP3 expression decreased uptake of the glucose analogue 2-NDBG as well as Glut1 expression and glycolysis (ECAR) (Figure 6H, I, J). Gclc deficiency in Tconv is associated with impaired mTOR activation and decreased MYC (Mak et al., 2017), but mTOR was more activated (Figure 4C) and MYC was normal in Gclc-deficient iTregs (Figure S6C), again pointing to a subset-specific function for GSH. To determine if FoxP3 could alter a T cell’s response to GSH depletion, we transduced activated WT Tconv with retrovirus expressing FoxP3 or EV and treated these cells with the GCLC inhibitor buthionine sulfoximine (BSO). In line with previous work (Gerriets et al., 2016), FoxP3 expression in activated Tconv reduced pS6 (Figure 6K, S6D). BSO decreased pS6 in activated Tconv expressing EV (Figure 6K), but FoxP3 expression altered the Tconv response to BSO and increased pS6 (Figure 6K). Thus, it is FoxP3 in Tregs that shapes responses to GSH depletion; that is, the decreased mTOR activation in activated Tconv lacking GSH shifts to activation of this pathway in Gclc-deficient Tregs.
De novo serine synthesis in Tregs interferes with Foxp3 expression
During glycolysis, 3-phosphoglycerate dehydrogenase (PHGDH) redirects some 3-PG to serine synthesis. To determine if Gclc-deficient Tregs increased glycolysis to produce the 3-PG needed for their enhanced serine production, we incubated Gclc-deficient and control iTregs for 24hr with the PHGDH inhibitor PKUMDL-WQ-2101 (Wang et al., 2017) and found equivalent decreases in ECAR (Figure 7A). Thus, regardless of GSH, glycolysis in Tregs is driven partly by the need for intermediates for serine synthesis. [U-13C6]-glucose incorporation into serine and formate was enhanced in Gclc-deficient iTregs and reduced by PHGDH inhibition (Figure 7B, 7C). PHGDH inhibition or CRISPR/CAS9 mediated Phgdh deletion also elevated FoxP3 in Gclc-deficient iTregs and 4-OHT-inducible Gclc-deficient iTregs (Figure 7D, 7E). Consequently, PHGDH inhibition restored mutant iTregs suppressive capacity (Figure 7F). Thus, limitation of serine availability by GSH preserves FoxP3 expression and Treg function.
Figure 7. Glutathione restricts de novo serine synthesis and enhances anti-tumor immune responses.
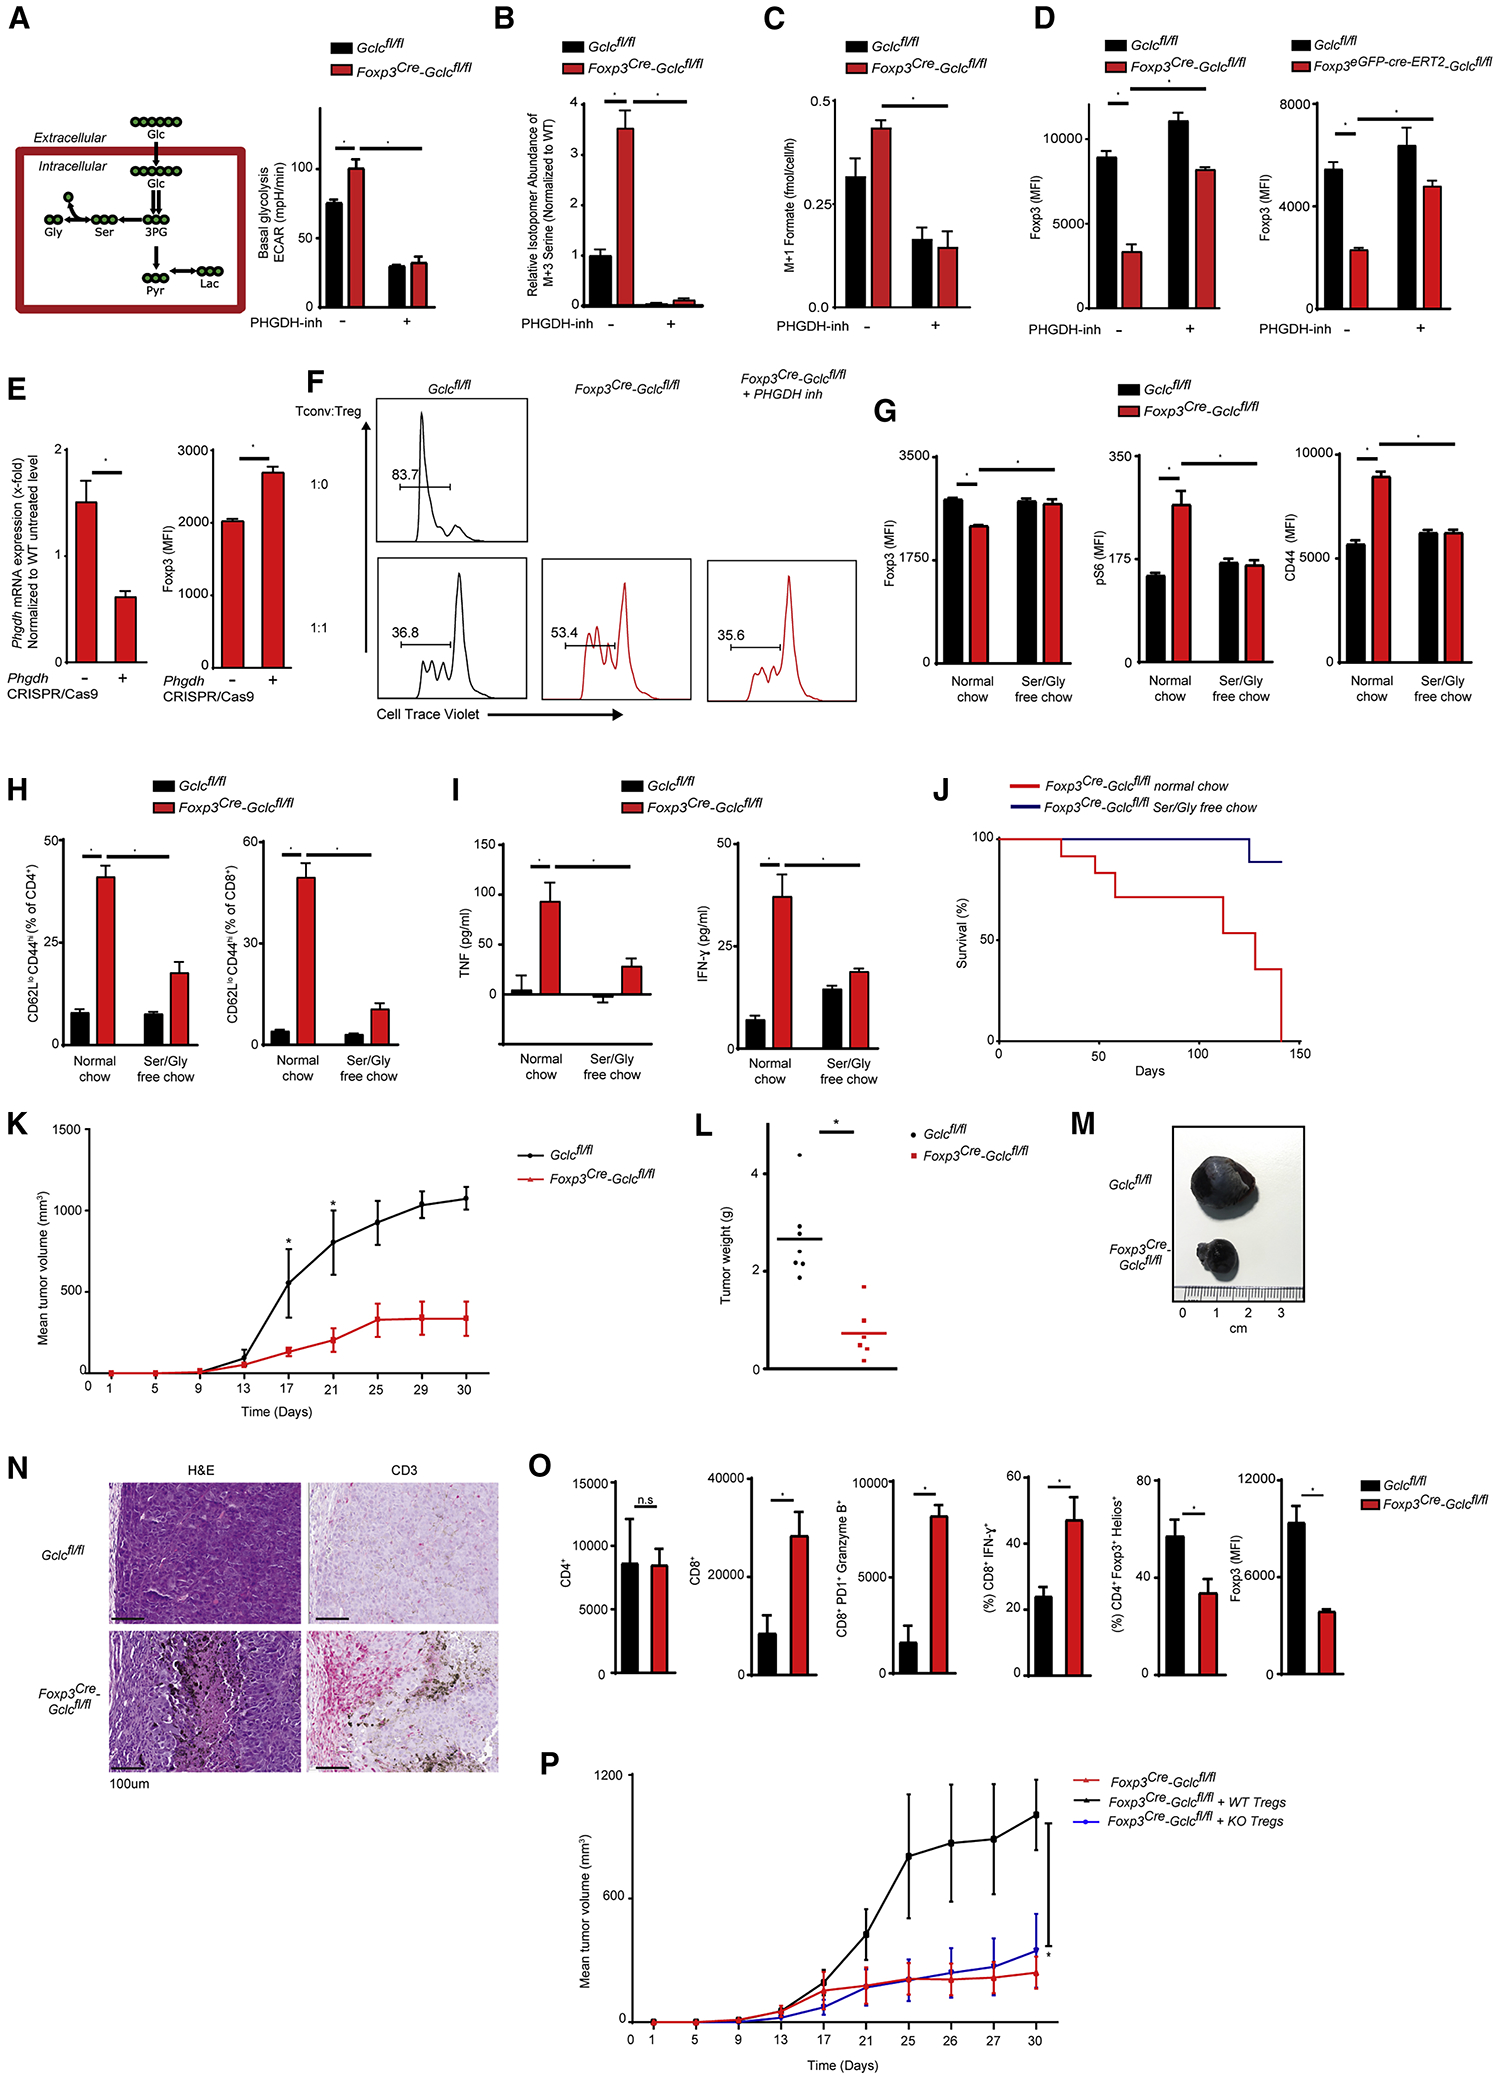
(A) Diagram of serine synthesis pathway (left), and quantification of ECAR of Gclcfl/fl and Foxp3cre-Gclcfl/fl iTregs cultured with/without 10 μM PHGDH inhibitor (right). Data are mean±SEM (n=3); 2 trials. (B) Mass isotopomer distribution of M+3 serine in the cells in (A) following incubation with [U-13C6]-glucose for 24hr. (C) Mass isotopomer distribution of M+1 formate in the cells in (A) following incubation with [U-13C6]-glucose for 24hr. (D) Intracellular staining and FCA of FoxP3 in Gclcfl/fl vs Foxp3cre-Gclcfl/fl (left) and Gclcfl/fl vs Foxp3eGPF-cre-ERT2-Gclcfl/fl (right) iTregs treated with/without PHGDH inhibitor. Gclcfl/fl vs Foxp3eGPF-cre-ERT2-Gclcfl/fl iTregs were co-incubated with 4-OHT. Data are mean±SEM (n=3); 3 trials. (E) Phgdh mRNA expression (left) and intracellular staining and FCA of FoxP3 (right) in Gclcfl/fl vs Foxp3cre-Gclcfl/fl iTregs that were nucelofected with sgRNAs specific for Phgdh or controls. Data are mean±SEM (n=3); 2 trials. (F) In vitro suppression assay of Gclcfl/fl vs Foxp3cre-Gclcfl/fl iTregs treated with PHGDH inhibitor prior to incubation with CTV-labeled Tconv at the indicated ratios; 3 trials. (G) Intracellular staining and FCA of FoxP3, pS6 and CD44 in splenic Tregs of Gclcfl/fl vs Foxp3cre-Gclcfl/fl mice (12wk) fed with normal chow or a serine/glycine-deficient diet for 9wk. Data are mean±SEM (n=4–11); 2 trials. (H) FCA and quantification of Teff (CD44hiCD62Llo) within CD4+ (left) and CD8+ (right) T cell populations in blood of the mice in (G). Data are mean±SEM (n=4–11); 2 trials. (I) ELISA of IFNγ and TNF in serum of the mice in (G). Data are mean±SEM (n=4–11); 2 trials. (J) Survival of Foxp3cre-Gclcfl/fl mice on normal chow (n=12) or a serine/glycine-deficient diet (n=9); (K-N) Gclcfl/fl and Foxp3cre-Gclcfl/fl mice (8wk) were transplanted s.c. with B16F10 melanoma cells. (K) Mean tumor volumes determined at the indicated times. (L) Quantification of tumor weights at time of sacrifice. Each dot = individual mouse. (M) Representative macroscopic images of tumors from transplanted Gclcfl/fl and Foxp3cre-Gclcfl/fl mice. (N) Histology of tumor sections from the mice in (F) stained with H&E or αCD3. Scale bars, 100 μm. Results are representative of 4 mice/group; 2 trials. (O) Quantification of the indicated TIL subsets in tumors of Gclcfl/fl and Foxp3cre-Gclcfl/fl mice treated as in (K). Data are mean±SEM (n=5); (P) Mean tumor volumes at the indicated times in Foxp3cre-Gclcfl/fl mice (8wk) transplanted s.c. with B16F10 melanoma cells and injected intravenously with nTregs from Gclcfl/fl (WT) or Foxp3cre-Gclcfl/fl (KO) mice at day 0. Data are mean±SEM (n=4) 2 trials. *p<0.05.
GSH regulates serine uptake and synthesis. Serine deprivation of control iTregs increased glucose-dependent GSH synthesis (Figure S7A), supporting interconnection of these pathways in a feedback loop. To investigate serine’s relevance in vivo, we fed serine/glycine-deficient food to 3wk old control and mutant mice. Serine/glycine-deficient food is well tolerated, measurably decreases circulating serine/glycine, and does not interfere with immune cell subsets (Ma et al., 2017; Maddocks et al., 2013; Maddocks et al., 2017). Serine deprivation in vivo increased FoxP3 but reduced pS6 and CD44 in mutant nTregs (Figure 7G), and decreased serum IFNγ and TNF as well as inflammatory T cells in mutant mice (Figure 7H, I). Strikingly, serine/glycine deprivation prevented mutant mouse spontaneous inflammation and death (Figure 7J), confirming the importance of serine metabolism and 1CMet in vivo.
To replicate our data in human Tregs, we isolated naïve T cells from peripheral blood of healthy donors and induced iTreg differentiation in vitro with TGFβ in the absence/presence of BSO. GSH was reduced in BSO-treated human iTregs (Figure S7B). FoxP3 was also decreased but pS6 was increased (Figure S7C, D). Serine deprivation of BSO-treated human iTregs restored FoxP3 and pS6 to control levels (Figure S7E, F). FoxP3 in BSO-treated human iTregs was also increased by blocking serine synthesis or restricting serine influx (Figure S7G). Lastly, BSO-treated human iTregs showed a profound loss of suppression (Figure S7H). All these data parallel the results obtained using our mouse model of Treg-specific Gclc deficiency.
Anti-tumor immunity is enhanced in Foxp3cre-Gclcfl/fl mice
Tregs can promote tumor growth by inhibiting Teff-mediated anti-tumor responses, and some tumors secrete substances driving Treg differentiation (Franchina et al., 2018b). Tumors often generate high ROS due to hypoxia or activities of cancer-associated macrophages or fibroblasts (Bhattacharyya and Saha, 2015; Henze and Mazzone, 2016; Sabharwal and Schumacker, 2014). These ROS inactivate Teffs and so dampen anti-tumor immunity (Bhattacharyya and Saha, 2015; Franchina et al., 2018b; Mak et al., 2017; Pilipow et al., 2018). GSH synthesis by T cells is thus a major defense against tumor-associated ROS. Our iTregs contained more intracellular GSH than Teffs (Figure 1D), in line with their greater ROS resistance (Huynh et al., 2015). This enhanced ROS resistance may allow Tregs to survive in the tumor microenvironment long enough to suppress anti-tumor responses by Teffs. Conversely, a loss of GSH that compromises Tregs suppressive capacity might allow Teff anti-tumor responses to proceed unchecked to limit cancer growth. To test this hypothesis, we examined anti-tumor immunity in Foxp3cre-Gclcfl/fl mice.
We subcutaneously (s.c.) injected Foxp3cre-Gclcfl/fl and control mice with B16 melanoma cells or MC38 colon adenocarcinoma cells and monitored cancer progression. In both cases, tumor growth was slower in Foxp3cre-Gclcfl/fl mice (Figure 7K, S7I), and tumor weight and size were reduced (Figure 7L, M, S7J). Tumor-infiltrating lymphocytes (TILs) were increased in tumors of mutant mice (Figure 7N). Absolute numbers and frequencies of CD4+ TILs were comparable but absolute numbers and frequencies of CD8+PD1+ Teffs and CD8+GranzymeB+ Teffs were increased in tumors of mutant mice (Figure 7O, S7K). Treg frequency was decreased in tumors of mutant mice and these Tregs showed reduced FoxP3 (Figure 7O). Adoptive transfer of control or Gclc-deficient nTregs into FoxP3-Cre-Gclcfl/fl mice on the day prior to B16 melanoma cell inoculation resulted in significant tumor development in mutant mice receiving control nTregs, whereas mutant mice receiving Gclc-deficient nTregs had still a greatly decreased tumor burden (Figure 7N). Thus, loss of Gclc in Tregs reduces their ability to impair anti-cancer Teff responses and thus boosts anti-tumor immunity.
DISCUSSION
ROS are both detrimental byproducts of metabolism and important signaling molecules during cellular activation and differentiation (Franchina et al., 2018a; Sena and Chandel, 2012). In Tconv, mitochondrial ROS are linked to activation, proliferation and effector functions (Devadas et al., 2002; Gulow et al., 2005; Jackson et al., 2004; Sena et al., 2013; Yi et al., 2006). Nevertheless, excessive ROS accumulation in these cells must be prevented by antioxidants like GSH. Accordingly, Gclc ablation in all T cells abrogates autoimmunity but also interferes with anti-viral responses (Lian et al., 2018; Mak et al., 2017). Prior to our study, GSH’s function in Tregs was unknown. Targeting Gclc specifically in this subset has revealed an unexpected mechanism by which GSH-mediated ROS-scavenging preserves mouse and human Treg functionality through restriction of serine metabolism.
Male Foxp3cre-Gclcfl/fl mice developed an IFNγ-driven lethal lymphoproliferative disease but were better able to suppress tumorigenesis. We have shown, in vitro and in vivo, that these effects are due to Gclc’s crucial role in Tregs suppressive function. A lack of GSH in Tregs reduced their FoxP3 and thus their suppressive capacity, a property restored by FoxP3 reconstitution. Surprisingly, Treg proliferation was increased in the absence of GSH, rather than decreased as in Tconv with genetic deletion of Gclc or subjected to pharmacological GCL inhibition (Hamilos et al., 1989; Mak et al., 2017; Suthanthiran et al., 1990). Thus, GSH has a unique function in Tregs.
Serine uptake and de novo synthesis were both increased in Gclc-deficient Tregs. Serine is utilized by Teffs and cancer cells to support proliferation (Labuschagne et al., 2014; Locasale et al., 2011; Ma et al., 2017; Maddocks et al., 2017; Possemato et al., 2011; Ron-Harel et al., 2016) and tumor invasion (Meiser et al., 2018), but we showed that serine interferes with Treg mediated suppression. Blocking serine uptake or de novo synthesis, restored FoxP3 and the suppressive capacity of mutants Tregs. Serine is a major substrate of 1CMet (Ducker and Rabinowitz, 2017), and we showed that formate production is increased in mutant Tregs in a manner driven by serine. Glycine starvation did not rescue FoxP3 in mutant Tregs, indicating a critical role for SHMT but not glycine cleavage. Previous studies have shown that glycine and serine are not always interchangeable (Labuschagne et al., 2014; Ma et al., 2017; Maddocks et al., 2017). However, while blocking SHMT in Gclc-deficient Tregs restored normal formate secretion and cell proliferation, it did not increase Foxp3. Thus, serine engages at least two distinct pathways in Gclc-deficient Tregs.
In vivo, inflammation and morbidity were drastically reduced in mutant mice fed on a serine/glycine-deficient diet. Serine and glycine are two NEAAs whose deprivation is well tolerated in vivo (Maddocks et al., 2013; Maddocks et al., 2017). Because an absence of dietary serine/glycine interferes with CD8+ T cell responses (Ma et al., 2017), the reduction of T cell activation in Gclc-deficient mice is likely due at least in part to a direct effect of serine/glycine deprivation on Teff responses. However, the complete absence of inflammation in serine/glycine-starved mutant mice points to a more profound effect. While we cannot rule out that other immune cell subsets are affected, Gclc-deficient Tregs of serine/glycine-deprived animals showed restored FoxP3, reduced mTOR signaling, and dampened cellular activation, validating our in vitro findings in vivo. Importantly, our study shows that elucidating the exact metabolic and molecular basis of a disease allows potential correction of the metabolic abnormality via a special diet that is aligned with the delineated disease mechanism. Our study might thus be a first step towards personalized treatment of metabolic diseases.
mTOR activation relies mainly on glutamine and leucine (Hara et al., 1998; Nicklin et al., 2009). However, we found that the enhanced serine uptake in mutant Tregs elevated their mTOR activity, paralleling a previous study (Ye et al., 2012). mTOR drives the expression of methylenetetrahydrofolate dehydrogenase (MTHFD)-2 to stimulate 1CMet and purine synthesis (Ben-Sahra et al., 2016), suggesting a feed-forward loop. Such a mechanism might explain how the increased serine levels and mTOR activity in Gclc-deficient Tregs support 1CMet. That these pathways are interlinked is indicated by our finding that preventing serine accumulation and inhibiting increased mTOR in mutant Tregs restored their FoxP3 and suppressive function. We therefore propose that, in normal Tregs, GSH limits serine uptake and de novo synthesis to keep mTOR in check, and that this control is critical for Treg function (Figure S7L).
To avoid any effects of inflammation, we assessed FACS-sorted nTregs from non-inflamed female Foxp3cre-Gclcfl/fl mice; iTregs in which Gclc deletion was 4-OHT-induced; mutant iTregs subjected to retroviral Gclc reconstitution; and human iTregs subjected to pharmacological GCLC blockade. All these experiments confirmed our findings in male Foxp3cre-Gclcfl/fl mice. Furthermore, our hypothesis that GSH limits serine and blocks mTOR matches a report that proliferating WT Tregs exhibit stronger mTOR signaling and glycolysis but reduced suppressive capacity (Gerriets et al., 2016). Similarly, constitutive mTOR activation due to deletion of PTEN, PP2A or TSC1 increases Treg numbers but impairs Treg mediated suppression (Apostolidis et al., 2016; Huynh et al., 2015; Park et al., 2013; Shrestha et al., 2015). Again, all these observations align with our findings that Gclc-deficient Tregs exhibit increased metabolic activity but are less functional, and that restriction of Treg metabolism reinstates a normal suppressive capacity.
Foxp3 expression in Gclc-deficient Tregs was increased by mTOR inhibition or Smad3 overexpression, in line with previous studies showing that mTOR blockade or genetic ablation favors Smad3-dependent induction of FoxP3+ T cells over other Th subsets (Delgoffe et al., 2009; Delgoffe et al., 2011). While Gclc ablation in Tconv reduced mTOR activation (Mak et al., 2017), the same mutation has the opposite effect in Tregs, implying a subset-specific function of GSH. Treg identity is largely determined by FoxP3 (Rudensky, 2011), and FoxP3 expression in non-Treg T cells induces certain Treg properties (Fontenot et al., 2003; Hori et al., 2003; Khattri et al., 2003). We found that FoxP3 expression in activated T cells shifted responses to BSO from mTOR inhibition to mTOR activation. Thus, FoxP3 expression combined with pharmacological GCLC inhibition recapitulated results obtained using Gclc-deficient mice. It appears that lineage-specific transcription factors shape metabolic responses in a subset-specific way.
We demonstrated that Gclc ablation increases ROS in Tregs. Mitochondrial ROS are decreased in Tconv with genetic deletion of mitochondrial complex III (Sena et al., 2013). Loss of complex III in Tregs abrogates their suppressive activity but does so independently of FoxP3 (Weinberg et al., 2019). Although ROS levels were not determined in the latter study, it seems that too much or too little ROS is detrimental to Treg function, and that multiple regulatory mechanisms can be engaged. Increased ROS triggers an NRF2 response (Kong and Chandel, 2018), as we observed in Gclc-deficient Tregs. A key NRF2 target is ASCT1 (Christensen, 1990; Fu et al., 2019; Hirotsu et al., 2012; Schafer et al., 2010), which is upregulated when T cells grow in an oxidative environment (Yang et al., 2018). We showed that SLC1A4 mRNA was upregulated in Gclc-deficient Tregs, and that ROS-scavenging decreased ASCT1 and serine uptake in these cells. In contrast, ASCT2 is not a NRF2 target and was equally expressed in control and Gclc-deficient Tregs. Inhibition of serine transport in mutant Tregs, or serine deprivation, increased FoxP3 and normalized their suppressive function. Thus, in Tregs, GSH controls ROS to limit NRF2 activation, which decreases ASCT1 and reduces serine import, thereby permitting full FoxP3 expression. We propose that, in Tregs, GSH is a stress sensor and routinely scavenges ROS to prevent redox imbalance. Without GSH, ROS accumulate and initiate an NRF2 stress response that increases serine import and synthesis in an effort to produce GSH. The intracellular accumulation of this serine fuels 1CMet driving Treg expansion but also stimulates mTOR, which reduces FoxP3 and dampens Tregs suppressive capacity (Figure S7L). Thus, there is a crucial stress-sensitive feedback loop between GSH and serine availability that controls Treg function.
In conclusion, we have shown that GSH is critical for maintaining Treg function crucial for immune homeostasis. This unexpected, subset-specific role for GSH in restraining serine metabolism in Tregs may offer novel opportunities to modulate their activities. In particular, our results may point the way to new therapies for cancers where subverted Tregs contribute to tumor progression.
Limitations of Study
1) We observed that Gclc regulates Treg metabolism in subset-specific way that is clearly distinct from its function in conventional T cells. However, it is difficult to postulate a mechanistic explanation for our results. Notably, FoxP3 expression alters the response to GSH depletion, a finding that would be interesting to study in detail. 2) We validated our mouse data in FoxP3-expressing human Tregs, but additional human Treg subsets exist that do not rely on FoxP3. It will be important to investigate whether and how GSH affects the metabolism and function of these subsets. 3) Our study depends on GSH depletion achieved using in vitro and in vivo mouse/human models. We show that GSH depletion interferes with Treg metabolism and increases ROS, and that ROS-scavenging normalizes cellular serine concentrations. However, we cannot exclude the possibility that GSH-dependent, but ROS-independent, mechanisms might contribute to our findings.
STAR ★ METHODS
LEAD CONTACT AND RESOURCE SHARING
Further information and requests for resources or reagents should be directed to and will be made available upon reasonable request by the Lead Contact, Dirk Brenner (dirk.brenner@lih.lu).
EXPERIMENTAL MODEL AND SUBJECT DETAILS
Primary cell culture
Natural regulatory T cells (nTregs), naïve CD4+ T cells, and CD4+ and CD8+ Tconv were isolated from mouse spleen and LN by magnetic bead sorting (Miltenyi Biotec). To induce regulatory T cells (iTregs), 2 × 10⁵ naïve T cells were cultured for four days in the presence of plate bound anti-CD3 antibody (αCD3; 5 μg/ml, Biolegend), soluble anti-CD28 antibody (αCD28; 1 μg/ml, Biolegend), recombinant human TGF-β1 (4 ng/ml, Bio-Techne), IL-2 (50U/ml, Miltenyi Biotec) and anti-IFNγ antibody (αIFNγ; 5 μg/ml, BD Biosciences). Naïve T cells were cultured in T cell media consisting of RPMI-1640 medium supplemented with 10% FCS (Sigma), 1% Penicillin/Streptomycin (Gibco), 1% L-Glutamine (Sigma), and 55 μM β-mercaptoethanol (Gibco). To isolate nTregs, the cells were labelled using the CD4+CD25+ Regulatory T cells isolation kit (Miltenyi Biotec) and magnetically sorted using the autoMACS® Pro Separator (Miltenyi Biotec) according to the manufacturer’s protocol. nTregs were cultured in T cell media in the presence of plate bound anti-CD3 antibody (αCD3; 5 μg/ml, Biolegend), soluble anti-CD28 antibody (αCD28; 5 μg/ml, Biolegend), IL-2 (500U, Miltenyi Biotec). To induce acute Gclc deletion, naïve CD4+ T cells were differentiated into iTregs in vitro in the presence of vehicle or 100 nM 4-hydroxytamoxifen (4-OHT) (Sigma) for 4 days.
For the human studies, buffy coats from healthy donors were provided by Croix-Rouge Luxembougeoise. The experimental setup was approved by the Croix-Rouge Luxembourgeoise (LIH-2019–0006). Human PBMCs were isolated using the Ficoll separation (HiSep™ LSM 1077, HiMedia Laboratory GmbH). Human naïve CD4+ T cells were isolated using the Human Naïve CD4+ T cells isolation kit II (Miltenyi Biotec). 2 × 10⁵ naïve CD4+ T cells were cultured for six days with ImmunoCult™ Human CD3/CD28 T cell activator (Stemcell Technologies), according to the manufacturer’s instructions. IL-2 (100U/ml) and TGF-β1 (4 ng/ml, Bio-Techne) were supplemented. The cells were differentiated in T cell media containing RPMI-1640 medium supplemented with 10% FCS (Sigma), 1% Penicillin/Streptomycin (Gibco), 1% L-Glutamine (Sigma), and 100 μM sodium pyruvate (Gibco).
Mouse models
Gclcfl/fl mice have been previously described (Chen et al., 2007) and were crossed to Foxp3cre-expressing mice [B6.129(Cg)-Foxp3™4(YFP/icre)Ayr/J] and Foxp3tm9(EGFP/cre/ERT2)Ayr/J (Jackson Laboratory). B6.129S7-Ifng™1Ts/J mice were obtained from The Jackson Laboratory. C57BL/6 and Rag1−/− mice were originally purchased from The Jackson Laboratory and bred in the SPF facility of the Luxembourg Institute of Health (LIH). Male and age-matched mice (6–12 weeks old) were used for all experiments unless otherwise indicated. For the serine free diet experiment, the mice were fed with normal or serine free diet as of 3 weeks of age (post weaning). The food was purchased from Special Diets Services (SDS, diet code 827030).
METHOD DETAILS
Cell sorting and Flow cytometry
To stain extracellular surface molecules, the cells were incubated in FACS buffer (PBS with 1% FCS and 5mM EDTA pH 8.0) together with specific antibodies for at least 30 minutes at 4°C protected from light. To detect intracellular phosphoproteins, the cells were fixed in 2% formaldehyde and permeabilized in 0.01% saponin. To identify transcription factors and intracellular nuclear proteins, the cells were fixed using the eBioscience™ Foxp3/Transcription Factor Fixation kit and permeabilized using the respective permeabilization buffer, according to the manufacturer’s protocol. For cytokine stainings, the cells were fixed using the BD Cytofix/Cytoperm solution according to the manufacturers instructions. To stain intracellular ROS, the cells were incubated with dichlorofluorescein diacetate (DCF-DA, Sigma) for 30 minutes at 37° C in RPMI medium (non-supplemented). To measure NBDG uptake, the cells were incubated with 50 μM2-NBDG (Thermo Fisher Scientific) for 2 hours at 37° C in glucose free RPMI (non-supplemented). For cell sorting, the cells were sorted using Aria II (BD Biosciences). Experiments were done in accordance with the guidelines for flow cytometry and cell sorting (Cossarizza et al., 2019).
Treg suppression assay
Purified nTregs (CD4+CD25+) and Tconv (Tconv; CD4+ CD25−) were magnetically sorted using a CD4+CD25+ Regulatory T cell Isolation Kit (Miltenyi Biotec). Tconv were labeled with CellTrace™ Violet Cell Proliferation (ThermoFisher Scientific) and cultured with irradiated antigen-presenting cells plus αCD3, with or without Tregs at various Tconv:Treg ratios. After 72 hr, the proliferation of Teff cells was analysed by flow cytometry.
T cell transfer-induced colitis
Rag1−/− mice were adoptively transferred with 4 × 10⁵ WT Teffs (CD4+CD45RBhi), either alone or in combination with 2 × 10⁵ Tregs (CD4+CD45RBlow) from Gclcfl/fl or Foxp3cre-Gclcfl/f mice. To this end, cells were purified by FACS sorting (Aria II, BD) prior to intravenous (i.v.) injection into mice. Recipient mice were weighed and examined every day for signs of disease. Cells from mesenteric LN were subjected to flow cytometric analysis. Colonic tissues were fixed and stained with H&E and αCD3 Ab and subjected to histological analyses.
Isotopic labelling
Tregs were incubated for 24hr in RPMI 1640 containing [U-13C6]-glucose (11.1 mmol/L; Cambridge Isotope Laboratories) or [U-13C]-glutamine (2 mmol/L; Cambridge Isotope Laboratories), both conjugated to bovine serum albumin (Sigma). For serine tracing, cells were cultured for 24hr in serine/glycine-free medium (Teknova) supplemented with 0.01g/l glycine plus 400μM [U-13C3]-serine (Eurisotop (CLM-1574-H). Extraction of intracellular metabolites, GC-MS measurement, MID calculations, determinations of fractional carbon contributions, and substractions of natural isotope abundance were performed as described (Battello et al., 2016) using the MetaboliteDetector software package. Glucose, lactate and amino acid concentrations were determined using an YSI 2950D Biochemistry Analyzer (YSI Incorporated). Formate quantification was performed following MCF derivatization and GC-MS analysis as previously described (Meiser et al., 2016).
Tumor model and Treg adoptive transfer
B16F10 melanoma cells (2×10⁵; ATCC) in 100 l sterile PBS were injected subcutaneously into the shaved left flank of each mouse. Tumor volume was calculated daily: . Mice were sacrificed at day 30 or when tumor volume exceeded 1.2 cm3. For the Treg transfers, 1×10⁶ of Gclcfl/fl and Foxp3cre-Gclcfl/fl Tregs were magnetically sorted using the CD4+CD25+ Regulatory T cells isolation kit (Miltenyi Biotec) and magnetically sorted using the autoMACS® Pro Separator (Miltenyi Biotec) according to the manufacturer’s protocol. Purified Tregs were intravenously injected prior B16 melanoma inoculation at experimental day 0.
TILs isolation
Isolated tumors were cut into small pieces and digested with enzymes A, D, and R obtained from the Mouse Tumor Dissociation Kit (Miltenyi Biotec) according to the manufacturer’s protocol. The digestion was followed by tumor dissociation using GentleMACS Octo Dissociator (37C_m_TDK_1). The cells were then filtered through 70 μm filter and washed with RPMI. The TILS were isolated using CD45 (TIL) Microbeads (Miltenyi Biotec) according to the manufacturer’s protocol. The TILs were analyzed by flow cytometry or stimulated by PMA/Ionomycin for cytokine analysis.
In vivo rapamycin treatment
Rapamycin was prepared in 100% ethanol and diluted in vehicle (5% polyethylene glycol and 5% Tween 80). Male Gclcfl/fl and Foxp3cre-Gclcfl/fl mice of age 6 weeks were intraperitoneally injected with 100μg rapamycin (LC Laboratories) or vehicle every other day for 30 days. Mice were sacrificed at day 30 and organs extracted for analysis.
Expression plasmids and retroviral transduction
The plasmids pMIT-Foxp3-CD90.1, pMIT-CD90.1 and pMig-RI-STAT5-CA (constitutively active) were provided by M. Lohoff (University of Marburg, Germany) (Bothur et al., 2015). pMigRI-GFP was provided by R. Jones (Van Andel Institute, USA). Murine full length cDNA of Gclc and Smad3 were synthesized into pMigRI-GFP using the EcoRI restriction site (GeneCust, France). For retroviral transduction, retroviral supernatants were added to in vitro-differentiated iTreg cells whose culture medium had been stored. Cells and viral supernatants were centrifuged at 2700 rpm for 1.5hr at 37°C to achieve spin infection. Infected cells were re-cultured in the stored culture medium for 72hr before MACS-sorting to identify CD90.1 co-expression or fluorescence based FACS cell sorting. Infected iTreg cells were used for experiments as described in the main text.
Cytokine quantification
To induce intracellular cytokine expression, T cells were restimulated in vitro with phorbol 12-myristate 13-acetate (PMA; Sigma, 50ng/mL) plus calcium ionophore A23187 (Ionomycin; Sigma, 750ng/mL) for 6hr. The cells were analyzed with flow cytometry. Serum concentrations of IL-2, TNF, IFNγ, and immunoglobulins were quantified by ELISA using the appropriate kits and protocols from eBioscience.
CRISPR/Cas9 genomic editing
1×10⁶ enriched naïve CD4 T cells were cultured in Treg skewing media for 48h prior transfection with sgRNAs. sgRNAs targeting murine Asct1 and Phgdh were obtained from Synthego (CRISPRevolution sgRNA EZ Kit, Synthego). sgRNAs were electroporated as described previously (Nüssing et al., 2019). Briefly, 1 μl of 0.3 nmol sgRNAs were incubated with 0.3 μl Cas9 Nuclease to a final volume of 5 μl for 10 min at room temperature. Pre differentiated CD4 regulatory T cells were resuspended in 95 μl P3 buffer (P3 primary cell 4D-Nucleofector™ system, mixed with the pre-prepared sgRNA/Cas9 solution, and subjected to electroporation. The cells were transferred to 1ml RPMI containing 10% FCS, glutamine, pen/strep and 100U IL-2 and cultured for 72 hours before further analysis.
Quantitative PCR
RNA was isolated using a NucleoSpin RNA Kit (Macherey-Nagel) and cDNA was prepared using a QuantiTect Rev. Transcription Kit (Qiagen). RT-PCR was carried out using Sybrgreen Master Mix (ABI) and the primers listed under ‘Oligonucleotides’. Reactions were run on an ABI 7500HT Fast qRT-PCR instrument. Data were normalized to GAPDH transcription and analyzed using the ΔΔCt method as previously described (Mak et al., 2017).
Histology and Immunohistochemistry
Specimens for histology and immunohistochemistry analyses were prepared and examined as previously described (Brenner et al., 2014).
GSH, GSSG, and formate determination
The GSH content of 2×10⁵ Treg cells/well was measured by GSH-Glo™ (Promega). Formate release into culture medium was quantified using a formate assay kit (Sigma). Intracellular GSH and GSSG was quantified as reported by (Meiser et al., 2016). Briefly, 2 million Treg cells were harvested and washed with 0.9% saline solution before adding 100 μl ice-cold MilliQ water with 20 μg/ml labeled GSH (13C2, 15N; Cambridge Isotope Laboratories) as internal standard, followed by an equal volume of ice-cold 5% trichloroacetic acid. Cells were shaken at 1400 rpm at 4°C for 10 min and subsequently centrifuged at 21.000×g and 4°C for 5 min. 150 μl of the supernatant were transferred into a 2-ml-LC vial with micro insert. 10 μl of the extract were injected into an Agilent 1290 Infinity II equipped with a Waters Acquity UPLC HSS T3 (100 × 2.1 mm, 1.8 μm). Mobile phase A was composed of 0.1% formic acid and B was composed of methanol with 0.1% formic acid. The system was operated at 0.45 ml/min. The total run time of the method was 20 min starting with 1% B for 10 min, then increasing to 99% B at 12 min, which was held for 2 min. B was reduced to 1% after 15 min and kept for the rest of the run. Mass spectra were acquired in positive mode using a Bruker maXis.
Lamina propria isolation
Colons were cut longitudinally and incubated for 10 min at 37°C in Hank’s Balanced Salt Solution (HBSS) containing 15mM Hepes, 10% FCS and 5mM EDTA. The colonic tissue was recovered in a 100 μM strainer and transferred again in HBSS (15mM Hepes, 10% FCS, 5mM EDTA) to re-incubate once more. After collection in a 100 μM strainer, the tissue was washed in RPMI containing 15mM Hepes, 10% FCS for 5 minutes at 37°C. Then the tissue was cut into small pieces, and digested for 30 min at 37°C in 10ml RPMI containing 0.1 mg/ml DNAse I (Roc he) and 0.083 mg/ml Liberase (Roche). Tissue suspensions were passed through a 40 μM strainer, pelleted, and overlayed on a 40–75% Percoll gradient. After centrifugation at 800g for 20 minutes at 20°C (without break), lamina propria lymphocytes (L PLs) were collected at the 40–75% Percoll interface, washed, and resuspended in RPMI containing 10% FCS. Lamina propria lymphocytes were identified by flow cytometric analysis.
Metabolic phenotyping
iTreg cells were seeded XF Seahorse DMEM medium in a density of 3 × 10⁵ cells/well. The extracellular acidification rate (ECAR) and oxygen consumption rate (OCR) were determined using the XF Glycolytic Stress Test and XF Cell Mitochondrial Stress Test kits, respectively, according to the manufacturer’s protocol (Agilent).
RNA-sequencing
Libraries were prepared with 500 ng total RNA using the Total RNA TruSeq mRNA Stranded Library Prep Kit (Illumina) according to the manufacturer’s protocol. Briefly, mRNA pulldown was performed using an oligodT primer attached to magnetic beads. To preserve strandness information, the second strand synthesis was performed using dUTP incorporation, ensuring that only the first strand was PCR-amplified. The libraries were quantified using the Qubit dsDNA HS assay kit (Thermofisher) and an Agilent 2100 Bioanalyzer. The pooled library was sequenced on an Illumina NextSeq500 instrument according to the manufacturer’s instructions.
Transcriptomic and data analyses
Demultiplexing of the sequenced libraries was performed using bcl2fastq (v2.18.0.12). Mapping was performed using star aligner (v 2.5.2b), and the count matrix was produced using the featureCounts function from the subread package (v 1.5.2) using mouse annotation v GRCm38.87. Foxp3cre-Gclcfl/fl and Gclcfl/fl mRNA data were analyzed using R statistical software (3.5.1) and DESeq2 (v 1.14.1) with default parameters to detect differential gene expression. We selected 1163 genes as having significant differences in expression based on a minimum log2 fold change of 0.58 and an adjusted p value < 0.05. Gene Set Enrichment Analysis on KEGG gene sets was performed using Bioconductor (v 3.7) and clusterProfiler (v 3.9.2). The Signaling Pathway Impact Analysis tool SPIA was used to identify activated or inhibited pathways.
QUANTIFICATION AND STATISTICAL ANALYSIS
Data are represented as the mean ± SEM and have at least n = 3 per group (refer to figure legend to detailed information), with p values determined by unpaired Student’s t-test or two-way ANOVA test using Prism 7.0 (GraphPad). P values were indicated with asterisks * and p values ≤0.05 were considered significant.
DATA SOFTWARE AVAILABILITY
The GEO accession number for the RNA-seq data from control and FoxP3-deficient Tregs file in this paper is GEO: GSE145311
Supplementary Material
KEY RESOURCES TABLE
| REAGENT or RESOURCE | SOURCE | IDENTIFIER |
|---|---|---|
| Antibodies | ||
| CD4-PE Clone GK1.5 (1:200) | Biolegend | #100408 |
| CD25-PE Clone PC61 (1:200) | Biolegend | #102008 |
| IRF4-PE Clone IRF4.3F4 (1:200) | Biolegend | #646404 |
| F4/80-PE Clone BM8 (1:200) | Biolegend | #123110 |
| CD185-PE Clone L138D7 (1:200) | Biolegend | #145504 |
| CD90.1-PE Clone HIS51 (1:200) | Thermo Fisher | #12-0900-81 |
| CD45RB-PE Clone C363-16A (1:200) | Biolegend | #103308 |
| Ki-67-PE Clone 16A8 (1:200) | Biolegend | #652404 |
| TGF-β1,-β2,-β3-PE Clone 1D11 (1:200) | R&D Systems | #IC1835P |
| Tbet-PE/Cy7 Clone 4B10 (1:200) | Biolegend | #644824 |
| F4/80-PE/Cy7 Clone BM8 (1:200) | Biolegend | #123114 |
| Bcl6-PE/Cy7 Clone 7D1 (1:200) | Biolegend | #358512 |
| Helios-PE/Cy7 Clone 22F6 (1:200) | Biolegend | #137236 |
| pSTAT5-PE/Cy7 Clone SRBCZY (1:200) | Thermo Fisher | #25-9010-42 |
| CD8a-APC Clone 53-6.7 (1:200) | Biolegend | #100712 |
| IFN-γ-APC Clone XMG1.2 (1:200) | Biolegend | #505810 |
| Foxp3-APC Clone FJK-16s (1:200) | Thermo Fisher | #17-5773-82 |
| pS6-APC Clone cupk43k (1:200) | Therno Fisher | #17-9007-42 |
| GL7-APC Clone GL7 (1:200) | Biolegend | #144606 |
| I-A/I-E-APC Clone M5/114.15.2 (1:200) | Biolegend | #107614 |
| CD98-APC Clone RL388 (1:200) | Biolegend | #128210 |
| pS473-APC Clone M89-61 (1:200) | BD Biosciences | #560343 |
| Granzyme B-APC Clone NGZB (1:200) | Thermo Fisher | #50-8898-62 |
| IgG (H+L)-APC (1:500) | Thermo Fisher | #A21244 |
| CD3ε-APC-Cy7 Clone 145-2C11 (1:200) | Biolegend | #100330 |
| CD86-FITC Clone GL-1 (1:200) | Biolegend | #105006 |
| Perforin-FITC Clone eBioOMAK-D (1:200) | Thermo Fisher | #11-9392-82 |
| RORγT-BV421 Clone Q31-378 (1:200) | BD Biosciences | #562894 |
| CD95-BV421 Clone Jo2 (1:200) | BD Biosciences | #562633 |
| CD152-BV421 Clone UC10-4B9 (1:200) | Biolegend | #106312 |
| CD134-BV421 Clone OX-86 (1:200) | Biolegend | #119411 |
| CD62L-Pacific Blue Clone MEL-14 (1:200) | Biolegend | #104424 |
| CD25-Pacific Blue Clone PC61 (1:200) | Biolegend | #102022 |
| TNF-α-Pacific Blue Clone MP6-XT22 (1:200) | Biolegend | #506318 |
| pmTOR-Pacific Blue Clone MRRBY (1:200) | Biolegend | #48-9718-42 |
| c-Myc-Pacific Blue Clone D84C12 (1:200) | Cell Signalling | #14426S |
| Foxp3-V450 Clone MF23 (1:200) | BD Biosciences | #561293 |
| CD44-PerCP/Cy5.5 Clone IM7 (1:200) | Biolegend | #103032 |
| CD86-PerCP Clone GL-1 (1:200) | Biolegend | #105026 |
| CD45R/B220-BV510 Clone RA3-6B2 (1:200) | Biolegend | #103248 |
| CD69-BV605 Clone H1.2F3 (1:200) | Biolegend | #104530 |
| IL-17A-BV605 Clone TC11-18H10 (1:200) | BD Biosciences | #564169 |
| CD279-BV605 Clone 29F.1A12 (1:200) | Biolegend | #135220 |
| CD4-BV785 Clone GK1.5 (1:200) | Biolegend | #100453 |
| CD19-BV785 Clone 6D5 (1:200) | Biolegend | #115543 |
| Glut1-Alexa Fluor®488 Clone EPR3915 (1:200) | Abcam | #ab195359 |
| pSMAD3 Ser423, Ser425 | Thermo Fisher | #44-246G |
| pAMPK alpha-1,2 (Thr172) | Thermo Fisher | #44-1150G |
| Purified anti-mouse CD3ε Clone 145-2C11 | Biolegend | #100340 |
| Purified anti-mouse CD28 Clone | Biolegend | #102112 |
| Human CD3/CD28 T Cell activator | Stemcell Technologies | #10971 |
| Anti-Mouse IFN-γ Clone XMG1.2 | BD Biosciences | #554408 |
| Biological Samples | ||
| Healthy control buffy coat | Croix-Rouge Luxembourgeoise | N/A |
| Chemicals, Peptides, and Recombinant Proteins | ||
| RPMI 1640 (without L-Glutamine) | Lonza | #BE12-167F |
| RMPI 1640 (without glucose, serine, glycine) | Teknova | #50-190-8105 |
| DMEM (with glucose and L-Glutamine) | Lonza | #BE12-604F |
| Hank’s Balanced Salt Solutions | Lonza | #BE10-543F |
| SILAC RPMI 1640 Flex Media | Gibco | #15347143 |
| Seahorse XF base medium without phenol red | Agilent Technologies | #103335-100 |
| PBS | Lonza | #BE17-516F |
| FBS | Sigma-Aldrich | #TMS-013-B |
| Penicillin/Streptomycin | Gibco | #11548876 |
| L-Glutamine | Sigma-Aldrich | #G3126-100G |
| 2-mercaptoethanol | Gibco | #11508916 |
| Sodium pyruvate | Gibco | #12539059 |
| Recombinant human TGF-β | R&D Systems | #240-B-002 |
| recombinant human IL-2 | Miltenyi Biotec | #130-120-333 |
| 2-Deoxy-D-glucose | Sigma-Aldrich | #D6134-1G |
| D-(+)-glucose | Sigma-Aldrich | #G8270-5KG |
| Oligomycin A | Sigma-Aldrich | #75351-5MG |
| FCCP | Sigma-Aldrich | #C2920-10MG |
| Antimycin A | Sigma-Aldrich | #A8674-25MG |
| Rotenone | Sigma-Aldrich | #R8875-1G |
| Phorbol 12-myristate 13-acetate (PMA) | Sigma-Aldrich | #P8139-1MG |
| Calcium Ionophore | Sigma-Aldrich | #C7522-1MG |
| N-Acetyl-L-cysteine | Sigma-Aldrich | #A7250-50G |
| L-Glutathione reduced | Sigma-Aldrich | #G4251-10G |
| Rapamycin | Invivogen | #tlrl-rap |
| Rapamycin | LC Laboratories | N/A |
| L-(+)-α-Phenylglycine | Sigma-Aldrich | #237647-25G |
| 4-Hydroxytamoxifen | Sigma-Aldrich | #H6278-10MG |
| PKUMDL-WQ-2101 | Sigma-Aldrich | #SML1970-5MG |
| L-buthionine-sulfoximine | Sigma-Aldrich | #B2515-1G |
| SHIN1 | Aobious | #AOB36697 |
| Thymidine, [6-3H]-, 5mCi (185MBq) | Perkin Elmer | # NET355005MC |
| SYBR™ Fast Green Master Mix | Applied Biosystems | # 10459604 |
| Corning™ Cell-Tak Cell and Tissue Adhesive | Thermo Fisher | # 10317081 |
| 13C6-glucose | Cambridge Isotope Lab | # CLM-1396 |
| 13C5-L-Glutamine | Cambridge Isotope Lab | # CLM-1822-H |
| 13C3-serine | Cambridge Isotope Lab | #CLM-1574-H |
| GolgiPlug™ | BD Biosciences | #555029 |
| Cell Trace Violet | Thermo Fisher | #C34557 |
| Mitotracker Deep Red | Thermo Fisher | # M22426 |
| Molecular Probes™ Carboxy-H2DCFDA | Thermo Fisher | #11500146 |
| Molecular Probes™ 2-NBDG | Thermo Fisher | #11569116 |
| Zombie NIR™ Fixable Viability Kit | Biolegend | #423106 |
| Saponin | Sigma-Aldrich | #S4521-25G |
| Formaldehyde | Sigma-Aldrich | #252549-1L |
| Hepes | Sigma-Aldrich | #H4034-100G |
| EDTA | Sigma-Aldrich | #E9884-100G |
| Polyethylene glycol | Sigma-Aldrich | #P1458-50ML |
| Ethanol | VWR | #20821330 |
| Tween 80 | Sigma-Aldrich | #P1754-1L |
| Methanol | Sigma-Aldrich | #1060351000 |
| Chloroform | Sigma-Aldrich | #34854-1L-M |
| Trichloroacetic acid | Sigma-Aldrich | #T6399-100G |
| DNAse I | Sigma-Aldrich | #10104159001 |
| Liberase | Sigma-Aldrich | #5401020001 |
| Percoll® | Sigma-Aldrich | #GE17-0891-01 |
| HiSep™ LSM 1077 | HiMedia Laboratory | #LS001-500ML |
| Critical Commercial Assays | ||
| Naive CD4+ T Cell Isolation Kit | Miltenyi Biotec | #130-104-453 |
| CD4+ T Cell Isolation Kit | Miltenyi Biotec | #130-104-454 |
| CD90.1 Microbeads | Miltenyi Biotec | #130-094-523 |
| CD4+ CD25+ Regulatory T Cell Isolation Kit | Miltenyi Biotec | #130-091-041 |
| Tumor Dissociation Kit | Miltenyi Biotec | #130-096-730 |
| CD45 (TIL) Microbeads | Miltenyi Biotec | #130-110-618 |
| Naive CD4+ T Cell Isolation Kit II, human | Miltenyi Biotect | #130-094131 |
| Seahorse XFe96 Fluxpak | Agilent Technologies | #102416-100 |
| Foxp3/Transcription Factor Staining Buffer Set | Thermo Fisher | #15151976 |
| Fixation/Permeabilization solution kit | BD Biosciences | #554701 |
| Lyse/Fix Buffer 5x | BD Biosciences | #558049 |
| Perm buffer III | BD Biosciences | #558050 |
| QuantiTect Reverse Transcription Kit | Qiagen | #205314 |
| RNA 6000 Nano Kit | Agilent Technologies | #5067-1511 |
| NucleoSpin RNA 250 | Macherey-Nagel | #740 955 250 |
| IFN gamma Mouse Uncoated ELISA Kit | Thermo Fisher | #88-7314-88 |
| TNF alpha Mouse Uncoated ELISA Kit | Thermo Fisher | #88-7324-88 |
| Invitrogen ™ IL-2 Mouse Uncoated ELISA Kit | Thermo Fisher | #15520997 |
| Experimental Models: Cell Lines | ||
| B16F10 | Dr. Philipp Lang | |
| MC38 | ATCC | |
| Experimental Models: Organisms/Strains | ||
| Gclcfl/fl : B6 | Maketal., 2017 | N/A |
| Foxp3YFP-Cre : B6 | The Jackson laboratory | #016959 |
| Foxp3eGFP-Cre-ERT2 : B6 | The Jackson laboratory | #016961 |
| Rag1−/− : B6 | The Jackson laboratory | #002216 |
| IFNγ−/− : B6 | The Jackson laboratory | #002287 |
| Deposited Data | ||
| RNA-Seq | This paper | |
| Oligonucleotides | ||
| Gclc: F: G G CTCTCTG CACCATCACTT R :GTTAGAGTACCGAAGCGGGG |
This paper | |
| Foxp3: F:CCCATCCCCAGGAGTCTTG R : ACCAT G ACT AG GG G CACT GTA |
This paper | |
| Slc1a4: F:TGCTCTGGCGTTCATCATCA R :AGTGAATG CGG CAACCACAA |
This paper | |
| Slc1a5: F :TGG CCAG CAAG ATTGTG GAG AT R :TTTGCGGGTGAAGAGGAAGT |
This paper | |
| HPRT: F:TCAGTCAACGGGGGACATAAA R :GGGGCTGTACTGCTTAACCAG |
This paper | |
| TBP: F :G AAG AAC AAT CCAG ACTAG CAG CA R : CCTTATAG G G AACTT C AC AT C AC AG |
This paper | |
| PHGDH: F: ATG GCCTTCG CAAATCTG C R :AGTTCAGCTATCAGCTCCTCC |
This paper | |
| sgRNA Phgdh C*U*U*GCCUUGCCUUGCCCAUG G*G*C*AAGAGCUCACCUUCUUC U*U*C*UUACAGGCAGAUUCCCC |
Synthego | N/A |
| sgRNA Slc1a4 A*C*C*AGGCUGCAAACCACCAG G*C*A*UCUCGCCCGGGAAGGCC C*C*U*CAGCGCCGCGCCCAUGC |
Synthego | N/A |
| Recombinant DNA | ||
| pMIT-Foxp3-CD90.1 | Dr. Michael Lohoff | |
| pMIT-CD90.1 | Dr. Michael Lohoff | |
| pMIG-RI-STAT5-CA | Dr. Michael Lohoff | |
| pMIG-RI | Dr. Russell Jones | |
| pMIG-RI-Gclc | This paper | |
| pMIG-RI-Smad3 | This paper | |
| Software and Algorithms | ||
| FlowJo Software | Tree Star | N/A |
| Continued | ||
| Graphpad Prism | GraphPad Software, Inc | N/A |
| Wave Software | Agilent | N/A |
| Adobe Illustrator | Adobe systems | N/A |
Highlights.
Ablation of Gclc in Tregs causes autoimmunity and increases anti-tumor responses
Gclc-derived GSH is needed for the suppressive function of Tregs in vitro and in vivo
GSH in Tregs regulates serine concentrations and metabolism which impact mTOR and FoxP3
Serine/glycine deficient diet rescues mutant mice from lethal inflammation
Context and Significance.
Regulatory T cells (Tregs) restrict inflammation to maintain healthy body functions. Dysregulation of Treg metabolism thus leads to inflammatory disease, however, our knowledge of their metabolic needs is limited. Researchers of the Luxembourg Institute of Health describe a novel metabolic control mechanism in Tregs that serves as a barrier against autoimmunity. The antioxidant glutathione restricts serine metabolism in Tregs to preserve their suppressive function such that glutathione depletion boosts anti-tumor immunity. Glutathione is thus a stress sensor in Tregs whose manipulation holds promise for anti-inflammatory and anti-tumor therapies. The authors further show that elucidation of the metabolic mechanism of a disease can lead to its mitigation by a rationally-designed diet, setting a new direction for future treatment of metabolic diseases.
ACKNOWLEDGEMENTS
We thank S. Storn, A. Oudin (LIH, Luxembourg) and LIH’s Animal Welfare Structure for animal services, and are grateful to the Metabolomics Platform of Luxembourg Centre for Systems Biomedicine (LCSB). We also thank: B. Camara (Univ. Marburg, Germany) for technical help; M. Brenner for general support; and Croix-Rouge Luxembourgeoise and all study blood donors. DB is supported by FNR-ATTRACT (A14/BM/7632103) and FNR-CORE grants (C15/BM/10355103), (C18/BM/12691266). DB, LB, LG, JT, MZ, AE are funded by FNR-PRIDE (PRIDE/11012546/NEXTIMMUNE), and DB, AE, PW by (PRIDE17/11823097/MicrOH). DB and DGF are supported by FNR-RIKEN (TregBar/11228353). VV holds grant NIH/NIAAA (5R24AA022057). JT was funded by FNR-CORE (C16/BM/11342695). ML and DDG are funded by Deutsches Zentrum für Infektionsforschung and University Hospital Giessen Marburg. TWM is funded by grants from the National Multiple Sclerosis Society and Canadian Institutes of Health Research. CBKT and RT are supported by DKH (110663, CBKT, RT) and BMBF (01ZX1401B, CBKT). JM is supported by FNR-ATTRACT (A18/BM/11809970) and INTER-BMBF grant (18/13399110).
Footnotes
Publisher's Disclaimer: This is a PDF file of an unedited manuscript that has been accepted for publication. As a service to our customers we are providing this early version of the manuscript. The manuscript will undergo copyediting, typesetting, and review of the resulting proof before it is published in its final form. Please note that during the production process errors may be discovered which could affect the content, and all legal disclaimers that apply to the journal pertain.
DECLARATION OF INTERESTS
The authors declare no competing interests.
References
- Almeida L, Lochner M, Berod L, and Sparwasser T (2016). Metabolic pathways in T cell activation and lineage differentiation. Semin Immunol 28, 514–524. [DOI] [PubMed] [Google Scholar]
- Apostolidis SA, Rodriguez-Rodriguez N, Suarez-Fueyo A, Dioufa N, Ozcan E, Crispin JC, Tsokos MG, and Tsokos GC (2016). Phosphatase PP2A is requisite for the function of regulatory T cells. Nat Immunol 17, 556–564. [DOI] [PMC free article] [PubMed] [Google Scholar]
- Ben-Sahra I, Hoxhaj G, Ricoult SJH, Asara JM, and Manning BD (2016). mTORC1 induces purine synthesis through control of the mitochondrial tetrahydrofolate cycle. Science 351, 728–733. [DOI] [PMC free article] [PubMed] [Google Scholar]
- Bhattacharyya S, and Saha J (2015). Tumour, Oxidative Stress and Host T Cell Response: Cementing the Dominance. Scand J Immunol 82, 477–488. [DOI] [PubMed] [Google Scholar]
- Bothur E, Raifer H, Haftmann C, Stittrich AB, Brustle A, Brenner D, Bollig N, Bieringer M, Kang CH, Reinhard K, et al. (2015). Antigen receptor-mediated depletion of FOXP3 in induced regulatory T-lymphocytes via PTPN2 and FOXO1. Nat Commun 6, 8576. [DOI] [PMC free article] [PubMed] [Google Scholar]
- Brenner D, Brustle A, Lin GH, Lang PA, Duncan GS, Knobbe-Thomsen CB, St Paul M, Reardon C, Tusche MW, Snow B, et al. (2014). Toso controls encephalitogenic immune responses by dendritic cells and regulatory T cells. Proc Natl Acad Sci U S A 111, 1060–1065. [DOI] [PMC free article] [PubMed] [Google Scholar]
- Broer S, and Broer A (2017). Amino acid homeostasis and signalling in mammalian cells and organisms. Biochem J 474, 1935–1963. [DOI] [PMC free article] [PubMed] [Google Scholar]
- Christensen HN (1990). Role of amino acid transport and countertransport in nutrition and metabolism. Physiol Rev 70, 43–77. [DOI] [PubMed] [Google Scholar]
- Cossarizza A, Chang HD, Radbruch A, Acs A, Adam D, Adam-Klages S, Agace WW, Aghaeepour N, Akdis M, Allez M, et al. (2019). Guidelines for the use of flow cytometry and cell sorting in immunological studies (second edition). Eur J Immunol 49, 1457–1973. [DOI] [PMC free article] [PubMed] [Google Scholar]
- Dang EV, Barbi J, Yang HY, Jinasena D, Yu H, Zheng Y, Bordman Z, Fu J, Kim Y, Yen HR, et al. (2011). Control of T(H)17/T(reg) balance by hypoxia-inducible factor 1. Cell 146, 772–784. [DOI] [PMC free article] [PubMed] [Google Scholar]
- Delgoffe GM, Kole TP, Zheng Y, Zarek PE, Matthews KL, Xiao B, Worley PF, Kozma SC, and Powell JD (2009). The mTOR kinase differentially regulates effector and regulatory T cell lineage commitment. Immunity 30, 832–844. [DOI] [PMC free article] [PubMed] [Google Scholar]
- Delgoffe GM, Pollizzi KN, Waickman AT, Heikamp E, Meyers DJ, Horton MR, Xiao B, Worley PF, and Powell JD (2011). The kinase mTOR regulates the differentiation of helper T cells through the selective activation of signaling by mTORC1 and mTORC2. Nat Immunol 12, 295–303. [DOI] [PMC free article] [PubMed] [Google Scholar]
- Devadas S, Zaritskaya L, Rhee SG, Oberley L, and Williams MS (2002). Discrete generation of superoxide and hydrogen peroxide by T cell receptor stimulation: selective regulation of mitogen-activated protein kinase activation and fas ligand expression. J Exp Med 195, 59–70. [DOI] [PMC free article] [PubMed] [Google Scholar]
- Ducker GS, and Rabinowitz JD (2017). One Carbon Metabolism in Health and Disease. Cell Metab 25, 27–42. [DOI] [PMC free article] [PubMed] [Google Scholar]
- Dumont FJ, and Su Q (1996). Mechanism of action of the immunosuppressant rapamycin. Life Sci 58, 373–395. [DOI] [PubMed] [Google Scholar]
- Fontenot JD, Gavin MA, and Rudensky AY (2003). Foxp3 programs the development and function of CD4+CD25+ regulatory T cells. Nat Immunol 4, 330–336. [DOI] [PubMed] [Google Scholar]
- Foster AC, Rangel-Diaz N, Staubli U, Yang JY, Penjwini M, Viswanath V, and Li YX (2017). Phenylglycine analogs are inhibitors of the neutral amino acid transporters ASCT1 and ASCT2 and enhance NMDA receptor-mediated LTP in rat visual cortex slices. Neuropharmacology 126, 70–83. [DOI] [PubMed] [Google Scholar]
- Franchina DG, Dostert C, and Brenner D (2018a). Reactive Oxygen Species: Involvement in T Cell Signaling and Metabolism. Trends Immunol 39, 489–502. [DOI] [PubMed] [Google Scholar]
- Franchina DG, He F, and Brenner D (2018b). Survival of the fittest: Cancer challenges T cell metabolism. Cancer Lett 412, 216–223. [DOI] [PubMed] [Google Scholar]
- Francisco LM, Salinas VH, Brown KE, Vanguri VK, Freeman GJ, Kuchroo VK, and Sharpe AH (2009). PD-L1 regulates the development, maintenance, and function of induced regulatory T cells. J Exp Med 206, 3015–3029. [DOI] [PMC free article] [PubMed] [Google Scholar]
- Fu J, Xiong Z, Huang C, Li J, Yang W, Han Y, Paiboonrungruan C, Major MB, Chen KN, Kang X, et al. (2019). Hyperactivity of the transcription factor Nrf2 causes metabolic reprogramming in mouse esophagus. J Biol Chem 294, 327–340. [DOI] [PMC free article] [PubMed] [Google Scholar]
- Gerriets VA, Kishton RJ, Johnson MO, Cohen S, Siska PJ, Nichols AG, Warmoes MO, de Cubas AA, MacIver NJ, Locasale JW, et al. (2016). Foxp3 and Toll-like receptor signaling balance Treg cell anabolic metabolism for suppression. Nat Immunol 17, 1459–1466. [DOI] [PMC free article] [PubMed] [Google Scholar]
- Gerriets VA, Kishton RJ, Nichols AG, Macintyre AN, Inoue M, Ilkayeva O, Winter PS, Liu X, Priyadharshini B, Slawinska ME, et al. (2015). Metabolic programming and PDHK1 control CD4+ T cell subsets and inflammation. J Clin Invest 125, 194–207. [DOI] [PMC free article] [PubMed] [Google Scholar]
- Goberdhan DC, Wilson C, and Harris AL (2016). Amino Acid Sensing by mTORC1: Intracellular Transporters Mark the Spot. Cell Metab 23, 580–589. [DOI] [PMC free article] [PubMed] [Google Scholar]
- Gulow K, Kaminski M, Darvas K, Suss D, Li-Weber M, and Krammer PH (2005). HIV-1 trans-activator of transcription substitutes for oxidative signaling in activation-induced T cell death. J Immunol 174, 5249–5260. [DOI] [PubMed] [Google Scholar]
- Hamilos DL, Zelarney P, and Mascali JJ (1989). Lymphocyte proliferation in glutathione-depleted lymphocytes: direct relationship between glutathione availability and the proliferative response. Immunopharmacology 18, 223–235. [DOI] [PubMed] [Google Scholar]
- Hara K, Yonezawa K, Weng QP, Kozlowski MT, Belham C, and Avruch J (1998). Amino acid sufficiency and mTOR regulate p70 S6 kinase and eIF-4E BP1 through a common effector mechanism. J Biol Chem 273, 14484–14494. [DOI] [PubMed] [Google Scholar]
- Henze AT, and Mazzone M (2016). The impact of hypoxia on tumor-associated macrophages. J Clin Invest 126, 3672–3679. [DOI] [PMC free article] [PubMed] [Google Scholar]
- Herbig K, Chiang EP, Lee LR, Hills J, Shane B, and Stover PJ (2002). Cytoplasmic serine hydroxymethyltransferase mediates competition between folate-dependent deoxyribonucleotide and S-adenosylmethionine biosyntheses. J Biol Chem 277, 38381–38389. [DOI] [PubMed] [Google Scholar]
- Hirotsu Y, Katsuoka F, Funayama R, Nagashima T, Nishida Y, Nakayama K, Engel JD, and Yamamoto M (2012). Nrf2-MafG heterodimers contribute globally to antioxidant and metabolic networks. Nucleic Acids Res 40, 10228–10239. [DOI] [PMC free article] [PubMed] [Google Scholar]
- Hori S, Nomura T, and Sakaguchi S (2003). Control of regulatory T cell development by the transcription factor Foxp3. Science 299, 1057–1061. [DOI] [PubMed] [Google Scholar]
- Huynh A, DuPage M, Priyadharshini B, Sage PT, Quiros J, Borges CM, Townamchai N, Gerriets VA, Rathmell JC, Sharpe AH, et al. (2015). Control of PI(3) kinase in Treg cells maintains homeostasis and lineage stability. Nat Immunol 16, 188–196. [DOI] [PMC free article] [PubMed] [Google Scholar]
- Jackson SH, Devadas S, Kwon J, Pinto LA, and Williams MS (2004). T cells express a phagocyte-type NADPH oxidase that is activated after T cell receptor stimulation. Nat Immunol 5, 818–827. [DOI] [PubMed] [Google Scholar]
- Kaplan E, Zubedat S, Radzishevsky I, Valenta AC, Rechnitz O, Sason H, Sajrawi C, Bodner O, Konno K, Esaki K, et al. (2018). ASCT1 (Slc1a4) transporter is a physiologic regulator of brain d-serine and neurodevelopment. Proc Natl Acad Sci U S A 115, 9628–9633. [DOI] [PMC free article] [PubMed] [Google Scholar]
- Khattri R, Cox T, Yasayko SA, and Ramsdell F (2003). An essential role for Scurfin in CD4+CD25+ T regulatory cells. Nat Immunol 4, 337–342. [DOI] [PubMed] [Google Scholar]
- Kim HJ, Barnitz RA, Kreslavsky T, Brown FD, Moffett H, Lemieux ME, Kaygusuz Y, Meissner T, Holderried TA, Chan S, et al. (2015). Stable inhibitory activity of regulatory T cells requires the transcription factor Helios. Science 350, 334–339. [DOI] [PMC free article] [PubMed] [Google Scholar]
- Kong H, and Chandel NS (2018). Regulation of redox balance in cancer and T cells. J Biol Chem 293, 7499–7507. [DOI] [PMC free article] [PubMed] [Google Scholar]
- Labuschagne CF, van den Broek NJ, Mackay GM, Vousden KH, and Maddocks OD (2014). Serine, but not glycine, supports one carbon metabolism and proliferation of cancer cells. Cell Rep 7, 1248–1258. [DOI] [PubMed] [Google Scholar]
- Lian G, Gnanaprakasam JR, Wang T, Wu R, Chen X, Liu L, Shen Y, Yang M, Yang J, Chen Y, et al. (2018). Glutathione de novo synthesis but not recycling process coordinates with glutamine catabolism to control redox homeostasis and directs murine T cell differentiation. Elife 7. [DOI] [PMC free article] [PubMed] [Google Scholar]
- Locasale JW, Grassian AR, Melman T, Lyssiotis CA, Mattaini KR, Bass AJ, Heffron G, Metallo CM, Muranen T, Sharfi H, et al. (2011). Phosphoglycerate dehydrogenase diverts glycolytic flux and contributes to oncogenesis. Nat Genet 43, 869–874. [DOI] [PMC free article] [PubMed] [Google Scholar]
- Lowther DE, Goods BA, Lucca LE, Lerner BA, Raddassi K, van Dijk D, Hernandez AL, Duan X, Gunel M, Coric V, et al. (2016). PD-1 marks dysfunctional regulatory T cells in malignant gliomas. JCI Insight 1. [DOI] [PMC free article] [PubMed] [Google Scholar]
- Lu SC (2009). Regulation of glutathione synthesis. Mol Aspects Med 30, 42–59. [DOI] [PMC free article] [PubMed] [Google Scholar]
- Ma EH, Bantug G, Griss T, Condotta S, Johnson RM, Samborska B, Mainolfi N, Suri V, Guak H, Balmer ML, et al. (2017). Serine Is an Essential Metabolite for Effector T Cell Expansion. Cell Metab 25, 345–357. [DOI] [PubMed] [Google Scholar]
- Maddocks OD, Berkers CR, Mason SM, Zheng L, Blyth K, Gottlieb E, and Vousden KH (2013). Serine starvation induces stress and p53-dependent metabolic remodelling in cancer cells. Nature 493, 542–546. [DOI] [PMC free article] [PubMed] [Google Scholar]
- Maddocks ODK, Athineos D, Cheung EC, Lee P, Zhang T, van den Broek NJF, Mackay GM, Labuschagne CF, Gay D, Kruiswijk F, et al. (2017). Modulating the therapeutic response of tumours to dietary serine and glycine starvation. Nature 544, 372–376. [DOI] [PubMed] [Google Scholar]
- Mak TW, Grusdat M, Duncan GS, Dostert C, Nonnenmacher Y, Cox M, Binsfeld C, Hao Z, Brustle A, Itsumi M, et al. (2017). Glutathione Primes T Cell Metabolism for Inflammation. Immunity 46, 675–689. [DOI] [PubMed] [Google Scholar]
- Meiser J, Schuster A, Pietzke M, Vande Voorde J, Athineos D, Oizel K, Burgos-Barragan G, Wit N, Dhayade S, Morton JP, et al. (2018). Increased formate overflow is a hallmark of oxidative cancer. Nat Commun 9, 1368. [DOI] [PMC free article] [PubMed] [Google Scholar]
- Meiser J, Tumanov S, Maddocks O, Labuschagne CF, Athineos D, Van Den Broek N, Mackay GM, Gottlieb E, Blyth K, Vousden K, et al. (2016). Serine one carbon catabolism with formate overflow. Sci Adv 2, e1601273. [DOI] [PMC free article] [PubMed] [Google Scholar]
- Meister A (1983). Selective modification of glutathione metabolism. Science 220, 472–477. [DOI] [PubMed] [Google Scholar]
- Nakagawa H, Sido JM, Reyes EE, Kiers V, Cantor H, and Kim HJ (2016). Instability of Helios-deficient Tregs is associated with conversion to a T-effector phenotype and enhanced antitumor immunity. Proc Natl Acad Sci U S A 113, 6248–6253. [DOI] [PMC free article] [PubMed] [Google Scholar]
- Nicklin P, Bergman P, Zhang B, Triantafellow E, Wang H, Nyfeler B, Yang H, Hild M, Kung C, Wilson C, et al. (2009). Bidirectional transport of amino acids regulates mTOR and autophagy. Cell 136, 521–534. [DOI] [PMC free article] [PubMed] [Google Scholar]
- Nüssing S, House IG, Kearney CJ, Vervoort SJ, Beavis PA, Oliaro J, Johnstone RW, Trapani JA, and Parish IA (2019). Efficient CRISPR/Cas9 gene ablation in uncultured naïve mouse T cells for in vivo studies. bioRxiv, 730812. [DOI] [PubMed] [Google Scholar]
- Park Y, Jin HS, Lopez J, Elly C, Kim G, Murai M, Kronenberg M, and Liu YC (2013). TSC1 regulates the balance between effector and regulatory T cells. J Clin Invest 123, 5165–5178. [DOI] [PMC free article] [PubMed] [Google Scholar]
- Pearce EL, Poffenberger MC, Chang CH, and Jones RG (2013). Fueling immunity: insights into metabolism and lymphocyte function. Science 342, 1242454.24115444 [Google Scholar]
- Pilipow K, Scamardella E, Puccio S, Gautam S, De Paoli F, Mazza EM, De Simone G, Polletti S, Buccilli M, Zanon V, et al. (2018). Antioxidant metabolism regulates CD8+ T memory stem cell formation and antitumor immunity. JCI Insight 3. [DOI] [PMC free article] [PubMed] [Google Scholar]
- Possemato R, Marks KM, Shaul YD, Pacold ME, Kim D, Birsoy K, Sethumadhavan S, Woo HK, Jang HG, Jha AK, et al. (2011). Functional genomics reveal that the serine synthesis pathway is essential in breast cancer. Nature 476, 346–350. [DOI] [PMC free article] [PubMed] [Google Scholar]
- Reardon C, Lechmann M, Brustle A, Gareau MG, Shuman N, Philpott D, Ziegler SF, and Mak TW (2011). Thymic stromal lymphopoetin-induced expression of the endogenous inhibitory enzyme SLPI mediates recovery from colonic inflammation. Immunity 35, 223–235. [DOI] [PMC free article] [PubMed] [Google Scholar]
- Ren W, Liu G, Yin J, Tan B, Wu G, Bazer FW, Peng Y, and Yin Y (2017). Amino-acid transporters in T-cell activation and differentiation. Cell Death Dis 8, e2655. [DOI] [PMC free article] [PubMed] [Google Scholar]
- Ron-Harel N, Santos D, Ghergurovich JM, Sage PT, Reddy A, Lovitch SB, Dephoure N, Satterstrom FK, Sheffer M, Spinelli JB, et al. (2016). Mitochondrial Biogenesis and Proteome Remodeling Promote one carbon Metabolism for T Cell Activation. Cell Metab 24, 104–117. [DOI] [PMC free article] [PubMed] [Google Scholar]
- Rubtsov YP, Rasmussen JP, Chi EY, Fontenot J, Castelli L, Ye X, Treuting P, Siewe L, Roers A, Henderson WR Jr., et al. (2008). Regulatory T cell-derived interleukin-10 limits inflammation at environmental interfaces. Immunity 28, 546–558. [DOI] [PubMed] [Google Scholar]
- Rudensky AY (2011). Regulatory T cells and Foxp3. Immunol Rev 241, 260–268. [DOI] [PMC free article] [PubMed] [Google Scholar]
- Sabharwal SS, and Schumacker PT (2014). Mitochondrial ROS in cancer: initiators, amplifiers or an Achilles’ heel? Nat Rev Cancer 14, 709–721. [DOI] [PMC free article] [PubMed] [Google Scholar]
- Schafer M, Dutsch S, auf dem Keller U, Navid F, Schwarz A, Johnson DA, Johnson JA, and Werner S (2010). Nrf2 establishes a glutathione-mediated gradient of UVB cytoprotection in the epidermis. Genes Dev 24, 1045–1058. [DOI] [PMC free article] [PubMed] [Google Scholar]
- Sena LA, and Chandel NS (2012). Physiological roles of mitochondrial reactive oxygen species. Mol Cell 48, 158–167. [DOI] [PMC free article] [PubMed] [Google Scholar]
- Sena LA, Li S, Jairaman A, Prakriya M, Ezponda T, Hildeman DA, Wang CR, Schumacker PT, Licht JD, Perlman H, et al. (2013). Mitochondria are required for antigen-specific T cell activation through reactive oxygen species signaling. Immunity 38, 225–236. [DOI] [PMC free article] [PubMed] [Google Scholar]
- Shi LZ, Wang R, Huang G, Vogel P, Neale G, Green DR, and Chi H (2011). HIF1alpha-dependent glycolytic pathway orchestrates a metabolic checkpoint for the differentiation of TH17 and Treg cells. J Exp Med 208, 1367–1376. [DOI] [PMC free article] [PubMed] [Google Scholar]
- Shrestha S, Yang K, Guy C, Vogel P, Neale G, and Chi H (2015). Treg cells require the phosphatase PTEN to restrain TH1 and TFH cell responses. Nat Immunol 16, 178–187. [DOI] [PMC free article] [PubMed] [Google Scholar]
- Suthanthiran M, Anderson ME, Sharma VK, and Meister A (1990). Glutathione regulates activation-dependent DNA synthesis in highly purified normal human T lymphocytes stimulated via the CD2 and CD3 antigens. Proc Natl Acad Sci U S A 87, 3343–3347. [DOI] [PMC free article] [PubMed] [Google Scholar]
- Tibbetts AS, and Appling DR (2010). Compartmentalization of Mammalian folate-mediated one carbon metabolism. Annu Rev Nutr 30, 57–81. [DOI] [PubMed] [Google Scholar]
- Tone Y, Furuuchi K, Kojima Y, Tykocinski ML, Greene MI, and Tone M (2008). Smad3 and NFAT cooperate to induce Foxp3 expression through its enhancer. Nat Immunol 9, 194–202. [DOI] [PubMed] [Google Scholar]
- Wang Q, Liberti MV, Liu P, Deng X, Liu Y, Locasale JW, and Lai L (2017). Rational Design of Selective Allosteric Inhibitors of PHGDH and Serine Synthesis with Anti-tumor Activity. Cell Chem Biol 24, 55–65. [DOI] [PMC free article] [PubMed] [Google Scholar]
- Weinberg SE, Singer BD, Steinert EM, Martinez CA, Mehta MM, Martinez-Reyes I, Gao P, Helmin KA, Abdala-Valencia H, Sena LA, et al. (2019). Mitochondrial complex III is essential for SC of regulatory T cells. Nature 565, 495–499. [DOI] [PMC free article] [PubMed] [Google Scholar]
- Wing K, and Sakaguchi S (2010). Regulatory T cells exert checks and balances on self tolerance and autoimmunity. Nat Immunol 11, 7–13. [DOI] [PubMed] [Google Scholar]
- Yamamoto T, Nishizaki I, Nukada T, Kamegaya E, Furuya S, Hirabayashi Y, Ikeda K, Hata H, Kobayashi H, Sora I, et al. (2004). Functional identification of ASCT1 neutral amino acid transporter as the predominant system for the uptake of L-serine in rat neurons in primary culture. Neurosci Res 49, 101–111. [DOI] [PubMed] [Google Scholar]
- Yang X, Xia R, Yue C, Zhai W, Du W, Yang Q, Cao H, Chen X, Obando D, Zhu Y, et al. (2018). ATF4 Regulates CD4(+) T Cell Immune Responses through Metabolic Reprogramming. Cell Rep 23, 1754–1766. [DOI] [PMC free article] [PubMed] [Google Scholar]
- Ye J, Fan J, Venneti S, Wan YW, Pawel BR, Zhang J, Finley LW, Lu C, Lindsten T, Cross JR, et al. (2014). Serine catabolism regulates mitochondrial redox control during hypoxia. Cancer Discov 4, 1406–1417. [DOI] [PMC free article] [PubMed] [Google Scholar]
- Ye J, Mancuso A, Tong X, Ward PS, Fan J, Rabinowitz JD, and Thompson CB (2012). Pyruvate kinase M2 promotes de novo serine synthesis to sustain mTORC1 activity and cell proliferation. Proc Natl Acad Sci U S A 109, 6904–6909. [DOI] [PMC free article] [PubMed] [Google Scholar]
- Yi JS, Holbrook BC, Michalek RD, Laniewski NG, and Grayson JM (2006). Electron transport complex I is required for CD8+ T cell function. J Immunol 177, 852–862. [DOI] [PubMed] [Google Scholar]
Associated Data
This section collects any data citations, data availability statements, or supplementary materials included in this article.