

Abstract
High expression of 2′,5′‐oligoadenylate synthetase 1 (OAS1), which adds AMP residues in 2′,5′ linkage to a variety of substrates, is observed in many cancers as a part of the interferon‐related DNA damage resistance signature (IRDS). Poly(ADP‐ribose) (PAR) is rapidly synthesized from NAD + at sites of DNA damage to facilitate repair, but excessive PAR synthesis due to extensive DNA damage results in cell death by energy depletion and/or activation of PAR‐dependent programmed cell death pathways. We find that OAS1 adds AMP residues in 2′,5′ linkage to PAR, inhibiting its synthesis in vitro and reducing its accumulation in cells. Increased OAS1 expression substantially improves cell viability following DNA‐damaging treatments that stimulate PAR synthesis during DNA repair. We conclude that high expression of OAS1 in cancer cells promotes their ability to survive DNA damage by attenuating PAR synthesis and thus preventing cell death.
Keywords: oligoadenylate synthetase, PARP1, parthanatos, PARylation
Subject Categories: Autophagy & Cell Death; DNA Replication, Repair & Recombination
The interferon‐inducible gene OAS1 inhibits poly(ADP‐ribose) chain elongation in response to DNA damaging signals, to promote survival of cancer cells despite accumulation of damaged DNA.

Introduction
In many different cancers, resistance to DNA‐damaging therapies is associated with high expression of a specific group of genes, designated the interferon‐related DNA damage signature or IRDS (Khodarev et al, 2004, 2007; Weichselbaum et al, 2008). The rapid expression of genes in response to type I and type III interferons (IFNs) is driven by ISGF3, the canonical, tripartite transcription factor that is activated by tyrosine phosphorylation of its STAT1 and STAT2 subunits. Our previous work revealed that the expression of the smaller IRDS subset, representing about 25% of all IFN‐induced genes, is driven by un‐phosphorylated ISGF3 (U‐ISGF3), lacking phosphorylation of STATs 1 and 2 on tyrosine, which accumulates gradually in IFN‐treated cells (Cheon et al, 2013). However, how any IRDS protein induces resistance to DNA damage is not known.
2′,5′‐oligoadenylate synthetases (OASs) 1, 2, and 3 are IFN‐induced, double‐stranded (ds) RNA‐dependent enzymes that mediate innate immune anti‐viral responses (Rebouillat & Hovanessian, 1999; Kumar et al, 2000; Kristiansen et al, 2011). The OAS1, OAS2, and OAS3 genes, clustered on human chromosome 12q24, are among the most highly expressed IRDS genes, both in tumors and in therapy‐resistant cell lines, with OAS1 expressed more than the other two isoforms (Khodarev et al, 2004; Weichselbaum et al, 2008) (Di et al, 2020). Therefore, it was logical to investigate whether the OASs might somehow mediate the resistance to DNA damage that is characteristic of cells with high IRDS expression. All three enzymatically active OASs (OAS1‐3) synthesize short 5′‐phosphorylated oligoadenylates, called 2‐5A [px5′A(2′p5′A)n; x = 1–3; n ≥ 2] from ATP, which are linked by 2′,5′ phosphodiester bonds (Kerr & Brown, 1978). The only well‐established biological function of 2‐5A is to facilitate the dimerization and activation of the latent endoribonuclease RNase L during viral infection, resulting in the degradation of both viral and cellular single‐stranded RNAs, inhibiting viral replication and promoting cell death (reviewed in Dong & Silverman, 1995; Player & Torrence, 1998; Silverman, 2007). However, our recent data show that OAS3 is both necessary and sufficient to activate RNase L in response to infection with several different human RNA viruses that replicate in the cytoplasm, or in response to transfection with poly(I):poly(C) (Li et al, 2016). Importantly, the three OAS isoforms are located in subcellular compartments in addition to the cytoplasm, including the nucleus and mitochondria, in a cell type‐specific manner (Wathelet et al, 1986; Chebath et al, 1987; Marie et al, 1990; Besse et al, 1998; Lin et al, 2009; Kjaer et al, 2014). These observations suggest that OAS1 and OAS2 are likely to have alternative functions.
Whereas activated OAS3 and RNase L together facilitate cell death in response to viral infection or treatment with dsRNA, the IRDS results in tumor cell survival in response to chemo‐ or radiotherapy. To better understand the roles of the OASs in the IRDS phenotype, we investigated their ability to synthesize non‐canonical 2‐5A species that do not activate RNase L. In vitro studies have demonstrated that OASs are versatile 2′,5′‐nucleotidyl transferases that can produce a wide variety of molecules with 2′,5′ linkages. Acceptors for the OAS‐catalyzed addition of 2′,5′‐AMP residues from ATP include NAD+, tRNAs, A5′p45′A, poly(rA), and ADP‐ribose (ADPr) (Ferbus et al, 1981; Cayley & Kerr, 1982; Player & Torrence, 1998). Our 1984 paper (Hersh et al, 1984) showed that African green monkey kidney cells treated with IFN and then infected with the DNA virus SV40, which replicates in the nucleus, produced a variety of 2‐5A species, most of which did not activate RNase L and therefore could not be canonical 2‐5A.
Since ADP‐ribose can be used as an acceptor for the addition of 2′,5′‐AMP, we hypothesized that OASs might add 2‐5A to poly(ADP‐ribose) (PAR), which is required for the repair of damaged DNA. The addition of PAR to proteins by nuclear PAR polymerase 1 (PARP1) is a major post‐translational modification that occurs in response to a variety of stimuli that cause intrinsic or extrinsic cellular stress. Depending on the type and scale of the damage imposed, PARylation impacts the fate of stressed cells, promoting either DNA repair or cell death (Luo & Kraus, 2012; Gupte et al, 2017). PARP1 binds to DNA strand breaks, resulting in an activating conformational change that initiates PAR synthesis (Eustermann et al, 2015; Ray Chaudhuri & Nussenzweig, 2017). PARP1 uses NAD+ to synthesize PAR polymers that are attached to acceptor proteins, including PARP1 itself as the major target. The PAR polymers serve as scaffolds for the assembly of DNA repair proteins, including end‐processing enzymes, DNA ligases, and their co‐factors (Gupte et al, 2017). The acute synthesis of PAR chains is followed by their rapid degradation, which is essential for subsequent DNA repair (Verheugd et al, 2016; O'Sullivan et al, 2019). The products of PAR hydrolysis, mono‐ and poly(ADPr), can translocate to the cytoplasm (Barkauskaite et al, 2015), where free PAR initiates caspase‐independent programmed cell death by releasing apoptosis‐inducing factor (AIF) from mitochondria. In the cytoplasm, AIF binds to a nuclease, macrophage migration inhibitory factor (MIF), and the complex translocates to the nucleus, where it hydrolyzes the DNA. This process is termed PAR‐mediated necroptosis or parthanatos (Wang et al, 2009, 2016; Virag et al, 2013).
OASs are latent enzymes that require activation by dsRNA species that satisfy specific structural criteria (Donovan et al, 2013). Viral dsRNAs are typical OAS activators (Player & Torrence, 1998; Lin et al, 2009; Kristiansen et al, 2011), but dsRNA species that are present naturally in the nuclei of normal cells (Gantier & Williams, 2007; Chalupnikova et al, 2013) may possibly serve as endogenous activators of OASs in that compartment. Indeed, a recent study estimated the numbers of potential host dsRNA OAS activators as > 1,000 for microRNAs, 10–100 for lncRNAs, and 10–100 for coding RNAs per cell (Donovan et al, 2013). Because infection with SV40 did not result in the accumulation of canonical 2‐5A (Hersh et al, 1984), we posited that, in contrast to the ability of cytoplasmic viral dsRNA to activate the synthesis of canonical 2‐5A, the nuclear SV40 DNA virus might cause activation of nuclear OASs and production of non‐canonical forms of 2‐5A, possibly mediated by virus‐induced DNA damage. Importantly, as shown in a later study, infection with SV40 is accompanied by DNA damage, PARP activation, and PAR synthesis (Gordon‐Shaag et al, 2003), thus providing non‐canonical substrates for nuclear OASs.
In this study, we show that OAS1, but not OAS2 or OAS3, limits the synthesis of PAR in response to DNA damage by adding 2′‐5′‐AMP residues to PAR, and prevents parthanatos, providing new insight as to how the elevated expression of OAS1 that is seen in many cancers, but not in normal cells, selectively promotes cancer cell survival following DNA damage.
Results
Construction and characterization of cell lines with genetically modified OAS expression
To study the involvement of specific OAS isozymes in cell death in response to DNA damage, we used CRISPR‐Cas9 gene editing to create OAS1‐3 single‐, double‐, and triple‐knockout cell lines (KO1, 2, and 3; DKO 1/2, 1/3, and 2/3; TKO) from human prostate cancer PC3 cells and from normal human mammary epithelial cells immortalized with hTERT (referred to as HME cells) (Fig 1A and B, left panels). We also used Flag‐tagged OAS1‐3 lentiviral constructs to obtain cells with increased expression of individual OASs in all three double‐knockout cells (DKO2/3+O1, etc.) (Fig 1A and B, right panels, and Fig EV1A and B). In addition, we used Flag‐tagged OAS1‐3 lentiviral constructs to obtain cells with increased expression of individual OASs from parental HME cells (OAS1hi, OAS2hi, OAS3hi). The levels of ectopically expressed, Flag‐tagged OAS1 corresponded well with the levels induced by treatment with IFNβ for 2 days, while the levels of expression of Flag‐tagged OAS3, and especially OAS2, were much higher (Fig 1C). Ectopic OAS1 expression in these cells (DKO2/3+O1) was relatively low, but significantly higher than that in DKO2/3 cells, as judged by RT–PCR (Fig 1A and B) and Western data (Fig EV1A). We expressed the p42 isoform of OAS1, which is endogenous for HME and PC3 cells as confirmed by genotyping for the A/G single nucleotide polymorphism rs10774671, which causes differential splicing of the human OAS1 gene (Bonnevie‐Nielsen et al, 2005) (Appendix Table S1).
Figure 1. Characterization of endogenous and ectopic expression of OAS1‐3 in cell lines with genetically modified OAS expression.

- Characterization of OAS1‐3 expression in parental and OAS‐knockout PC3 cells, obtained using CRISPR‐Cas9 technology. Left: Western blot (WB) analyses of the expression of OAS1, 2, and 3 in clones of OAS single‐, double‐, or triple‐knockout PC3 cells (KO, DKO, TKO), treated with IFNβ (500 IU/ml) for 24 h, to increase OAS expression. sgOAS1‐3—single‐guide RNA for OAS1‐3. β‐actin is shown as a loading control. Right: analysis of the expression of OAS1, 2, and 3 in PC3 DKO cells with increased expression of the remaining OAS, without IFNβ treatment. OAS1 expression in DKO2/3 cells was measured by qRT–PCR due to insufficient sensitivity of anti‐OAS1 (see Fig EV1A), OAS2 and 3 expression was detected by WB. The gene expression data are presented as mean ± SD of triplicates.**P < 0.001 in Student's t‐test.
- Characterization of OAS1‐3 expression in parental and OAS‐knockout HME cells, obtained using CRISPR‐Cas9 technology. Left: WB analyses of the expression of OAS1, 2, and 3 in selected clones of HME cells in which OAS1‐3 were knocked out, to produce OAS single‐, double‐, or triple‐knockout cells (KO, DKO, TKO), treated with 100 IU/ml IFNβ for 24 h to increase the levels of OAS expression. sgOAS1‐3—single‐guide RNA for OAS1‐3. β‐actin is shown as a loading control. Right: The expression of OAS1, 2, and 3 in HME DKO cells with increased expression of the remaining OAS, without IFNβ treatment. The expression of OAS2 or 3 was determined by WB analysis (asterisk, non‐specific band). OAS1 expression in DKO2/3 cells was measured by qRT–PCR due to insufficient sensitivity of anti‐OAS1. The gene expression data are presented as mean ± SD of triplicates. **P < 0.001 in Student's t‐test.
- OAS expression was assessed by WB with anti OAS1‐3 in HME cells expressing ectopic OAS1‐3 (OAS2hi, OAS3hi, OAS1hi) cells without IFNβ treatment or control HME cells (vec) treated with the indicated concentrations of IFNβ for 2 days (to compare the levels of induced and ectopically expressed OASs). β‐actin and Ponceau stain are shown as loading controls (# ‐ transfer artifact); ns, non‐specific band.
Figure EV1. OAS1 protein levels in DKO2/3 + O1 cells, detection limit of anti‐OAS1 antibody, and growth rate of genetically modified PC3 and HME cells.

- HME vec cells were pre‐treated with 100 IU/ml IFNβ for 24 h, and serial dilutions of IFNβ‐treated lysates and 30 and 120 μg of DKO2/3 and DKO2/3 + O1 were analyzed by the Western method with anti‐OAS1 (Santa Cruz, F‐3) as indicated. Low and high exposure images are shown. * OAS1‐specific signal in HME DKO2/3 + O1 cells. OAS1 level in PC3 DKO2/3 + O1 cells was beyond the detection limit of the antibody. β‐actin and Ponceau staining were used as loading control.
- PC3 vec, DKO2/3, and DKO2/3 + O1 cells were treated and analyzed as in (A). The OAS1 protein level in PC3 DKO2/3 + O1 cells was beyond the detection limit of the antibody. Growth curves of PC3 DKO cells with and without ectopic expression of the remaining OAS, and (lower panel) HME KO and OAShi cells were obtained by measuring cell confluence with the aid of an IncuCyte ZOOM instrument. The cell confluence data are presented as mean ± SD of triplicates; ns, non‐significant in two‐way ANOVA.
- Growth curves of HME KO and OAShi cells with and without ectopic expression of the remaining OAS were obtained by measuring cell confluence with the aid of an IncuCyte ZOOM instrument. The cell confluence data are presented as mean ± SD of triplicates; ns, non‐significant; ***P < 0.001; **P < 0.01; *P < 0.05 in two‐way ANOVA with Bonferroni's multiple comparisons test.
Source data are available online for this figure.
OAS1 protects cancer and normal cells against oxidizing or alkylating agents
A subset of IFN‐induced genes, including all three OASs, is highly expressed in various human cancers and associated with resistance to DNA damage (Weichselbaum et al, 2008). We tested whether a specific OAS isozyme mediates the resistance of cancer cells to different types of DNA damage that stimulate intensive PAR synthesis. We examined the percentage of dead cells in PC3‐OAS KO cells in response to the oxidizing agents H2O2 and p‐benzoquinone (pBQ), which generate single‐strand DNA breaks (Olson, 1988; Murata et al, 1999; Katsube et al, 2014), and to an alkylating agent methyl methanesulfonate (MMS), which methylates purines (Beranek, 1990), activating the PARP1‐mediated arm of base‐excision repair (Beranek, 1990; Reynolds et al, 2015) (Fig 2A). To avoid any influence of the other OASs, we used DKO cells, with or without additional ectopic expression of the remaining OAS (see Materials and Methods for additional information). Ectopic expression of the remaining OAS did not influence the growth rate of PC3 DKO cells (Fig EV1B, top).
Figure 2. OAS1 protects cells from death in response to oxidizing or alkylating agents.

- Analysis of the percentages of dead PC3 DKO cells or PC3 DKO cells with high expression of the remaining OAS, treated with 75 μM H2O2, 40 μM p‐Benzoquinone (pBQ), or 2 mM methyl methane sulfonate (MMS). The number of dead cells (Cytotox Green‐permeable) was monitored every 3 h using an IncuCyte ZOOM instrument. Means of triplicates ± SD. ***P < 0.001; *P < 0.05; ns, no significance in two‐way ANOVA. Representative data, which were reproduced more than three times, are shown.
- Analysis of the percentages of dead HME DKO cells and HME DKO cells with high expression of the remaining OAS, treated with 500 μM H2O2, and KO1‐3 and OAS1‐3hi cells treated with 750 μM H2O2. Data were obtained and presented as in (A). Means of triplicates ± SD. ***P < 0.001; **P < 0.01; ns, no significance in two‐way ANOVA. Representative data, which were reproduced more than three times, are shown.
- Survival of HME cells, measured by the MTT cell survival assay. Left: control (vec) and KO1‐3 cells were treated with 250, 500, or 750 μM of H2O2 and analyzed after 24 h; Right: control, OAS1‐3hi, and OAS KO1‐3 were treated with 500 μM of H2O2 and analyzed after 72 h. The data are presented as mean ± SD of triplicates, u/t ‐ untreated. ***P < 0.001; **P < 0.01; *P < 0.05 in Student's t‐test.
Source data are available online for this figure.
Increased expression of OAS1 substantially decreased the percentage of dead cells induced by H2O2, pBQ, or MMS in PC3 DKO2/3 cells (Fig 2A, left panels). We observed smaller, but still significant, protective effects of OAS1 in HME DKO2/3 cells in response to H2O2 (Fig 2B). We confirmed this result using OAS1 KO (KO1) cells and parental HME cells expressing high levels of OAS1 (OAS1hi) using IncuCyte real‐time analyses and end‐point MTT cell survival assays (Fig 2C). The growth rates of HME control cells and KO1 or OAS1hi cells were not significantly different (Fig EV1B, bottom). Unlike OAS1, which showed similar protective effects in cancer cells and normal cells, we observed inconsistent effects of OAS2 and OAS3 in different cell types. High levels of OAS2 in PC3 DKO1/3 cells did not affect cell death induced by H2O2 or MMS, and slightly decreased cell death induced by pBQ (Fig 2A, middle panel). However, OAS2 showed the protective effects to cell death induced by H2O2 in HME cells (Fig 2B and C). High levels of OAS3 significantly increased cell death induced by H2O2, pBQ, or MMS in PC3 DKO cells, but did not affect H2O2‐induced cell death in HME cells (Fig 2A right panel, Fig 2B and C).
Overall, these results suggest that OAS1 protects both normal cells and cancer cells from specific types of DNA damage induced by oxidizing or methylating agents, while OAS2 and OAS3 may have different roles in normal and cancer cells, which may be relevant to the etiology and therapeutic response of some cancers (Banerjee et al, 2019).
To test whether high OAS1 expression correlates with therapy resistance, we took advantage the large amount of RNAseq and drug IC50 data available through Cancer Cell Encyclopedia and Genomics of Drug Sensitivity in Cancer websites (see Materials and Methods). Our analysis of RNAseq data for OAS1 expression in a set of 130 cell lines established from different types of lung cancer, and the IC50 against several DNA damage‐inducing agents revealed a positive correlation of cell survival (IC50) with OAS1 expression in a cancer type‐specific manner (Appendix Fig S1, Appendix Table S2). We found positive correlations of OAS1 expression with resistance to bleomycin, doxorubicin, temozolomide drugs known to evoke a PARP‐mediated response (Rose et al, 2007; Shin et al, 2015; Lu et al, 2017). We clustered 130 pan‐lung cancer cell lines first to small and non‐small‐cell lung cancer (SCLC and NSCLC, respectively), and, further, the NSCLC cell lines to large cell, squamous cell, and adenocarcinoma subtypes. OAS1 expression significantly correlated with resistance to doxorubicin in NSCLC, especially in large and squamous cell carcinomas, but not in SCLC. We found marginally significant correlation of OAS1 expression with resistance to bleomycin and temozolomide in SCLC and large cell NSCLC, but not in squamous cell and adenocarcinoma NSCLC. Interestingly, when we clustered NSCSL cell lines by cancer subtype, significance of correlation improved even though the number of samples decreased.
OAS1 adds AMP residues in 2′, 5′ linkage to poly(ADP‐ribose)
Because OASs can add AMP residues to the 2′‐hydroxyl groups of the terminal ribose residues of NAD+ and ADPr in vitro (Cayley & Kerr, 1982), we suspected that poly(ADPr) (PAR) might also be an acceptor. We examined this possibility first by carrying out in vitro experiments. In the first example, purified His6‐tagged human recombinant OAS1 (hrOAS1) was incubated with PAR (up to 300 ADP‐ribose units long), poly(I):poly(C) (pIC) to activate the OAS, and 32P‐α‐ATP as substrate, and the products were analyzed by gel electrophoresis followed by autoradiography (Fig 3A). In the complete reactions (lanes 11–14), a major high molecular weight band appeared after 10 min of incubation and became more intense after 30 and 60 min. Note that the larger and structurally more complex PAR species were not well resolved and accumulated at the top of the gel. As expected, PAR‐2‐5A synthesis was dependent upon the addition of pIC, to stimulate OAS1 (compare lanes 7–10 to 11–14).
Figure 3. 2‐5A is attached to PAR synthesized in vitro and in vivo .

- An autoradiograph showing radiolabeled PAR2‐5A bands that were formed in reactions of OAS1 with the activator (pIC) and the acceptor PAR (lanes 11–14). Lanes 1–2 OAS1 only, lanes 3–6 OAS1 with activator pIC; lanes 7–10 OAS1 with substrate PAR; lane 15 negative control without OAS1. 32P‐α‐ATP was added to all reactions.
- Top: specificity of anti‐2′,5′A, as shown by ELISA. Synthetic 2′,5′‐p3A3, PAR2‐5A #1, PAR2‐5A #2 (2 different preparations of PAR2‐5A). PAR and 3′,5′‐pA3 were used as competitors. Bottom: Dot blot of synthetic PAR and PAR‐2‐5‐A. In vitro synthesized PAR and PAR‐2‐5‐A were applied in 1:2 dilutions (left to right) to nylon membrane and probed with anti‐2‐5A or anti‐PAR.
- Immunostaining of PAR‐2‐5A synthesized in vitro. Reaction mixtures were resolved by electrophoresis in a polyacrylamide‐8 M urea denaturing gel, transferred to a charged nylon membrane, and probed with mouse anti‐PAR 10H (left panel) or rabbit anti‐2‐5A after stripping (right panel). XC: Xylene cyanol (apparent size 150 nucleotides), BPB: Bromophenol blue (apparent size 35 nucleotides). Lane 1, purified PARP1 alone; lane 2, PAR reaction: PARP1, activated DNA, NAD+, and histone; lane 3, 2‐5A reaction: OAS1, pIC, ATP; lane 4, 2‐5A and PAR reactions: OAS1, pIC, ATP and PARP1, activated DNA, NAD, histone. After incubation at 37°C for 60 min, the proteins were removed by digestion with proteinase K.
- Western analysis of PARP1 auto‐modified with PAR in vitro in the absence or presence of OAS1. Reaction mixtures were resolved by SDS–PAGE, transferred to a charged nylon membrane, and probed with mouse anti‐PARP1. Reactions were set up as in (C), but without proteinase K digestion. Lane 1, PARP1 alone; lane 2, PAR reaction: PARP1, activated DNA and NAD; lane 3, 2‐5A reaction: OAS1, pIC, and ATP; lane 4, 2‐5A and PAR reactions: OAS1, pIC, and ATP with PARP1, activated DNA, NAD, and histone; lane 5, 2‐5A and PAR reactions without ATP. The large smeary signals are due to PAR chains attached to PARP1, and the smaller sharp bands are free PARP1. The same blot was probed with anti‐PAR, anti‐2‐5A, and anti‐OAS1.
- Western analysis of 2‐5A precipitated with anti‐PAR antibodies from lysates of H2O2‐treated HME cells. Cells were treated with 500 M H2O2 for 12 min, and lysates were incubated with control (mouse IgG3) or mouse anti‐PAR. Samples were probed with anti‐PAR, anti‐2‐5A or anti‐PARP1 antibodies. Flow‐thr: flow‐through, WCL: whole‐cell lysate, IP: immunoprecipitate. Right panels (IP) show exposures for 10 × longer than left panels (WCL, flow‐thr). Apparent MW (kDa) is indicated on the right. Experiments were repeated two times with similar results.
- Western analysis of 2‐5A precipitated with anti‐PAR antibodies from lysates of HME control, KO1 and TKO cells, and control cells pre‐incubated with olaparib, treated with H2O2 for 12 min. Samples were probed with anti‐PAR or anti‐2‐5A antibodies. Ponceau staining of the membrane is shown as loading control. Experiments were repeated four times with similar results.
Next, we took advantage of the specific rabbit polyclonal antibody raised in our laboratory against 2‐5A, to detect PAR‐2‐5A. This antibody binds to canonical 2‐5A (2′,5′‐p3A3) and PAR‐2‐5A, but not to PAR or 3′,5′‐p3A3 (Fig 3B). We set up PAR synthesis reactions in vitro using human recombinant PARP1 and its substrate NAD+ in the presence or absence of activated human recombinant OAS1 and its substrate ATP. Under these conditions, PAR is attached to PARP1. We analyzed the auto‐modification of PARP1 at two different concentrations of NAD+ (Fig 3C, left and right). Reaction products were analyzed by SDS–PAGE, followed by transfer to a charged nylon membrane that was subsequently probed with anti‐PARP1. The presence of OAS1 and ATP greatly reduced the levels of PAR attached to PARP1 (compare lanes 2 and 4). Importantly, in the absence of its substrate ATP, activated OAS1 did not alter accumulation of PARP1‐PAR molecules (lane 5). Of note, at the higher NAD+ concentration (50 μM), PAR synthesis was very efficient, so a slowly migrating smear was observed, while at the lower NAD+ concentration (25 μM), both fast‐ and slow‐migrating PARP1‐PAR species were detected. OAS1 suppressed PAR synthesis at both concentrations of NAD+. However, in spite of vigorous attempts, we were unable to detect 2‐5A with this protocol. Therefore, we decided to use an alternative approach to show that 2‐5A is attached to PAR in vitro. We digested the proteins with proteinase K after completion of the PAR synthesis reactions. Reaction products were then separated in a polyacrylamide–urea denaturing gel and transferred to a charged nylon membrane. PAR was detected with mouse anti‐PAR, and PAR‐2‐5A was detected with rabbit anti‐2‐5A on the same membrane, after stripping the anti‐PAR (Fig 3D, left). As determined by the positions of dye markers, the products were heterogeneous mixtures containing more than 100 ADPr units (at least at the sensitivity level of anti‐PAR antibodies), as expected for a range of PAR molecules of different length and complexity. The PAR signal was detected both in the presence and absence of OAS1 (Fig 3D, left, lanes 2 and 4), whereas the 2‐5A signal was detected only when OAS1 was present (Fig 3D, left, lane 8). The 2‐5A and PAR signals coincided, indicating that PAR molecules of various lengths could be modified by the addition of 2′,5′‐AMP residues. Because the PARylation reaction proceeds with high efficiency, we decreased the NAD+ concentration 10‐fold in an attempt to detect a difference in PAR size in the absence or presence of OAS1. As seen in Fig 3D, right, PAR synthesized in the presence of OAS1 migrated faster, suggesting a reduction in the length of PAR chains (lanes 3 and 6).
These in vitro experiments demonstrate that OAS1 can modify PAR directly, as expected from its ability to modify the structurally similar monomeric substrate ADPr. To examine whether 2‐5A moieties are attached to PAR molecules in intact cells, we immunoprecipitated PAR from HME cell extracts treated with H2O2 for 10 min and performed a Western analysis with anti‐PAR and anti‐2‐5A (Fig 3E). Both PAR and 2‐5A signals were present in precipitates from HME cells treated with H2O2, but not from untreated cells (lanes 7 and 8). Parylated PARP1 was also present in the precipitates. Finally, to test the OAS1 dependence of the 2‐5A signal, we used lysates of HME KO1 cells. As controls, we pre‐treated the cells with the PARP1 inhibitor olaparib prior to H2O2 treatment. As seen in Fig 3F, PAR levels were increased in H2O2‐treated KO1 cells compared with vector controls (WCL lanes 2 and 4, IP lanes 6 and 8), while the 2‐5A signal appeared only in the immunoprecipitate from control cells (IP: lane 6). Olaparib efficiently suppressed both PAR and 2‐5A signals in H2O2‐treated cells (WCL: lane 3, IP: lane 7).
Together, these data indicate that OAS1 covalently attaches AMP residues in 2′‐5′ linkage to PAR molecules that are in turn attached to proteins such as PARP1 (Ray Chaudhuri & Nussenzweig, 2017), suggesting that OAS1 inhibits PARylation by preventing PAR chain elongation.
Accumulation of 2‐5A and PAR in cells depends on OAS1
PAR synthesis is readily activated by treating cells with H2O2 (Gardner et al, 1997; Zhang et al, 2007). To detect this modification of PAR by OAS in cells, HME cells exposed to H2O2 were fixed and immuno‐stained with anti‐PAR and anti‐2‐5A. Because the PARylation of nuclear proteins is transient, we first compared the kinetics of PAR and 2‐5A accumulation in nuclei following H2O2 treatment. As shown in Fig 4A, in vector control HME cells the nuclear 2‐5A signal increased and decreased with similar kinetics as the PAR signal.
Figure 4. Accumulation of 2‐5A and PAR in cells depends on OAS1.

- HME cells were treated with H2O2 for the indicated times and stained with anti‐PAR and anti‐2‐5A. Nuclei were visualized with DAPI. The densities of the 2‐5A and PAR fluorescence signals in the nuclei are plotted. Signals in 40+ cells per sample were measured. Data are presented as distribution plot with mean value ± SD; ***P < 0.001; *P < 0.05; ns, non‐significant as determined by unpaired Kolmogorov–Smirnov t‐test. Scale bar, 10 μm.
- HME control (vector) and TKO cells were treated with H2O2 for 12 min, incubated on ice for 7 min with PBS or detergent‐containing Buffer 1, to extract unbound proteins, fixed with methanol/acetone, and stained with anti‐2‐5A and anti‐PAR. u/t ‐ untreated. Scale bar, 10 μm.
- HME vector control (vec), DKO, and TKO cells were treated with H2O2 for 12 min. In untreated (u/t) cells, no PAR staining was detected. The densities of fluorescence signals in the nuclei relative to the untreated vector control are plotted. Signals in 40 or more cells per sample were measured. Data are presented as distribution plot with mean value ± SD; ***P < 0.001; *P < 0.05; ns, non‐significant as determined by unpaired Kolmogorov–Smirnov t‐test. Scale bar, 10 μm.
- HME control (vector) and KO1 cells were treated with H2O2 for the indicated times and stained with anti‐2‐5A and anti‐PAR. Scale bar, 10 μm.
- Accumulation of 2‐5A and PAR in HME cells pre‐incubated with 10 or 100 nM olaparib for 30 min before treatment with H2O2 for 12 min, as visualized by immunostaining with anti‐2‐5A and anti‐PAR. Scale bar, 10 μm.
Source data are available online for this figure.
To demonstrate that the observed 2‐5A signal originates from macromolecule‐bound rather than free 2‐5A, we pre‐incubated cells with detergent‐containing buffers for 10 min on ice after H2O2 treatment to extract unbound molecules and fixed the cells with a 1:1 mixture of methanol and acetone. The nuclear 2‐5A signal was resistant to extraction with buffers containing detergent and either low (Buffer 1) or high (Buffer 2) salt, indicating that the 2‐5A moiety is likely to be covalently attached to a macromolecule in the chromatin, such as PAR. The decrease in 2‐5A signal may indicate that some 2‐5A is attached to soluble nuclear proteins (such as PARP1 that are displaced from the chromatin) (Fig EV2A). Furthermore, analysis of confocal micrographs indicates that the 2‐5A signal is in close proximity to the PAR signal: The Pearson's correlation coefficient for HME cells treated with H2O2 for 12 min was 0.23 ± 0.12, the colocalization coefficient M1 (green pixels (PAR) that are also red (2‐5A)) was 0.90 ± 0.10, and the colocalization coefficient M2 (red pixels (2‐5A) that are also green (PAR)) was 0.99 ± 0.03 (Fig EV2B and C).
Figure EV2. Accumulation of nuclear 2‐5A after H2O2 treatment.

- HME cells were treated with H2O2 for 12 min, incubated on ice with PBS, Buffer 1 (0.5% NP‐40, low salt) or Buffer 2 (0.5% Triton X‐100, high salt) for 7 min, and fixed with methanol:acetone::1:1. Scale bar, 10 μm.
- HME cells treated with H2O2 for 12 min were fixed and stained with DAPI and antibodies against 2‐5A and PAR. Images were taken with the aid of a confocal microscope. Scale bar, 10 μm.
- Summary of analysis of colocalization of PAR (green) and 2‐5A (red) signals: Pearson's correlation coefficient, colocalization coefficient M1 (green pixels that are also red), and colocalization coefficient M2 (red pixels that are also green).
- HME control (vec) and DKO cells supplemented with the remaining OAS (DKO2/3 +O1, etc.) were treated with H2O2 for 12 min, fixed, and stained with antibodies against 2‐5A and PAR. DAPI counterstaining was used to visualize nuclei. Scale bar, 10 μm.
- PC3 control (vec) and DKO cells were treated with H2O2 for 12 min, followed by extraction of unbound proteins by incubation in the detergent‐based Buffer 1 for 7 min, and processed as in (A). Scale bar, 10 μm.
Source data are available online for this figure.
To test the OAS dependence of the 2‐5A signal accumulating in the nucleus in response to H2O2, we treated TKO cells with H2O2 for 12 min and processed them as in Fig 4A. As shown in Fig 4B, in TKO HME cells treated with H2O2, the nuclear 2‐5A signal was absent, while the PAR signal was still present. Note that the cytoplasmic 2‐5A signal observed in untreated control cells was barely detectable in untreated TKO cells, compared with control cells, indicating that OASs could be involved in the generation of this signal.
To determine which isoform of OAS is involved in PAR‐2‐5A synthesis, we used a panel of cells in which the expression of OASs was ablated or increased. 2‐5A accumulated in the nuclei of HME DKO2/3 cells but not DKO1/2 or DKO1/3 cells (Fig 4C). Thus, the presence of OAS1 was necessary and sufficient for 2‐5A accumulation in the nuclei of H2O2‐treated cells. Similar results were obtained with HME DKO1/2+O3, DKO1/3+O2, and DKO2/3+O1 cells (Fig EV2D) and with PC3 DKO cells (Fig EV2E): 2‐5A was detected in the nuclei of control cells and cells expressing OAS1 only, while in the absence of OAS1, the signal was seen predominantly in the cytoplasm.
In addition, we monitored 2‐5A accumulation for 30 min after H2O2 treatment. In HME KO1 cells, the kinetics of PAR synthesis and degradation were similar to those in control cells and, consistent with the results in TKO and DKO cells, the 2‐5A signal did not accumulate in KO1 nuclei (Fig 4D), arguing that OAS1 is necessary and sufficient for nuclear 2‐5A accumulation in response to H2O2. To determine whether 2‐5A accumulation requires PARP1 activity, we pre‐treated HME cells with the PARP1 inhibitor olaparib before exposure to H2O2, finding that both the 2‐5A and PAR signals were blocked (Fig 4E), which further argues that 2‐5A is attached to PAR in H2O2‐treated nuclei.
Subcellular localization of OASs and the availability of OAS1 in the nucleus
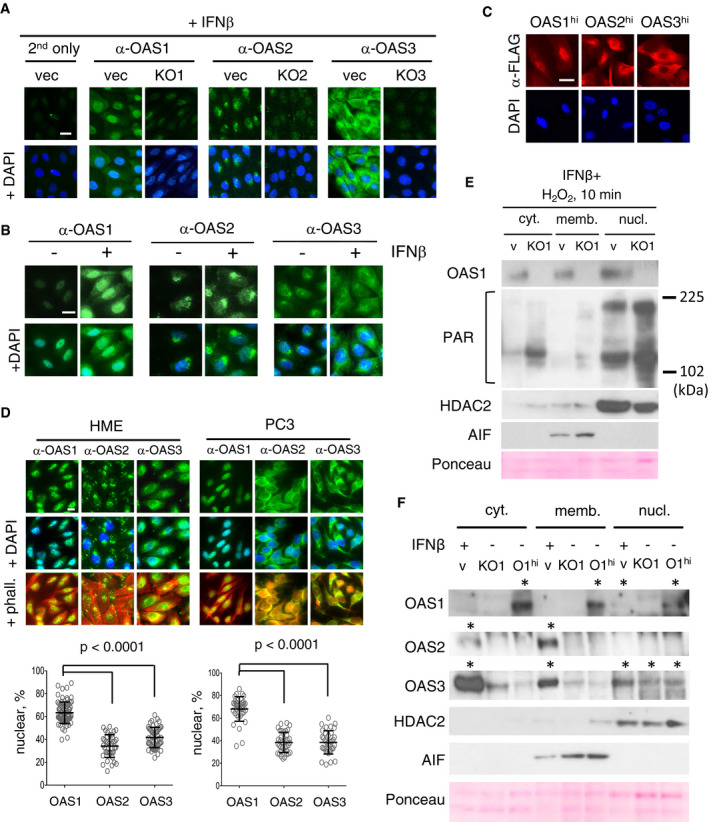
Because PAR synthesis in response to DNA damage is catalyzed predominantly by nuclear PARP1, and different OAS isoforms have been reported to localize to various cell compartments in different cell types, we wanted to determine the intracellular locations of the different OAS isoforms in our cells. First, we immuno‐stained HME vector, KO1, KO2, and KO3 cells, pre‐treated with IFNβ for 2 days to increase the levels of OAS, with anti‐OAS1, anti‐OAS2, or anti‐OAS3 (Fig 5A). In control cells, OAS1 was localized predominantly in the nucleus, OAS2 in a perinuclear region, and OAS3 in the cytoplasm. No signal was detected in the corresponding OAS KO cells. Next, we compared the abundance and localization of each OAS in IFNβ‐treated and IFNβ‐untreated cells (Fig 5B). The abundance of each isoform was increased in response to IFNβ as expected, further confirming the specificity of the signal, while the OAS locations remained similar to those in untreated cells. We also examined the locations of ectopically expressed Flag‐tagged OASs in HME OAS1hi, OAS2hi, and OAS3hi cells, using anti‐Flag (Fig 5C). OAS1 and OAS2 were localized predominantly in the nucleus and cytoplasm, respectively. The signal in cells over expressing OAS2 was very high, in accordance with Western data (Fig 1C), and was seen mostly in the cytoplasm, with higher density in the perinuclear region. We also performed immunostaining of OAS2 in HME cells expressing Golgi‐tagged GFP and found partial colocalization of the OAS2 and Golgi‐tagged GFP signals (Fig EV3A). Next, we quantified the ratio of the nuclear and cytoplasmic fluorescent signals of OAS isoforms in untreated HME and PC3 cells (Fig 5D). We used DAPI to visualize the nuclei and phalloidin for the cytoplasm. In untreated HME cells, about 60% of the endogenous OAS1 was detected in the nucleus, compared with about 30 and 40% of OAS2 and OAS3, respectively. In untreated PC3 cells, about 70% of the endogenous OAS1 was detected in the nucleus, compared with about 40% of OAS2 and OAS3. We also determined the locations of ectopically expressed OASs in PC3 DKO cells, supplemented with the remaining OAS isoform, with both anti‐OAS and anti‐Flag. The ectopic OASs were localized similarly to the endogenous proteins (Fig EV3B). Thus, the locations of the three OAS isoforms are similar in HME and PC3 cells, but less discrete in the PC3 cells.
Figure 5. Intracellular locations of endogenous, IFNβ‐stimulated, and exogenous OAS proteins.
- HME control (vec) and OAS single‐knockout cells (KO1‐3), pre‐treated with IFNβ for 2 days to induce OAS expression, fixed, and stained with anti‐OAS1, 2, or 3. Staining with secondary antibodies is shown as a negative control. Scale bar, 10 μm.
- HME control cells were treated with IFNβ for 2 days to induce OAS expression, fixed, and stained with anti‐OAS1, 2, or 3. Scale bar, 10 μm.
- HME cells expressing Flag‐tagged OAS1, 2, or 3 were fixed and stained with anti‐Flag. Scale bar, 10 μm
- Untreated HME (left) or PC3 (right) cells were stained with anti‐OAS1‐3, and the nuclei were visualized by staining with DAPI. The intensities of OAS1‐3 fluorescence signals in the nuclei are plotted. Nuclear and cytoplasmic masks were made based on DAPI and phalloidin staining, respectively. Experiments were repeated at least two times; at least 40 cells per condition were counted. Data are presented as distribution plot with mean value ± SD; statistical significance was determined by unpaired Kolmogorov–Smirnov t‐test. Scale bar, 10μm.
- HME control (vec) and KO1 cells were pre‐treated with IFNβ for 2 days, followed by a 10‐min treatment with H2O2. Cytoplasmic, membrane‐bound, and soluble nuclear fractions of cell lysates were analyzed by the Western method; staining with anti‐AIF and anti‐HDAC2 staining was used to characterize membrane and nuclear fractions, respectively. Anti‐PAR detects all PAR‐modified proteins, which appear as smears.
- HME control (v), KO1, and OAS1hi (O1hi) cells were pre‐treated with IFNβ for 48 h. Cytoplasmic, membrane‐bound, and soluble nuclear fractions of cell lysates were analyzed by the Western method. Anti‐AIF and anti‐HDAC2 were used to characterize membrane and nuclear fractions, respectively; * indicates lanes where specific signals are detected.
Source data are available online for this figure.
Figure EV3. Characterization of OAS subcellular locations in HME and PC3 cells.

- HME cells were transiently transfected with a Golgi‐targeting GFP probe (Clontech), fixed, and stained with anti‐OAS2 antibodies and DAPI. Scale bar, 10 μm.
- HME and PC3 cells were immuno‐stained with anti‐PARP1 and anti‐OAS1. Scale bar, 10 μm.
- PC3 DKO cells with ectopic expression of the residual Flag‐tagged OAS were fixed and stained with anti‐OAS1, 2, or 3 (top) or anti‐Flag (bottom). Staining with fluorescent secondary antibodies only was used as a negative control. Exposure times for anti‐Flag are shown to demonstrate the relative abundance of Flag‐tagged proteins. Nuclei were counterstained with DAPI. Scale bar, 10 μm.
- HME and PC3 cells were immuno‐stained with anti‐dsRNA. To show the specificity of staining, fixed cells were incubated with dsRNA‐specific RNase III for 1 or 24 h before staining. Scale bar, 10 μm.
To further examine the subcellular distribution of the OAS proteins, we fractionated HME control (vec) and KO1 cells stimulated with IFNβ for 2 days, to increase OAS expression to levels detectable by Western analysis, and treated with H2O2 for 10 min (Fig 5E). OAS1 was detected mainly in the nucleus, but smaller amounts were also found in the cytoplasmic and membrane‐bound fractions. Importantly, abundant PAR was detected as expected predominantly in the nuclear fractions of both control (vec) and KO1 cells, with higher levels in the KO1 nuclear fraction. Next, we fractionated cell lysates from HME vec, KO1, and OAS1hi cells pre‐incubated with IFNβ for 24 h (Fig 5F). The endogenous IFNβ‐induced OAS1 was detected only in the nuclear fraction, possibly due to the relatively low level of induction achieved in this experiment, while ectopic OAS1 was found in all three fractions. IFNβ‐induced OAS2 was detected predominantly in the membrane fraction, with some in the cytoplasmic fraction. Interestingly, in untreated cells, comparable amounts of OAS3 were detected all three fractions while, after pre‐treatment with IFNβ, the majority of OAS3 was in the cytoplasmic fraction.
Thus, OAS1 is available in the nucleus and therefore potentially able to modify the PAR that is formed there by PARP1 in response to DNA damage. Indeed, nuclear OAS1 colocalizes with PARP1 in both HME and PC3 cells (Fig EV3C). Importantly, we detected dsRNA in both the nuclei and cytoplasm of HME and PC3 cells (Fig EV3D). Endogenous dsRNA is likely to serve as an OAS activator (see Discussion).
OAS1 suppresses PARylation induced by H2O2 in cells
To determine whether OASs directly affect H2O2‐induced PAR accumulation in intact cells, we treated HME cells with altered OAS expression with H2O2 for 15 or 40 min, and analyzed them by the Western method. The knockout of OAS1 resulted in a dramatic (about 10‐fold) increase in PAR accumulation in response to H2O2, in contrast to knockouts of OAS2 or OAS3 (Fig 6A). Similarly, increased expression of OAS1 or, to a lesser extent, OAS2, suppressed PARylation induced by H2O2 (about 10‐fold and 5‐fold, respectively), while increased expression of OAS3 had no significant effect (Fig 6B). Of note, the levels of OAS1 and OAS3 following ectopic expression were comparable to the IFNβ‐induced levels, while the level of OAS2 was significantly higher (by at least an order of magnitude), which may account for some of the effect on PAR accumulation, since over expressed OAS2 can accumulate in the nucleus (Fig 5C). The kinetics of PAR degradation were similar in all cell lines, as PAR was no longer detected 40 min after treatment with H2O2 in all cell lines, including OAS1 KO, arguing that the accumulation of PAR in OAS1 KO does not result from its stabilization or decreased degradation (Fig 6A).
Figure 6. Accumulation of PAR in H2O2‐treated cells depends on OAS1 abundance.

- Representative images and analysis of Western blots for PAR, performed with lysates of HME control (vec) OAS single‐KO cells (KO1‐3), treated with H2O2 for 15 or 40 min. β‐actin is shown as a loading control. Signal intensity was measured using ImageJ software. Average lane densities, normalized to vector from three independent experiments, are plotted below as mean ± SD, *P < 0.05 as assessed by Student's t‐test.
- Same as (A), with lysates of HME control (vec) cells and cells expressing ectopic OAS1, OAS2, or OAS3 (OAS1‐3hi). Experiments were repeated at least three times. Average lane densities normalized to vector are plotted below as mean ± SD, *P < 0.05 as assessed by Student's t‐test.
- HME cells, pre‐incubated with IFNβ for 2 days to increase OAS abundance, were treated with H2O2 for 0–60 min at 37°C. Western blots of PAR accumulation (top), shift in the position of PARylated PARP1 (middle), OAS2 induction by IFNβ, and β‐actin as a loading control are shown. Experiments were repeated twice.
- HME control (vec) and KO1 cells were pre‐treated with 0‐500 IU/ml IFNβ for 2 days, and then treated with 500 μM H2O2 for 10 or 30 min. Western blots of PAR accumulation (top, high, and medium exposure; middle, low exposure), OAS1‐3 induction by IFNβ, and β‐actin as a loading control are shown. The experiment was repeated four times; ns, non‐specific band.
Source data are available online for this figure.
We observed a similar effect of OAS1 on H2O2‐induced PAR accumulation in PC3 cells (Fig EV4A). PC3 DKO cells were treated with H2O2 for 10, 15, or 20 min and analyzed by the Western method. DKO2/3 cells demonstrated a PAR accumulation pattern similar to that of control cells, while the accumulation of PAR was several times higher in both DKO1/3 and DKO1/2 at 10 and 15 min. At 20 min, the levels of PAR were substantially lower in all cell lines. Similarly, in HME DKO cells, PAR accumulated to higher levels in cells lacking OAS1. We noted also that PAR‐modified PARP1 migrated more slowly in DKO cells lacking OAS1, which suggests longer PAR chains in these cells (Fig EV4B).
Figure EV4. Accumulation of PAR in response to H2O2 in PC3 and HME cells.

- PC3 DKO cells were treated with H2O2 for 10, 15, or 20 min, and analyzed by the Western method for PAR accumulation. Ponceau staining of the membrane is shown as a loading control.
- HME DKO cells were treated with H2O2 for 0, 12, or 17 min, and analyzed by the Western method for PAR accumulation and PARP1 migration. High exposure for PARP1 shows slowly migrating PARP1‐PAR molecules. Ponceau staining of the membrane is shown as a loading control.
- Western analysis of lysates from HME cells, pre‐exposed to IFNβ for 0–3 days, and treated with H2O2 for 15 min. Top: Induction of OAS1‐3 after IFNβ treatment. Bottom: Accumulation of PAR in cells pre‐treated with IFNβ for different time. GAPDH staining is shown as a loading control.
Because the OAS genes are transcriptionally induced by type I IFNs, we analyzed the levels of PARylation in HME cells following treatment with IFNβ. Our earlier work showed that IFNβ induces the expression of IFN‐stimulated genes (ISGs) in two discrete waves (Cheon et al, 2013). The expression of all ISGs is induced within a few hours and then decreases by 24 h due to the induced expression of powerful negative regulators, such as SOCS1. However, the expression of about a quarter of the ISGs, including the OAS genes, continues to be induced for several days. In HME cells, the expression of OAS1, OAS2, and OAS3 was strongly induced by IFNβ, reaching a plateau after 2 days, and their expression was maintained at these high levels for at least 1 day more (Fig EV4C, top). When treated with H2O2, cells pre‐treated with IFNβ for more than 2 days showed a pronounced decrease in the accumulation of PAR (Fig EV4C, bottom). We analyzed the kinetics of PAR accumulation in response to H2O2 in HME cells that had been incubated with and without IFNβ for 2 days (Fig 6C). In control cells, maximum PARylation was observed 15 min after H2O2 treatment, and no PAR was detected after 35 min. In contrast, the amount of PAR was dramatically lower at all time points in the IFNβ‐treated cells. PARP1 was auto‐PARylated with similar kinetics in naïve cells (shown by its reduced mobility in SDS–PAGE gels), whereas PARylated PARP1 was undetectable in the IFNβ‐treated cells. Thus, exposure to IFNβ results in a dramatic reduction in PARylation in response to H2O2.
Next, HME control and KO1 cells were incubated with or without IFNβ and treated with H2O2 for 12 min, and PAR levels were then analyzed. As seen in Fig 6D, OAS2 and OAS3 levels were increased after pre‐treatment with IFNβ in both control and KO1 cells. However, PARylation was substantially suppressed by IFNβ treatment in control, but not KO1 cells (Fig 6D).
Thus, knockout, ectopic expression or IFN‐mediated induction of OAS1 alone was sufficient and necessary to dramatically alter PARylation in response to H2O2. Importantly, since knockout of the endogenous OAS1 resulted in dramatic increase of PARylation, even low basal levels of OAS1 (below the detection levels in Western) are sufficient for the OAS1 effect on PARylation.
Suppression of PARylation by catalytically active OAS1 inhibits DNA damage‐induced cell death
Excessive PAR synthesis results in parthanatos, or PAR‐mediated cell death. Pre‐treatment with the PARP1 inhibitor olaparib very efficiently blocked H2O2‐induced cell death in HME cells (Fig 7A), showing that H2O2‐induced cell death occurs through PAR‐dependent mechanisms. Olaparib also completely blocked H2O2‐induced PAR accumulation in HME OAS‐knockout cells (Fig 7B). To test whether OAS1 protects cells from H2O2‐induced cell death in a PARP‐dependent manner, we pre‐treated HME control, KO1, or OAShi cells with olaparib prior to treatment with H2O2 (Figs 7C and EV5A). As expected, KO1 cells were more sensitive and OAShi cells were more resistant to H2O2, but pre‐treatment with olaparib overrode the effects on cell survival of OAS1 knockout or ectopic expression, as no statistical difference was detected between control, KO1, or OAS1hi cells in the olaparib‐treated groups. At the lower concentration of H2O2 (500 μM), no synergy was detected between olaparib and ectopic OAS1 expression: The ectopic expression of OAS1 was as efficient in protecting cells from as was pre‐treatment with olaparib, suggesting that OAS1 is likely to be in the same pathway as PARP1 with respect to protection from H2O2. At the higher concentration of H2O2 (1,000 μM), ectopic OAS1 expression, which reduces but does not completely block PARylation, was insufficient to prevent cell death to the levels achieved by the complete block of PARylation by olaparib. Next, we investigated whether the previously known catalytic sites (D75/D77) of OAS1 (Sarkar et al, 1999) are critical for modulation of PARylation and cell death in response to DNA damage. We put wt OAS1 or mutated OAS1 (D75A/D77A) back into HME‐KO1 cells and examined PAR synthesis and cell death in response to H2O2 (Fig 7D–F). When wt OAS1 was expressed (KO1‐OAS1 wt), H2O2‐induced PAR synthesis and cell death decreased compared to control cells (KO1‐vec). However, expression of mutant OAS1 (KO1‐OAS1 mut) did not decrease PARylation and cell death in response to H2O2. We also observed different kinetics of PARylation in OAS1‐knockout and put‐back cells: When wt and especially mutant OAS1 were re‐expressed, PARylation persisted for a longer time. These results indicate that the catalytic site of OAS1, which is essential for the synthesis of canonical 2‐5A, is also necessary for the OAS1‐mediated suppression of PARylation and cell death in response to DNA damage.
Figure 7. Suppression of PARylation by catalytically active OAS1 inhibits DNA damage‐induced cell death.

- HME cells were treated with 750 μM of H2O2, with and without pre‐treatment with olaparib. The accumulation of dead cells was measured with an IncuCyte ZOOM instrument. Means of triplicates ± SD. ***P < 0.001 in two‐way ANOVA. The data represent the results of three experiments.
- HME control (vec) and KO1‐3 cells were incubated with olaparib for 30 min followed by treatment with 500 μM H2O2 for 15 min. PAR accumulation was assessed by the Western method, with anti‐PAR. β‐actin is shown as a loading control.
- HME vec, KO1, and OAS1hi cells were incubated with olaparib for 30 min, then treated with 500 or 1,000 μM of H2O2 and allowed to grow for 72 h. Bars represent means of triplicates ± SD from three experiments. *P < 0.05; **P < 0.01 (relative to H2O2‐treated vec cells) in Student's t‐test.
- KO1 cells transfected with vector (KO1‐vec), wild‐type OAS1 (KO1‐OAS1 wt), or mutant OAS1 (D75A/D77A, KO1‐OAS1 mut) were treated with 500 μM of H2O2 for the indicated times and analyzed by the Western method. Loading controls: β‐actin and overall protein levels were visualized by stain‐free technology. The experiment was repeated three times; a representative image is shown.
- Quantification of the relative abundance of PAR in (D). Images obtained in three independent experiments were analyzed; the data are plotted as mean ± SD *P < 0.05 by Student's t‐test.
- KO1 cells transfected with vector, wild‐type OAS1 (OAS1 wt), or mutant OAS1 (D75A/D77A, OAS1 mut) were treated with 500 μM of H2O2. The accumulation of dead cells was measured with an IncuCyte ZOOM instrument. Means of triplicates ± SD. ****P < 0.0001 in two‐way ANOVA. The data represent the results of three experiments.
Source data are available online for this figure.
Figure EV5. Characterization of H2O2/PAR/AIF‐mediated cell death.

- HME vec, KO1, and OAS1hi cells were pre‐incubated with olaparib and treated with 500 μM H2O2 as in Fig 7C. Cell images were taken after 24 h of incubation. Scale bar, 10 μm.
- Co‐staining of AIF and Mitotracker in untreated HME cells; nuclei were counterstained with DAPI. Scale bar, 10 μm.
- Western analyses for AIF and PARP1 in PC3 and HME control, KO, DKO, and TKO cells. sgOAS1—single‐guide RNAs for OAS1‐3. The same blots as in Fig 1A and B were used for probing with anti‐AIF and anti‐PAR. β‐actin is shown as a loading control.
- Western analysis for AIF in the nuclear fractions (upper) compared to whole cell lysates (WCL) from HME control (vec) and KO1 cells treated with the indicated concentrations of H2O2 and allowed to grow for 24 h. Ponceau‐S staining was used as a loading control. The experiment was repeated two times.
OAS1 suppresses the nuclear translocation of Apoptosis‐Inducing Factor (AIF)
The translocation of apoptosis‐inducing factor (AIF) to the nucleus is a hallmark of parthanatos (Fatokun et al, 2014). To test whether the observed dependence of H2O2‐induced PAR accumulation and cell death correlates with AIF translocation, we stained HME control and OAS KO, DKO, and TKO cells with anti‐AIF 24 h after treatment with H2O2 (Fig 8A). AIF translocated to the nuclei of the majority of KO1, DKO1/2, and TKO cells (~60, 60, and 55%, respectively) while in control, KO2, KO3, and DKO2/3 cells, AIF remained predominantly in the mitochondria (percentage of AIF‐positive nuclear was ~10, 10, 15%, 105, respectively) (Figs 8A and B, and EV5B). DKO1/3 cells had an intermediate phenotype, with less AIF translocation than the KO1, DKO1/2, and TKO cells (~35%). We performed a similar set of experiments in PC3‐DKO2/3 and PC3‐DKO2/3+1 cells treated with increasing concentrations of H2O2 for 24 h (Fig 8C). At the highest concentration of H2O2 used (400 μM), the ectopic expression of OAS1 resulted in decreased AIF translocation to the nucleus, from ~45 to ~15%. OAS knockouts did not change PARP1 or AIF levels in HME or PC3 cells (Fig EV5C). We also treated HME or KO1 cells with increasing concentrations of H2O2 and isolated nuclear fractions 24 h later (Fig EV5D). Low levels of AIF appeared in the nuclear fractions of control cells treated with 1 mM H2O2, whereas treatment with 1.5 mM H2O2 led to a substantial increase in this signal. In contrast, in KO1 cells, a substantially more intense AIF nuclear signal was detected even with 750 μM H2O2, and the signal increased greatly with increasing concentrations.
Figure 8. OAS1 suppresses the nuclear translocation of apoptosis‐inducing factor (AIF).

-
A, BRepresentative images and analysis of AIF accumulation in the nuclei of HME control (vec) and OAS single‐knockout cells (KO), and HME control (vec) and OAS double‐ and triple‐knockout cells (DKOs and TKO), 24 h after treatment with 1000 μM H2O2.
-
CRepresentative images and analysis of AIF accumulation in the nuclei of PC3 DKO2/3 and PC3 DKO2/3+1 cells, 24 h after treatment with 100, 200 or 400 μM H2O2.
Taken together, the data indicate that OAS1 is necessary and sufficient to suppress AIF translocation to the nucleus in cells exposed to H2O2, suggesting a mechanistic link to the observed phenomenon of OAS1‐mediated protection of cells from PAR‐induced death.
Discussion
We provide evidence for a novel function of human OAS1, revealing that this enzyme adds AMP residues in 2′,5′ linkage to PAR during the DNA damage response, and suppresses PAR synthesis (Fig 9A and B). Suppression of the accumulation of excess PAR inhibits PAR‐mediated cell death, at least in large part by preventing the liberation of AIF from mitochondria (Fig 9C).
Figure 9. Model: OAS1 suppresses cell death by limiting poly(ADP‐ribose) synthesis.

- Structures. In 2‐5A, ATP and several AMPs (two are shown) are connected by (2′‐5′) phosphodiester bonds (highlighted in red) by OAS1. In PAR, ADP‐ribose (ADPr) units are connected by (2′‐1″) glycoside bonds between ribose moieties (highlighted in blue) by PARP1. In PAR‐2‐5A, PAR can be used by OAS1 as an acceptor for addition of AMP residues to the 2′‐hydroxyl of the terminal ADRr, which prevents PAR chain elongation by PARP.
- PARP1 and OAS1 compete for the 2′‐hydroxyl of the terminal ADPr of PAR (shown in purple), which may result in “capping” of PAR chain termini with adenylates. The 2′‐hydroxyl of the terminal adenylate (shown in red) can be further modified by OAS1 (OAS1 typically adds 2‐3 AMPs), but presumably not by PARP1. 2′‐positions modified by PARP1 are shown in blue. Besides the terminal ribose, PARP1 also attaches ADPr to the 2′‐hydroxyl of the second ribose moiety of ADPr (shown in blue in parentheses), producing a branched PAR structure. We propose that 2‐5A capping of PAR by OAS1 results in shorter and potentially more branched PAR chains (bottom).
- High PARylation in response to extensive DNA damage leads to accumulation of cytoplasmic PAR, which promotes initiation of parthanatos (cell death through AIF translocation and/or other mechanisms). OAS1 suppresses PARylation and thus prevents the accumulation of PAR to toxic levels and NAD+ depletion/energy collapse, promoting DNA repair and cell survival.
The specificity of OASs has been well known for more than 35 years. These enzymes transfer AMP residues to the 2′‐hydroxyl groups of a variety of acceptors, including ATP, NAD+, and ADPr (Cayley & Kerr, 1982). With NAD+ as a substrate, only the ribose moiety that is attached to adenine is modified, not the nicotinamide‐linked ribose. Indeed, NADP+, in which the 2′‐hydroxyl on the adenine‐linked ribose is phosphorylated, is not an OAS substrate, and neither is nicotinamide mononucleotide (NMN), which lacks adenine (Minks et al, 1980; Ferbus et al, 1981; Cayley & Kerr, 1982). Based on the established specificity of OASs for small substrates, we expected that OAS1 could modify PAR similarly, adding AMP residues only to the 2′‐hydroxyl groups at the ends of chains (Fig 9A). Indeed, the molecular details of PAR modification by OAS1 that we reported in 2016 (Kondratova et al, 2016) were recently confirmed in an in vitro study (Ando et al, 2019). Since NAD+ is the substrate for PARylation, we cannot exclude that the reduction of PAR accumulation when OAS1 is present or over expressed is due to OAS1‐mediated NAD+ modification, which may either deplete the NAD+ pool available to serve as the PARP1 substrate, or result in PAR chain termination by incorporation of NAD‐2‐5A. However, we show direct incorporation of AMP from ATP to PAR by OAS1 in the absence of NAD+ and PARP1 (Fig 3A). Our model also does not exclude non‐catalytic inhibition of PAR synthesis by OAS1. For example, OAS1 might compete with PARP1 for the donor 2′‐hydroxyl of the terminal ADPr subunit of PAR, and block PAR chain elongation without 2‐5A “capping”. However, we present data showing that, in the absence of its ATP substrate, catalytically active OAS1 does not suppress PAR formation in vitro (Fig 3D, lane 4). Moreover, expressing catalytically inactive OAS1 in OAS1‐knockout cells did not decrease PARylation levels and did not suppress cell death (Fig 7D–F), arguing that the catalytic activity of OAS1 is critical for these phenomena. Interestingly, we observed slower kinetics of PAR degradation in both wt and mutant OAS1‐expressing cells, compared with the OAS1 knockout, suggesting that binding of PAR termini to OAS1 (with or without capping activity) might interfere with the action of terminal PAR hydrolases. Overall, our model suggests that 2‐5A “capping” of PAR by OAS1 results in shorter PAR chains and therefore in lower accumulation of PAR (Fig 9B). However, further evidence to fully support this model awaits detailed structural analysis of the products of the reaction.
Our data and previous reports (Wathelet et al, 1986; Chebath et al, 1987; Marie et al, 1990; Besse et al, 1998; Kjaer et al, 2014) show that different OAS isoforms are present in different subcellular compartments, which may also be cell type‐specific. We show that, in normal human mammary epithelial (HME) cells, OAS1 is predominantly nuclear, OAS2 is associated with perinuclear membranes, and OAS3 is predominantly cytoplasmic. In the prostate cancer cell line PC3, OAS1 is predominantly nuclear, while both OAS2 and OAS3 are predominantly cytoplasmic. Recently, Martinsen group showed that subcellular localization of different subtypes of OAS1 was also genotype‐specific: The p46 OAS1 isoform was found in mitochondria (Kjaer et al, 2014; Skrivergaard et al, 2019), while the p42 OAS1 isoform was found in the nucleus and cytoplasm (Skrivergaard et al, 2019); importantly, expression of the p42 and p46 OAS1 isoforms resulted in opposite effects on cellular respiration (Skrivergaard et al, 2019). Our SNP analysis showed that the cell lines used here, PC3 and HME, express the p42 subtype of OAS1 (Appendix Table S1). Knowledge of the distinct localization patterns of the OASs is essential for understanding their specific functions. It is also relevant to note the different locations of the two 2‐5A degrading enzymes: PDE12 is mitochondrial (Poulsen et al, 2012), whereas AKAP7 is nuclear (Gusho et al, 2014), suggesting that they can regulate PAR2‐5A stability differentially in these distinct organelles.
Different OASs may also have opposing roles in response to different types of stress. For this reason, to identify the effects of one specific isotype of OAS, we used OAS‐DKO cells, which express only one isotype of OAS, with or without ectopic expression of the remaining OAS. We used DKO cells instead of TKO cells, because CRISPR‐Cas9 gRNA, targeting coding region of each OAS, may target the ectopic OAS cDNA in the genome. As an example, OAS3 is primarily responsible for generating canonical 2‐5A and thus for activating RNase L in response to viruses that replicate in the cytoplasm (Li et al, 2016), so that OAS3 promotes cell death during virus infections. Interestingly, we observed high accumulation of OAS3 in the cytoplasmic fraction in response to IFNβ stimulation (Fig 5B and F). Our data show that different OASs have opposing roles in response to DNA damage, which are also cell type‐specific (Fig 2). These isoform‐specific responses appeared to correlate with their predominant subcellular localizations. Indeed, OAS1 p42, which is predominantly nuclear, promoted cell survival in both PC3 and HME cells in response to various types of DNA damage. In contrast, the predominantly cytoplasmic OAS3 promoted cell death, although the effects were cell type‐specific. Namely, high levels of OAS3 promoted H2O2‐induced cell death in PC3 but not in HME cells. However, OAS3 KO significantly decreased cell death in HME cells. Further investigation is necessary to determine whether OAS3 kills cells in response to DNA damage by activating RNase L. High levels of OAS2 in HME cells promoted cell survival in response to H2O2, but showed virtually no effect in PC3 cells. We note that OAS2 was localized to the perinuclear membranes in HME cells and was distributed throughout the cytoplasm in PC3 cells. OAS2 could act through mechanisms different from OAS1, because the levels of both of PAR synthesis and AIF nuclear translocation were influenced significantly less by OAS2 compared with OAS1 (Figs 6A and B, and 8A).
OASs are latent enzymes that require activation by dsRNA, which stimulates enzyme activity by more than 10,000‐fold; interestingly, OAS1 is activated by imperfectly matched dsRNAs that include GU wobble base pairs, which occur often in mRNAs and ADAR1‐edited lncRNAs (Donovan et al, 2013). Other sources of dsRNA transcripts in the nuclei of healthy undamaged cells include pre‐miRNAs (Ha & Kim, 2014) and sense–antisense duplexes transcribed from SINE (Alu) elements (Hasler et al, 2007). Indeed, we detected abundant dsRNA in both nuclei and cytoplasm of untreated HME and PC3 cells (Fig EV3D). Importantly, we showed previously that total mRNA isolated from prostate cancer cells, including PC3, and to lesser extent from normal prostate cells, can activate OASs (Molinaro et al, 2006). At the same time, as shown recently (Donovan et al, 2013, 2015), dsRNAs that optimally activate OAS1 or OAS3 differ in length and structure, which may result in preferential activation of a particular OAS isoform in even the same subcellular compartments in response to specific stimuli. For example, cytoplasmic viral dsRNA may activate cytoplasmic OAS3 but not cytoplasmic OAS1, while nuclear dsRNA capable of OAS1 activation may not activate nuclear OAS3. Therefore, in addition to the localizations of OAS enzymes and their activators, the specific molecular characteristics of particular activators may determine activity of different OAS isoforms in response to different types of stress.
In cancer cells deficient in proteins required for the repair of DNA damage by homologous recombination (HR), such as BRCA1, pharmacological inhibition of PARP1 impairs DNA repair leading to cancer cell death (Lee et al, 2014). However, in cells proficient for HR, activation of PARP1 in response to specific types of DNA damage (such as those caused by oxidative stress in ischemia–reperfusion injury) results in the accumulation of toxic levels of PAR and cell death that is mediated by excessive PAR synthesis. Accordingly, treatment with PARP1 inhibitors was considered as a possible therapy in diseases other than cancer to promote survival of injured normal cells (Berger et al, 2018). The ability of OAS1 to protect cells against DNA damage, as shown in our study, is consistent with inhibition of this second, pro‐death, function of PARP1 (Fig 9C).
Several distinct modes of PARP1/PAR‐mediated cell death are currently recognized, including parthanatos, necroptosis, autophagy, and death through energy collapse (reviewed in Aredia & Scovassi, 2014). Parthanatos is initiated by the ability of PAR to release AIF from mitochondria. AIF then binds to the cytoplasmic nuclease macrophage migration inhibitory factor (MIF), and the AIF/MIF complex then translocates to nuclei, where it catalyzes the destruction of chromatin (Wang et al, 2016). PARP1 can modulate necroptosis by targeting necroptotic effectors such as RIP (receptor‐interacting protein) kinases, either by direct interaction or indirectly through PAR (Xu et al, 2010; Jouan‐Lanhouet et al, 2012; Sosna et al, 2014). PAR also serves as a general metabolic sensor and can modulate autophagy by binding to AMPK (AMP‐activated protein kinase), Akt, or mTOR (mammalian target of rapamycin) (Kim et al, 2005; Munoz‐Gamez et al, 2009; Ethier et al, 2012; Rodriguez‐Vargas et al, 2012). Death through energy collapse is mediated by the inactivation of hexokinase 1 upon binding to PAR (Andrabi et al, 2006; Fouquerel et al, 2014) and also may result from NAD+ depletion due to excessive PAR synthesis (reviewed in Dawson and Dawson (2017)). We provide data showing the involvement of OAS1 in H2O2‐induced AIF translocation. Treatment with a PARP1 inhibitor did not synergize with high ectopic OAS1 expression in protecting against cell death, indicating that these two agents are likely to act in the same pathway and that OAS1‐mediated PAR modification is likely to be responsible for modulating AIF‐mediated cell death. Our results do not exclude a potential role for OAS1 in modulating other types of PAR‐dependent cell death.
Our data showing that OAS1 helps cancer cells to survive exogenous DNA damage provide proof‐of‐principle that a highly specific OAS1 inhibitor, or an agent that inhibits OAS1 expression, might facilitate the preferential killing of tumor cells by DNA‐damaging agents. A prospective analysis of lung cancer cell lines (n = 130) and their IC50s against the DNA‐damaging agents bleomycin, temozolomide, and doxorubicin demonstrate that the overall expression of OAS1 correlates with the ability of the cells to resist these agents (Appendix Fig S1, Appendix Table S1). DNA damage response to different types of drugs is a complex multistep signaling process that depends on numerous genetic and epigenetic factors. The drug‐ and cancer‐subtype specificity of these correlations underscores the role of particular mechanisms of drug action (i.e., the specific way each drug induces PARP1 as well as its action on other targets in the cancer cell), as well as of specific mutation/genetic landscapes of cancer subtypes, in the cancer cell response to therapy. Moreover, more detailed analysis, which takes in account particular OAS1 isoform expressed (p42 or p46), may be necessary, because of the opposite effect of these isoforms on cellular respiration, which may contribute to the Warburg effect in tumors (Skrivergaard et al, 2019).
Although cancer cells experience endogenous DNA damage (Tubbs & Nussenzweig, 2017), it is unclear whether high levels of OAS1 in these cells help them to survive in steady state. However, the toxic effect of inducing DNA damage in cancer cells in response to agents that cause lesions that require PARP1 for their repair (e.g., decitabine (Orta et al, 2014), cisplatin (Gunn et al, 2016), or temozolomide (Zhang et al, 2012) is likely to be enhanced by inhibiting OAS1 activity or expression, with minimal effects on normal cells, which have very low OAS1 levels in the absence of interferon.
Materials and Methods
Cell culture
Immortalized human mammary epithelial hTERT‐HME1 (HME) cells were cultured with mammary epithelial cell growth medium (CC‐3150; Lonza, Atlanta, GA). Prostate cancer cell line PC3 cells were cultured in RPMI‐1640 supplemented with 10% fetal bovine serum (FBS), 100 U/ml penicillin, and 100 μg/ml streptomycin. Cell lines were authenticated using Short Tandem Repeat analysis by ATCC (PC3, 92% match to ATCC cell line CRL‐1435) or Genetica (HME, 100% match to ATCC cell line CRL‐4010). Mycoplasma testing was performed using MycoAlertTM Mycoplasma Detection Kit (25 Tests), catalog # LT07‐218.
TaqMan SNP genotyping assay
Genotyping for the OAS1 SNP was performed using the TaqMan SNP Genotyping assay made‐to‐order rs10774671 (Applied Biosystems). The assay was performed according to the manufacturer's instructions. Briefly, 20 ng of genomic DNA was amplified with TaqMan genotyping master mix (Applied Biosystems part 4371353, foster City, CA) and the specific TaqMan SNP genotyping assay. The assay was carried out using the StepOne Plus (Applied Biosystems) and the following conditions: 30 s at 60°C and 10 min at 95°C followed by 40 cycles of 95°C for 15 s and 60°C for 1 min. Automatic allele calls were made for each sample to determine the alleles present in the DNA (SDS v.2.3, Applied Biosystems).
Knocking out OAS genes using CRISPR‐Cas9
The plasmid constructs (provided by Susan R. Weiss, University of Pennsylvania) described in (13) were as follows: pLenti‐sgO1‐9 (targeting the OAS1 gene), pLenti‐sgO2‐5 (targeting the OAS2 gene in hTERT‐HME1 cells) and pLenti‐sgO2‐9 (targeting the OAS2 gene in PC3 cells), and pLenti‐sgO3‐9 (targeting the OAS3 gene). To produce pseudo lentiviruses, 4 × 10⁶ HEK 293T cells were plated on 10 cm plates and were transfected on the next day with 3 μg pLenti‐CRIPSR (with sgRNA), 1.6 μg psPAX2, and 1 μg of pMD2.G using Lipofectamine/PLUS (Thermo Fisher Scientific) (30 μl/20 μl, respectively, in 6 ml of optiMEM). The supernatant suspensions were harvested 24 and 48 h after transfection, combined, and stored at −80°C. To construct cells with OAS single knockouts, 3 × 10⁵ PC3 cells or 4 × 10⁴ HME cells were plated onto 10‐cm plates or into one well of a 6‐well plate, respectively, and transduced with diluted (1.5 ml virus plus 4.5 ml culture media for PC3 and 0.25 ml virus plus 0.75 ml culture media for HME) pseudo lentiviruses containing pLenti‐sgO1‐9, pLenti‐sgO2‐5 (for hTERT‐HME1), pLenti‐sgO2‐9 (for PC3), or pLenti‐sgO3‐9. To construct cells with OAS double or triple knockouts, cells were transduced with diluted pseudo lentiviruses containing pLenti‐sgO1‐9 on the first day, pLenti‐sgO2‐5 (for hTERT‐HME1) and pLenti‐sgO2‐9 (for PC3) on the second day, and pLenti‐sgO3‐9 on the third day. Forty‐eight hours after the last transduction, the cells were cultured in medium containing 1 μg/ml of puromycin for 3 days. Puromycin‐resistant cells were cloned by limiting dilution, and single‐cell clones were selected for further amplification. The protein expression of each OAS in each clone was examined by the Western method. We obtained 2‐3 clones of each individual OAS SKO, DKO, and TKO in both hTERT‐HME1 and PC3 cells, and one representative clone for each KO was cultured for further experiments. Vector control cells were generated using an identical infection and cloning strategy with pLenti‐CRISPRv2 empty vector pseudo lentiviruses.
Ectopic expression of human OAS cDNAs
To increase the expression of OAS1, OAS2, and OAS3 using pseudo lentivirus, we subcloned the cDNAs of human OAS1, OAS2, and OAS3, from our previous constructs (13), into pLenti‐CMV‐puro and pLenti‐CMV‐hygro using Gateway recombination cloning technology.
We made a catalytically inactive mutant OAS1 (D75/77A) construct by the PCR site‐directed mutagenesis method using pLenti‐CMV‐hygro‐OAS1 as a template and primers of which sequences are as follows:
D75/77A‐F, CGATCTGCCGCTGCCCTGGTT
D75/77A‐R, GCCTCTGAGGGTGGTGCCCTT.
All constructs were verified by nucleotide sequencing, and expression was confirmed by Western analysis. To express each Flag‐tagged OAS in OAS‐DKO cells or parental cells, hTERT‐HME1 or PC3 cells (4 × 10⁴ per well of 6‐well plate) were infected with pseudo lentivirus containing Flag‐OAS cDNA (3 consecutive infections for OAS1 or OAS3 pseudo lentivirus and one time infection with 10% diluted OAS2 pseudo lentivirus), and then were selected with puromycin (1 μg/ml) for parental cells and hygromycin (100 μg/ml for hTERT‐HME1 and 200 μg/ml for PC3) for OAS‐DKO cells (which are already puromycin‐resistant). (We chose to increase residual OAS in DKO cells rather than put‐back OAS to TKO to obtain higher OAS levels by avoiding cleavage of the ectopic OAS by our CRISPR‐Cas9 system, in which both restrictase and guiding RNA (targeting an early exon) are constantly expressed from the same construct.) OAS expression in the transfected cell pool was monitored by Western blot analysis, using both anti‐OAS and anti‐Flag.
Real‐time PCR
cDNA was synthesized from total RNA by using a modified manufacturer's protocol with random hexamer and SuperScript III (Invitrogen). Real‐time PCR was performed with Bullseye EvaGreen qPCR master mix (MidSci) in a Light Cycler 480 II (Roche, Indianapolis, IN). The PCR protocol is initial activation at 95°C for 10 min, 50 cycles at 95°C for 15 s and 60°C for 1 min. C t values were converted into relative gene expression levels compared to that of an internal control gene, GAPDH, using the ΔΔCt method (67). Each PCR run also included non‐template controls containing all reagents except cDNA, which generated no amplification. The specificity was confirmed by analysis of the melting curves of the PCR products. The primer sequences are as follows:
OAS1‐F: TGAGGTCCAGGCTCCACGCT
OAS1‐R: GCAGGTCGGTGCACTCCTCG
OAS2‐F: AGGTGGCTCCTATGGACGGAA
OAS2‐R: GGCTTCTCTTCTGATCCTGGAATTG
OAS3‐F: CCTGCAGTTCCGCCTGACATCC
OAS3‐R: CTCCGCAGCTCTGTGAAGCAGG
GAPDH‐F: TGG CGT CTT CAC CAC CAT
GAPDH‐R: GCA GGA GGC ATT GCT GAT
Treatment with DNA‐damaging agents
IncuCyte and MTT cell survival assays: for PC3 cells, H2O2 (Fisher) at final concentrations of 75–500 μM were added to media with no protein components. After incubation at 37°C for 1 h, complete media components were added. 2 mM methyl methane sulfonate (MMS, Sigma) or 40 μM para‐benzoquinone (pBQ, Sigma) was added in complete media. For HME cells, H2O2 at final concentrations of 300–1,000 μM was added to media with no protein components. For short‐term WB and IF experiments, H2O2 was used at 500 μM for HME cells, and at 100 μM for PC3 cells.
Pre‐treatment with IFNβ and olaparib
For WB experiments, IFNβ was added to medium at 5–500 IU/ml for 1–4 days prior to treatments. For immunostaining experiments, 100 IU/ml of IFNβ was added to the medium for 1–2 days prior to treatments. Olaparib (Ola) was added to the medium at 200 nM 30 min prior to H2O2 treatment.
Real‐time quantitative analysis of cytotoxicity
HME or PC3 cells were plated at 5,000–50,000 cells per well in 96‐well plates or at 10,000 cells per well in 48‐well plates (cell numbers are indicated in the figure legends) and incubated for 24 h. The cells were treated with DNA‐damaging agents. Cell number control wells were treated with 0.9% Triton X‐100, which leads to 100% cell death, to determine the total number of cells at the time of treatment with the DNA‐damaging agents. The IncuCyte™ Cytotox Reagent (Essen Bioscience, Ann Arbor, MI, final concentration 40 nM), nuclear dye impermeable to live cells, was added 1 h after treatment with hydrogen H2O2 or before treatment with MMS or pBQ. Images were acquired every 3 h, using 10× objective in the green fluorescence channel by IncuCyte ZOOM image analysis system, automatically quantifying the number of dead cells at each time point. The percentage of dead cells was calculated at each time point as 100 × (number of dead cells in response to DNA‐damaging agents)/(number of dead cells in response to Triton X‐100). The statistical significance was analyzed using two‐way ANOVA with Bonferroni's multiple comparisons test.
Antibodies
Primary commercially available antibodies: mouse anti‐OAS1 p41F‐3 (1:100; Santa Cruz, Dallas, TX), mouse anti‐OAS2 G‐9 (1:200; Santa Cruz), goat anti‐OAS3 N‐18 (1:500; Santa Cruz), rabbit anti‐PARP 46D11 (1:2,000, Cell Signaling), rabbit anti‐AIF (Cell Signaling, 1:100), mouse anti‐dsRNA J2 monoclonal antibody (1:100, Scicons, Szirák, Hungary), mouse anti‐Poly(ADP‐ribose, 10H (IgG3 subclass, 1:2,,000, Enzo Life Sciences), mouse IgG3 isotype control antibody MAB007 (R&D systems), mouse anti‐β‐actin AC‐74 (1:10,000; Sigma‐Aldrich), rabbit anti‐GAPDH (Santa Cruz, sc‐266778). Secondary antibodies were anti‐mouse (1:10,000; Rockland, Limerick, PA), anti‐rabbit (1:10,000; Rockland), and anti‐goat conjugated with HRP (1:3,000; Santa Cruz); J2 anti‐dsRNA monoclonal antibody (mAb), mouse, IgG2a, kappa chain (1:100, Scicons). Fluorescent secondary antibodies raised in donkey were from Jackson Immuno Research Laboratories, West Grove, PA: Alexa Fluor 488 705‐545‐147, 715‐545‐150, 1‐225‐152, Alexa Fluor 594 711‐585‐152, 715‐585‐150, 305‐585‐003.
Antibodies against 2‐5A (anti‐2‐5A)
Anti‐2‐5A was prepared with modifications of methods reported earlier (68). Briefly, purified (2′‐5′)p3A4 was coupled to bovine serum albumin (BSA) (lyophilized powder, crystallized, > 98.0% Sigma) using periodate chemistry. The 2‐5A conjugated BSA was purified by gel filtration on a Superose 6™ (10 × 300 mm) column (Pharmacia Biotech) interfaced with AKTA purifier (GE Healthcare, Cleveland, OH) using 10 mM phosphate buffer saline. 2‐5A‐conjugated BSA was used as the antigen to raise antibodies in New Zealand white rabbits and antisera after the 3rd boost were used.
Chemicals and reagents
The following were purchased from commercial sources as shown: PAR polymer, 4336‐100‐01 (Trevigen). Olaparib, HY‐10162 (MedChem Express, Monmouth Junction, NJ), Poly(ADP‐ribose), standard: ALX‐202‐043‐C001 (Enzo Life Sciences, Farmingdale, NY); Histone from calf thymus (Sigma, H9250), Human recombinant PARP1 (Enzo Life Sciences, P09874), IFN Beta 1a, 11410‐2 (PBL Assay Science); Protein A Magnetic Beads: #8687), Halt™ Protease and Phosphatase Inhibitor Single‐Use Cocktail: #78442 (Thermo Scientific), Halt Protease Inhibitor Cocktail: #87786 (Thermo Scientific), HBSS (10×) (calcium, magnesium: #14065056); DAPI 10236276001 (Roche); Phalloidin‐Fluor 555 Reagent—CytoPainter (ab176756) (Abcam); PARG enzyme: 4680‐096‐01 (Trevigen).
Conjugate of 2‐5A with biotin
5′‐triphosphoryl, 2′,5′‐tetraadenylate [(2′‐5′)p3A4] was enzymatically synthesized and purified by HPLC as described earlier (69) and the conjugation of 2‐5A with biotin was as described in (70). The (2′‐5′)p3A4‐biotin was tested for functional activity in a FRET‐based RNase L activation assay and used for competitive ELISA on a Streptavidin coated plates (Thermo Scientific) as described below (71).
Synthesis and purification of PAR‐2‐5A
In vitro synthesis of PAR modified with AMP (PAR‐2‐5A) was performed enzymatically utilizing purified recombinant hexa‐histidine tagged human OAS1 p42 (49). Briefly, 0.5 μM of PAR polymer was incubated with OAS1 immobilized on poly(rI):poly(rC)‐conjugated Agarose (Ag) beads in the presence of 5.0 mM ATP for 18 h at 37°C with constant agitation at 150 rpm. The reaction mixture was centrifuged at 500× g in a swinging bucket rotor for 15 min to remove proteins immobilized on Ag‐poly(rI):poly(rC). The supernatant solution was collected and placed onto a Superdex 75 10/300 GL column (GE Healthcare) to remove any canonical 2‐5A from PAR2‐5A, with elution in 10 mM Tris–HCl, pH7.5, 150 mM NaCl.
In vitro modification of PAR by OAS1 with radiolabeled ATP
Purified His‐OAS1 (0.5 μM) was incubated with or without 0.7 μM PAR Polymer (Trevigen) as substrate, with or without 3 ng of poly(rI):poly(rC) (pIC) per 15 μl reaction as activator, 67 μM unlabeled ATP, and 2 μCi of α[32P]‐ATP in HEPES buffer [10 mM HEPES pH7.4, 90 mM KCl, 1 mM MgCl, 2 mM mercaptoethanol; and 0.5% NP‐40] at 30°C for 0, 10, 30, or 60 min. The reaction mixtures were added to RNA loading buffer and heated at 70°C for 8 min, followed by cooling on ice before loading into 6% polyacrylamide‐8 M urea denaturing gels. An autoradiograph was made from the dried gels, and a Storm Imager was used to quantitate the signals.
Immunodetection of in vitro synthesized PAR2‐5A
PAR was synthesized with PARP1 (Trevigen); activated DNA; 50, 25, or 0.25 μM NAD+; and 15 μg calf thymus histone (Sigma). PAR‐2‐5A was synthesized by adding 1 μg OAS1, 40 ng pIC, and 50 μM ATP in 30‐μl reaction. After incubation at 37°C for 60 min, the proteins in the reaction mixtures were digested with proteinase K at 54°C for 60 min. The reaction mixtures were heated at 65°C with RNA loading buffer for 15 min and then cooled on ice. PAR and PAR‐2‐5A were separated in 6% polyacrylamide‐8 M urea denaturing gels and transferred to charged nylon membranes. PAR was detected by probing with mouse anti‐PAR, and PAR‐2‐5A was detected by re‐probing the blot with rabbit anti‐2‐5A, after stripping and blocking.
Inhibition of PAR synthesis by OAS1 in vitro
PARP1 was incubated with or without activated DNA, 50 or 25 μM NAD+, and 0.5 mg/ml calf thymus histone in HEPES buffer, pH 7.4 at 37°C for 60 min. For OAS1‐dependent inhibition, components of the 2‐5A reaction (OAS1, pIC, and ATP) were added to the PAR reactions as indicated in Fig 3. The products were analyzed by the Western method using rabbit anti‐PARP1 and mouse anti‐OAS1.
Detection of dsRNA
HME cells were plated on 8‐well chamber slides at 5 × 10⁴ cells/well, treated with 500 μM H2O2, fixed with 4%‐paraformaldehyde in PBS for 10 min at room temperature, permeabilized with 0.5% Triton X‐100, treated or not with dsRNA‐specific 1 mg/ml ShortCut® RNase III (New England BioLabs) for 1 or 24 h at +37°C, blocked with 10% normal donkey serum, and stained with J2 anti‐dsRNA antibodies (1:100) overnight at +4°C followed by incubation with fluorescent secondary antibodies and DAPI.
Subcellular fractionation
Cells (8 × 10⁶) were washed with ice‐cold PBS, scraped, and collected in 1.5‐ml micro‐centrifuge tubes in 1 ml of ice‐cold PBS and fractionated using Subcellular Protein Fractionation Kit for Cultured Cells (Thermo Fisher, Cat. No. 7884) according to the Manufacturer's protocol. Nuclear fractions and whole‐cell lysates that contained DNA were sonicated using microprobes (Misonix, NY, USA) at level 2, twice for 5 s each, followed by boiling for 1 min. 10 and 5 μl of whole cell lysate and nuclear fractions, respectively, were loaded onto gels.
Immunoprecipitation
Cells (1 × 10⁷) were lysed in IP buffer (Pierce) supplemented with HALT proteases/phosphatases inhibitors and 200 nM olaparib, and sonicated with two short (5 s) pulses at medium intensity on ice. Anti‐PAR mouse or control mouse IgG3 antibodies were incubated with Protein A conjugated on magnetic beads (Pierce) for 1 h; cell lysates incubated with the magnetic beads with attached antibodies for 2 h; precipitated material was immobilized on the magnetic stand and washed four times with TBS‐T. All steps were performed on ice. Precipitates were extracted by boiling for 5 min in NuPAGE® LDS Sample Buffer (Life Technologies, Burlington, Canada).
Immunoblotting
Western Blot
Cells were harvested, washed in cold PBS, and lysed with a buffer containing 250 mM Tris–HCl, pH 8.0, 150 mM NaCl, 1% Triton X‐100, and 0.1% SDS. When preparing samples for PAR detection, 200 nM of olaparib was added to the lysis buffer. Cell lysates were mixed with 5× Laemmli buffer or NuPAGE® LDS Sample Buffer (Life Technologies), boiled at 95°C for 5 min, and analyzed by electrophoresis in 8% SDS poly‐acrylamide gels or 4–12% gradient NuPAGE Bis‐Tris gels (Life Technologies). Proteins were transferred to PVDF membranes, which were treated with 5% non‐fat milk in Tris–HCl buffer saline with 0.5% Tween‐20 (TBS‐T) blocking buffer for 1 h, followed by incubation overnight at 4°C with antibodies diluted in 5% milk or bovine serum albumin (BSA) in TBS‐T. Membranes then were washed three times with TBS‐T, incubated with secondary antibodies for 1 h at room temperature, washed three times with TBS‐T, and then incubated with Western Lightning Plus‐ECL (PerkinElmer, Akron, OH). The signal was detected using an ECOMAX X‐ray film processor (PROTEC, Santa Fe Springs, CA) and HyBlot CL autoradiography film (Denville Scientific, Holliston, MA).
Dot Blot
Two‐μl droplets (10, 5, or 2.5 μM in ADPr equivalents) of commercial PAR standard and in vitro synthesized PAR‐2‐5A were applied to nylon membranes (Hybond‐N+, Amersham, Piscataway, NJ). The membranes were dried and baked at 80°C for 2 h, blocked with SuperBlock blocking buffer (Thermo Fisher Scientific), and incubated with anti‐2‐5A or rabbit polyclonal anti‐PAR, followed by detection as described above.
Immunofluorescence imaging
Cells were plated into Millicell EZ SLIDE 8‐well glass slides (PEZGS0816, EMD Millipore, Burlington, MA) and treated 24 h post‐seeding. Cells were fixed with 4% paraformaldehyde, followed by permeabilization with 0.1% Triton X‐100 or with ‐20°C methanol:acetone::1:1, blocked with normal donkey serum, and incubated with specific antibodies followed by multiple‐labeling fluorescent secondary antibodies raised in donkeys. When indicated, prior to fixation, cells were pre‐treated with hypotonic solutions: Buffer 1: 10 mM Tris–HCl, pH 7.4, 2.5 mM MgCl2, 1 mM PMSF, 0.5% Nonidet P‐40, or Buffer 2: 25 mM sodium phosphate buffer, pH 7.4, 0.5 M NaCl, 1 mM EDTA, 0.5% Triton X‐100, 10% glycerol, 5 mM MgCl2, 1 mM PMSF. Images were taken at 40× magnification using the oil immersion objectives of Leica DM upright microscope equipped with a QImaging Retiga cooled CCD camera, with the aid of Leica LAS‐AF acquisition software. For colocalization studies, images were taken using a Leica TCS‐SP8‐AOBS inverted confocal microscope (Leica Microsystems, GmbH, Wetzlar, Germany) with the aid of Leica Confocal Software.
Quantification of immunofluorescence images
To quantify OAS1‐3 immunofluorescence in HME and PC3 cells, 5–10 images of different fields were taken at 40× magnification; ImageJ software was used to quantify immunofluorescent signal intensities. Images were converted to a 16‐bit grayscale; nuclear and cytoplasmic masks were created based on standard stainings (DAPI and phalloidin); measurements from cytoplasmic and nuclear areas were obtained (for HME OAS1 and OAS3, and PC3 OAS1‐3). Masks for perinuclear and peripheral areas for OAS2 measurements were drawn based on areas of high OAS2 signal. Background readings were measured on cells stained with secondary antibodies only. To calculate the corrected fluorescence intensity (CFI), the following formula was used: CFI = integrated density − (area of selected tissue x mean fluorescence of background readings). Scatter plotting and statistical analyses (unpaired t‐tests with Welch's correction) were performed using Prism 7 software. Outliers (> 3SD) were excluded. To quantify 2‐5A signal in nuclei, nuclear masks were created, nuclear fluorescence intensity was measured as described above, and density of fluorescence intensity was calculated by dividing by the area of the nuclear mask, followed by normalizing to fluorescence intensity density of a vector control. Scatter plotting and statistical analyses (unpaired Kolmogorov–Smirnov t‐tests) were performed using Prism 7 software. To quantify colocalization of 2‐5A and PAR signals in the nucleus of H2O2‐treated HME cells (500 μM, 12 min), image stacks were obtained with the aid of Leica TCS‐SP8‐AOBS‐inverted confocal microscope at 63× magnification, and single‐slice images distant form the surface of the slide were selected for quantification with the aid of Volocity 6.3.0 (Quorum Technologies Inc., Puslinch, Ontario, Canada) software. Nuclear masks were created based on DAPI staining.
Data analysis for RNAseq and IC50 correlation
The raw data of the OAS1 expression in different cell lines from Cancer Cell Encyclopedia (https://portals.broadinstitute.org/ccle/data) were obtained, and the corresponding cell lines IC50 were obtained from Genomics of Drug Sensitivity in Cancer (https://www.cancerrxgene.org/translation/Drug). Pearson's and Spearman's correlation coefficients and their significance were performed in GraphPad Prizm 8.0 (https://www.graphpad.com/).
Author contributions
AK: conceptualization; design and performance of cell‐based experiments; data analysis; writing—most of the original draft, editing, and review. HC: design and performance of IncuCyte cell survival experiments; writing—parts of the original draft, editing, and review. BD: design and performance of in vitro experiments; production of genetically modified HME cell lines; writing—review. BJ: in vitro experiments methodology; resources including raising the anti‐2‐5A antibody; data mining and analysis of bioinformatics data; writing—editing and review. EH: production of genetically modified HME and PC3 cell lines, technical support; writing—review. MH: data mining and analysis of bioinformatics data; writing—review. IT: technical support; writing—review. CC: genotyping, writing—review. RS and GS: conceptualization; supervision of experimental design; resources; funding acquisition; writing—comprehensive editing and review.
Conflict of interest
The authors declare that they have no conflict of interest.
Supporting information
Appendix
Expanded View Figures PDF
Source Data for Expanded View and Appendix
Review Process File
Source Data for Figure 2
Source Data for Figure 4
Source Data for Figure 5
Source Data for Figure 6
Source Data for Figure 7
Source Data for Figure 8
Acknowledgements
We would like to thank Susan Weiss (University of Pennsylvania) for the gift of OAS targeting CRISPR vectors, Masahiro Hitomi and Anastasia Chumakova (Cleveland Clinic) and Ajaykumar Zalavadia (Cleveland Clinic, Imaging Core) for help with image processing, and Andrew Pieper (Case Western Reserve University) for a generous support of this study. NIH: George R Stark, PO1CA062220; NIH: Robert H Silverman, R01AI135922. This work utilized the Leica SP8 confocal microscope that was purchased with funding from National Institutes of Health SIG grant 1S10OD019972‐01.
The EMBO Journal (2020) 39: e101573
Contributor Information
Anna A Kondratova, Email: anna.kondratova@case.edu.
Robert H Silverman, Email: anya.ko.12@gmail.com.
George R Stark, Email: silverr@ccf.org.
Data availability
Data generated or analyzed during this study are included in the manuscript and source data files.
References
- Ando Y, Elkayam E, McPherson RL, Dasovich M, Cheng SJ, Voorneveld J, Filippov DV, Ong SE, Joshua‐Tor L, Leung AKL (2019) ELTA: enzymatic labeling of terminal ADP‐ribose. Mol Cell 73: 845–856.e845 [DOI] [PMC free article] [PubMed] [Google Scholar]
- Andrabi SA, Kim NS, Yu SW, Wang H, Koh DW, Sasaki M, Klaus JA, Otsuka T, Zhang Z, Koehler RC et al (2006) Poly(ADP‐ribose) (PAR) polymer is a death signal. Proc Natl Acad Sci USA 103: 18308–18313 [DOI] [PMC free article] [PubMed] [Google Scholar]
- Aredia F, Scovassi AI (2014) Poly(ADP‐ribose): a signaling molecule in different paradigms of cell death. Biochem Pharmacol 92: 157–163 [DOI] [PubMed] [Google Scholar]
- Banerjee S, Gusho E, Gaughan C, Dong B, Gu X, Holvey‐Bates E, Talukdar M, Li Y, Weiss SR, Sicheri F et al (2019) OAS‐RNase L innate immune pathway mediates the cytotoxicity of a DNA‐demethylating drug. Proc Natl Acad Sci USA 116: 5071–5076 [DOI] [PMC free article] [PubMed] [Google Scholar]
- Barkauskaite E, Jankevicius G, Ahel I (2015) Structures and mechanisms of enzymes employed in the synthesis and degradation of PARP‐dependent protein ADP‐ribosylation. Mol Cell 58: 935–946 [DOI] [PubMed] [Google Scholar]
- Beranek DT (1990) Distribution of methyl and ethyl adducts following alkylation with monofunctional alkylating agents. Mutat Res 231: 11–30 [DOI] [PubMed] [Google Scholar]
- Berger NA, Besson VC, Boulares AH, Burkle A, Chiarugi A, Clark RS, Curtin NJ, Cuzzocrea S, Dawson TM, Dawson VL et al (2018) Opportunities for the repurposing of PARP inhibitors for the therapy of non‐oncological diseases. Br J Pharmacol 175: 192–222 [DOI] [PMC free article] [PubMed] [Google Scholar]
- Besse S, Rebouillat D, Marie I, Puvion‐Dutilleul F, Hovanessian AG (1998) Ultrastructural localization of interferon‐inducible double‐stranded RNA‐activated enzymes in human cells. Exp Cell Res 239: 379–392 [DOI] [PubMed] [Google Scholar]
- Bonnevie‐Nielsen V, Field LL, Lu S, Zheng DJ, Li M, Martensen PM, Nielsen TB, Beck‐Nielsen H, Lau YL, Pociot F (2005) Variation in antiviral 2′,5′‐oligoadenylate synthetase (2′5′AS) enzyme activity is controlled by a single‐nucleotide polymorphism at a splice‐acceptor site in the OAS1 gene. Am J Hum Genet 76: 623–633 [DOI] [PMC free article] [PubMed] [Google Scholar]
- Cayley PJ, Kerr IM (1982) Synthesis, characterisation and biological significance of (2′‐5′)oligoadenylate derivatives of NAD+, ADP‐ribose and adenosine(5′)tetraphospho(5′)adenosine. Eur J Biochem 122: 601–608 [PubMed] [Google Scholar]
- Chalupnikova K, Nejepinska J, Svoboda P (2013) Production and application of long dsRNA in mammalian cells. Methods Mol Biol 942: 291–314 [DOI] [PubMed] [Google Scholar]
- Chebath J, Benech P, Hovanessian A, Galabru J, Revel M (1987) Four different forms of interferon‐induced 2′,5′‐oligo(A) synthetase identified by immunoblotting in human cells. J Biol Chem 262: 3852–3857 [PubMed] [Google Scholar]
- Cheon H, Holvey‐Bates EG, Schoggins JW, Forster S, Hertzog P, Imanaka N, Rice CM, Jackson MW, Junk DJ, Stark GR (2013) IFNbeta‐dependent increases in STAT1, STAT2, and IRF9 mediate resistance to viruses and DNA damage. EMBO J 32: 2751–2763 [DOI] [PMC free article] [PubMed] [Google Scholar]
- Dawson TM, Dawson VL (2017) Mitochondrial mechanisms of neuronal cell death: potential therapeutics. Annu Rev Pharmacol Toxicol 57: 437–454 [DOI] [PMC free article] [PubMed] [Google Scholar]
- Di H, Elbahesh H, Brinton MA (2020) Characteristics of human OAS1 isoform proteins. Viruses 12: E152 [DOI] [PMC free article] [PubMed] [Google Scholar]
- Dong B, Silverman RH (1995) 2‐5A‐dependent RNase molecules dimerize during activation by 2‐5A. J Biol Chem 270: 4133–4137 [DOI] [PubMed] [Google Scholar]
- Donovan J, Dufner M, Korennykh A (2013) Structural basis for cytosolic double‐stranded RNA surveillance by human oligoadenylate synthetase 1. Proc Natl Acad Sci USA 110: 1652–1657 [DOI] [PMC free article] [PubMed] [Google Scholar]
- Donovan J, Whitney G, Rath S, Korennykh A (2015) Structural mechanism of sensing long dsRNA via a noncatalytic domain in human oligoadenylate synthetase 3. Proc Natl Acad Sci USA 112: 3949–3954 [DOI] [PMC free article] [PubMed] [Google Scholar]
- Ethier C, Tardif M, Arul L, Poirier GG (2012) PARP‐1 modulation of mTOR signaling in response to a DNA alkylating agent. PLoS ONE 7: e47978 [DOI] [PMC free article] [PubMed] [Google Scholar]
- Eustermann S, Wu WF, Langelier MF, Yang JC, Easton LE, Riccio AA, Pascal JM, Neuhaus D (2015) Structural basis of detection and signaling of DNA single‐strand breaks by human PARP‐1. Mol Cell 60: 742–754 [DOI] [PMC free article] [PubMed] [Google Scholar]
- Fatokun AA, Dawson VL, Dawson TM (2014) Parthanatos: mitochondrial‐linked mechanisms and therapeutic opportunities. Br J Pharmacol 171: 2000–2016 [DOI] [PMC free article] [PubMed] [Google Scholar]
- Ferbus D, Justesen J, Besancon F, Thang MN (1981) The 2′5′ oligoadenylate synthetase has a multifunctional 2′5′ nucleotidyl‐transferase activity. Biochem Biophys Res Commun 100: 847–856 [DOI] [PubMed] [Google Scholar]
- Fouquerel E, Goellner EM, Yu Z, Gagne JP, Barbi de Moura M, Feinstein T, Wheeler D, Redpath P, Li J, Romero G et al (2014) ARTD1/PARP1 negatively regulates glycolysis by inhibiting hexokinase 1 independent of NAD+ depletion. Cell Rep 8: 1819–1831 [DOI] [PMC free article] [PubMed] [Google Scholar]
- Gantier MP, Williams BR (2007) The response of mammalian cells to double‐stranded RNA. Cytokine Growth Factor Rev 18: 363–371 [DOI] [PMC free article] [PubMed] [Google Scholar]
- Gardner AM, Xu FH, Fady C, Jacoby FJ, Duffey DC, Tu Y, Lichtenstein A (1997) Apoptotic vs nonapoptotic cytotoxicity induced by hydrogen peroxide. Free Radic Biol Med 22: 73–83 [DOI] [PubMed] [Google Scholar]
- Gordon‐Shaag A, Yosef Y, Abd El‐Latif M, Oppenheim A (2003) The abundant nuclear enzyme PARP participates in the life cycle of simian virus 40 and is stimulated by minor capsid protein VP3. J Virol 77: 4273–4282 [DOI] [PMC free article] [PubMed] [Google Scholar]
- Gunn AR, Banos‐Pinero B, Paschke P, Sanchez‐Pulido L, Ariza A, Day J, Emrich M, Leys D, Ponting CP, Ahel I et al (2016) The role of ADP‐ribosylation in regulating DNA interstrand crosslink repair. J Cell Sci 129: 3845–3858 [DOI] [PMC free article] [PubMed] [Google Scholar]
- Gupte R, Liu Z, Kraus WL (2017) PARPs and ADP‐ribosylation: recent advances linking molecular functions to biological outcomes. Genes Dev 31: 101–126 [DOI] [PMC free article] [PubMed] [Google Scholar]
- Gusho E, Zhang R, Jha BK, Thornbrough JM, Dong B, Gaughan C, Elliott R, Weiss SR, Silverman RH (2014) Murine AKAP7 has a 2′,5′‐phosphodiesterase domain that can complement an inactive murine coronavirus ns2 gene. MBio 5: e01312–e01314 [DOI] [PMC free article] [PubMed] [Google Scholar]
- Ha M, Kim VN (2014) Regulation of microRNA biogenesis. Nat Rev Mol Cell Biol 15: 509–524 [DOI] [PubMed] [Google Scholar]
- Hasler J, Samuelsson T, Strub K (2007) Useful “junk”: Alu RNAs in the human transcriptome. Cell Mol Life Sci 64: 1793–1800 [DOI] [PMC free article] [PubMed] [Google Scholar]
- Hersh CL, Brown RE, Roberts WK, Swyryd EA, Kerr IM, Stark GR (1984) Simian virus 40‐infected, interferon‐treated cells contain 2′,5′‐oligoadenylates which do not activate cleavage of RNA. J Biol Chem 259: 1731–1737 [PubMed] [Google Scholar]
- Jouan‐Lanhouet S, Arshad MI, Piquet‐Pellorce C, Martin‐Chouly C, Le Moigne‐Muller G, Van Herreweghe F, Takahashi N, Sergent O, Lagadic‐Gossmann D, Vandenabeele P et al (2012) TRAIL induces necroptosis involving RIPK1/RIPK3‐dependent PARP‐1 activation. Cell Death Differ 19: 2003–2014 [DOI] [PMC free article] [PubMed] [Google Scholar]
- Katsube T, Mori M, Tsuji H, Shiomi T, Wang B, Liu Q, Nenoi M, Onoda M (2014) Most hydrogen peroxide‐induced histone H2AX phosphorylation is mediated by ATR and is not dependent on DNA double‐strand breaks. J Biochem 156: 85–95 [DOI] [PubMed] [Google Scholar]
- Kerr IM, Brown RE (1978) pppA2′p5′A2′p5′A: an inhibitor of protein synthesis synthesized with an enzyme fraction from interferon‐treated cells. Proc Natl Acad Sci USA 75: 256–260 [DOI] [PMC free article] [PubMed] [Google Scholar]
- Khodarev NN, Beckett M, Labay E, Darga T, Roizman B, Weichselbaum RR (2004) STAT1 is overexpressed in tumors selected for radioresistance and confers protection from radiation in transduced sensitive cells. Proc Natl Acad Sci USA 101: 1714–1719 [DOI] [PMC free article] [PubMed] [Google Scholar]
- Khodarev NN, Minn AJ, Efimova EV, Darga TE, Labay E, Beckett M, Mauceri HJ, Roizman B, Weichselbaum RR (2007) Signal transducer and activator of transcription 1 regulates both cytotoxic and prosurvival functions in tumor cells. Cancer Res 67: 9214–9220 [DOI] [PubMed] [Google Scholar]
- Kim MY, Zhang T, Kraus WL (2005) Poly(ADP‐ribosyl)ation by PARP‐1: “PAR‐laying” NAD+ into a nuclear signal. Genes Dev 19: 1951–1967 [DOI] [PubMed] [Google Scholar]
- Kjaer KH, Pahus J, Hansen MF, Poulsen JB, Christensen EI, Justesen J, Martensen PM (2014) Mitochondrial localization of the OAS1 p46 isoform associated with a common single nucleotide polymorphism. BMC Cell Biol 15: 33 [DOI] [PMC free article] [PubMed] [Google Scholar]
- Kondratova AJB, Cheon H, Holvey‐Bates E, Dong B, Silverman R, Stark G (2016) A novel modification of poly(ADP)‐ribose modulates the repair of damaged DNA. Abstracts of papers presented at the 2016 meeting on The PARP family & ADP‐ribosylation, April 13 – April 16, 2016, Cold Spring Harbor Laboratory..
- Kristiansen H, Gad HH, Eskildsen‐Larsen S, Despres P, Hartmann R (2011) The oligoadenylate synthetase family: an ancient protein family with multiple antiviral activities. J Interferon Cytokine Res 31: 41–47 [DOI] [PubMed] [Google Scholar]
- Kumar S, Mitnik C, Valente G, Floyd‐Smith G (2000) Expansion and molecular evolution of the interferon‐induced 2′‐5′ oligoadenylate synthetase gene family. Mol Biol Evol 17: 738–750 [DOI] [PubMed] [Google Scholar]
- Lee JM, Ledermann JA, Kohn EC (2014) PARP Inhibitors for BRCA1/2 mutation‐associated and BRCA‐like malignancies. Ann Oncol 25: 32–40 [DOI] [PMC free article] [PubMed] [Google Scholar]
- Li Y, Banerjee S, Wang Y, Goldstein SA, Dong B, Gaughan C, Silverman RH, Weiss SR (2016) Activation of RNase L is dependent on OAS3 expression during infection with diverse human viruses. Proc Natl Acad Sci USA 113: 2241–2246 [DOI] [PMC free article] [PubMed] [Google Scholar]
- Lin RJ, Yu HP, Chang BL, Tang WC, Liao CL, Lin YL (2009) Distinct antiviral roles for human 2′,5′‐oligoadenylate synthetase family members against dengue virus infection. J Immunol 183: 8035–8043 [DOI] [PubMed] [Google Scholar]
- Lu Y, Kwintkiewicz J, Liu Y, Tech K, Frady LN, Su YT, Bautista W, Moon SI, MacDonald J, Ewend MG et al (2017) Chemosensitivity of IDH1‐mutated gliomas due to an impairment in PARP1‐mediated DNA repair. Cancer Res 77: 1709–1718 [DOI] [PMC free article] [PubMed] [Google Scholar]
- Luo X, Kraus WL (2012) On PAR with PARP: cellular stress signaling through poly(ADP‐ribose) and PARP‐1. Genes Dev 26: 417–432 [DOI] [PMC free article] [PubMed] [Google Scholar]
- Marie I, Svab J, Robert N, Galabru J, Hovanessian AG (1990) Differential expression and distinct structure of 69‐ and 100‐kDa forms of 2‐5A synthetase in human cells treated with interferon. J Biol Chem 265: 18601–18607 [PubMed] [Google Scholar]
- Minks MA, Benvin S, Baglioni C (1980) Mechanism of pppA(2′p5′A)n2′p5′AOH synthesis in extracts of interferon‐treated HeLa cells. J Biol Chem 255: 5031–5035 [PubMed] [Google Scholar]
- Molinaro RJ, Jha BK, Malathi K, Varambally S, Chinnaiyan AM, Silverman RH (2006) Selection and cloning of poly(rC)‐binding protein 2 and Raf kinase inhibitor protein RNA activators of 2′,5′‐oligoadenylate synthetase from prostate cancer cells. Nucleic Acids Res 34: 6684–6695 [DOI] [PMC free article] [PubMed] [Google Scholar]
- Munoz‐Gamez JA, Rodriguez‐Vargas JM, Quiles‐Perez R, Aguilar‐Quesada R, Martin‐Oliva D, de Murcia G, Menissier de Murcia J, Almendros A, Ruiz de Almodovar M, Oliver FJ (2009) PARP‐1 is involved in autophagy induced by DNA damage. Autophagy 5: 61–74 [DOI] [PubMed] [Google Scholar]
- Murata M, Moriya K, Inoue S, Kawanishi S (1999) Oxidative damage to cellular and isolated DNA by metabolites of a fungicide ortho‐phenylphenol. Carcinogenesis 20: 851–857 [DOI] [PubMed] [Google Scholar]
- Olson MJ (1988) DNA strand breaks induced by hydrogen peroxide in isolated rat hepatocytes. J Toxicol Environ Health 23: 407–423 [DOI] [PubMed] [Google Scholar]
- Orta ML, Hoglund A, Calderon‐Montano JM, Dominguez I, Burgos‐Moron E, Visnes T, Pastor N, Strom C, Lopez‐lazaro M, Helleday T (2014) The PARP inhibitor Olaparib disrupts base excision repair of 5‐aza‐2′‐deoxycytidine lesions. Nucleic Acids Res 42: 9108–9120 [DOI] [PMC free article] [PubMed] [Google Scholar]
- O'Sullivan J, Tedim Ferreira M, Gagne JP, Sharma AK, Hendzel MJ, Masson JY, Poirier GG (2019) Emerging roles of eraser enzymes in the dynamic control of protein ADP‐ribosylation. Nat Commun 10: 1182 [DOI] [PMC free article] [PubMed] [Google Scholar]
- Player MR, Torrence PF (1998) The 2‐5A system: modulation of viral and cellular processes through acceleration of RNA degradation. Pharmacol Ther 78: 55–113 [DOI] [PMC free article] [PubMed] [Google Scholar]
- Poulsen JB, Andersen KR, Kjaer KH, Vestergaard AL, Justesen J, Martensen PM (2012) Characterization of human phosphodiesterase 12 and identification of a novel 2′‐5′ oligoadenylate nuclease ‐ The ectonucleotide pyrophosphatase/phosphodiesterase 1. Biochimie 94: 1098–1107 [DOI] [PubMed] [Google Scholar]
- Ray Chaudhuri A, Nussenzweig A (2017) The multifaceted roles of PARP1 in DNA repair and chromatin remodelling. Nat Rev Mol Cell Biol 18: 610–621 [DOI] [PMC free article] [PubMed] [Google Scholar]
- Rebouillat D, Hovanessian AG (1999) The human 2′,5′‐oligoadenylate synthetase family: interferon‐induced proteins with unique enzymatic properties. J Interferon Cytokine Res 19: 295–308 [DOI] [PubMed] [Google Scholar]
- Reynolds P, Cooper S, Lomax M, O'Neill P (2015) Disruption of PARP1 function inhibits base excision repair of a sub‐set of DNA lesions. Nucleic Acids Res 43: 4028–4038 [DOI] [PMC free article] [PubMed] [Google Scholar]
- Rodriguez‐Vargas JM, Ruiz‐Magana MJ, Ruiz‐Ruiz C, Majuelos‐Melguizo J, Peralta‐Leal A, Rodriguez MI, Munoz‐Gamez JA, de Almodovar MR, Siles E, Rivas AL et al (2012) ROS‐induced DNA damage and PARP‐1 are required for optimal induction of starvation‐induced autophagy. Cell Res 22: 1181–1198 [DOI] [PMC free article] [PubMed] [Google Scholar]
- Rose JL, Reeves KC, Likhotvorik RI, Hoyt DG (2007) Base excision repair proteins are required for integrin‐mediated suppression of bleomycin‐induced DNA breakage in murine lung endothelial cells. J Pharmacol Exp Ther 321: 318–326 [DOI] [PubMed] [Google Scholar]
- Sarkar SN, Ghosh A, Wang HW, Sung SS, Sen GC (1999) The nature of the catalytic domain of 2′‐5′‐oligoadenylate synthetases. J Biol Chem 274: 25535–25542 [DOI] [PubMed] [Google Scholar]
- Shin HJ, Kwon HK, Lee JH, Gui X, Achek A, Kim JH, Choi S (2015) Doxorubicin‐induced necrosis is mediated by poly‐(ADP‐ribose) polymerase 1 (PARP1) but is independent of p53. Sci Rep 5: 15798 [DOI] [PMC free article] [PubMed] [Google Scholar]
- Silverman RH (2007) Viral encounters with 2′,5′‐oligoadenylate synthetase and RNase L during the interferon antiviral response. J Virol 81: 12720–12729 [DOI] [PMC free article] [PubMed] [Google Scholar]
- Skrivergaard S, Jensen MS, Rolander TB, Nguyen TBN, Bundgaard A, Nejsum LN, Martensen PM (2019) The cellular localization of the p42 and p46 oligoadenylate synthetase 1 isoforms and their impact on mitochondrial respiration. Viruses 11: E1122 [DOI] [PMC free article] [PubMed] [Google Scholar]
- Sosna J, Voigt S, Mathieu S, Lange A, Thon L, Davarnia P, Herdegen T, Linkermann A, Rittger A, Chan FK et al (2014) TNF‐induced necroptosis and PARP‐1‐mediated necrosis represent distinct routes to programmed necrotic cell death. Cell Mol Life Sci 71: 331–348 [DOI] [PMC free article] [PubMed] [Google Scholar]
- Tubbs A, Nussenzweig A (2017) Endogenous DNA damage as a source of genomic instability in cancer. Cell 168: 644–656 [DOI] [PMC free article] [PubMed] [Google Scholar]
- Verheugd P, Butepage M, Eckei L, Luscher B (2016) Players in ADP‐ribosylation: readers and erasers. Curr Protein Pept Sci 17: 654–667 [DOI] [PubMed] [Google Scholar]
- Virag L, Robaszkiewicz A, Rodriguez‐Vargas JM, Oliver FJ (2013) Poly(ADP‐ribose) signaling in cell death. Mol Aspects Med 34: 1153–1167 [DOI] [PubMed] [Google Scholar]
- Wang Y, Dawson VL, Dawson TM (2009) Poly(ADP‐ribose) signals to mitochondrial AIF: a key event in parthanatos. Exp Neurol 218: 193–202 [DOI] [PMC free article] [PubMed] [Google Scholar]
- Wang Y, An R, Umanah GK, Park H, Nambiar K, Eacker SM, Kim B, Bao L, Harraz MM, Chang C et al (2016) A nuclease that mediates cell death induced by DNA damage and poly(ADP‐ribose) polymerase‐1. Science 354: aad6872 [DOI] [PMC free article] [PubMed] [Google Scholar]
- Wathelet M, Moutschen S, Cravador A, DeWit L, Defilippi P, Huez G, Content J (1986) Full‐length sequence and expression of the 42 kDa 2‐5A synthetase induced by human interferon. FEBS Lett 196: 113–120 [DOI] [PubMed] [Google Scholar]
- Weichselbaum RR, Ishwaran H, Yoon T, Nuyten DS, Baker SW, Khodarev N, Su AW, Shaikh AY, Roach P, Kreike B et al (2008) An interferon‐related gene signature for DNA damage resistance is a predictive marker for chemotherapy and radiation for breast cancer. Proc Natl Acad Sci USA 105: 18490–18495 [DOI] [PMC free article] [PubMed] [Google Scholar]
- Xu X, Chua CC, Zhang M, Geng D, Liu CF, Hamdy RC, Chua BH (2010) The role of PARP activation in glutamate‐induced necroptosis in HT‐22 cells. Brain Res 1343: 206–212 [DOI] [PubMed] [Google Scholar]
- Zhang S, Lin Y, Kim YS, Hande MP, Liu ZG, Shen HM (2007) c‐Jun N‐terminal kinase mediates hydrogen peroxide‐induced cell death via sustained poly(ADP‐ribose) polymerase‐1 activation. Cell Death Differ 14: 1001–1010 [DOI] [PubMed] [Google Scholar]
- Zhang J, Stevens MF, Bradshaw TD (2012) Temozolomide: mechanisms of action, repair and resistance. Curr Mol Pharmacol 5: 102–114 [DOI] [PubMed] [Google Scholar]
Associated Data
This section collects any data citations, data availability statements, or supplementary materials included in this article.
Supplementary Materials
Appendix
Expanded View Figures PDF
Source Data for Expanded View and Appendix
Review Process File
Source Data for Figure 2
Source Data for Figure 4
Source Data for Figure 5
Source Data for Figure 6
Source Data for Figure 7
Source Data for Figure 8
Data Availability Statement
Data generated or analyzed during this study are included in the manuscript and source data files.