

Abstract
Hedgehog (Hh) signal molecules play a fundamental role in development, adult stem cell maintenance and cancer. Hh can signal at a distance, and we have proposed that its graded distribution across Drosophila epithelia is mediated by filopodia‐like structures called cytonemes. Hh reception by Patched (Ptc) happens at discrete sites along presenting and receiving cytonemes, reminiscent of synaptic processes. Here, we show that a vesicle fusion mechanism mediated by SNARE proteins is required for Ptc placement at contact sites. Transport of Ptc to these sites requires multivesicular bodies (MVBs) formation via ESCRT machinery, in a manner different to that regulating Ptc/Hh lysosomal degradation after reception. These MVBs include extracellular vesicle (EV) markers and, accordingly, Ptc is detected in the purified exosomal fraction from cultured cells. Blockage of Ptc trafficking and fusion to basolateral membranes result in low levels of Ptc presentation for reception, causing an extended and flattened Hh gradient.
Keywords: cytonemes, Hedgehog reception, morphogenetic synapsis, Patched, vesicle trafficking
Subject Categories: Development & Differentiation, Membrane & Intracellular Transport, Signal Transduction
Hedgehog gradient formation in the developing Drosophila wing epithelium depends on exosome‐mediated delivery of Hedgehog receptor Patched to discrete contact sites formed by filopodia‐like structures.

Introduction
The Hedgehog (Hh) family of proteins plays a central role in development in a wide range of organisms; it is needed for early patterning, cell migration, axon guidance and adult stem cell maintenance, and it is also implicated in cancer. As a morphogen, Hh can act at a distance to pattern tissues through concentration‐dependent differential activation of target genes (reviewed in Briscoe & Therond, 2013). The graded distribution of Hh and the ability of receiving cells to respond specifically to different Hh concentrations are tightly regulated processes.
Hh signalling mechanisms have been extensively studied in the Drosophila wing imaginal disc. The disc is a pseudo‐stratified epithelium divided into a posterior (P) and an anterior (A) compartment, with different cell adhesion affinities. The P compartment cells produce the lipid‐modified Hh molecule, which disperses across the receiving A compartment cells, decreasing in concentration as it spreads away from the A/P compartment border. We have previously demonstrated in the wing disc and abdominal histoblast nest epithelia that cytonemes act as transporters for membrane‐associated Hh to achieve the restricted spatial distribution essential for tissue patterning (Bischoff et al, 2013). The A compartment cells also extend basolateral cytonemes oriented towards the P compartment for Hh reception, contributing as well to the formation of the Hh signal gradient (Gonzalez‐Mendez et al, 2017).
Hh interacts with its receptor complex at cytoneme‐mediated cell–cell contacts (Chen et al, 2017; Gonzalez‐Mendez et al, 2017). The complex includes the Hh canonical receptor Patched (Ptc), a 12‐transmembrane‐domain protein, as well as the adhesion molecules and Hh co‐receptors Interference of Hedgehog (Ihog) and Brother of Ihog (Boi), all localizing to cytonemes (Bilioni et al, 2013; Chen et al, 2017; Gonzalez‐Mendez et al, 2017). In the absence of the ligand Hh, the main receptor Ptc acts as a signal repressor by inhibiting the transducing molecule, the GPCR transmembrane protein Smoothened (Smo), such that the pathway can only be activated after Hh reception (Alcedo et al, 1996; van den Heuvel & Ingham, 1996; Denef et al, 2000). In turn, Ptc is also up‐regulated in a graded manner, being itself a transcriptional target of the Hh pathway (Chen & Struhl, 1996; Briscoe et al, 2001; Torroja et al, 2005). As for the co‐receptors Ihog and Boi (Bilioni et al, 2013), they are found in both Hh‐producing and Hh‐receiving cytonemes, maintaining Hh levels for correct reception (Zheng et al, 2010; Hsia et al, 2017). Other components necessary for Hh reception, including Dispatched (Disp) (Burke et al, 1999; Ma et al, 2002), the Wif ortholog Shifted (Shf) (Glise et al, 2005; Gorfinkiel et al, 2005), and the glypicans Dally‐like (Dlp) (Desbordes & Sanson, 2003; Lum et al, 2003a) and Dally (Takeo et al, 2005), are all localized in cytonemes (Callejo et al, 2011; Bilioni et al, 2013; Gonzalez‐Mendez et al, 2017). The finding of discrete contact places where components needed for Hh signalling colocalize suggests a contact‐dependent mechanism for Hh reception. In this mechanism, receptor, co‐receptors and ligand are present in close proximity in a dynamic manner, as previously described for synaptic‐like processes (Huang et al, 2019).
A key feature of the synaptic signal transfer is the discrete localization of both presenting and receiving elements at either side of the contacting cytonemes. Vesicle trafficking is crucial for this focal localization, and it includes the machineries needed for vesicle formation, translocation and fusion with target membranes. In fact, a multivesicular body (MVB)‐mediated recycling process to direct the ligand Hh towards its basolateral secretion has been described in the Drosophila wing disc (Callejo et al, 2011; Bilioni et al, 2013; Gradilla et al, 2014). In addition, biochemical and functional characterization of Hh and Sonic Hh (Shh) vesicles has identified them as extracellular (EVs) (Fleury et al, 2014; Gradilla et al, 2014; Matusek et al, 2014; Vyas et al, 2014; Parchure et al, 2015; Coulter et al, 2018). Indeed, basolateral EVs containing both Hh and co‐receptor Ihog are transported via cytonemes in an anterograde direction towards Hh‐receiving cells in Drosophila (Gradilla et al, 2014); similarly, vesicles containing the vertebrate Shh are also transported along filopodia‐like structures in the chicken limb bud (Sanders et al, 2013).
To date, the mechanisms driving the polarized transport and location at cytonemes of the Hh‐receptor Ptc remain unidentified. Here, we find that several members of the SNARE protein complex mediate Ptc final presentation at basolateral membranes and cytoneme contacts in the wing disc. In addition, we describe a preceding vesicular sorting to polarize Ptc to reach cytonemes that requires the ESCRT machinery. We found that this complex, known for its function in multivesicular bodies (MVBs) generation (reviewed in Babst, 2011), transports Ptc to cytonemes in a manner different to that regulating Ptc/Hh lysosomal degradation after reception. In vivo imaging of these Ptc‐loaded dynamic vesicles in the abdominal histoblasts confirmed the inclusion of MVB markers and revealed an extracellular vesicle (EVs) signature, coinciding with our findings of Ptc presence in EVs secreted by wing disc cells in culture. Loss of function of several ESCRT and SNARE proteins results in Ptc retention in vesicular sorting compartments as well as Hh reception impairment. These data uncover the role of these proteins in Ptc inclusion in MVBs for polarized sorting of Ptc and its final extracellular exposure at cytoneme membranes.
Results
Hh reception at cytoneme contacts resembles a synaptic process
Direct contact between Hh‐presenting and Hh‐receiving cytonemes at specific sites along their membranes has been revealed using the GRASP technique (Chen et al, 2017; Gonzalez‐Mendez et al, 2017), initially developed to study neuronal synapses. It labels sites of close cell–cell contacts (20–40 nm, a distance comparable to a synaptic cleft) through complementation of two GFP barrels tagged to membrane proteins (Feinberg et al, 2008). Both Ptc and Hh colocalize at fluorescent GRASP sites along cytonemes, indicating potential specific cell–cell membrane contact sites between producer and receptor cells for Hh reception (Gonzalez‐Mendez et al, 2017). Thus, Hh reception can be envisioned as a synaptic‐like process reviewed in Gonzalez‐Mendez et al (2019) and we set out to further investigate the mechanisms for Ptc localization and Hh reception at these cytoneme contacts.
Rapid signal transfer at neuronal synapses is partly mediated by the vesicle fusion proteins SNARE, which form different complexes together with diverse attachment and targeting proteins (reviewed in Wang et al, 2017). Two functionally interchangeable Syb homologs are encoded in Drosophila (Bhattacharya et al, 2002), one neuron specific (nSyb) (DiAntonio et al, 1993; Bhattacharya et al, 2002) and another one, epithelial Syb, more broadly expressed. In active synaptic contacts, nSyb is a major component of synaptic vesicles, facilitating membrane fusion for the release of proteins in a zipper manner with t‐SNARE proteins at target membranes (reviewed in Sudhof, 2013). Interestingly, colocalization of Ptc with a tagged version of nSyb (nSyb‐GFP) is observed in discrete punctae distributed along the apico‐basal axis of the wing disc epithelium and at cytonemes emanating from Hh‐receiving cells (Fig 1A). Similarly, the calcium sensor Synaptotagmin 1 (Syt1‐GFP) colocalizes with Ptc in lateral punctae and can be visualized at Hh‐receiving cytonemes (Fig 1B), indicating a synaptic‐like process for Hh reception.
Figure 1. The SNARE proteins Synaptobrevin (Syb) and Synaptotagmin (Syt1) are located at receiving cytonemes.
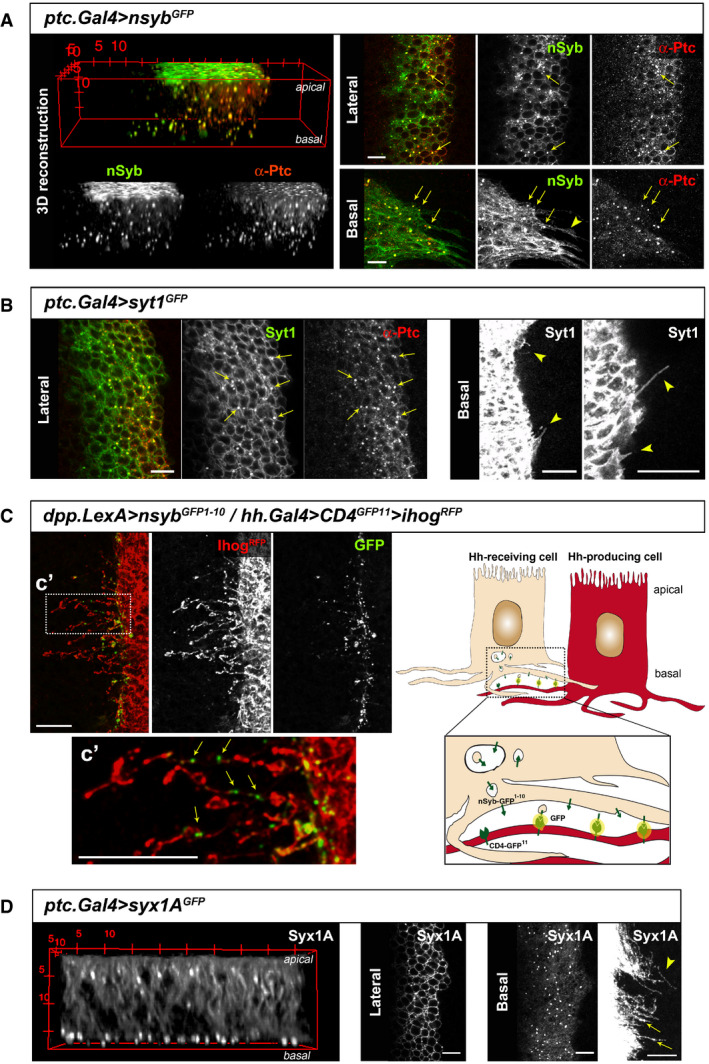
- GFP‐tagged Syb protein expressed in Hh‐receiving cells colocalizes with endogenous immuno‐labelled Ptc along the apico‐basal axis (3D reconstruction). Vesicles containing Syb and Ptc are visualized at lateral and basal confocal sections (arrows) and can be detected along cytonemes marked with Syb‐GFP (arrowhead).
- Expression of the GFP‐tagged Syt1 also colocalizes with immuno‐labelled endogenous Ptc at vesicles (lateral confocal section, arrows point at vesicles with colocalization) and decorates the cytoneme membranes (basal confocal section, arrowheads indicate cytonemes).
- GRASP experiment shows exocytic events in Hh‐receiving cells at basal membrane contacts. Hh‐receiving cells express the GFP barrel 1–10 tagged to Syb and Hh‐producing cells express the complementary GFP barrel 11 tagged to the membrane protein CD4. C′ Inset from C, note the fluorescent discrete punctae (arrows) along Hh‐producing cells cytonemes (stabilized with Ihog‐RFP) crossing the reception area. Scheme to the right depicts GRASP experiment.
- Expression in receiving cells of the Syb functional partner Syx1A tagged to GFP. Note a strong localization in clusters close to the basal membrane in the 3D reconstruction (left panel) and in confocal lateral and basal confocal sections, including cytonemes (right panels, arrows and arrowhead indicate vesicle‐like structures along cytonemes).
Thus, to confirm that exocytosis occurs in close contact to the basal membranes of Hh‐receiving cells, as it should in a synaptic scenario, we performed the GRASP experiment using the neuronal Synaptobrevin (nSyb). Through the combined use of the Gal4/UAS and LexA/LexAop systems, we co‐expressed the UAS‐nSyb construct fused to one of the GFP barrels (nSyb‐GFP1–10) (Macpherson et al, 2015) in Hh‐receiving cells and a plasma membrane‐anchored protein fused to the complementary GFP barrel (CD4‐GFP11) in Hh‐producing cells. We observed discrete GFP‐positive dots along Hh‐sending cytonemes stabilized by Ihog‐RFP expression (Fig 1C), as well as colocalizing with endogenous Ptc (Appendix Fig S1). This result indicates that exocytosis of Ptc‐including nSyb vesicles occurs at discrete contact sites between receiving and sending cytonemes. In accordance, expression of a tagged version of the Syb functional direct partner, the t‐SNARE Syx1A, also localizes to discrete dots at Hh‐receiving basal plasma membranes and along receiving cytonemes and shows a basally polarized complex for vesicle fusion (Fig 1D). Altogether, these data suggest a synaptic‐like process for Hh reception at basal receiving cytonemes.
SNARE complex function in Ptc vesicle fusion
Since the SNARE proteins Syb, Syt1 and Syx1A colocalize with Ptc and this complex can function on recycling as well as positioning of receptors at plasma membrane (reviewed in Bin et al, 2018), we explored the SNARE complex involvement in Ptc presentation in the wing disc epithelium by knocking down SNARE components and analysing the effect in the localization of endogenous Ptc.
Ptc sorting for a basal presentation was suggested after blocking vesicle fusion by epithelial Syb down‐regulation in the dorsal compartment of the wing disc; as it resulted in acute basal accumulation of endogenous Ptc (Fig 2A top panel‐dorsal and 2B′) compared to the very low basal levels in the ventral wild‐type cells (Fig 2A control and 2B) which in turn are due to Ptc rapid endocytosis after normal Hh reception (Lu et al, 2006). Similar, although more discrete, basal accumulation of Ptc was also observed after down‐regulation of the calcium sensor Syt1 (Fig 2A lower panel).
Figure 2. Polarized Ptc vesicle fusion to basolateral membranes is SNARE complex dependent.
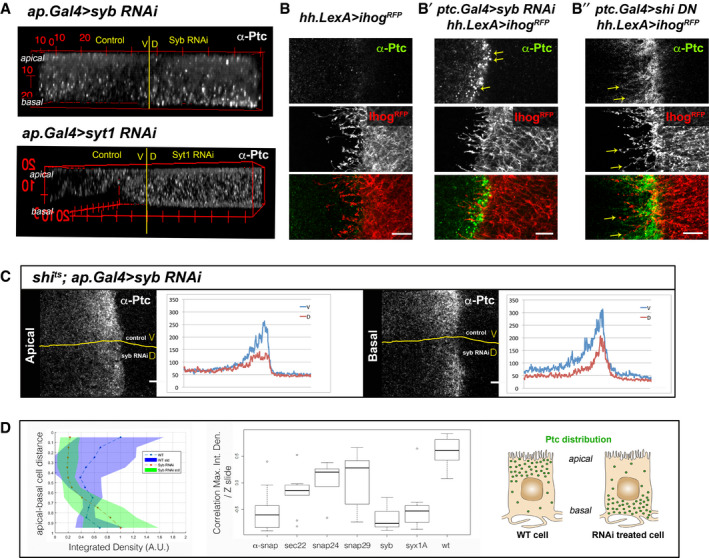
- Ptc protein distribution in a wing disc (3D reconstitution) under down‐regulation of the SNARE proteins Syb and Syt1 in the dorsal compartment (D), keeping the ventral compartment (V) as a WT internal control. Note the basal accumulation of endogenous Ptc when knocking down Syb or Syt1.
- Confocal images of immuno‐labelled endogenous Ptc and cytonemes stabilized with Ihog‐RFP protruding from Hh‐producing cells in wild‐type receiving cells (left panel), or B′) when either blocking exocytosis by down‐regulating Syb (middle panel) or B″) blocking endocytosis by expressing a dominant negative form of the Drosophila Dynamin, Shibire (right panel) in the Hh‐receiving cells. Endogenous Ptc in wild‐type conditions cannot be visualized due to its rapid internalization and processing after Hh reception; while blocking exocytosis causes an accumulation of basal Ptc in intracellular punctae (arrows), and endocytosis inhibition leads to Ptc accumulation at the plasma membrane (arrows).
- Confocal apical (left) and basal (right) images of a shi ts mutant wing disc‐expressing Syb RNAi dorsally (D) to also block exocytosis, keeping the ventral compartment (V) as an internal control where just endocytosis is inhibited. After dorsal Syb RNAi induction, endocytosis was inhibited in the whole shi ts disc by incubation at restrictive temperature. Note, the dorsal reduction of Ptc at plasma membrane after blocking exocytosis.
- Quantification of Ptc‐GFP levels (Yac construct) along the wing disc apico‐basal axis, integrating both fluorescence intensity and signal area (Integrated Density). The graph on the left shows values for wild‐type situations in purple (average in blue), while Syb RNAi treatment values are shown in green (average in orange). Note, a clear shift of higher values towards the basal side of the discs after inhibition of Syb function. The graph to the right shows correlation coefficients between the maximum Ptc value and distance from the basal side (−1 = basal, +1 = apical) of discs after RNAi expression for different SNARE proteins and the wild type. Central horizontal lines show median values of N = 7–16, box shows lower and upper quartiles, and the whiskers show the maximum and minimum excluding outliers. A basal association is particularly noticeable for Syb, Syx1A and α‐Snap down‐regulation. Right panel is a scheme illustrating the wild type and RNAi‐treated patterns of quantified Ptc‐GFP levels distribution along the wing disc apico‐basal axis.
This basal accumulation appears in large vesicle‐like punctae in a fairly restricted area (Fig 2B′). Syb inhibition might be blocking the exocytic process for Ptc membrane deposition and exposure for Hh reception as Syb mutant phenotype is different to the one observed when blocking endocytosis. After inhibiting the rapid endocytosis of Ptc by expressing a dominant negative form of dynamin (UAS‐shiK44A), Ptc accumulates in apical and basolateral plasma membranes including cytonemes through the whole receiving territory (Fig 2B″, yellow arrows).
We next tested Ptc localization after dorsal compartment expression of the Syb RNAi in a shi −/− (shi ts1 ) mutant background, where endocytosis is also being blocked. In this experiment, the ventral side of the wing disc is kept as control for Syb RNAi expression. Under Syb and shi down‐regulation conditions, Ptc accumulation at membranes was reduced despite blocking internalization (Fig 2C). Furthermore, this reduction is much greater at the basal membrane (Fig 2C right panel), strongly suggesting that Syb mediates Ptc presentation at basolateral plasma membranes and that in its absence Ptc appears to aberrantly accumulate intracellularly.
To further test the putative SNARE‐dependent vesicle fusion for Ptc exocytosis/deposition at the plasma membrane, we quantified Ptc levels along the apical/basal axis using a GFP‐tagged Yac insertion and an Integrated Density parameter. This parameter allows numerical translation and localization of the Ptc buildup phenotype in a systematic manner (see Materials and Methods). This confirmed again a basolateral shift of the highest levels of Ptc when Syb function is inhibited (Fig 2D). In agreement with our hypothesis for Syb function, induction of the RNAi for α‐Snap (AKA SnapII), which controls disassembly of the SNARE complex after fusion to plasma membranes (revised in Sudhof, 2004), showed high levels of Ptc being present at the basal side of the epithelium (Fig 2D). However, inhibition of other SNAREs (Sec22, Snap24 and Snap29), reported as vesicle fusion regulators in different organelles such as the endoplasmic reticulum or Golgi (revised in Littleton, 2000; Wang et al, 2017), showed more variability within each experiment; maximum levels of Ptc were distributed all along the apico/basal axis, probably as a result of vesicle fusion blockage at different stages of Ptc vesicle trafficking (Fig 2D, Appendix Fig S2).
ESCRT machinery requirement for MVB‐mediated Ptc trafficking
To characterize the Ptc punctate structures that traffic towards the basal side of the wing disc, we performed immuno‐electron microscopy imaging of anterior cells expressing Ptc‐GFP with an α‐GFP antibody. Interestingly, we observed Ptc signal at the apical membrane (Fig 3A,a), while intracellular Ptc was found in MVBs, subapically but also close to the basal membrane (Fig 3A,a,b,c). Furthermore, analysis of EM images suggests the presence of two polarized MVB types that show differences in density and structure. Denser MVBs are mainly located basally and include a greater number of Ptc positive intraluminal vesicles (ILV) (Fig 3A,c1), while subapical MVBs tend to be less dense with more Ptc on the outer MVB membrane (Fig 3A,b1); these denser endosomes might be the ones involved in the polarization of Ptc.
Figure 3. Patched traffics from the apical to the basal side of the wing disc through Multivesicular Bodies.
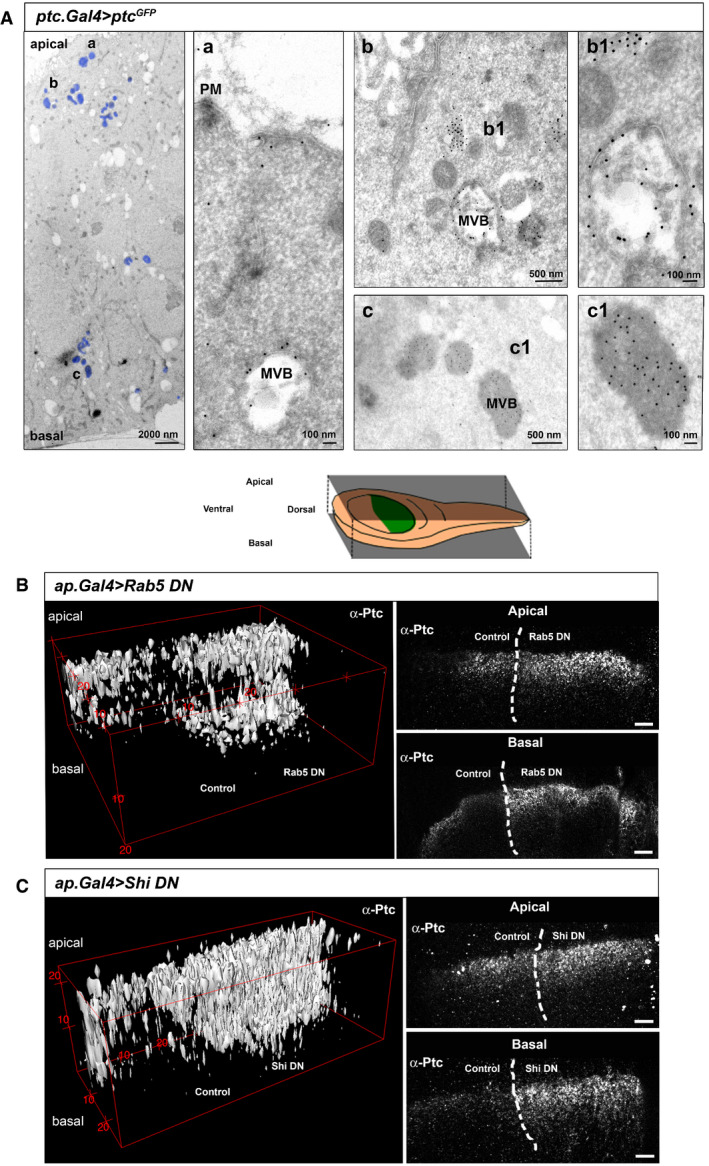
- Electron microscopy imaging of wing discs expressing the UAS‐Ptc‐GFP construct for 24 h in receiving cells using Ptc‐Gal4; TubGal80ts. Left panel shows areas with anti‐GFP immuno‐labelling (marked in blue) throughout the apico/basal axis of the wing disc epithelium (a) anti‐GFP gold labelling corresponding to Ptc is located on the apical membrane and early endosomes towards MVB formation. (b) Ptc immunogold labelling is present in multivesicular bodies (MVBs) subapically (top right panels). b1) Note that subapical MVBs appear as less dense with greater Ptc labelling on the MVB outer membranes. (c) Ptc label is also present in MVBs close to the basal membrane (lower right panels), (c1) Note that basolateral Ptc MVBs are significantly denser and richer in Ptc positive intraluminal vesicles (ILV).
- Endogenous Ptc subcellular localization after endocytosis inhibition by the dorsal expression of a dominant negative form of Rab5. The top panel is a schematic representation of the localized expression. The left panel is a digital 3D reconstruction and the right panel shows an apical and basal confocal sections. Note that accumulation of Ptc occurs at both the apical and basal sides of the dorsal part of the disc, compared to the wild‐type control on the ventral side.
- Digital 3D reconstruction (left) and apical and basal confocal sections (right) of endogenous Ptc localization after endocytosis inhibition by the dorsal expression of a dominant negative form of shibire (Shi DN). Note the same apical and basal accumulation as after expression of Rab5DN, and comparing to the ventral wild‐type half.
We have previously described that after inhibition of endocytosis through expression of the dominant negative form of Shi (ShiK44A) there was a basolateral as well as an apical retention of Ptc (Fig 3C; Callejo et al, 2011), which also happened after expression of the dominant negative form of Rab5 (Fig 3B). The apical internalization of Ptc seems to be independent from reception because it has been described that Hh reception occurs at the basolateral membrane (Callejo et al, 2011; Chen et al, 2017; Gonzalez‐Mendez et al, 2017). Thus, this apical endocytosis could initiate the charging of Ptc in MVB to later redirect Ptc towards the basolateral side of the epithelium.
The ESCRT machinery is largely involved in the formation of MVBs for extracellular vesicle biogenesis, polarized cell localization and degradation by lysosomes (reviewed in Babst, 2011). Knocking down the ESCRT components Hrs, Tsg101, Vps22 and Shrub gave rise to abnormal accumulation of Ptc in punctate structures. These aberrant structures are positive for endosomal markers such as Rab4, Rab5 and Rab7 (Fig EV1), indicating that the treatment results in a general blockage of the vesicle progression. Thus, when inhibiting ESCRT‐0 Hrs, the first protein to initiate MVB formation at the endocytic compartment, Ptc accumulates mainly at this subapical compartment, probably due to a buildup of aberrant initiating MVBs. In the case of subsequent ESCRT‐I TSG101, ESCRT‐II Vps22 and ESCRT‐III Shrub, needed later in MVB formation, the Ptc accumulation tends to shift towards the basal side of the epithelium, suggesting an abnormal MVBs traffic towards basolateral (Fig 4A). Quantification of Ptc levels after inhibition of the ESCRT components confirmed the shift of Ptc higher levels towards the basolateral side of the epithelium (Fig EV2A).
Figure EV1. Immunohistochemistry for endosomal markers in ESCRT mutant conditions.

- Images of apical confocal sections of wing discs expressing RNAi against Hrs and immuno‐labelled for the endosomal markers Rab5, Rab4 and Rab7 (in green) as well as for the endogenous Ptc (in red). Note that large apical accumulative Ptc punctae positively colocalize with the endosomal markers, especially in the case of Rab 4 (early and recycling endosomes).
- Images of a basal confocal sections of wing discs expressing RNAi against Tsg101 and immuno‐labelled for the endosomal markers Rab5, Rab4 and Rab7 (in green) as well as for the endogenous Ptc (in red). Note that large basal accumulative Ptc punctae also positively colocalize with the endosomal markers, especially in the case of Rab 7 (late endosomes). The confocal sections for maximal colocalization have been chosen, apical for HRS and basal for Tsg101.
Figure 4. Basal polarization of the Ptc receptor through MVB requires the ESCRT complex.
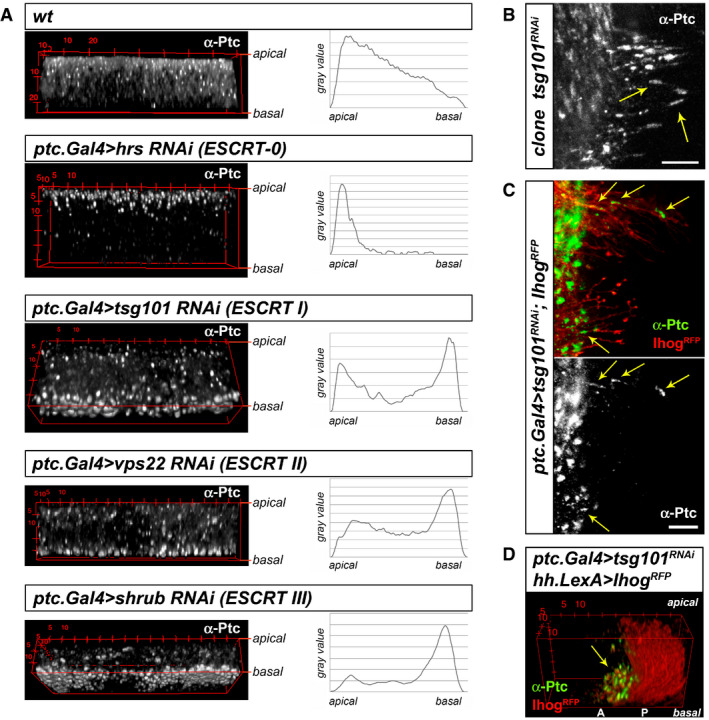
- 3D reconstructions of immuno‐labelled endogenous Ptc of wing discs in wild‐type condition and after RNAi expression for different ESCRT complex components. All RNAis’ expression result in Ptc accumulation in large structures, located apically under Hrs (ESCRT‐0 component) inhibition, and basally under inhibition of the ESCRT components I (Tsg101), II (Vps22) and III (Shrub). Graphs depicting signal values from apical to basal show a shift of higher intensity curves either towards acute apical or basal accumulation.
- Detailed confocal imaging of immuno‐labelled endogenous Ptc localization after clonal Tsg101 down‐regulation. The image shows abnormal accumulation of Ptc clusters in basal cytonemes emanating from receiving cells (arrows), since in wild‐type conditions Ptc visualization at basal membranes is not possible due to its rapid internalization and processing after Hh reception (see Fig 2B).
- Ptc accumulation in these punctated structures (arrows) is also visualized on receiving cytonemes stabilized with the co‐receptor Ihog‐RFP and after Tsg101 inhibition.
- 3D reconstruction of Hh‐producing cytoneme network stabilized by Ihog‐RFP shows that Ptc accumulation after Tsg101 treatment localizes above the signal sending cytoneme extensions (arrow).
Figure EV2. Apico‐basal analysis of Ptc accumulation under ESCRT mutant conditions.

- Correlation coefficients between the maximum value of quantified integrated density (integrating both fluorescence intensity and signal area) for Ptc‐GFP values (Yac construct) and distance from the basal side (−1 = basal, +1 = apical). Box plot shows quantification data of discs under RNAi expression for different ESCRT proteins and wild‐type condition. Central horizontal lines show median values of N = 7–8, box shows lower and upper quartiles and the whiskers show the maximum and minimum excluding outliers. Apical association was found for the case of ESCRT 0 Hrs silencing, while basal association is particularly marked for Tsg101 and Vps4 down‐regulation. Scheme on the right represents the wild‐type and RNAi‐treated conditions for Ptc distribution.
- 3D reconstruction of confocal Z‐stacks showing clones expressing RNAi against the ESCRT proteins Tsg101, Shrub and Vps4 and marked by nuclear GFP signal. Immuno‐labelling for endogenous Ptc reveals a shift of Ptc accumulation towards the basal side of the epithelium within the mutant clone and in comparison to surrounding cells in wild‐type condition. In the case of Shrub down‐regulated clones, the retained Ptc can even be observed in basal cytonemes (right panel) where normally it would be rapidly internalized and processed after Hh reception.
In addition, in large clones expressing Tsg101 RNAi, Ptc accumulates basally in large structures (potentially late endosomes or MVBs) (Fig 4B), and on receiving cytonemes stabilized by also expressing Ihog‐RFP in the A compartment (Fig 4C). In normal conditions, Ptc is not visible at cytonemes due to its rapid turnover at the plasma membrane (Lu et al, 2006) (also see Fig 2B). Ptc accumulation in Hh‐presenting cytonemes is also evident at overlapping receiving regions (Fig 4D). Finally, abnormal basal accumulation is again patent in clones expressing RNAis for other ESCRT components (marked in green in Fig EV2B), compared with the surrounding wild‐type cells.
Ptc protein association with vesicle‐sorting proteins (ESCRT, SNARE and Rabs) was further verified by a mass spectrometry‐based interactome study (Appendix Fig S3). These results reinforce the existence of a sorting mechanism to polarize Ptc to the basolateral side, in a cellular process that is remarkably similar to that proposed for Hh polarization in the producing cells (Gradilla et al, 2014).
Ptc vesicles are enriched in tetraspanin and targeted to EVs in vitro
Studies in mammalian cells in culture have detected the presence of the tetraspanins (Tsps) CD63, CD9 and CD81 as a signature of MVB formation for extracellular‐targeted vesicles, either for their release or for their deposition at the plasma membrane (Andreu & Yanez‐Mo, 2014; Verweij et al, 2018). Accordingly, we next investigated the possible role of their Drosophila orthologs to test Ptc inclusion in MVBs for externalization.
In both wing disc and abdominal histoblast nests, we observed a colocalization of Ptc at discrete punctae from the apical to the basolateral side and on cytonemes with either the mammalian CD63‐GFP (Fig 5A and B) or two different tagged versions of the Drosophila Tsp96F (orthologous to CD9 and CD81), Tsp96F‐RFP and Tsp96F‐HA (Fig 5C, D and G). In the abdominal histoblasts, punctae containing Ptc‐GFP and CD63‐Cherry can be visualized in vivo moving along cytonemes (Fig 5B, Movie EV1). Particles containing the tetraspanin TSP96F also decorate receiving cytonemes in the wing disc cells (Fig 5E and G) and in the abdominal histoblasts, where in vivo imaging shows their movement along cytonemes (Fig 5F, Movie EV2). In addition, co‐immunoprecipitation experiments using protein samples from third‐instar larvae, ubiquitously co‐expressing Ptc‐GFP and Tsp96F‐HA, confirmed the presence of Ptc in the Tsp96F‐enriched vesicles (Fig 5H and Appendix Fig S4).
Figure 5. Ptc basal vesicles are enriched with extracellular vesicle markers.
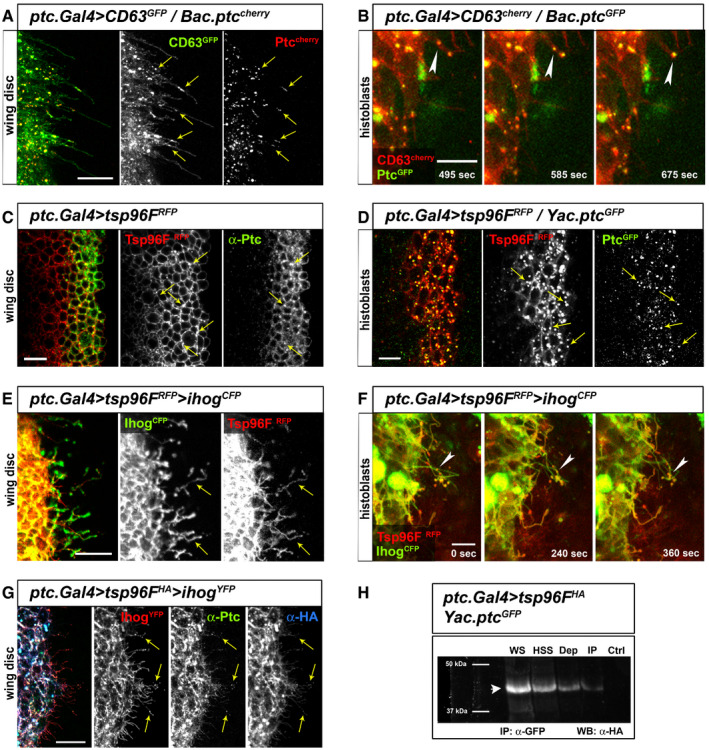
- Confocal image of wing disc expressing the human tetraspanin CD63‐GFP expressed in the Hh‐receiving cells colocalizing with Ptc (Bac.Ptc‐cherry) in vesicle‐like structures (yellow arrows) along basal cytonemes.
- In vivo confocal frames of abdominal histoblasts showing colocalization of CD63‐Cherry and Ptc (Yac.Ptc‐GFP) at punctae moving in anterograde direction along cytonemes (white arrowheads show trajectory in time‐lapse frames).
- Lateral confocal section of wing disc showing endogenous Ptc colocalizing with the Drosophila tetraspanin Tsp96F‐RFP (orthologous to the mammalian tetraspanin CD9/CD81) (yellow arrows indicate colocalization in punctate structures).
- Basolateral in vivo imaging of abdominal histoblasts expressing Tsp96F‐RFP in the Hh‐receiving cells shows colocalization with Ptc‐GFP at mobile punctae (yellow arrows).
- Tsp96F‐RFP expressed in wing disc Hh‐receiving cells also shows localization in basal cytonemes stabilized by Ihog‐CFP expression (yellow arrows indicate Tsp96F‐RFP‐positive punctate structures).
- Frames showing in vivo localization of Tsp96‐RFP punctae to cytonemes stabilized with Ihog‐CFP expressed in the abdominal histoblasts Hh‐receiving cells, moving in an anterograde fashion towards the P compartment (white arrowheads show trajectory in time‐lapse frames).
- Confocal imaging of receiving cells expressing the HA tagged Tsp96F construct also shows colocalization with endogenous Ptc at cytonemes (yellow arrows indicate Tsp96F‐HA and Ptc colocalizing punctate structures).
- Western blot against HA‐tag of immuno‐precipitated sample (IP), depleted sample (Dep), high speed sample (HSS) whole sample and control sample from a co‐immunoprecipitation experiment isolating GFP of Tsp96F‐HA‐ and Ptc‐GFP‐expressing larvae or GFP‐ and Tsp96F‐HA‐expressing larvae as negative control. Arrowhead indicates the positive band corresponding to Tsp96F‐HA expected molecular weight (30–40 kDa), present in all samples including the immuno‐precipitated one and not present in the negative control sample.
We next investigated the potential effect of Tsp96F, Tsp42E and Tsp47F down or up‐regulation. These mutant conditions resulted in a minor accumulative effect on Ptc (Appendix Fig S5), probably because of the long half‐life and functional redundancy of tetraspanins (Hemler, 2005; Andreu & Yanez‐Mo, 2014). However, over‐expression of Tsp96F‐HA in dorsal compartment cells revealed accumulation of Ptc in large punctate structures mostly in basal regions, compared to the ventral compartment wild‐type cells (Fig 6A); this effect has been corroborated following quantification of Ptc‐GFP (Yac) levels in the apico/basal axis of receiving cells (Appendix Fig S5B). These punctate structures accumulate Ptc and Tsp96F (Fig 6B). Accordingly, immune EM of receiving cells over‐expressing Ptc‐GFP and Tsp96F‐HA evidenced the presence of large clusters of MVBs containing Ptc‐GFP (Fig 6C). These data suggest that the excess of Tsp96F‐HA retains Ptc in MVBs targeted towards basal plasma membrane.
Figure 6. Excess of HA‐tagged Tsp96F blocks Ptc MVBs polarized exocytosis.

- 3D reconstruction of wing disc immuno‐labelled for endogenous Ptc and dorsally over‐expressing the Tsp96F‐HA construct, keeping the ventral side of the disc in wild‐type condition as internal control (V). Note the dorsal accumulation of Ptc in very large punctae across the apico‐basal axis (D), but mainly at the basal side of the epithelium. Lower panels represent fluorescence values from apical to basal, comparing dorsal and ventral sides and showing a shift of the highest values towards the basal side after Tsp96‐HA expression.
- Confocal image of a wing disc with a clone‐expressing Tsp96F‐HA and immuno‐labelled with anti‐Ptc and anti‐HA antibodies, which colocalize in the large basolateral punctae (yellow arrows).
- Electron microscopy image from immuno‐labelled (anti‐GFP) Hh‐receiving cells of a wing disc‐expressing Ptc‐GFP and Tsp96F‐HA. The detailed image shows large sac structures that accumulate several dense MVBs positive labelled for Ptc.
Since the colocalization of Ptc and Tsps is also a sign of extracellular‐targeted vesicles (Andreu & Yanez‐Mo, 2014), we next analysed if Ptc could be present in EVs from Drosophila cultures of embryonic hemocyte‐like S2R+ cells (Yanagawa et al, 1998) and of wing disc Cl8 cells (Peel et al, 1990). Ptc was found secreted by Cl8 cells, mainly associated with small EVs (sEVs) enriched in bona fide EVs proteins, such as the small GTPase Rab8, Syntaxin 1A (Syx1A), the tetraspanin Late bloomer (Lbm) and Hsp70 (Fig 7A and B). However, Ptc is not secreted in Drosophila embryonic hemocyte‐like S2R+ cells despite being present in these cells (Fig 7A), suggesting that vesicular Ptc secretion might be cell specific. The characterization of the sEVs by isopycnic density gradients showed co‐fractionation with the EV markes Synt1, Lbm and Hsp70 as well as with Ptc, in a fraction with a density of 1.15 g/ml (Fig 7C). On the other hand, EVs were analysed by size exclusion chromatography—SEC, showing again co‐fractionation of Ptc with Lbm, Hsp70 and also with the Hh co‐receptor Ihog (Fig 7D). Interestingly, we had previously found co‐fractionation of Hh and Ihog in the same exosomal fraction from Drosophila wing disc culture cells (Gradilla et al, 2014), supporting the notion that Ptc is secreted in extracellular vesicles.
Figure 7. Ptc is secreted in extracellular vesicles from wing disc cultured cells.

- Ptc is mainly secreted in small EVs (P100K) from Cl8 cells.
- Large EVs (lEVs), small EVs (sEVs) and very small EVs (vsEVs) were analysed in triplicate by Western blotting. Note that sEVs are enriched in Ptc and in the EV‐associated proteins Syntaxin1 (Synt1A), Late bloomer (Lbm) and Hsp70.
- Fractionation of sEVs by Sucrose Density Gradient: Ptc partially co‐fractioned with Synt1A, Lbm and Hsp70. Note that while unprocessed form of co‐receptor Ihog does not co‐fraction with Ptc, the processed form does in the same subpopulation.
- Fractionation of sEVs by size exclusion chromatography: Ptc perfectly co‐fractioned with Synt1A, Lbm and Hsp70. In agreement with the density gradient analysis, unprocessed form of co‐receptor Ihog does not co‐fraction with Ptc in the same subpopulation of sEVs.
- Effect on EV‐associated Ptc secretion after gene silencing on Cl8 cells by dsRNAs against the SNARE proteins Syb and α‐Snap, the tetraspanin Tsp96F and the ESCRT components Hrs, Tsg101, Shrub and Vps4. Hsp70 in cells and EVs is detected by different exposition time.
Source data are available online for this figure.
These results demonstrate that not only Ptc but also other proteins implicated in Hh reception can be found in the in vitro obtained sEVs. Furthermore, immuno‐blots for Ptc after inhibition of either SNARE proteins (Syb and α‐Snap) or ESCRT components (Hrs, Tsg101 and Vps4), as well as the tetraspanin Tsp96F, showed a significant signal reduction in the secretion of EVs populations, compared to controls obtained from non‐transfected cells, or cells transfected to express GFP or LacZ (Fig 7E). Thus, in a non‐tissue context the generation of EVs loaded with Ptc is also dependent on MVB formation as a result of the conserved intracellular machinery necessary for the inclusion of Ptc in MVBs.
MVB‐mediated basal externalization of Ptc for Hh reception
Next, we reasoned that if Ptc would not be exposed at basal membranes then Hh internalization in the receiving cells should be affected. Since inhibition of Syb, α‐Snap, Syx 1A, Hrs and Vps4 or ectopic expression of the Tsp96F‐HA result on Ptc not being exposed for Hh reception, we used these mutant conditions to quantify the colocalization of red fluorescence from a Bac.ptc‐cherry and green fluorescence from the Bac.hh‐GFP (Chen et al, 2017). There is a significant reduction of Hh/Ptc colocalization at the basal side of receiving cells compared to wild type (Fig 8A, see Appendix Fig S6 for quantifications at lateral sections of receiving cells). In accordance, no significant differences were found apicaly between the wild type tissue and the results of transient RNAi expression (P values > 0.5) (Fig 8B).
Figure 8. ESCRT machinery and SNARE‐mediated exocytosis are required for Ptc exposure at basal membrane.

- Projection images of three confocal sections (1 μm) at the basal side of wing discs expressing the Bac constructs for Hh‐GFP and Ptc‐cherry, used to analyse colocalization between the ligand and the receptor in wild‐type conditions and after inhibition of vesicle fusion (Syb RNAi), vesicle trafficking (Hrs RNAi) or Ptc protein degradation (Dor RNAi). Boxplot shows colocalization rates using the Manders coefficient for proportion of red covered by green in projected images for wing discs temporally expressing RNAi against ESCRT proteins Hrs and Vps4, SNAREs Syb and α‐Snap, and Dor as control for effects after Ptc degradation‐blocking, as well as temporally over‐expressing the Tsp96F‐HA. Central horizontal lines show median values of N = 8–12 (see Appendix Table S2), box shows lower and upper quartiles and the whiskers show the maximum and minimum excluding outliers. Note the significant reduction in colocalization rates (1 = total coverage of red by green) after RNAi expression for both ESCRT and SNARE proteins as well as after Tsp96F‐HA over‐expression, while RNAi expression for Dor presents greater colocalization. Significance levels for pairwise test (Wilcoxon) ***P < 0.001, **P < 0.01, *P < 0.05.
- Projection images of three confocal sections (1 μm) from the apical side of the wing discs. Quantification of colocalization rates as in (A) but using apical projection images; central horizontal lines show median values of N = 8–12 (see Appendix Table S2), box shows lower and upper quartiles and the whiskers show the maximum and minimum excluding outliers. Note that at the apical side no clear significant reduction in colocalization rates (1 = total coverage of red by green) is observed after RNAi expression or in Tsp96F‐HA over‐expression. Significance levels for pairwise test (Wilcoxon) ***P < 0.001, **P < 0.01, *P < 0.05, + P < 0.1.
- Correlation coefficients between the maximum value of quantified integrated density (integrating both fluorescence intensity and signal area) for Ptc‐GFP values (Yac construct) and distance from the basal side (−1 = basal, +1 = apical). Box plot shows quantification data of discs after RNAi expression for the vacuole‐sorting protein Dor (necessary for Ptc degradation), the ESCRT Hrs, the SNARE Syb as well as after over‐expression of the Tsp96F‐HA construct and wild‐type condition. Central horizontal lines show median values of N = 8–12, box shows lower and upper quartiles and the whiskers show the maximum and minimum excluding outliers. Note the apical localization of Ptc‐GFP highest values after degradation impairment (Dor RNAi) in contrast to the basal shift resulting from exocytosis deficiency (Syb RNAi).
Additionally, to compare the exocytic hampering phenotype with the effects of Ptc degradation impairment, we carried out the same colocalization analysis for the vacuole‐sorting protein Dor, essential for lysosome‐mediated degradation of the post‐reception Ptc/Hh complex (Sevrioukov et al, 1999; Torroja et al, 2004). Inhibition of dor function showed that Ptc accumulated mainly subapically (Fig 8C) with significantly greater Hh/Ptc colocalization values (Fig 8A and B, and Appendix Fig S6). This Ptc/Hh accumulation differs from the basal Hh‐free Ptc buildup observed after down‐regulation of the ESCRT and SNARE components (Fig 8A). These data add further evidence of vesicle sorting of Ptc previous to its externalization and Hh reception.
Requirement of the ESCRT and SNARE complexes for Hh gradient formation
Requirement for ESCRT and SNARE components in the recycling and secretion of Hh has been previously described (Gradilla et al, 2014; Matusek et al, 2014; Parchure et al, 2015). Because of that, we first assessed if all the tools used here to downregulate these complexes in the receiving cells were giving the expected shortening of the Hh gradient length when expressed in Hh‐producing cells (Fig EV3). We next checked the Hh signalling activity expressing the same RNAis in receiving cells. We analysed the expression of Collier (Col), a transcriptional Hh pathway target of intermediate threshold, after either transiently silencing ESCRT or SNARE components or by the transient expression of the Tsp96F‐HA construct. As shown in Fig 9A, Col expression quantification showed a slight but significant increase in the width of Col signal in most mutant conditions; this is probably due to Ptc presentation impairment, which should allow Hh to travel further into the A compartment. Moreover, when we checked signalling activity for the high threshold Hh target Engrailed (En), we found a significant reduction after all treatments (Fig 9B). Altogether, these data show an inefficient reception giving rise to an extended and flattened gradient. The same result is obtained after transient expression of the tetanus toxin (TNT, known to block SNARE complex functions) in receiving cells (Fig EV4B). As expected, TNT expression in the Hh‐producing cells retains Hh, shortening the gradient as a consequence (Fig EV4C and D; see also scheme in Fig 10B).
Figure EV3. ESCRT and SNARE deficiency in Hh‐producing cells reduces Hh gradient.
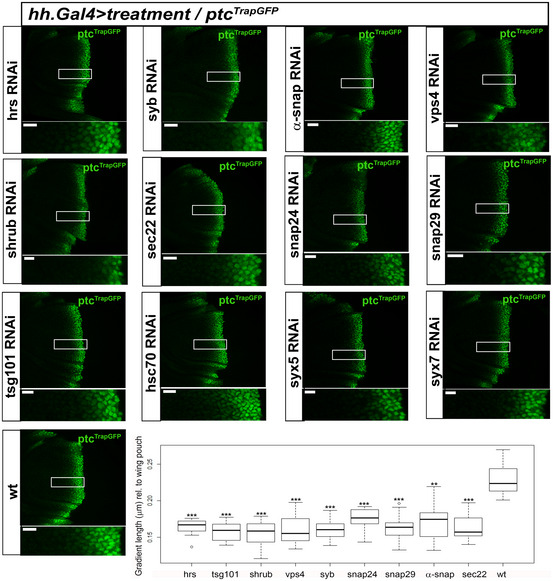
- Confocal lateral images of wing discs carrying a Trap‐GFP insertion within Ptc regulatory sequences, as a fluorescent reporter of Hh signalling activity. Each image shows effects over Hh signalling of several RNAi expressions for ESCRT and SNARE complexes components in Hh‐producing cells. Right bottom panel is a box plot showing quantification of the signal extension (μm) normalized in relation to the wing pouch size; central horizontal lines show median values of N = 9–14 (see Appendix Table S2), boxes show lower and upper quartiles, and whiskers show the maximum and minimum excluding outliers. Note that all treatments significantly reduce signal extension. Significance levels for pairwise test (Wilcoxon) ***P < 0.001, **P < 0.01, *P < 0.05.
Figure 9. Hindering traffic and basal exocytosis of Ptc results in flattening of the Hh signalling gradient.
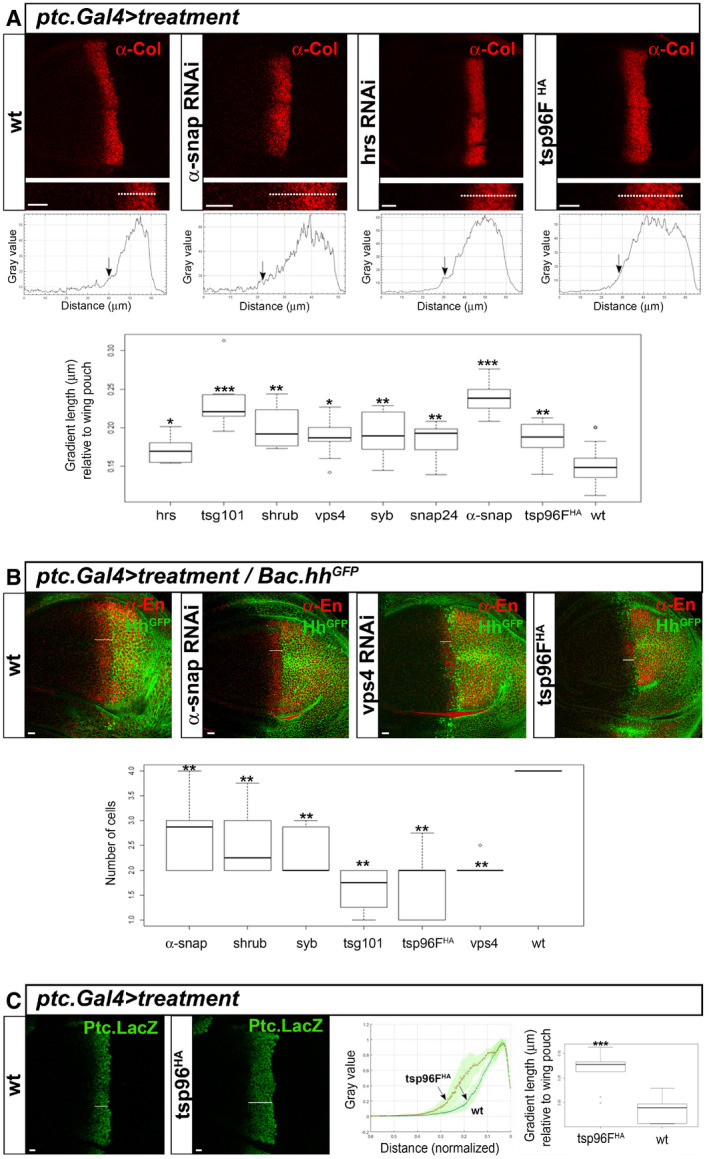
- Confocal images at a lateral section showing the immunostaining of the medium threshold Hh target Collier (Col) of wild‐type wing discs and discs after inhibition of vesicle fusion (α‐Snap‐RNAi), vesicle trafficking (Hrs RNAi) or in over‐expression of the Tsp96F‐HA. Quantification of gradient lengths (μm) using Collier signal and normalized to the wing pouch size, showing the proportion of wing pouch covered by signal (1 = total coverage). Quantification was performed for wild‐type condition as well as in temporally regulated RNAi expression for the ESCRT complex proteins Hrs, Tsg101, Shrub and Vps4 and for the SNARE proteins Syb, Snap24, α‐Snap and in transient over‐expression of the Tsp96F‐HA. Central horizontal lines show median values of N = 7–22 (see Appendix Table S2), box shows lower and upper quartiles and the whiskers show the maximum and minimum excluding outliers. Note a slight but significant increase in the length of Col signal for all treatment compared to the wild‐type condition. Significance levels for pairwise test (Wilcoxon) ***P < 0.001, **P < 0.01, *P < 0.05.
- Lateral confocal images and quantification of immuno‐labelled Engrailed as the high threshold Hh target. Quantification shows number of cell diameters covered by signal from the posterior/anterior border marked by Hh‐GFP (Bac construct); central horizontal lines show median values of N = 6–10 (see Appendix Table S2), box shows lower and upper quartiles and the whiskers show the maximum and minimum excluding outliers. Note a significant reduction after RNAi expression, suggesting Hh reception impairment and flattening of the signal gradient. Significance levels for pairwise test (Wilcoxon) ***P < 0.001, **P < 0.01, *P < 0.05.
- Lateral confocal images and quantification of Ptc transcription as a Hh target through immuno‐labelling of the reporter β‐galactosidase (Ptc‐LacZ). Middle graph shows the extension covered by signal normalized to wing pouch size, in wild‐type condition (N = 6) or after ectopic expression of the Tsp96F‐HA construct (N = 9). Green shaded areas show data variability and dotted line gives the average values. Note the greater distance covered after Tsp96F‐HA transient expression. Boxplot (right) shows distance quantifications with central horizontal lines showing median values of N = 6–9 (see Appendix Table S2), box showing lower and upper quartiles and whiskers showing the maximum and minimum excluding outliers. Note a significant extension under Tsp96F‐HA expression, suggesting again flattening of the signal gradient. Significance levels for pairwise test (Wilcoxon) ***P < 0.001.
Figure EV4. ESCRT and SNARE deficiency in Hh‐receiving versus Hh‐producing cells.

- Clone over‐expressing the Tsp96F‐HA construct, marked with anti‐βgal antibody and immuno‐labelled for endogenous Ptc, white arrowhead indicates the anterior Ptc signal area affected by the clone. Note the slight increase of signal of the Hh target Ptc anterior to the clone (in red rectangle) and compared to a clone‐free area as internal control (blue rectangle). Graph to the right depicts grey values for Ptc signal along the x‐axes, showing the increased signal extension anterior to the clone in red (black arrowhead) compared to the control area in blue.
- Basal confocal image of wing disc expressing Hh‐GFP (Bac construct) and immuno‐labelled for endogenous Ptc when expressing the Tetanus toxin (TNT) to block the SNARE complex in Hh‐receiving cells. Arrowhead indicates basal Ptc accumulated in punctuated structures, while yellow arrow outlines the extended distribution length of both the Hh ligand and Ptc signal activation.
- Lateral and basal (further right) confocal images of wing discs expressing Hh‐GFP (Bac construct) and immuno‐labelled for endogenous Ptc when expressing the Tetanus toxin (TNT) to block the SNARE complex in Hh‐producing cells. Arrowhead indicates basal Hh accumulation, while yellow arrow outlines the reduced distribution length of both the Hh ligand and Ptc signal activation.
- Lateral and basal (further right) confocal images of wing discs expressing Hh‐GFP (Bac construct) and immuno‐labelled for endogenous Ptc in wild‐type conditions. Note shortening of the Ptc gradient and Hh retention in the producing cells when TNT is expressed in Hh‐producing cells versus Ptc gradient extension and greater Hh dispersion when TNT is expressed in Hh‐receiving cells.
Figure 10. Model for Ptc traffic and basal exocytosis.

- We propose a sorting mechanism that redirects Ptc to the basal membrane for its presentation for Hh reception in the cytonemes of receiving cells. In black numbers and arrows we show the vesicle‐sorting route for Ptc presentation at the basal plasma membrane, (1) endocytosis of Ptc from apical membranes, (2) late endosome structures to form MVBs that (3) fuse to the basal plasma membranes exposing Ptc for Hh reception. In red numbers and arrows, we show the parallel vesicle‐sorting route directing Hh/Ptc degradation after (1) reception and (2) endocytosis at basal membranes, towards (3) MVB formation for degradation at lysosomes. This novel mechanism for polarized Ptc trafficking requires components of the ESCRT machinery (MVB‐mediated processes such as recycling), the Tetraspanin proteins (to define MVB and EV membrane domains) and the SNARE proteins (to regulate vesicle fusion). Potential mechanisms for the transport within cytonemes of two vesicle types, for Ptc membrane deposition and post‐reception, are not shown in the model as they are still unexplored.
- Schematic view of the effect over Hh signalling after transient inhibition of the MVB‐mediated recycling and fusion process proposed for Ptc localization at basal membranes. Top panel shows Hh dispersion in a wild‐type situation, while bottom panel shows an extended dispersion after transient conditions that reduce Ptc basal membrane exposure and thus decrease Hh reception, flattening the signalling gradient.
Similar gradient expansion in the transcription of Ptc was observed using a Ptc‐lacZ reporter and over‐expressing the Tsp96F‐HA construct in the receiving cells (Fig 9C). Additionally, Tsp96F‐HA‐expressing clones induced at the A/P compartment of the wing discs showed Ptc activation also in wild‐type cells anterior to the clone (Fig EV4A). This indicates that the non‐sequestered Hh is able to travel through the clone and continue activating the pathway more anteriorly.
Finally, we investigated if the signal expansion after ESCRT and SNARE components down‐regulation could be due to ligand‐independent alterations in Smo trafficking, because it has been described that constitutive activation of the Hh pathway could result from changes in the membrane localization of Smo. However, no changes of endogenous Smo protein were found in most of the mutant conditions used, the only exception being a slight reduction of Smo levels after Syb RNAi expression (Fig EV5). This result indicates that inhibition of Ptc vesicle‐mediated deposition for Hh reception does not affect its function as Smo repressor.
Figure EV5. ESCRT and SNARE RNAi treatments do not alter Smo.

Lateral confocal images of wing discs immuno‐labelled for the Hh signal transduction protein Smoothened (Smo) and dorsally (D) expressing different RNAi treatments for ESCRT and SNARE complexes components, keeping the ventral (V) side in wild‐type condition as an internal control. No apparent change in Smo protein localization is detected between the RNAi‐treated dorsal half and the ventral half control. Bottom panel shows the differential rate between quantifications of fluorescence intensity (Mean grey value) in a defined area shown in the WT image (see also diagram on the right) for both the RNAi‐treated dorsal half and the ventral half wild‐type control. Central horizontal lines show median values of N = 3–16 (see Appendix Table S2), boxes show lower and upper quartiles, and whiskers show the maximum and minimum excluding outliers. Note that all treatments result in no change in fluorescence intensity (1 = equal values in Wilcoxon pairwise test).Source data are available online for this figure.
With all the data presented, we built up a model (Fig 10A) supporting our hypothesis that MVBs are needed for the trafficking of Ptc to basal membrane deposition to receive Hh.
Discussion
It has previously been described that Hh ligand graded distribution and reception take place mediated by cytonemes at the basolateral part of Drosophila epithelia (Callejo et al, 2011; Bilioni et al, 2013; Bischoff et al, 2013; Chen et al, 2017; Gonzalez‐Mendez et al, 2017). The receiving cells also extend cytonemes that interact with the ones carrying Hh at precise contact sites, resembling a synaptic process (Chen et al, 2017; Gonzalez‐Mendez et al, 2017). Here, we present additional evidence for the synaptic‐like nature of cytoneme contact sites since the SNARE protein and synaptic vesicle marker nSyb is present in these sites. Not only nSyb but also other SNARE proteins such as Syx1A and the calcium sensor Syt1 colocalize with the receptor Ptc at receiving basal membranes, suggesting polarized traffic of Ptc exocytic vesicles. Furthermore, the epithelial Syb and other SNARE components seem to have a function in Ptc localized exposure for Hh signalling.
The receptor Ptc has been visualized along cytonemes together with Hh (Chen et al, 2017; Gonzalez‐Mendez et al, 2017), most probably in post‐reception endocytic vesicles. However, while we had established the process followed by Hh to attain basolateral localization at producing cells (Callejo et al, 2011; Gradilla et al, 2014), little is known about how the receptor Ptc reaches this basal location. We propose the existence of an ESCRT‐dependent MVB‐mediated route preceding the basolateral reception that should be different to the one directing post‐reception protein degradation (Model Fig 10). EM analysis of Ptc subcellular localization as well as phenotypes in Rab5 and dynamin mutant conditions (Callejo et al, 2011) suggest that Ptc endocytosis occurs apically as well as basally. Since Hh reception happens mainly at basal membranes (Callejo et al, 2011; Gonzalez‐Mendez et al, 2017), it is possible that apical endocytosis of Ptc initiates an MVB‐mediated route to redirect Ptc towards basal membranes previous to reception, as happens in the Hh recycling process (Callejo et al, 2011).
Similar membrane relocation to the basolateral side of the polarized epithelia has been described for Dispatched (Disp) (Etheridge et al, 2010; Callejo et al, 2011; Stewart et al, 2018; Hall et al, 2019), a protein needed for Hh release at distant cellular targets (Burke et al, 1999; Ma et al, 2002). This protein shares a very similar molecular structure with the receptor Ptc. The molecular mechanism by which Disp releases Hh is not yet fully understood, but it has been proposed that Disp could also mediate Hh recycling (Callejo et al, 2011; D'Angelo et al, 2015) and location to exovesicles and cytonemes (Callejo et al, 2011; Gradilla et al, 2014; Bodeen et al, 2017) needed to release a processed and fully active Hh molecule (Stewart et al, 2018). Thus, Ptc and Disp may share not only similar structure but also similar recycling mechanisms to be presented in cytonemes for basal Hh signalling.
Although the SNARE and ESCRT complexes are required for the presentation of the Hh ligand and its receptor Ptc, their down‐regulation affects the Hh gradient differently depending on whether the mutant conditions happen in recipient or in producing cells (see scheme in Fig 10B). Thus, temporary inhibition of the sorting complexes in the P compartment results in a reduction of the Hh gradient because Hh cannot recycle to be presented and released for signal reception (Gradilla et al, 2014; Matusek et al, 2014; Fig EV3). Meanwhile, down‐regulation of SNARE and ESCRT complexes using the same tools in the A compartment compromises the Ptc‐Hh interaction allowing a greater dispersion of Hh and therefore an extension of the gradient. This extended Hh gradient is not able to activate the high threshold targets, causing a flattening of the gradient. Total abrogation of Hh reception should be expected after longer SNARE and ESCRT inhibition times either in the A or P compartment but, for practical reasons, this inhibition can only be carried out for a short‐time to avoid unspecific effects and, ultimately, cell death.
In the context of Ptc cytoneme loading, we contemplate two potential mechanisms: (i) Ptc could integrate into the basal plasma membrane preceding cytoneme extension and/or (ii) Ptc could travel in smaller vesicles (most likely small MVBs) within elongated cytonemes to fuse to the plasma membrane along their length, exposing Ptc in discrete contact sites. In favour of this last possibility, vesicles enriched in membrane spanning proteins, the mammalian tetraspanin CD63 and the Drosophila Tsp96F (orthologous of mammalian CD9 and CD81), also localize to cytonemes and colocalize with Ptc. In mammalian cells, the tetraspanins CD63, CD81 and CD9 have been described as the farthest‐specific enriched proteins for EVs as well as involved in EV biogenesis (reviewed in Andreu and Yanez‐Mo, 2014). Moreover, CD9 has already been associated with an MVB‐mediated fusion mechanism to deliver protein deposition at the plasma membrane (Verweij et al, 2018). Therefore, the colocalization of Tsp96F with the Hh‐receptor complex strongly supports our hypothesis of MVB requirement for Ptc exposure and reception functions. In addition, the fusion of MVBs could be responsible for the expansion of the basal plasma membrane resulting in cytoneme elongation.
In agreement with an MVB‐mediated mechanism for Ptc extracellular presentation for reception, in vitro culture wing disc Cl8 cells are able to produce and secrete EVs containing Ptc. It was found mainly loaded in small EVs (sEVs) together with the co‐receptor Ihog (Gradilla et al, 2014) and the ligand Hh (Gradilla et al, 2014; Parchure et al, 2015). These Ptc‐positive sEVs have exosome‐like features based on their flotation density, size range and the presence of EVs markers. The release of Ptc containing EVs in disaggregated Cl8 wing disc cell culture reinforces the existence of an MVB‐mediated process for extracellular targeting of Ptc. Accordingly, previous proteomic studies have found Ptc in EVs secreted by cultured mammary cancer cells (Bhat et al, 2018). The presence of Ptc in exosomes in tissue culture cells does not necessarily imply the release of Ptc in exosomes in the context of developing tissues.
A similar endosomal transport of the T‐receptor for localized release of EVs has been demonstrated for the immune synapsis between T cells and antigen presenting cells (Mittelbrunn & Sanchez‐Madrid, 2012; Alcover et al, 2018). Regarding signalling synapses, a cytoneme‐mediated morphogenetic synapsis for the signal transfer of Dpp and FGF molecules from wing disc cells towards the air sac primordium (ASP) has been described (Roy et al, 2011; Du et al, 2018; Huang et al, 2019). Moreover, glutamate receptor signalling and calcium influx bursts are both required for cytoneme‐mediated Dpp signal transfer (Huang et al, 2019). Related to our work, components like Syb and Syt1 have been described as presynaptic, presumably for ligand release (Huang et al, 2019), while we have also found them to be involved in receptor delivery. Nevertheless, we have not yet explored the potential mechanisms for cytoneme transport of post‐reception internalized vesicles. Indeed, to decifer how these two different vesicle kinds, for receptor delivery and for post‐reception, could organize and travel within cytonemes is still a major task.
Materials and Methods
Fly mutants
A description of mutations, insertions and transgenes is available at Fly Base (http://flybase.org/): Tub.gal80ts, flp122 (Bloomington Drosophila Stock Centre (BDSC), Indiana, USA; https://bdsc.indiana.edu/), Bac.hh‐GFP (Chen et al, 2017), Bac.ptc‐cherry (Chen et al, 2017), Yac.ptc‐GFP (VDRC318026), LacZptc‐AT96 [LacZ enhancer trap (Struhl et al, 1997)], shi ts1 (Grigliatti et al, 1973).
Over‐expression experiments
The Gal4 drivers were as follows: ap.Gal4 (Calleja et al, 1996), hh.Gal4 (Tanimoto et al, 2000), ptc.Gal4 (Calleja et al, 1996), tub.Gal4 (BDSC5138) and actin>CD2>Gal4 (Pignoni & Zipursky, 1997) used to generate ectopic clones of the UAS line. The pUAS‐transgenes were as follows: UAS.ptc‐GFP (Torroja et al, 2004), UAS.ihog‐CFP (Bilioni et al, 2013), UAS.ihog‐YFP (Callejo et al, 2011), UAS.tsp96F‐HA (FlyORF003566), UAS.CD63‐Cherry (a gift from Clive Wilson, Oxford University), UAS.CD63‐GFP (Panakova et al, 2005), UAS.CD4‐GFP (BDSC64315), UAS.nsyb‐GFP (BDSC6921), UAS.syx1A‐GFP (Tian et al, 2013), UAS.syt1‐GFP (BDSC6926). The LexA driver was dpp.LexA (Yagi et al, 2010) to direct expression of LexO.nsyb‐GFP (BDSC64315).
The UAS.RNAi lines targeting tsg101 (BDSC35710), hrs (BDSC33900), vps4 (VDRC105977), snap24 (VDRC108209), snap29 (BDSC25862), α‐snap (VDRC101341), shrub (BDSC38305), syb (VDRC102922), sec22 (VDRC100766), syx1A (BDSC25811), syt1 (VDRC100608), tsp96F (BDSC40901), tsp66E (BDSC490), tsp47F (BDSC39046), tsp3A (BDSC51076), tsp26A (BDSC40946), tsp86D (BDSC28515) and lbm (BDSC27278) were used. All lines were obtained from the BDSC (https://bdsc.indiana.edu/Home/Search), the Vienna Drosophila RNAi Centre (VDRC; http://stockcenter.vdrc.at/) and the Zurich ORFeome Project (https://flyorf.ch/index.php/orf-collection). An expression period between 12 and 30 h and up to 48 h (for Syt1 RNAi), depending on each UAS‐constructs strength, was achieved using Gal4; tub.Gal80ts drivers, maintaining the fly crosses at 18°C and inactivation of Gal80ts at the restrictive temperature (29°C) before dissection. In the case of activation under shi ts1 conditions, expression of Syb1 RNAi was induced for 48 h (27.5°C) followed by a heat shock at 31°C for one and a half hours before dissection.
Generation of the UAS.tsp96F‐RFP transgenic line
Tsp96F cDNA (LD19727; Drosophila Genomics Resource Center) was amplified by PCR (5′ CACCATGGGTCTCAACGGCT 3′; 5′ GGCCTTGTAGTGCTGATTCCTC 3′), cloned into the entry vector pENTR/D‐TOPO by directional TOPO cloning (Gateway system; Invitrogen) and introduced by recombination into the destination vector pTWR (PUAST‐RFP).
Immunostaining of imaginal discs
Immunostaining was performed according to standard protocols (Capdevila & Guerrero, 1994). Imaginal discs from third‐instar larvae were fixed in 4% (w/v) paraformaldehyde (PFA)/PBS for 20 min at room temperature (RT) and permeabilized in 0.1% Triton X‐100 (Sigma)/PBS before incubating with 1% BSA for blocking (1 h at RT) and primary antibody incubations (overnight at 4°C). Incubation with fluorescent secondary antibodies (1:200 Jackson laboratories and Invitrogen) was performed for 2 h at RT for posterior washing and mounting in mounting media (Vectashield). Antibodies were used at the following dilutions: mouse monoclonal α‐Ptc, 1:150 (Capdevila et al, 1994); rat monoclonal α‐Ci, 1:20 (Motzny & Holmgren, 1995); mouse monoclonal α‐Col, 1:100 [a gift from Crozatier et al, 2004)]; mouse monoclonal α‐En (Patel et al, 1989), 1:100 (Hybridoma bank); mouse monoclonal α‐HA antibody, 1:50 (Sigma); mouse monoclonal α‐Smo, 1:30 [(Lum et al, 2003b), Hybridoma bank]; and rabbit polyclonal α‐Βgal antibody, 1:10,000 (Capel).
In vivo imaging of the abdomen
Pupae were filmed through a window in the pupal case and analysed as described previously (Bischoff et al, 2013). White prepupae were attached to double‐sided adhesive tape to remove the operculum with forceps. The prepupa was removed from the adhesive using water and moved to a new slide mounting between four bands of Parafilm “M” arranged in parallel lines to ensure minimal squashing by coverslip. To avoid dehydration, a water pool was used to surround the prepupa.
Microscopy and image processing
A laser scanning confocal microscope (LSM710 Zeiss) was used for confocal fluorescence imaging of imaginal discs and LSM800 Zeiss for in vivo experiments in abdominal histoblast. ImageJ software (National Institutes of Health) was used for image processing and for macrodevelopment to quantify fluorescence levels.
Quantification of gradient length
Gradient lengths for ptc.trap‐GFP, ptc.lacZ enhancer trap and α‐Collier signals were determined in rectangle areas as described in Bischoff et al (2013) and then expressed as a proportion of the wing pouch size. The data were processed in a Matlab script where fluorescence for each sample was normalized to its maximum and lengths were normalized to the wing pouch size. After normalization, samples for each genotype were aligned to a fixed parameter corresponding to the sharp increase of signal. Once aligned, the x‐axes were divided into different bins that allow posterior statistical analysis (average and standard deviation). Gradient length values were also calculated using the Matlab script, up to a fixed parameter for signal decrease (15% of maximum intensity for Collier and 20% for ptc.trap‐GFP and ptc.lacZ experiments). Statistical analysis was processed in R‐script as described below.
For Engrailed signal, we manually quantified cell diameters from the anterior/posterior border, marked by the Bac.hh‐GFP expression, for all treatments and wild‐type condition. Numbers of En+ cell diameters were compared using R statistics software as described below.
Quantification of protein distribution along the apical/basal axis
For vesicle distribution analysis, we used an Integrated Density parameter from Fiji (ImageJ), which takes into account fluorescence intensity as well as signal area, allowing a numerical translation of signal accumulation. Measurements of Z‐stacks were done in a selected window (60 × 80 px) providing that its location included Ptc signal all through the apico/basal axis. To automatize measurements collection, a macro script for Fiji was designed, generating an excel file per genotype with all experimental data per Z‐slice. Individual graphs per genotype (Appendix Fig S1) were generated through a second script developed in Matlab language, which normalizes data to a Z coordinate being zero for the most apical case to one in the most basal. Integrated density values were also normalized to the maximum value for each treatment (Arbitrary Units). Average and standard deviation for the different treatments were calculated by dividing the normalized Z in 10 different equal regions. To localize the highest signal accumulation values in an apico/basal axis, a correlation coefficient between the maximum value of quantified integrated density and distance from the basal side (−1 = basal, +1 = apical) was calculated. Correlation coefficients per genotype were then processed in R‐script to obtain plots showing average and data variability per treatment and allowing a visual representation of potential apico/basal polarization of maximum values (Fig 2E and Appendix Figs S4, S6 and S8B).
Quantification of fluorescence colocalization
To determine Ptc‐cherry/Hh‐GFP colocalization rates, we used the Manders coefficient considering the proportion of red covered by green in a square area (80 × 90 px). Z‐stacks were acquired from apical to basal (1‐μm interval), and three apical, lateral and basal slices were each projected in Z for analysis per disc. To increase data reliability, two measurements per projected image were obtained (ventral and dorsal), and an average value from the two was used for plotting and statistical comparison between treatments.
Quantification of Smo immuno‐fluorescence
To compare Smo signal in discs dorsally expressing RNAi treatments and keeping the ventral half as an internal control in wild‐type condition, we obtained mean grey values from a fixed area (580 × 175 px) in each half per disc. A ratio of potential change was obtained by dividing each dorsal value by its corresponding ventral value. Statistical analysis of rate values was done in R and explained below.
Statistical analysis
All statistical analysis was carried out in R (Crawley, 2007). Data were tested for normality using Shapiro–Wilk tests.
Models for treatment effects on gradient length
For the ptc.trap‐GFP, a Kruskal–Wallis test of gradient length against treatments related to vesicle trafficking (wild type, UAS.hrs‐RNAi, UAS.tsg101‐RNAi, UAS.shrb‐RNAi, UAS.syb‐RNAi, UAS.α‐snap‐RNAi, UAS.vps4‐RNAi, UAS.snap24‐RNAi, UAS.snap29‐RNAi, UAS.sec22‐RNAi) (n = 109) showed a significant effect of treatment (Chi2 = 61.7, df = 14, P < 0.001). Pairwise Wilcoxon tests adjusted for multiple comparisons (Holm) were used to test for differences between control and each treatment, where all treatments were P = < 0.001 (Appendix Fig S9). For the α‐Collier analysis, a Kruskal–Wallis test of gradient length against treatments related to vesicle trafficking (wild type, UAS.hrs‐RNAi, UAS.tsg101‐RNAi, UAS.shrb‐RNAi, UAS.syb‐RNAi, UAS.α‐snap‐RNAi, UAS.vps4‐RNAi, UAS.snap24‐RNAi, UAS.tsp96F‐HA) (n = 106) showed a significant effect of treatment (Chi2 = 60.246, df = 8, P < 0.001); and when individually tested (pairwise Wilcoxon tests), all treatments where significantly different (P < 0.0125) from wild type, apart from Snap24 (P < 0.1) and Hrs (P = 0.1), which showed marginally non‐significant differences from wild type when adjusted for multiple comparisons (Fig 9A).
For the α‐Engrailed analysis, a Kruskal–Wallis test of gradient length against treatments related to vesicle trafficking (wild type, UAS.tsg101‐RNAi, UAS.shrb‐RNAi, UAS.syb‐RNAi, UAS.α‐snap‐RNAi, UAS.vps4‐RNAi, UAS.tsp96F‐HA) (n = 51) showed a significant effect of treatment (Chi2=28.766, df = 6, P < 0.001); and when individually tested (pairwise Wilcoxon tests), all treatments were significantly different (P < 0.01) from wild type when adjusted for multiple comparisons (Fig 9B). For the ptc.LacZ reporter, a Student's t‐test of gradient length against treatment (wild type, UAS.tsp96F‐HA) (n = 15) showed a significant effect of treatment P < 0.05 (Fig 9C).
Models for treatment effects on colocalization coefficient
A Kruskal–Wallis test carried out for colocalization rates for the control (wild type) and six treatments related to vesicle trafficking (wild type, UAS.hrs‐RNAi, UAS.syb‐RNAi, UAS.α‐snap‐RNAi, UAS.vps4‐RNAi, UAS.syx1A‐RNAi, UAS.dor‐RNAi, UAS.tsp96F‐HA) (n = 76) showed a significant effect of treatment (Chi2=35.195, df = 7, P < 0.001) in basal sections (Chi2=35.33, df = 7, P < 0.001) in lateral sections, and (Chi2=73.85, df = 69, P = 0.322) in apical sections. Pairwise Wilcoxon tests adjusted for multiple comparisons were used to test for significant differences between control and each treatment, where all treatments were significantly different in basal and lateral sections (P < 0.05), but showed no differences from wild‐type control in apical sections (P = 1) except for the Syx1A treatment (P < 0.05; Fig 8A and B, and Appendix Fig S8).
Models for treatment effects on Smo signal ratios
A Kruskal–Wallis test carried out for colocalization rates for the control (wild type) and six treatments related to vesicle trafficking (wild type, UAS.hrs‐RNAi, UAS.shrb‐RNAi, UAS.α‐snap‐RNAi, UAS.vps4‐RNAi, UAS.syx5‐RNAi) (n = 45) showed a significant effect of treatment (Chi2=20.75, df = 6, P < 0.005). Pairwise Wilcoxon tests adjusted for multiple comparisons were used to test for significant differences between control and each treatment, where treatments were not significantly different (P = 1) except for the syb RNAi treatment where Smo levels are reduced (P < 0.05; Appendix Fig S11).
Electron microscopy
Larvae were inverted in PBS and fixed in 2% (w/v) PFA and 0.2% (w/v) glutaraldehyde in 0.1 M phosphate buffer (PB, pH 7.4) for 2 h at RT and then overnight at 4°C. Subsequently, wing discs were dissected, embedded in 10% (w/v) gelatin and processed for cryosectioning. Discs were cut orthogonal to the ventral/dorsal axis on an EM FCS cryo‐ultramicrotome (Leica Microsystems) at −120°C. For immunogold labelling, thawed 90‐nm‐thick cryosections were incubated with rabbit α‐GFP (1:500, A‐6455; Invitrogen) antibodies followed by protein A conjugated to 15‐nm gold particles (EM Laboratory, Utrecht University, The Netherlands). Sections were stained with a mixture of 1.8% methylcellulose and 0.4% uranyl acetate and visualized with a JEOL JEM 1010 or a JEOL1400Flash (Tokyo, Japan) electron microscope operating at 80 kV. Images were recorded with a 4K CMOS digital camera from TVIPS (F416, Gauting, Germany) or Gatan (OneView, Pleasanton, USA).
Protein isolation for mass spectrometry
We modified a standard protocol for immunoprecipitation using Drosophila embryos (Hughes et al, 2008). Larvae expressing UAS.ptc‐GFP or UAS‐GFP under tub.Gal4 were collected and dry frozen in liquid Nitrogen. 100 frozen larvae for each genotype were homogenized in 2 ml/each of C Buffer (50 mM HEPES [pH7.4], 50 mM KCl, 1 mM MgCl, 1 mM EGTA, 0.1% Triton X‐100, Protease inhibitors cocktail (Roche) and 1 mM PMSF). Extracts were initially clarified by centrifugation at 15,000 g for 10 min, followed by two high‐speed centrifugations at 165,000 g for 10 and 30 min. The supernatant was incubated with GFP‐Trap coupled to agarose beads (Chromotek) for 1 h at 4°C, then washed (5×) with C Buffer. Mass spec samples were then dry frozen at −80°C. To check for immunoprecipitation, samples were resuspended in sample buffer with β‐mercaptoethanol and subjected to 1 D SDS–PAGE and Western blotting. Blotted membranes were probed with mouse monoclonal α‐GFP antibody (1:1,000, Roche). Blot was incubated with a fluorescent α‐mouse secondary antibody (800CW Li‐Cor) and imaged with the 364‐Odyssey equipment. Uncropped Western blots are shown in Appendix Fig S3. Mass Spec sequencing and basic analysis were performed at the Proteomics Facility of the University of Bristol. Samples were briefly run in an SDS‐PAGE gel, cut as a single slice and subjected to in‐gel tryptic digestion using a DigestPro‐automated digestion unit (Intavis Ltd). The resulting peptides were fractionated using a Dionex Ultimate 3000 nanoHPLC system in line with an LTQ‐Orbitrap Velos mass spectrometer (Thermo Scientific). The raw data files were processed and quantified using Proteom Discoverer Software v1.2 (Thermo Scientific) and searched against the dmel‐all‐translations‐r5.47 database using the SEQUEST algorithm. Experimental Mass Spec data were filtered against the GFP control data to discard false‐positive candidates.
Co‐immunoprecipitation essay
Immunoprecipitation was performed as above from larvae co‐expressing Ptc‐GFP and Tsp96F‐HA or GFP and Tsp96F‐HA under tub.Gal4 (100 frozen larvae per genotype). Homogenized and clarified samples were also incubated with GFP‐Trap coupled to agarose beads (Chromotek) for 1 h at 4°C, then washed (5×) with C Buffer. To check for co‐immunoprecipitation, samples were resuspended in sample buffer with β‐mercaptoethanol and subjected to 1 D SDS–PAGE (6–15% gradient) and Western blotting. Blotted membranes were probed with appropriate antibodies, either to HA (1:500 mouse monoclonal, Covance) or GFP (1:5,000 rabbit polyclonal Chromotek). Blots were incubated with fluorescent α‐mouse (800CW) and α‐rabbit (680RD) secondary antibodies (Li‐Cor) and imaged with the 364‐Odyssey equipment. Uncropped Western blots are shown in Appendix Fig S5.
Cell culture
Drosophila Cl8 cells were maintained and amplified in complete Shields and Sang M3 insect medium containing 2.5% of FBS (foetal bovine serum), 2.5% fly extract, 10 mg/ml of insulin and 1% penicillin/streptomycin. For EVs production and silencing experiments, cells were cultured in EVs‐depleted M3 medium without fly extract.
Production and isolation of EVs
For the experiments conducted for the characterization of vesicular Ptc secretion, EVs from Cl8 cells were obtained by traditional differential centrifugation of conditioned media (CM) collected after 6 days of production. Such CM was firstly centrifuged at 200 g to separate the producing cells from CM. Then, successive centrifugations were performed at 2,500 g to remove debris and at 10,000, 100,000 and 250,000 g to obtain the vesicular fractions P10 or large EVs (lEVs), P10K or small EVs (sEVs) and P250K or very small EVs (vsEVs), as well as the corresponding supernatants (SN10, SN10K and SN250K).
For EV isolation from the 24‐h silencing experiments, after separating cells and removing debris, 2 ml of the corresponding CM was centrifuged directly at 250,000 g to obtain the complete population of EVs.
Western blot analysis
All proteins were detected under non‐reducing conditions. Cell extracts were obtained by lysis in 300 mM NaCl, 50 mM Tris pH 7.4, 1% Triton X‐100 and protease inhibitors. Proteins from cell extracts and EVs were separated on NuPAGE 4–12% pre‐casted gels (Invitrogen by Thermo Scientific) and transferred to a PVDF membrane (Millipore by Merck) for immunoblotting.
Mouse monoclonal antibodies were purchased from the following vendors: mouse monoclonal antibody against Hsp70 (clone BRM22) was obtained from Santa Cruz Biotechnology; α‐Rab8 (clon4) from BD; α‐Syntaxin (8C3), α‐Ptc (Apa1) and α‐Lbm (10C9) from Developmental Studies Hybridoma Bank (Iowa City, IA). Rabbit polyclonal α‐Ihog was obtained using the Polyclonal Genomic Antibody TechnologyTM (sdix) (Chambers & Johnston, 2003).
Fractionation of EVs on continuous sucrose gradient
Small EVs (P100K) were placed on continuous 0.25–2 M sucrose gradient in 20 mM HEPES (pH 7.4) and submitted to ultracentrifugation for 16 h at 100,000 g, 4°C, in an SW40Ti swinging‐bucket rotor. Then, 1 ml of fractions was collected from top to bottom and 20 μl of each fraction was reserved for measurement of the refractive index to density determination. Each fraction was diluted with 2 ml of 20 mM HEPES (pH 7.4) and ultracentrifuged for 1 h at 100,000 g, 4°C, in a TLA‐110 rotor. Supernatants were aspirated, and pellets were resuspended in 25 μl PBS and stored at −80°C.
Fractionation of EVs by size exclusion chromatography—SEC
Finally, the small EVs (P100K) were also fractionated using an in‐house SEC. For each EV preparation, a Poly‐prep Chromatography Column (Bio‐Rad #731‐1550) was filled with 2.5 ml of Sepharose CL‐2B cross‐linked resin (Sigma #CL2B300‐100ML) and left packing overnight at 4°C. Then, the column was washed twice with 2.5 ml of 1× DPBS. Once the column is cleaned, a volume of 200 μl of sample was applied onto the column, and after entering the sample, 4.0 ml of 1× DPBS was added for elution of 10 fractions of 200 μl and two final fractions of 1.0 ml.
Gene silencing in Drosophila‐cultured Cl8 cells
dsRNAs used for gene silencing were synthesized according the protocol from the Drosophila RNAi Screening Centre (DRSC) in Boston. Briefly, DNA templates containing T7 promoters sequence at both ends were obtained from DRSC (Appendix Table S1) and amplified by PCR. These PCR products were used for in vitro transcription, which was carried out for 16 h at 37°C using the T7 Megascript kit from Ambion. After DNaseI (Ambion) digestion to remove the template DNA, dsRNAs were purified using RNAeasy columns (Qiagen). Both PCR‐amplified DNA and purified dsRNA products were assessed by gel electrophoreses and absorbance measurements of yield. For gene silencing itself, Cl8 cells were seeded in six‐well plates at 5 × 10⁶ per well in 0.5 ml of FBS‐free medium and 5 μg of dsRNA was added. After 1 h, 1.5 ml of EV‐depleted medium was added. After 24 h of incubation, conditioned media were collected for EVs isolation.
Author contributions
IG conceived the idea, designed the study, analysed data and wrote the manuscript. A‐CG designed the study, analysed data and wrote the manuscript. LG‐M designed and performed experiments, analysed data and prepared figures. DS‐H performed experiments and image analysis. AA‐T performed in vivo experiments and designed software for image analysis and extraction of quantitative data. CJ‐J performed experiments and image analysis. GAg performed GRASP experiments. JMF‐P first found that Ptc was associated to exosomes, designed the exovesicle in vitro study and analysed data. EG performed the exovesicle in vitro experiments, analysed data and prepared figures. GAn designed the electron microscopy study, analysed data and prepared figures. MG performed electron microscopy experiments.
Conflict of interest
The authors declare that they have no conflict of interest.
Supporting information
Appendix
Expanded View Figures PDF
Movie EV1
Movie EV2
Source Data for Expanded View and Appendix
Review Process File
Source Data for Figure 2
Source Data for Figure 7
Source Data for Figure 9
Acknowledgements
We are grateful to Pedro Ripoll and Robert Wilson for editing and comments on the manuscript. We are also thankful to the Proteomic Facility of the University of Bristol, especially to Kate Heesom, for their kind services towards proteomics analysis, to Michèle Crozatier for the α‐Col antibody, to Bob Holmgren for the α‐Ci antibody and to Tom Kornberg for the Hh‐GFP Bac and Ptc‐RFP Bac transgenic lines. Work was supported by grants BFU2015‐72831‐EXP and BFU2017‐83789‐P to IG, REDiEX consortium SAF2015‐71231‐REDT and RED2018‐102411‐T to JMF and IG and BFU2015‐73609‐JIN to ACG, all from the Spanish Ministry of Science, Innovation and University by institutional grants from the Fundación Areces and from Banco de Santander to the CBMSO. Germán Andrés was supported by the Amarouto Program for senior scientists from the Comunidad de Madrid.
The EMBO Journal (2020) 39: 39: e103629
Contributor Information
Ana‐Citlali Gradilla, Email: acgradilla@cbm.csic.es.
Isabel Guerrero, Email: iguerrero@cbm.csic.es.
References
- Alcedo J, Ayzenzon M, Von Ohlen T, Noll M, Hooper JE (1996) The Drosophila smoothened gene encodes a seven‐pass membrane protein, a putative receptor for the hedgehog signal. Cell 86: 221–232 [DOI] [PubMed] [Google Scholar]
- Alcover A, Alarcon B, Di Bartolo V (2018) Cell biology of T cell receptor expression and regulation. Annual Review of Immunology 36: 103–125 [DOI] [PubMed] [Google Scholar]
- Andreu Z, Yanez‐Mo M (2014) Tetraspanins in extracellular vesicle formation and function. Front Immunol 5: 442 [DOI] [PMC free article] [PubMed] [Google Scholar]
- Babst M (2011) MVB vesicle formation: ESCRT‐dependent, ESCRT‐independent and everything in between. Curr Opin Cell Biol 23: 452–457 [DOI] [PMC free article] [PubMed] [Google Scholar]
- Bhat A, Sharma A, Bharti AC (2018) Upstream Hedgehog signaling components are exported in exosomes of cervical cancer cell lines. Nanomedicine 13: 2127–2138 [DOI] [PubMed] [Google Scholar]
- Bhattacharya S, Stewart BA, Niemeyer BA, Burgess RW, McCabe BD, Lin P, Boulianne G, O'Kane CJ, Schwarz TL (2002) Members of the synaptobrevin/vesicle‐associated membrane protein (VAMP) family in Drosophila are functionally interchangeable in vivo for neurotransmitter release and cell viability. Proc Natl Acad Sci U S A 99: 13867–13872 [DOI] [PMC free article] [PubMed] [Google Scholar]
- Bilioni A, Sanchez‐Hernandez D, Callejo A, Gradilla AC, Ibanez C, Mollica E, Carmen Rodriguez‐Navas M, Simon E, Guerrero I (2013) Balancing Hedgehog, a retention and release equilibrium given by Dally, Ihog, Boi and shifted/DmWif. Dev Biol 376: 198–212 [DOI] [PubMed] [Google Scholar]
- Bin NR, Huang M, Sugita S (2018) Investigating the role of SNARE proteins in trafficking of postsynaptic receptors using conditional knockouts. Neuroscience 420: 22–31 [DOI] [PubMed] [Google Scholar]
- Bischoff M, Gradilla AC, Seijo I, Andres G, Rodriguez‐Navas C, Gonzalez‐Mendez L, Guerrero I (2013) Cytonemes are required for the establishment of a normal Hedgehog morphogen gradient in Drosophila epithelia. Nat Cell Biol 15: 1269–1281 [DOI] [PMC free article] [PubMed] [Google Scholar]
- Bodeen WJ, Marada S, Truong A, Ogden SK (2017) A fixation method to preserve cultured cell cytonemes facilitates mechanistic interrogation of morphogen transport. Development 144: 3612–3624 [DOI] [PMC free article] [PubMed] [Google Scholar]
- Briscoe J, Chen Y, Jessell TM, Struhl G (2001) A hedgehog‐insensitive form of patched provides evidence for direct long‐range morphogen activity of sonic hedgehog in the neural tube. Mol Cell 7: 1279–1291 [DOI] [PubMed] [Google Scholar]
- Briscoe J, Therond PP (2013) The mechanisms of Hedgehog signalling and its roles in development and disease. Nat Rev Mol Cell Biol 14: 416–429 [DOI] [PubMed] [Google Scholar]
- Burke R, Nellen D, Bellotto M, Hafen E, Senti KA, Dickson BJ, Basler K (1999) Dispatched, a novel sterol‐sensing domain protein dedicated to the release of cholesterol‐modified hedgehog from signaling cells. Cell 99: 803–815 [DOI] [PubMed] [Google Scholar]
- Calleja M, Moreno E, Pelaz S, Morata G (1996) Visualization of gene expression in living adult Drosophila . Science 274: 252–255 [DOI] [PubMed] [Google Scholar]
- Callejo A, Bilioni A, Mollica E, Gorfinkiel N, Andres G, Ibanez C, Torroja C, Doglio L, Sierra J, Guerrero I (2011) Dispatched mediates Hedgehog basolateral release to form the long‐range morphogenetic gradient in the Drosophila wing disk epithelium. Proc Natl Acad Sci USA 108: 12591–12598 [DOI] [PMC free article] [PubMed] [Google Scholar]
- Capdevila J, Estrada MP, Sanchez‐Herrero E, Guerrero I (1994) The Drosophila segment polarity gene patched interacts with decapentaplegic in wing development. EMBO J 13: 71–82 [DOI] [PMC free article] [PubMed] [Google Scholar]
- Capdevila J, Guerrero I (1994) Targeted expression of the signaling molecule decapentaplegic induces pattern duplications and growth alterations in Drosophila wings. EMBO J 13: 4459–4468 [DOI] [PMC free article] [PubMed] [Google Scholar]
- Chambers RS, Johnston SA (2003) High‐level generation of polyclonal antibodies by genetic immunization. Nat Biotechnol 21: 1088–1092 [DOI] [PubMed] [Google Scholar]
- Chen Y, Struhl G (1996) Dual roles for patched in sequestering and transducing Hedgehog. Cell 87: 553–563 [DOI] [PubMed] [Google Scholar]
- Chen W, Huang H, Hatori R, Kornberg TB (2017) Essential basal cytonemes take up Hedgehog in the Drosophila wing imaginal disc. Development 144: 3134–3144 [DOI] [PMC free article] [PubMed] [Google Scholar]
- Coulter ME, Dorobantu CM, Lodewijk GA, Delalande F, Cianferani S, Ganesh VS, Smith RS, Lim ET, Xu CS, Pang S et al (2018) The ESCRT‐III protein CHMP1A mediates secretion of sonic hedgehog on a distinctive subtype of extracellular vesicles. Cell Rep 24: 973–986 e978 [DOI] [PMC free article] [PubMed] [Google Scholar]
- Crawley MJ (2007) The R book. West Sussex, UK: John Wiley & Sons; [Google Scholar]
- Crozatier M, Ubeda JM, Vincent A, Meister M (2004) Cellular immune response to parasitization in Drosophila requires the EBF orthologue collier. PLoS Biol 2: E196 [DOI] [PMC free article] [PubMed] [Google Scholar]
- D'Angelo G, Matusek T, Pizette S, Therond PP (2015) Endocytosis of Hedgehog through dispatched regulates long‐range signaling. Dev Cell 32: 290–303 [DOI] [PubMed] [Google Scholar]
- Denef N, Neubuser D, Perez L, Cohen SM (2000) Hedgehog induces opposite changes in turnover and subcellular localization of patched and smoothened. Cell 102: 521–531 [DOI] [PubMed] [Google Scholar]
- Desbordes SC, Sanson B (2003) The glypican Dally‐like is required for Hedgehog signalling in the embryonic epidermis of Drosophila . Development 130: 6245–6255 [DOI] [PubMed] [Google Scholar]
- DiAntonio A, Burgess RW, Chin AC, Deitcher DL, Scheller RH, Schwarz TL (1993) Identification and characterization of Drosophila genes for synaptic vesicle proteins. J Neurosci 13: 4924–4935 [DOI] [PMC free article] [PubMed] [Google Scholar]
- Du L, Sohr A, Yan G, Roy S (2018) Feedback regulation of cytoneme‐mediated transport shapes a tissue‐specific FGF morphogen gradient. eLife 7 [DOI] [PMC free article] [PubMed] [Google Scholar]
- Etheridge LA, Crawford TQ, Zhang S, Roelink H (2010) Evidence for a role of vertebrate Disp1 in long‐range Shh signaling. Development 137: 133–140 [DOI] [PMC free article] [PubMed] [Google Scholar]
- Feinberg EH, Vanhoven MK, Bendesky A, Wang G, Fetter RD, Shen K, Bargmann CI (2008) GFP Reconstitution Across Synaptic Partners (GRASP) defines cell contacts and synapses in living nervous systems. Neuron 57: 353–363 [DOI] [PubMed] [Google Scholar]
- Fleury A, Martinez MC, Le Lay S (2014) Extracellular vesicles as therapeutic tools in cardiovascular diseases. Front Immunol 5: 370 [DOI] [PMC free article] [PubMed] [Google Scholar]
- Glise B, Miller CA, Crozatier M, Halbisen MA, Wise S, Olson DJ, Vincent A, Blair SS (2005) Shifted, the Drosophila ortholog of Wnt inhibitory factor‐1, controls the distribution and movement of Hedgehog. Dev Cell 8: 255–266 [DOI] [PubMed] [Google Scholar]
- Gonzalez‐Mendez L, Seijo‐Barandiaran I, Guerrero I (2017) Cytoneme‐mediated cell‐cell contacts for Hedgehog reception. Elife 6: e24045 [DOI] [PMC free article] [PubMed] [Google Scholar]
- Gonzalez‐Mendez L, Gradilla AC, Guerrero I (2019) The cytoneme connection: direct long‐distance signal transfer during development. Development 146: dev174607 [DOI] [PubMed] [Google Scholar]
- Gorfinkiel N, Sierra J, Callejo A, Ibanez C, Guerrero I (2005) The Drosophila ortholog of the human Wnt inhibitor factor Shifted controls the diffusion of lipid‐modified Hedgehog. Dev Cell 8: 241–253 [DOI] [PubMed] [Google Scholar]
- Gradilla AC, Gonzalez E, Seijo I, Andres G, Bischoff M, Gonzalez‐Mendez L, Sanchez V, Callejo A, Ibanez C, Guerra M et al (2014) Exosomes as Hedgehog carriers in cytoneme‐mediated transport and secretion. Nat Commun 5: 5649 [DOI] [PubMed] [Google Scholar]
- Grigliatti TA, Hall L, Rosenbluth R, Suzuki DT (1973) Temperature‐sensitive mutations in Drosophila melanogaster. XIV. A selection of immobile adults. Mol Gen Genet 120: 107–114 [DOI] [PubMed] [Google Scholar]
- Hall ET, Cleverdon ER, Ogden SK (2019) Dispatching sonic Hedgehog: molecular mechanisms controlling deployment. Trends Cell Biol 29: 385–395 [DOI] [PMC free article] [PubMed] [Google Scholar]
- Hemler ME (2005) Tetraspanin functions and associated microdomains. Nat Rev Mol Cell Biol 6: 801–811 [DOI] [PubMed] [Google Scholar]
- van den Heuvel M, Ingham PW (1996) Smoothened encodes a receptor‐like serpentine protein required for hedgehog signalling. Nature 382: 547–551 [DOI] [PubMed] [Google Scholar]
- Hsia EYC, Zhang Y, Tran HS, Lim A, Chou YH, Lan G, Beachy PA, Zheng X (2017) Hedgehog mediated degradation of Ihog adhesion proteins modulates cell segregation in Drosophila wing imaginal discs. Nat Commun 8: 1275 [DOI] [PMC free article] [PubMed] [Google Scholar]
- Huang H, Liu S, Kornberg TB (2019) Glutamate signaling at cytoneme synapses. Science 363: 948–955 [DOI] [PMC free article] [PubMed] [Google Scholar]
- Hughes JR, Meireles AM, Fisher KH, Garcia A, Antrobus PR, Wainman A, Zitzmann N, Deane C, Ohkura H, Wakefield JG (2008) A microtubule interactome: complexes with roles in cell cycle and mitosis. PLoS Biol 6: e98 [DOI] [PMC free article] [PubMed] [Google Scholar]
- Littleton JT (2000) A genomic analysis of membrane trafficking and neurotransmitter release in Drosophila . J Cell Biol 150: F77–F82 [DOI] [PubMed] [Google Scholar]
- Lu X, Liu S, Kornberg TB (2006) The C‐terminal tail of the Hedgehog receptor Patched regulates both localization and turnover. Genes Dev 20: 2539–2551 [DOI] [PMC free article] [PubMed] [Google Scholar]
- Lum L, Yao S, Mozer B, Rovescalli A, Von Kessler D, Nirenberg M, Beachy PA (2003a) Identification of Hedgehog pathway components by RNAi in Drosophila cultured cells. Science 299: 2039–2045 [DOI] [PubMed] [Google Scholar]
- Lum L, Zhang C, Oh S, Mann RK, von Kessler DP, Taipale J, Weis‐Garcia F, Gong R, Wang B, Beachy PA (2003b) Hedgehog signal transduction via Smoothened association with a cytoplasmic complex scaffolded by the atypical kinesin, Costal‐2. Mol Cell 12: 1261–1274 [DOI] [PubMed] [Google Scholar]
- Ma Y, Erkner A, Gong R, Yao S, Taipale J, Basler K, Beachy PA (2002) Hedgehog‐mediated patterning of the mammalian embryo requires transporter‐like function of dispatched. Cell 111: 63–75 [DOI] [PubMed] [Google Scholar]
- Macpherson LJ, Zaharieva EE, Kearney PJ, Alpert MH, Lin TY, Turan Z, Lee CH, Gallio M (2015) Dynamic labelling of neural connections in multiple colours by trans‐synaptic fluorescence complementation. Nat Commun 6: 10024 [DOI] [PMC free article] [PubMed] [Google Scholar]
- Matusek T, Wendler F, Poles S, Pizette S, D'Angelo G, Furthauer M, Therond PP (2014) The ESCRT machinery regulates the secretion and long‐range activity of Hedgehog. Nature 516: 99–103 [DOI] [PubMed] [Google Scholar]
- Mittelbrunn M, Sanchez‐Madrid F (2012) Intercellular communication: diverse structures for exchange of genetic information. Nat Rev Mol Cell Biol 13: 328–335 [DOI] [PMC free article] [PubMed] [Google Scholar]
- Motzny CK, Holmgren R (1995) The Drosophila cubitus interruptus protein and its role in the wingless and hedgehog signal transduction pathways. Mech Dev 52: 137–150 [DOI] [PubMed] [Google Scholar]
- Panakova D, Sprong H, Marois E, Thiele C, Eaton S (2005) Lipoprotein particles are required for Hedgehog and Wingless signalling. Nature 435: 58–65 [DOI] [PubMed] [Google Scholar]
- Parchure A, Vyas N, Ferguson C, Parton RG, Mayor S (2015) Oligomerization and endocytosis of Hedgehog is necessary for its efficient exovesicular secretion. Mol Biol Cell 26: 4700–4717 [DOI] [PMC free article] [PubMed] [Google Scholar]
- Patel NH, Martin‐Blanco E, Coleman KG, Poole SJ, Ellis MC, Kornberg TB, Goodman CS (1989) Expression of engrailed proteins in arthropods, annelids, and chordates. Cell 58: 955–968 [DOI] [PubMed] [Google Scholar]
- Peel DJ, Johnson SA, Milner MJ (1990) The ultrastructure of imaginal disc cells in primary cultures and during cell aggregation in continuous cell lines. Tissue Cell 22: 749–758 [DOI] [PubMed] [Google Scholar]
- Pignoni F, Zipursky SL (1997) Induction of Drosophila eye development by decapentaplegic. Development 124: 271–278 [DOI] [PubMed] [Google Scholar]
- Roy S, Hsiung F, Kornberg TB (2011) Specificity of Drosophila cytonemes for distinct signaling pathways. Science 332: 354–358 [DOI] [PMC free article] [PubMed] [Google Scholar]
- Sanders TA, Llagostera E, Barna M (2013) Specialized filopodia direct long‐range transport of SHH during vertebrate tissue patterning. Nature 497: 628–632 [DOI] [PMC free article] [PubMed] [Google Scholar]
- Sevrioukov EA, He JP, Moghrabi N, Sunio A, Kramer H (1999) A role for the deep orange and carnation eye color genes in lysosomal delivery in Drosophila . Mol Cell 4: 479–486 [DOI] [PubMed] [Google Scholar]
- Stewart DP, Marada S, Bodeen WJ, Truong A, Sakurada SM, Pandit T, Pruett‐Miller SM, Ogden SK (2018) Cleavage activates dispatched for Sonic Hedgehog ligand release. Elife 7: e31678 [DOI] [PMC free article] [PubMed] [Google Scholar]
- Struhl G, Barbash DA, Lawrence PA (1997) Hedgehog acts by distinct gradient and signal relay mechanisms to organise cell type and cell polarity in the Drosophila abdomen. Development 124: 2155–2165 [DOI] [PubMed] [Google Scholar]
- Sudhof TC (2004) The synaptic vesicle cycle. Annu Rev Neurosci 27: 509–547 [DOI] [PubMed] [Google Scholar]
- Sudhof TC (2013) Neurotransmitter release: the last millisecond in the life of a synaptic vesicle. Neuron 80: 675–690 [DOI] [PMC free article] [PubMed] [Google Scholar]
- Takeo S, Akiyama T, Firkus C, Aigaki T, Nakato H (2005) Expression of a secreted form of Dally, a Drosophila glypican, induces overgrowth phenotype by affecting action range of Hedgehog. Dev Biol 284: 204–218 [DOI] [PubMed] [Google Scholar]
- Tanimoto H, Itoh S, ten Dijke P, Tabata T (2000) Hedgehog creates a gradient of DPP activity in Drosophila wing imaginal discs. Mol Cell 5: 59–71 [DOI] [PubMed] [Google Scholar]
- Tian AG, Tamori Y, Huang YC, Melendez NT, Deng WM (2013) Efficient EGFR signaling and dorsal‐ventral axis patterning requires syntaxin dependent Gurken trafficking. Dev Biol 373: 349–358 [DOI] [PMC free article] [PubMed] [Google Scholar]
- Torroja C, Gorfinkiel N, Guerrero I (2004) Patched controls the Hedgehog gradient by endocytosis in a dynamin‐dependent manner, but this internalization does not play a major role in signal transduction. Development 131: 2395–2408 [DOI] [PubMed] [Google Scholar]
- Torroja C, Gorfinkiel N, Guerrero I (2005) Mechanisms of Hedgehog gradient formation and interpretation. J Neurobiol 64: 334–356 [DOI] [PubMed] [Google Scholar]
- Verweij FJ, Bebelman MP, Jimenez CR, Garcia‐Vallejo JJ, Janssen H, Neefjes J, Knol JC, de Goeij‐de HaasR, Piersma SR, Baglio SR et al (2018) Quantifying exosome secretion from single cells reveals a modulatory role for GPCR signaling. J Cell Biol 217: 1129–1142 [DOI] [PMC free article] [PubMed] [Google Scholar]
- Vyas N, Walvekar A, Tate D, Lakshmanan V, Bansal D, Lo Cicero A, Raposo G, Palakodeti D, Dhawan J (2014) Vertebrate Hedgehog is secreted on two types of extracellular vesicles with different signaling properties. Sci Rep 4: 7357 [DOI] [PMC free article] [PubMed] [Google Scholar]
- Wang T, Li L, Hong W (2017) SNARE proteins in membrane trafficking. Traffic 18: 767–775 [DOI] [PubMed] [Google Scholar]
- Yagi R, Mayer F, Basler K (2010) Refined LexA transactivators and their use in combination with the Drosophila Gal4 system. Proc Natl Acad Sci USA 107: 16166–16171 [DOI] [PMC free article] [PubMed] [Google Scholar]
- Yanagawa S, Lee JS, Ishimoto A (1998) Identification and characterization of a novel line of Drosophila Schneider S2 cells that respond to wingless signaling. J Biol Chem 273: 32353–32359 [DOI] [PubMed] [Google Scholar]
- Zheng X, Mann RK, Sever N, Beachy PA (2010) Genetic and biochemical definition of the Hedgehog receptor. Genes Dev 24: 57–71 [DOI] [PMC free article] [PubMed] [Google Scholar]
Associated Data
This section collects any data citations, data availability statements, or supplementary materials included in this article.
Supplementary Materials
Appendix
Expanded View Figures PDF
Movie EV1
Movie EV2
Source Data for Expanded View and Appendix
Review Process File
Source Data for Figure 2
Source Data for Figure 7
Source Data for Figure 9