

Abstract
Technology-enabled services frequently have limited reach and suboptimal engagement when implemented in real-world settings. One reason for these implementation failures is that technology-enabled services are not designed for the users and contexts in which they will be implemented. User-centered design is an approach to designing technologies and services that is grounded in information from the stakeholders who will be using or impacted by them, and the contexts for implementation. The purpose of this paper is to present user-centered design methods that can be applied to technology-enabled services for eating disorders. We provide an overview of the user-centered design process, which is iterative and involves stakeholders throughout. One model is presented that depicts six phases of a user-centered design process: investigate, ideate, prototype, evaluate, refine and develop, and validate. We then review how user-centered design approaches can be applied to designing technology-enabled services for patients with eating disorders, and we integrate a hypothetical case example that demonstrates the application of these techniques to designing a technology-enabled service for binge eating. Most of the user-centered design techniques can be implemented relatively quickly, allowing us to rapidly learn what stakeholders want and to identify problems before devoting time and resources to developing and delivering technologies and services. Through this work, we show how designing services that fit into the patterns and routines that stakeholders already are doing can ensure that services are relevant to stakeholders and meet their needs, potentially improving engagement and clinical impact.
Keywords: user-centered design, human-computer interaction, digital, technology-enabled services, eating disorders
Introduction
Controlled research studies show that digital tools can be efficacious for delivering clinical services (e.g., prevention and treatment interventions) for eating disorders (Bauer & Moessner, 2013; Melioli et al., 2016; Taylor, Graham, Flatt, & Fitzsimmons-Craft, Under review). However, once implemented, technology-enhanced or -enabled services (hereafter referred to as “technology-enabled services”) frequently have limited reach and suboptimal engagement. Reach is defined as the number of people who are offered a service relative to the number of people eligible to receive it, and engagement is defined as uptake and/or adherence to a service. For example, in two initiatives we conducted to implement online screening and intervention for eating disorders on university campuses in the United States, <3% of the student body completed screening (Fitzsimmons-Craft et al., Under review; Fitzsimmons-Craft et al., 2018). Similar results were observed for an Internet-based eating disorder intervention delivered in an Irish university setting (Lindenberg, Moessner, Harney, McLaughlin, & Bauer, 2011). In addition to minimizing clinical impact, low rates of reach and engagement undermine economic models that support large-scale service delivery (Kass et al., 2017; Moessner & Bauer, 2017), making it difficult to realize the promise of technology-enabled services.
One reason for limited reach and suboptimal engagement – problems that are not unique to eating disorders (e.g., Arean et al., 2016; Gilbody et al., 2015; Hermes & Rosenheck, 2016; Localytics, 2017; Owen et al., 2015; Quanbeck et al., 2018; Shaw et al., 2016) – is that technology-enabled services are not designed for the users and contexts in which they will be implemented (Lyon & Koerner, 2016; Mohr, Lyon, Lattie, Reddy, & Schueller, 2017; Mohr, Riper, & Schueller, 2018; Mohr, Weingardt, Reddy, & Schueller, 2017). A clinical review of mental health smartphone apps cited app design as a primary problem leading to low engagement: many apps are not designed with service users in mind and do not solve problems about which users care most (Torous, Nicholas, Larsen, Firth, & Christensen, 2018). Often, we attempt to translate evidence-based, manualized treatments into an online format and expect them to produce the same outcomes. Designing a technology-enabled service requires attention be paid to the people receiving the service (e.g., patients), people delivering the service (e.g., providers/coaches), and other stakeholders who may be impacted by the service, as these parties engage with the service and therefore affect reach and engagement. To rectify problems with reach and engagement, we need a better understanding of how people interact with technology to inform the design of technology-enabled services for eating disorders.
Figure 1 presents a model of how a technology-enabled service fits within a larger socio-technical system. In the model’s center is the target user, who in this example is the patient with an eating disorder. In understanding how to design a technology-enabled service that will fit into the day-to-day life of this patient and therefore be used in the moments and contexts in which it is needed most, we must consider that the patient interacts with other individuals like his/her coach within the service and other providers, as well as with family members and peers, who may or may not be leveraged for support within the technology-enabled service. The patient interact with his/her environment, which contains varying prompts for healthy and unhealthy eating-related behaviors across different contexts. The patient also interacts with technologies like his/her mobile phone and computers. Finally, the patient is influenced by the various tasks he/she must complete that range from health-related tasks, such as behavior changes to support healthy eating, to mundane tasks such as his/her daily home or work activities. This framework also can be applied to providers delivering a technology-enabled service. The provider interacts with other individuals (e.g., the patient), technologies (e.g., the service dashboard, an electronic medical record), and the environment (e.g., work, but has capacity to use the dashboard at home or while traveling), as well as completes tasks (e.g., text messaging, writing notes, tracking symptom changes from patients’ self-monitoring logs). Although any design process is unlikely to account for all possible relationships and interactions, efforts to understand these interactions and account for them can remove barriers and increase facilitators for engagement. Indeed, attending to user needs through design results in greater acceptability, understanding, adoption, and engagement with technologies (Kujala, 2003; Kushniruk & Nohr, 2016; Maguire, 2001; McCurdie et al., 2012) and has potential to improve clinical outcomes (McCurdie et al., 2012).
Figure 1.

Socio-technical system demonstrating the relationship between stakeholders, processes, environments, and technologies
User-centered design is an approach to designing technologies and services that is grounded in information from the stakeholders who will be using or impacted by them and the contexts in which they will be implemented. This approach is applicable both to designing the technologies that comprise a service as well as to designing how the clinical service is delivered and implemented and other relevant artifacts (although this paper focuses on the design of technology). However, user-centered design has yet to gain widespread traction among clinical scientists in health care (Altman, Huang, & Breland, 2018). With respect to eating disorders, user-centered design approaches largely have been ignored. To our knowledge, only one study in the medical literature reports on the use of design research in developing a guided self-help digital intervention for eating disorders (Nitsch et al., 2016). Greater attention to user-centered design in the development and implementation of technology-enabled services has potential to improve our capacity to increase the reach and engagement of eating disorder services.
The purpose of this paper is to present user-centered design methods that can be applied to designing technology-enabled services for eating disorders. We begin by reviewing overarching principles for designing technology-enabled services, and then discuss one model of the user-centered design process. We illustrate this process with a hypothetical case example that shows how user-centered design techniques can be applied to designing a technology-enabled service for patients with eating disorders to increase reach and engagement.
User-Centered Design
User-centered design is related to the field of human-computer interaction (HCI), an interdisciplinary specialty focused on understanding how people interact with technology and interact with other stakeholders through the use of technology. By understanding these interactions, HCI helps stakeholders be more effective and/or efficient when engaging in technology-based interactions. Broadly, HCI encompasses design, implementation, and evaluation. A critical component of HCI is understanding the usability, usefulness, and desirability of technology. Usability refers to whether a technology or service is easy to use, learn, and understand. Usefulness is whether a technology or service helps stakeholders achieve their goal or complete tasks. Desirability refers to whether the technology or service enhances stakeholder experiences, such as whether they perceive it as engaging, satisfying, enjoyable, helpful, and/or motivating. User-centered design is an approach to designing technologies and services that are usable, useful, and desirable to their intended stakeholders, by grounding the process in information from the stakeholders and relevant contexts.
Making services relevant to stakeholders means designing services that fit into the patterns and routines they already are doing, so that the technologies and services meet their needs, preferences, and goals (Mohr et al., 2018). A key principle is to keep design simple and with a clear purpose. Lyon and Koerner (2016) highlight seven design goals for evidence-based psychological treatments that promote simplicity and therefore usability: 1) learnability (can the intervention be easily learned/understood?); 2) efficiency (does using the intervention lower costs, time, or effort?); 3) memorability (can users remember and apply the intervention?); 4) error reduction (can the intervention prevent or quickly address errors or deviations from the intervention?); 5) satisfaction/reputation (is the intervention liked and perceived as valuable?); 6) low cognitive load (does the intervention involve limited steps?); and 7) exploit natural constraints (does the design account for context?).
In addition to simplicity, another principle for designing services that fit into stakeholders’ daily routines means designing technologies and services that are appropriate for use and leverage support in different contexts so that these services benefit individuals in the moments and contexts in which they are needed most. Typically, digital interventions are bundled as one multi-component tool. Although a comprehensive tool may provide convenience to users as a “one-stop-shop,” challenges with initial and sustained engagement persist. Recently, researchers and designers have argued for alternative approaches to these one-stop-shops in mental health, instead focusing on flexible use of existing apps alongside condition-specific apps (e.g., Chiauzzi & Newell, 2019). Given that eating disorder symptoms manifest across a variety of situations and contexts, creative approaches might be considered for delivering services via technology that support stakeholders in different situations and contexts. More specifically, we should consider how technologies and services can be leveraged across different settings (e.g., home, work), and be relevant to particular situations and contexts (e.g., in social outings, at meal-times) in which core eating disorder symptomatology manifests. For example, consider how apps are designed to support travel. People do not use one app for all their travel; instead, different apps are used for tracking flight information, looking at maps to navigate the local area, using local transportation (e.g., ride-share, public transport), checking the weather, and so forth. Some travel-related apps are specific to being away from home (e.g., flight tracking), whereas others are relevant at home and while away (e.g., maps, local transportation). Thus, even a unified service might be presented as different apps or products: e.g., a tool for booking flights and/or hotels, for navigating at the destination, for messaging. Designers and developers of services for people managing eating disorders might learn from this travel analogy, such as by creatively considering how best to support people across different contexts (e.g., at meal-times, which occur multiple times each day in different settings), while also providing support for specific situations like social outings involving food or when experiencing low mood. With that said, considerations for the disposition and symptomatology that are specific to individuals with eating disorders should not be ignored, such that the user-centered design perspective also has to integrate clinical knowledge into service design.
In the following section, we describe the user-centered design process and elaborate on how it can be applied to designing technology-enabled services for eating disorders.
The User-Centered Design Process
User-centered design is a cyclic, iterative process. Figure 2 shows one model of a user-centered design process, which depicts six phases. A product development team “owns” the design process, and stakeholders are involved in nearly every phase, not just at the beginning or end of the design period. For simplicity, we use the term “product” to refer to the thing (e.g., technology, service) being designed, “user” or “target user” to refer to the intended product user (e.g., a patient, a therapist or product coach), and “stakeholders” to refer to both the product users and other individuals who may be impacted by the product (e.g., a patient’s parents, siblings, treatment team). The start of the user-centered design process is to investigate the goals, needs, and preferences of target users and relevant stakeholders. Doing so then enables designers to ideate, in which concepts and ideas for a product design are generated. The next phase is to prototype options for a product design, which designers and stakeholders subsequently evaluate in an iterative process. Results from evaluations lead to the refine and develop phase, in which a working version of a product is made and refined. Stakeholders may continue to give feedback at this phase to inform final design modifications and improvements before the product is fully released. The last phase aims to validate the product design in practice. Stakeholders then engage with the product “in the wild,” generating knowledge and insights that inform future designs and iterations. As technologies improve and stakeholders’ interactions with technology change, the user-centered design process continues. Additionally, some phases may involve multiple within-cycle iterations, meaning there may be cycling between two phases before proceeding to the next phase. For example, prototyping and evaluation often have multiple iterations before the product design is sufficiently optimized to move to the refine and develop phase.
Figure 2.
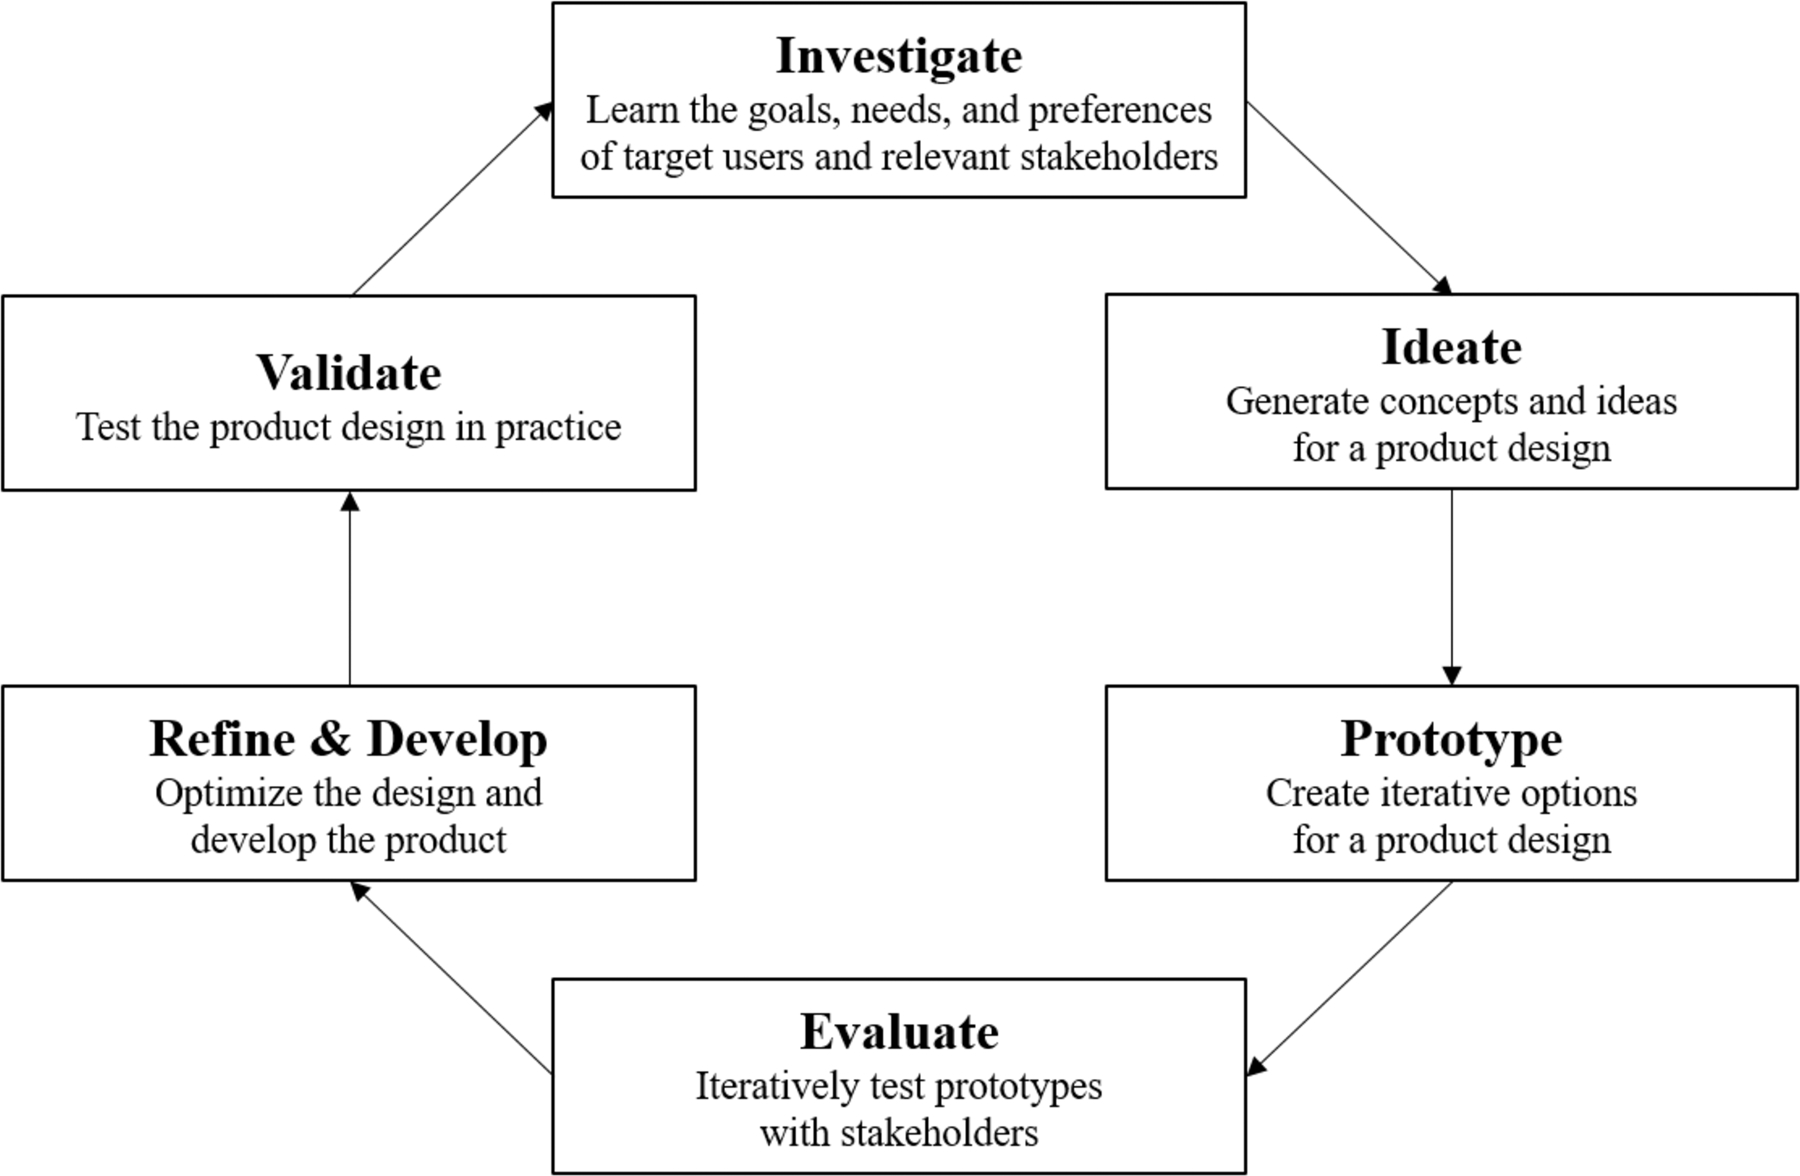
A model of the user-centered design process
In the next series of sections, we describe each of these phases in greater detail and present a recurring hypothetical case example that shows how user-centered design techniques can be applied to designing a technology-enabled service to address binge eating. The example shows how patients and therapists are engaged as target users in the design process. Table 1 provides definitions of user-centered design techniques, some of which are described in the case example. This is not an exhaustive list of user-centered design techniques, and each technique has benefits and limitations in how it can help answer a design research question. As will be demonstrated in the case example, decisions around which technique to use should be driven by the research question. Working with HCI experts can help research teams identify which techniques will be best suited to answering their research question. More details about design methods and techniques can be found at Martin and Hanington (2012).
Table 1.
User-centered design methods and techniques
| Technique | Description | Purpose |
|---|---|---|
| Phase I: Investigate | ||
| Artifact Analysis | Examine objects that are inherent to a product being designed, namely its physical appearance and how stakeholders interact with it | Understand an artifact’s properties, and its role or significance in various (e.g., social, cultural) contexts |
| Card-sorting | Stakeholders organize ideas into categories or groups that make meaningful sense to the organizer | Understand stakeholders’ preferences or understanding of a particular concept, or their ideas for how a product should be organized or navigated |
| Concept mapping | Create a visual depiction of the relationship between the research question a new design aims to address and the concepts that are related to it | Help designers understand and organize complex processes or relationships |
| Critical Incident Technique | Identify events in a workflow which stakeholders experience as particularly helpful or problematic to successfully using a product | Inform contexts for which a product can be particularly helpful, or features that can alleviate critical incidents |
| Design Ethnography | An immersive experience in which stakeholders are observed in their natural/typical context | Understand stakeholders’ experiences to inform how a product could improve that experience |
| Diary Studies | Stakeholders are prompted at different moments to share details about their experiences | Learn about stakeholders’ experiences in the context of their day-to-day life |
| Focus Groups | Moderated discussion amongst a group of stakeholders who are impacted by the research question | Gain insights into a group of stakeholders’ thoughts, feelings, experiences, wants, needs, and limitations |
| Image Boards | A collage of aesthetic imagery | Visually represent the style, experiences, stakeholders, or contexts that will be the focus of the product |
| Interviews | One-on-one discussion with a stakeholder, often involving a structured set of inquiries | Gain insights into stakeholders’ thoughts, feelings, experiences, wants, needs, and limitations |
| Personal Inventories | Stakeholders show and describe artifacts that are of personal significance in the context of their life | Understand the types of artifacts stakeholders need, use, and value |
| Photo studies | Stakeholders take pictures that show their experience with a particular problem area | Provide perspective into stakeholders’ experiences as they occur in their daily lives through pictures |
| Task Analysis | Identify the steps a stakeholder completes to perform a task, which can refer to mental or physical activities | Depict the relation between tasks, subtasks, decision points, and response cycles |
| Questionnaires | A measure with a series of items | Capture stakeholders’ perspectives |
| Phase II: Ideate | ||
| Design Charrette | A co-design process in which designers and stakeholders brainstorm designs in rotating small groups, allowing for idea collaboration and integration | Facilitate collaboration of ideas across stakeholders and designers to generate higher-level design concepts which fit stakeholders’ needs and preferences |
| Design Workshops | A process by which designers and stakeholders join together to “co-design” a product | Inform future designs through brainstorming ideas, organizing concepts, or creating drawings, collages, or prototypes that creatively express ideas or experiences |
| Personas | Character archetypes of different stakeholders who might engage with a product | Inform prototype designs and confirm that iterations of prototypes meet the goals of the various archetypes |
| Scenarios | A narrative that describes how different stakeholders would engage with a product | Inform prototype designs and confirm that iterations of prototypes stay consistent with their intended goals |
| Simulation Exercises | Designers approximate the experiences of stakeholders to experience empathy for stakeholders’ experiences | Inform insights into how certain features should be designed or integrated |
| Storyboards | A narrative showing a product’s use in a brief series of panels like a comic strip; includes images, brief narration, and progression through time | Demonstrate how stakeholders might interact with a product in its relevant context |
| Phase III: Prototype | ||
| Dark Horse Prototyping | Generate a “super” design solution that typically would have been ignored in the process because of its price, risk, or complexity to build | Push the boundaries of designers’ ideas to create a more optimal solution than might otherwise have been considered |
| Parallel Prototyping | After brainstorming a variety of prototypes, the best features from various designs are combined into one optimized design | Help designers avoid getting stuck on one prototype too early |
| Wizard of Oz | Simulate a fully functioning product by building a prototype through which interactions with stakeholders occur with a live person operating “out of sight” | Enable stakeholders to react to a prototype as though it had full functionality while saving time and money from building a fully functioning prototype |
| Phase IV: Evaluate | ||
| Cognitive Walk Through | Stakeholders are shown a product design and asked to demonstrate how they would use it based only on the cues and prompts provided by the product | Test the usability of the product’s interface by learning whether the order of prompts align with stakeholder expectations or perceptions of the experience |
| Desirability Testing | Stakeholders identify adjectives that describe, for example, the quality, appearance, and ease of use of prototypes | Understand how a prototype makes stakeholders feel to inform a design that elicits an optimal emotional response |
| Eye Tracking | Monitor where stakeholders look and do not look while interacting with a prototype | Inform aspects of the prototype that elicit fixation, although this technique cannot explain stakeholders’ reactions (e.g., emotional, comprehension) |
| Field Testing | Stakeholders engage with a prototype in the context in which the prototype is intended to work | Identify “bugs,” glitches, or usability problems prior to making the product available to all users |
| Heuristic Evaluation | Designers or domain experts evaluate prototypes for usability problems based on heuristics | Pragmatically identify usability problems based on a defined standard, rather than feeling and instinct |
| Think Aloud Protocol | Stakeholders are asked to talk out loud their thoughts, feelings, and actions while using a product or completing a task associated with the product | Observe the physical movements of the stakeholder while also learning what aspects of the product are perceived as easy to complete or difficult/confusing |
| Usability Testing | Stakeholders identify features that are not usable to inform necessary refinements and future designs | Confirm whether a prototype is usable, meaning easy to use, understand, learn, and/or remember |
Note: This list includes many but not all of the user-centered design techniques. More details are described elsewhere: (Bushnell, Steber, Matta, Cutkosky, & Leifer, 2013; Martin & Hanington, 2012).
We close this section by acknowledging some ethical considerations for conducting design research with sensitive populations, such as patients with mental health problems. Although user-centered design tends to underestimate diversity (Lyon & Koerner, 2016), careful attention must be paid to the potential for unwanted disclosure or loss of confidentiality in this process, as individuals with mental health problems may face stigma and other problems related to their illness. Reporting results from design research requires considerations such as how much potentially identifiable data are presented for each person (Ayers, Caputi, Nebeker, & Dredze, 2018; Bruckman, 2002; Fiesler & Proferes, 2018; Markham, 2012). The design team also should acknowledge that they bring their own biases and experiences to the design process; diverse teams can protect against potentially narrow ideas.
Finally, across both the fields of digital health and human-centered design, there is growing interest in limiting the “footprint” of digital technology, including the amount and types of online data trails created through use of technology and the attentional demands that technology places on users. Technology users are concerned about their privacy (Gandhi & Wang, 2015; Proudfoot et al., 2010; Shilton, 2009; Torous & Roberts, 2017). Many also are concerned about the amount of time they spend looking at a screen or using certain apps (e.g., Baumer et al., 2013; Ko et al., 2015).
Individuals designing and developing digital tools must proactively consider these challenges. The collaborative and iterative nature of user-centered design offers design teams a methodology to engage with stakeholders around “digital footprint” concerns. However, stakeholders often do not understand the risks associated with the data they track and share. Consequently, the design and research team must not merely react to stakeholder privacy concerns but also proactively work to identify, address, and communicate about potential risks (Hecht et al., 2018). Designers also must avoid techno-utopianism and ask when digital interventions truly offer benefits to stakeholders, by considering non-digital services and artifacts alongside digital counterparts. When combined with collaborative, user-centered design, this proactive skepticism about the limits and risks of technologies can lead to the design of tools that better help people meet their needs, across a range of contexts.
User-Centered Design Phase I: Investigate
It is imperative for individuals designing a technology-enabled service to learn what stakeholders want and how technology can fit into their lives. The Investigate phase aims to explore the needs, goals, and preferences of stakeholders to answer a research question about how a product design can address a problem or fill a gap to meet their needs. In this phase, the design team identifies the relevant stakeholders, and meets with or observes them to understand their experiences. As listed in Table 1, there are several user-centered design techniques that can be applied in this phase to learn about stakeholder experiences. Once data are gathered, qualitative and quantitative analyses are conducted to derive themes, organize information, and generate insights for designs, which are the focus of Phase II: Ideate.
Case Example
A team of researchers who comprise a product development team wants to design a scalable service for individuals with binge eating. Although the researchers have clinical expertise that informs which patient actions would likely lead to improvement, they have little understanding of how the population currently manages the problem. They also want to understand how binge eating affects patients’ day-to-day lives, to inform how a service can fit into patients’ daily routines.
To understand patients’ day-to-day experiences, the researchers implement a diary study in a sample of patients with binge eating. A diary study is a technique that provides insights into individuals’ daily experiences by prompting individuals to share details about their experiences related to a specific research question (Martin & Hanington, 2012). In this study, patients with binge eating were recruited to track, in an online portal, different experiences related to managing binge eating over two weeks. For the first week, the patients were asked to submit an entry when they experienced a moment, positive or negative, in which binge eating impacted their life (e.g., when they were experiencing an urge to engage in binge eating, after an episode of binge eating, or when they felt supported in making healthy changes). For each entry, patients were asked to describe the context of the moment, such as where they were, who they were with, what they were doing, and how they were feeling, as well as any precipitating triggers that prompted the moment to occur. The patients also uploaded a video describing or showing the moment and a relevant photograph, and reflected on the frequency with which they experienced similar moments. For the second week, patients submitted entries that provided details about the things and activities that were important or useful to them as part of their daily life when managing binge eating. Again, they submitted videos and photographs to describe the strategies they used and rated the level of importance of each strategy for managing binge eating.
From this study, the researchers learn that struggles with binge eating occur in a variety of contexts as patients shared their difficulties maintaining healthy patterns of eating. From the photos and videos, the researchers observe that patients were particularly vulnerable to negative moments at home in the evenings. A consistent theme around coping was that interacting with friends and family was helpful for managing binge eating, and these interactions were most commonly mediated by technology (e.g., talking on the phone or texting).
From the diary study entries, the researchers were interested in learning more about target user preferences for using technology to manage their binge eating. So, the researchers recruit a subset of the diary users for one-on-one interviews. They select the interview approach because it enables guided discussions and allows the researchers to follow up on participant responses. The researchers consider conducting a focus group, which might have been less time consuming to implement than one-on-one sessions, but decide against it given concerns about patients’ willingness to share sensitive or private details in a group setting.
In the interviews, patients are asked about technologies they have used to manage their binge eating. The researchers learn that some patients have used treatment apps to help with their binge eating, but responses were mixed regarding whether these app-based interventions were helpful. Some patients said they continued to monitor their eating using freely-available tracking apps. Patients also said that watching videos on social media (e.g., YouTube) or streaming music was helpful when distracting from urges to engage in binge eating.
Lastly, the researchers conduct a focus group with therapists who treat patients with binge eating disorder, as therapists are stakeholders who might represent another user of the technology-enabled service. The focus group aimed to elicit therapist needs and preferences for a service. The therapists said that they have limited capacity for treatment, often turning interested patients away from receiving services. They agreed that a service that extends capacity to support large groups of patients would be beneficial. Among the patients they do treat, the therapists find that patients struggle to sustain healthy behaviors between therapy sessions. The therapists suggested it would be helpful to have a service that supports patients more frequently than can be achieved in the standard once per week therapy session and that provides in-the-moment support preceding episodes of binge eating.
User-Centered Design Phase II: Ideate
After developing a thorough understanding of the problem, the next step in the design process is to brainstorm ideas for a solution (e.g., product). Such concept generation informs early prototype designs in Phase III. As will be described in the case example, it can be helpful to develop visual representations that demonstrate how stakeholders would interact with a product. The Ideate phase also can be accomplished in collaboration with stakeholders through elicitation sessions and co-design workshops, in which stakeholders draw an experience or solution that would help ameliorate their problem to inform prototype designs. Other techniques, like a love letter/break up letter (Martin & Hanington, 2012), can be used to identify stakeholder likes and dislikes for a particular product, which also can inform future designs.
Case Example
After completing the Investigate phase, the research team agrees that a mobile app seems like an acceptable and scalable medium to deliver a service that addresses binge eating. They also anticipate that using humans to provide coaching would be a good way to deliver support and keep users accountable to their behavioral goals, given users’ preference to engage with other people when managing their binge eating.
They begin brainstorming design ideas and host a design workshop with patient target users. In this workshop, the researchers collaborate with the patients to co-design (meaning design together) potential app designs, including working together to create drawings of ideal features that could be designed for the app. Through the co-design process, the researchers learn that patients want an app that will help them during challenging or triggering times related to binge eating. For example, the patients want an app that will help them engage in another, healthier activity just before a binge episode; reduce negative self-talk about their bodies; and make appropriate choices for meals and snacks. The patients make drawings of potential app features that could assist them in these situations. For example, one user draws an app with pop-up notifications that come on the screen when he has an urge to engage in binge eating, prompting him to make a healthier choice. Another person draws a picture of a helper who goes with her throughout the day to keep her accountable to engaging in planned behaviors that will help her manage her binge eating.
Based on elicitations from target users in the workshop, the researchers create three different storyboards to prompt design ideas and a discussion about the app amongst the research team. Storyboards use multi-panel comic-like strips that show brief scenarios and progression through time to provide visual representations of how stakeholders would interact with a product in particular contexts (Martin & Hanington, 2012). The first storyboard depicts an individual engaging with the app to prevent a binge episode. In the first panel, the user is in the kitchen with an urge to engage in a binge episode and opens the app for support. The second panel shows the app providing a recommendation for two alternative activities (i.e., calling a friend or taking a walk) with space to type in an idea of their own, and offering a pre-populated motivational comment from a coach about the user’s ability to avoid binge eating. The sketch shows the user selecting one of the two activities. The storyboard ends with a panel showing the user in the living room talking on the phone with his friend. The second storyboard shows an individual struggling with feelings about her body while deciding on clothes to wear before a friend’s party. The first panel shows the user looking in her bedroom mirror, and a thought-bubble shows an inner dialogue involving negative thoughts about her body and debating whether to cancel going to the party. The second panel shows the user looking at the app, which contains a picture showing other things she values about herself besides how she looks. Below the picture are prompts that helps the user restructure her negative thoughts with a more realistic impression. The final panel shows the user smiling while walking out the bedroom door. The third storyboard depicts how the app can help users make healthy choices at meal-times. The first panel shows the user reading a menu while at a restaurant. The user’s thought bubble shows her thinking that she wants to order the sandwich because it will be filling and she is very hungry, but feels anxious to order anything besides a salad in front of her friends. The second panel shows the user reviewing her food tracking log on her app. The screen shows what the user logged for breakfast and has a calendar reminder for a work dinner that is happening much later that evening. The user is typing “salad” in the space to log lunch, and the app has a pop-up notification asking the user to answer the question, “Is that enough to eat for lunch today?” The third panel shows the user telling the waiter she would like to order the sandwich. Based on these three storyboards, the researchers decide that it would be helpful to create an app with different, clearly labeled modules that can help users in these different contexts.
The researchers also meet with therapists to design how the service will be delivered. They host a design charrette, in which the designers and therapists meet in small groups in one room to sketch ideas, and some members of each group rotate after an allotted time to cross-pollinate ideas across groups and generate higher-level design concepts. By the end of the session, the group has narrowed in on designs in which support is delivered to patients via text messaging through a coaching dashboard that enables therapists to manage a cohort of users.
User-Centered Design Phase III: Prototype
In the Prototype phase, product designs are created. Prototypes represent evolving design options for possible end-products, and they provide the means by which designers identify problems and examine solutions (Houde & Hill, 1997). The focus should be on the prototype’s purpose, which drives the creation of prototypes that represent the role, look and feel, and implementation of the product (Houde & Hill, 1997).
Prototypes can vary by level of complexity and fidelity, meaning how closely the prototype matches the anticipated end-product. Prototypes can take multiple forms, including using mediums that may not relate to the intended end-product. For example, post-it notes on a poster board may be a valuable prototype if they communicate the layout and organization of app features within the interface. It is most advantageous to begin with the simplest possible design, which saves time and money. Minimally viable products (“MVPs”) help designers evaluate prototypes without devoting substantial resources to design a product that ultimately might be rejected. Early on in the Prototype phase, it can be helpful to design multiple prototypes for stakeholders to evaluate.
Case Example
The research team creates several prototypes of the app. One set of prototypes focuses on the look and feel of the app, and thus shows different layouts for the app interface (e.g., how the content and features are organized on the app screens). In the earliest phase, the researchers use a poster board to show the designs, whereas in future iterations, they use wireframes that mimic the interface design on a computer-based but non-working template. Another set of prototypes focuses on the role of the app, meaning its function and how it will be helpful to users. These designs present different types of content and features that might be included. Based on their formative evaluations with stakeholders, these prototypes show content for delivering psychoeducation, for helping patients set goals, for symptom self-tracking, and for interacting with a coach. Finally, the researchers create prototypes, again using images on a poster board, that show how two key app features will be implemented/delivered. They design two different prototypes for delivering psychoeducational content: one that shows all of the content released once the app is downloaded, and another prototype where content becomes available over time. They also design two strategies for engaging with a coach via text messaging; in one prototype, messages from the coach are presented within the app, and in the other prototype, users send and receive messages from their phones’ standard text message app.
A prototype of the coaching dashboard interface also is created using wireframes on a computer screen. On the left side of the screen are a list of a coach’s active users, with a color-coded notification system showing users’ activity within the app and indicating if users have sent the coach messages. On the right side of the screen is a list of tasks that the coach needs to complete that day. Across the top of the screen is a menu of resources, including the service protocol, materials for users (e.g., list of referral resources), assessment guides, and safety procedures. In the center of the screen is a selected user’s app usage chart and text message history, with a text box to compose and send new messages. Clicking through the wireframes shows how a coach would navigate through different screens within the dashboard interface.
User-Centered Design Phase IV: Evaluate
Once prototypes are designed, it is critical to subject them to evaluative research with stakeholders to inform their refinement and future deployment (Phases V and VI). Evaluative research aims to determine whether the product is usable (e.g., is it easy to learn and easy to use?); useful (i.e., does it support users in meeting their goals and completing their tasks?); and desirable (e.g., does it enhance the user experience?). The goal is to learn the aspects of the prototype(s) that work well and the aspects that should be revised. To this end, the Prototype and Evaluation phases will be iterative: as stakeholders provide feedback on initial designs, prototypes become revised, evaluated, and revised again. Stakeholder evaluation can occur in a variety of settings, such as in-person in laboratory-based research settings (high internal validity), online using crowdsourcing methods, or in the field (high external validity).
Case Example
Now that prototypes are designed, the research team evaluates them with stakeholders. First, they perform a heuristic evaluation with other designers. A heuristic evaluation is a peer-review method for evaluating prototypes for usability problems based on heuristics such as user control, consistency, aesthetic, flexibility/efficiency, and helpfulness (Martin & Hanington, 2012). The heuristics represent a set of “best practices” for usability to which the prototypes should adhere. Peer review is a quick, helpful strategy to easily catch avoidable problems (Boehm & Basili, 2001). The prototypes are revised based on the feedback from other designers.
Then, the researchers invite patients to the laboratory to view the prototype designs. The researchers use the think-aloud protocol to learn user reactions while viewing the designs. The think aloud protocol is a method in which users are asked to talk out loud their thoughts, feelings, and actions while using a product or completing a task associated with the product (Martin & Hanington, 2012). This approach allows designers to learn the prototype features that are perceived as easy to complete versus confusing. In the first usability testing session, patients review the prototype of the app interface on the poster board and voice their thoughts as they look at the board features. The researchers quickly learn that the location of the menu button elicits confusion. The poster board shows an interface that includes a task bar along the bottom of the screen with a menu button that can be pushed to reveal navigation options within the app. However, multiple users indicate that they expected the menu button to be in a top corner based on their experiences using other apps. The researchers move the post-it note representing the menu button to the top of the board, and no future testers voice concerns about this feature.
The researchers also present their four prototypes of psychoeducation delivery options and messaging features. Patients indicate a preference for psychoeducation content to be delivered over time, rather than all at once, as this would create a novel experience each week and excite them to return to the app. Patients add to the design by suggesting the app send a pop-up notification when new content becomes available, which the researchers incorporate into a revised prototype. Patients unanimously indicate that they want to send and receive text messages in their standard app on their phone, rather than going into the service app for this purpose. They say this would be more helpful to them and would make the process easier for engaging with their coach. The researchers question the users further about whether this would result in a disjointed experience by having to use multiple apps for the service. Users do not think this would create confusion and reiterate their belief that it would be preferred since it matches how they already use text messaging.
As noted in the Prototype phase, following this first usability testing session, the researchers create wireframes on a computer to show how the app interface would look on the phone screen. They also consult with software programmers to ensure that the designed features can be programmed within their available budget. Then the researchers invite a new set of patients to the laboratory to review the frames and observe as they click through the screens. The researchers use the think aloud protocol again and observe the patients accurately navigate through different app features, such as reviewing content, completing a self-monitoring log, and responding to a pop-up notification.
Patient feedback corroborates the researchers’ observations, as users remark that these tasks are easy to understand and complete. However, users give feedback that the large text size causes them to scroll tediously down the pages. A quick change to reduce the font on one of the wireframes allows the researchers to learn quickly that this generates a more favorable reaction. In an effort to proactively mitigate risks associated with data sharing, the researchers ask users about concerns they might have regarding the data they input into the self-monitoring log. Users indicate that they are reluctant to regularly share their data with their therapists, and they question whether other stakeholders will have access to this information. Users indicate that they are comfortable having the app inform the therapist that a daily log was completed, but prefer to control whether specific content is shared. The researchers suggest adding a feature that allows the user to “share with therapist” a particular episode or day’s entry from the log. Users also suggest the feature could include a drop-down menu that allows the user to “share with someone else” and specify the contact, so that control over data sharing remains with the user. The users agree that this feature would alleviate their privacy concerns about completing a self-monitoring log, and make it more likely that they would regularly utilize the log. Additionally, the researchers probe whether the intervention should include a self-monitoring feature within the app, or whether it would be preferred to have the app encourage users to self-monitor on their own (e.g., in a journal using paper and pencil), so that these data are not captured within the app. The users indicate that it will be preferred to monitor within the app.
At the end of the testing session, the researchers interview the patients to assess their overall impressions of the service design. Patients also complete two questionnaires assessing usability: the System Usability Scale (a 10-item measure of usability; Bangor, Kortum, & Miller, 2008; Brooke, 1996) and the USE Scale (a 30-item measure of usefulness, satisfaction, ease of use, and ease of learning; Lund, 2001).
A similar usability testing session is implemented with therapists so they can navigate through a wireframe of the coaching dashboard. The therapists say that they like the interface and the ability to sort users based on app usage. They are surprised that the dashboard does not have space to write notes about each user and suggest this feature for the design. They also like the layout of the text messaging interface. However, the researchers observe that therapists have to switch screens between the text messaging box and service protocol to read, copy, and send recommended messages to patients. The researchers realized that therapists’ workflow would be more efficient if therapists had templates that could be easily accessed from the text message section, rather than switching back to the home-screen that housed the service protocol.
User-Centered Design Phase V: Refine & Develop
As the name suggests, in this phase, the prototype design is refined based on data from the Evaluation phase and developed into a fully functioning product. Summative evaluation informs minor refinements before confirming the product is ready for validation (Phase VI).
Case Example
With the Evaluation phase complete, the researchers settle on final designs for the app and coaching dashboard. Programmers create working versions of the technologies. To ensure the app and dashboard fully function in practice, the researchers perform a summative evaluation by having team members and stakeholders use the app and dashboard for a week in a field test. The field test aims to ensure the product works in its intended context(s) and to identify any “bugs” or glitches, prior to making final developments and being released (Martin & Hanington, 2012). The stakeholders log their feedback throughout the week. The researchers finalize the design and correct any final problems before it is fully released.
User-Centered Design Phase VI: Validate
The last phase of the user-centered design process is to validate the product in practice and confirm stakeholders engage with the product. Mixed methods approaches can be effective for assessing whether the technology or service is useful, usable, and desirable. Questionnaires and use analytics (e.g., via passively collected use metrics from the technology) provide quantitative data on stakeholder perceptions of the service and their engagement with it. These findings can be strengthened by stakeholder feedback from qualitative methods like interviews and observations (e.g., of workflow operations to assess improvements in efficiency). HCI also emphasizes anticipating and evaluating the negative impacts of a new technology or service (Hecht et al., 2018). For example, researchers might assess whether the service interrupts workflow or substantially burdens stakeholders, or whether stakeholders rely too much on the technology rather than using it as tool to support attaining a goal. Additionally, depending on the stakeholders, validation of a technology-enabled service may include an evaluation of other distal clinical and implementation outcomes, such as changes in patients’ symptoms and the impact on costs of care (Hermes, Lyon, Schueller, & Glass, 2019).
Case Example
Once the service is ready for deployment, the research team tests it with stakeholders. Patients who struggle with binge eating are invited to participate in the service. The researchers assess patients’ engagement with the app by monitoring app usage statistics, such as frequency of app use and number of modules opened. Patients also complete the System Usability Scale (Bangor et al., 2008; Brooke, 1996) and the USE Scale (Lund, 2001). The researchers observe therapists’ workflow to see how the dashboard facilitates interacting with app users and enables coaches to manage a cohort. Therapists complete the Job Satisfaction Survey (Spector, 1985) to measure their satisfaction engaging with the service.
Optimizing Technology-Enabled Services over Time
Designing technology-enabled services must account for ongoing iteration of the technology and service over time. As stakeholders engage with the service and develop new interactions with technology, new problems and ideas for improvements will surface. Ongoing application of the user-centered design process ensures the technologies and services adapt to stakeholders’ needs and maintain their relevance to clinical and technological innovations (Mohr et al., 2018). Mohr and colleagues (2017) have developed the Accelerated Creation to Sustainment (ACTS) model, which highlights the importance of iterative design throughout the implementation of digital mental health interventions in order to successfully sustain a technology-enabled service in clinical practice.
Case Example
During the Validation phase, the researchers notice that patients’ app use substantially declines after four weeks. The researchers conduct one-on-one usability sessions and learn that patients forget to use the app after a few weeks. The researchers ask patients whether push notification and therapist reminders would be helpful, and the users agree. Interviews with therapists also reveal that the service protocol does not specify how to address declines in patient app use, so therapists have stopped texting users after one week of no app use.
The researchers design two different wireframe prototypes of notification strategies for the app (i.e., daily push notifications versus twice-weekly push notifications). Then they meet with a few patients to assess user preferences for the push notification designs, and subsequently settle on twice-weekly notification reminders. They also work with the therapists to revise the service protocol. Through co-design sessions with therapists, they change the service protocol to increase the frequency of messages from once to twice per week and offer inactive users a check-in phone call to help them reengage with the service. The researchers implement these changes into the service. They monitor app use and see that app use improves after week four.
Summary
In this review, we presented a model that includes six commonly used phases for user-centered design. Our hypothetical case example utilized several of the many methods and techniques available for this work. Most techniques can be implemented relatively quickly, allowing us to rapidly learn what stakeholders want and to identify problems before devoting time and resources to developing and delivering technologies and services. It is significantly less expensive to identify and remedy problems before a technology is developed and delivered than after, and many problems are avoidable if given adequate attention (Boehm & Basili, 2001). As such, there is great advantage to up-front efforts to identify problems before deployment rather than spending time and resources on “rework.”
Relation to Clinical Research
As has been described, user-centered design has great applicability to clinical research efforts. Clinical researchers considering this methodology are encouraged to (a) account for design activities in research project timelines; (b) include team members with relevant expertise as collaborators; (c) budget for costs to update the technologies or services based on user preferences, needs, or identified problems; and (d) budget for costs to recruit and engage target users in design activities. With that said, design activities do not require large cohorts of participants. For example, usability testing often can be accomplished sufficiently with ten participants, as ten people typically identify 95% of usability problems (Faulkner, 2003).
The amount of time needed for design activities depends on the design question(s). Individual design activities can be conducted relatively easily and rapidly, especially if researchers have access to the target population. Qualitative analyses can take time, although the level of detail can depend on the goal of the analysis. For instance, academically-focused researchers may conduct detailed qualitative analyses to generate transferable insights and develop theory, whereas industry partners may seek to generate high-level insights that inform designs and involve less detailed analysis. Thus, depending on the goal of the analysis, clinical researchers who engage in design activities solely for clinical/implementation purposes may not need as detailed qualitative analyses, allowing for a more rapid process.
However, despite the emphasis on the rapidity with which these methodologies can be applied, clinical researchers need to be aware of how these activities fit within the timeline and funding allowances of various research endeavors. For example, in a clinical trial evaluating the efficacy of a digital intervention, funding agencies may require the intervention be developed and piloted before the trial is funded. As such, design work to inform intervention development may need to occur before the funding period, whereas ongoing design work during the trial (e.g., to ensure the intervention remains relevant to the needs of target users and/or the implementation setting; Mohr, Cheung, Schueller, Hendricks Brown, & Duan, 2013; Mohr, Lyon, et al., 2017) could be included during the funding period. Conversely, in a trial to evaluate the effectiveness of the intervention in a real-world setting (e.g., an implementation trial) or to evaluate the efficacy of the intervention in a new patient population, an important but often neglected design activity is adapting the intervention to the setting or target population prior to deployment (Lyon & Bruns, 2018; Lyon & Koerner, 2016). In these scenarios, design activities to adapt the intervention may comprise the first phase (e.g., first six months) of the funding period.
Conclusions
Despite the growing evidence-base for technology-enabled services for eating disorders, these services have limited reach and suboptimal engagement. To rectify these problems, we need to design services that fit into the daily lives of the stakeholders who use them. User-centered design is an approach that grounds information about design in the stakeholders and contexts in which technologies and services will be implemented. It is an iterative process that involves stakeholders throughout, enabling rapid learning towards ongoing optimization. By integrating user-centered design within a research agenda for technology-enabled services for eating disorders, we have the potential to improve the reach, engagement, and subsequently, impact of these services across the various settings in which they are implemented.
Acknowledgments
This work was supported a grant from the National Institute of Diabetes and Digestive and Kidney Diseases (K01 DK116925).
Footnotes
Availability of Data Statement: Data sharing is not applicable to this article as no new data were created or analyzed in this study.
References
- Altman M, Huang TTK, & Breland JY (2018). Design Thinking in Health Care. Prev Chronic Dis, 15, E117. doi: 10.5888/pcd15.180128 [DOI] [PMC free article] [PubMed] [Google Scholar]
- Arean PA, Hallgren KA, Jordan JT, Gazzaley A, Atkins DC, Heagerty PJ, & Anguera JA (2016). The Use and Effectiveness of Mobile Apps for Depression: Results From a Fully Remote Clinical Trial. J Med Internet Res, 18(12), e330. doi: 10.2196/jmir.6482 [DOI] [PMC free article] [PubMed] [Google Scholar]
- Ayers JW, Caputi TL, Nebeker C, & Dredze M (2018). Don’t quote me: reverse identification of research participants in social media studies. Npj Digital Medicine, 1 10.1038/s41746-018-0036-2 [DOI] [PMC free article] [PubMed] [Google Scholar]
- Bangor A, Kortum PT, & Miller JT (2008). An empirical evaluation of the System Usability Scale. International Journal of Human-Computer Interaction, 24(6), 574–594. doi: 10.1080/10447310802205776 [DOI] [Google Scholar]
- Bauer S, & Moessner M (2013). Harnessing the power of technology for the treatment and prevention of eating disorders. Int J Eat Disord, 46(5), 508–515. doi: 10.1002/eat.22109 [DOI] [PubMed] [Google Scholar]
- Baumer EPS, Adams P, Khovanskaya VD, Liao TC, Smith ME, Sosik VS, & Williams K (2013). Limiting, leaving, and (re)lapsing: an exploration of facebook non-use practices and experiences. Paper presented at the Proceedings of the SIGCHI Conference on Human Factors in Computing Systems, Paris, France. [Google Scholar]
- Boehm B, & Basili VR (2001). Software defeat reduction top 10 list. Computer, 34(1), 135–137. doi:Doi 10.1109/2.962984 [DOI] [Google Scholar]
- Brooke J (1996). SUS: A “quick and dirty” usability scale In Jordan PW, Thomas B, Weerdmeester BA, & McClelland IL (Eds.), Usability evaluation in industry (pp. 189–194). London: Taylor & Francis. [Google Scholar]
- Bruckman A (2002). Studying the amateur artist: A perspective on disguising data collected in human subjects research on the Internet. Ethics and Information Technology, 4(3), 217–231. doi: 10.1023/a:1021316409277 [DOI] [Google Scholar]
- Bushnell T, Steber S, Matta A, Cutkosky M, & Leifer L (2013, 4–6th September 2013). Using a “dark horse” prototype to manage innovative teams. Paper presented at the 3rd Int. Conf. on Integration of Design, Engineering, & Management for Innovation, Porto, Portugal. [Google Scholar]
- Chiauzzi E, & Newell A (2019). Mental Health Apps in Psychiatric Treatment: A Patient Perspective on Real World Technology Usage. JMIR Ment Health, 6(4), e12292. doi: 10.2196/12292 [DOI] [PMC free article] [PubMed] [Google Scholar]
- Faulkner L (2003). Beyond the five-user assumption: benefits of increased sample sizes in usability testing. Behav Res Methods Instrum Comput, 35(3), 379–383. [DOI] [PubMed] [Google Scholar]
- Fiesler C, & Proferes N (2018). “Participant” Perceptions of Twitter Research Ethics. Social Media + Society, 4(1), 10.1177/2056305118763366 [DOI] [Google Scholar]
- Fitzsimmons-Craft EE, Balantekin KN, Eichen DM, Graham AK, Monterubio GE, Sadeh-Sharvit S, … Wilfley DE (Under review). Screening and Offering Online Programs for Eating Disorders: Reach, Pathology, and Differences Across Risk Groups at 28 U.S. Universities. [DOI] [PMC free article] [PubMed]
- Fitzsimmons-Craft EE, Firebaugh ML, Graham AK, Eichen DM, Monterubio GE, Balantekin KN, … Wilfley DE (2018). State-wide university implementation of an online platform for eating disorders screening and intervention. Psychol Serv. doi: 10.1037/ser0000264 [DOI] [PMC free article] [PubMed] [Google Scholar]
- Gandhi M, & Wang T (2015). Rock Health Report: “Digital Health Consumer Adoption: 2015”. Retrieved from https://rockhealth.com/reports/digital-health-consumer-adoption-2015/
- Gilbody S, Littlewood E, Hewitt C, Brierley G, Tharmanathan P, Araya R, … Team R (2015). Computerised cognitive behaviour therapy (cCBT) as treatment for depression in primary care (REEACT trial): large scale pragmatic randomised controlled trial. BMJ, 351, h5627. doi: 10.1136/bmj.h5627 [DOI] [PMC free article] [PubMed] [Google Scholar]
- Hecht B, Wilcox L, Bigham JP, Schöning J, Hoque E, Ernst J, … Wu C (2018). It’s Time to Do Something: Mitigating the Negative Impacts of Computing Through a Change to the Peer Review Process. ACM Future of Computing Blog. Retrieved from https://acm-fca.org/2018/03/29/negativeimpacts/ [Google Scholar]
- Hermes ED, Lyon AR, Schueller SM, & Glass JE (2019). Measuring the Implementation of Behavioral Intervention Technologies: Recharacterization of Established Outcomes. J Med Internet Res, 21(1), e11752. doi: 10.2196/11752 [DOI] [PMC free article] [PubMed] [Google Scholar]
- Hermes ED, & Rosenheck RA (2016). Implementing Computer-Based Psychotherapy Among Veterans in Outpatient Treatment for Substance Use Disorders. Psychiatr Serv, 67(2), 176–183. doi: 10.1176/appi.ps.201400532 [DOI] [PubMed] [Google Scholar]
- Houde S, & Hill C (1997). What Do Prototypes Prototype? In Helander M, Landauer T, & Prabhu P (Eds.), Handbook of Human-Computer Interaction (2nd ed.). Amsterdam: Elsevier Science B. V. [Google Scholar]
- Kass AE, Balantekin KN, Fitzsimmons-Craft EE, Jacobi C, Wilfley DE, & Taylor CB (2017). The economic case for digital interventions for eating disorders among United States college students. Int J Eat Disord, 50(3), 250–258. doi: 210.1002/eat.22680. Epub 22017 Feb 22682. [DOI] [PMC free article] [PubMed] [Google Scholar]
- Ko M, Yang S, Lee J, Heizmann C, Jeong J, Lee U, … Chung K-M (2015). NUGU: A Group-based Intervention App for Improving Self-Regulation of Limiting Smartphone Use. Paper presented at the Proceedings of the 18th ACM Conference on Computer Supported Cooperative Work & Social Computing, Vancouver, BC, Canada. [Google Scholar]
- Kujala S (2003). User involvement: A review of the benefits and challenges. Behaviour & Information Technology, 22(1), 1–16. doi: 10.1080/01449290301782 [DOI] [Google Scholar]
- Kushniruk A, & Nohr C (2016). Participatory Design, User Involvement and Health IT Evaluation. Stud Health Technol Inform, 222, 139–151. [PubMed] [Google Scholar]
- Lindenberg K, Moessner M, Harney J, McLaughlin O, & Bauer S (2011). E-health for individualized prevention of eating disorders. Clin Pract Epidemiol Ment Health, 7, 74–83. doi: 10.2174/1745017901107010074 [DOI] [PMC free article] [PubMed] [Google Scholar]
- Localytics. (2017). 24% of users abandon an app after one use. Retrieved from http://info.localytics.com/blog/24-of-users-abandon-an-app-after-one-use
- Lund AM (2001). Measuring usability with the USE questionnaire. Usability Interface, 8(2), 3–6. [Google Scholar]
- Lyon AR, & Bruns EJ (2018). User-Centered Redesign of Evidence-Based Psychosocial Interventions to Enhance Implementation-Hospitable Soil or Better Seeds? JAMA Psychiatry. doi: 10.1001/jamapsychiatry.2018.3060 [DOI] [PubMed] [Google Scholar]
- Lyon AR, & Koerner K (2016). User-Centered Design for Psychosocial Intervention Development and Implementation. Clin Psychol (New York), 23(2), 180–200. doi: 10.1111/cpsp.12154 [DOI] [PMC free article] [PubMed] [Google Scholar]
- Maguire M (2001). Methods to support human-centred design. International Journal of Human-Computer Studies, 55(4), 587–634. doi: 10.1006/ijhc.2001.0503 [DOI] [Google Scholar]
- Markham A (2012). Fabrication as ethical practice: Qualitative inquiry in ambiguous Internet contexts. Information, Communication & Society, 15(3), 334–353. doi: 10.1080/1369118X.2011.641993 [DOI] [Google Scholar]
- Martin B, & Hanington B (2012). Universal Methods of Design. Beverly, MA: Rockport Publishers. [Google Scholar]
- McCurdie T, Taneva S, Casselman M, Yeung M, McDaniel C, Ho W, & Cafazzo J (2012). mHealth consumer apps: the case for user-centered design. Biomed Instrum Technol, Suppl, 49–56. doi: 10.2345/0899-8205-46.s2.49 [DOI] [PubMed] [Google Scholar]
- Melioli T, Bauer S, Franko DL, Moessner M, Ozer F, Chabrol H, & Rodgers RF (2016). Reducing eating disorder symptoms and risk factors using the internet: A meta-analytic review. Int J Eat Disord, 49(1), 19–31. doi: 10.1002/eat.22477 [DOI] [PubMed] [Google Scholar]
- Moessner M, & Bauer S (2017). Maximizing the public health impact of eating disorder services: A simulation study. Int J Eat Disord, 50(12), 1378–1384. doi: 10.1002/eat.22792 [DOI] [PubMed] [Google Scholar]
- Mohr DC, Cheung K, Schueller SM, Hendricks Brown C, & Duan N (2013). Continuous evaluation of evolving behavioral intervention technologies. Am J Prev Med, 45(4), 517–523. doi: 10.1016/j.amepre.2013.06.006 [DOI] [PMC free article] [PubMed] [Google Scholar]
- Mohr DC, Lyon AR, Lattie EG, Reddy M, & Schueller SM (2017). Accelerating Digital Mental Health Research From Early Design and Creation to Successful Implementation and Sustainment. J Med Internet Res, 19(5), e153. doi: 10.2196/jmir.7725 [DOI] [PMC free article] [PubMed] [Google Scholar]
- Mohr DC, Riper H, & Schueller SM (2018). A Solution-Focused Research Approach to Achieve an Implementable Revolution in Digital Mental Health. JAMA Psychiatry, 75(2), 113–114. doi: 10.1001/jamapsychiatry.2017.3838 [DOI] [PubMed] [Google Scholar]
- Mohr DC, Weingardt KR, Reddy M, & Schueller SM (2017). Three Problems With Current Digital Mental Health Research … and Three Things We Can Do About Them. Psychiatr Serv, 68(5), 427–429. doi: 10.1176/appi.ps.201600541 [DOI] [PMC free article] [PubMed] [Google Scholar]
- Nitsch M, Dimopoulos CN, Flaschberger E, Saffran K, Kruger JF, Garlock L, … Jones M (2016). A Guided Online and Mobile Self-Help Program for Individuals With Eating Disorders: An Iterative Engagement and Usability Study. J Med Internet Res, 18(1), e7. doi: 10.2196/jmir.4972 [DOI] [PMC free article] [PubMed] [Google Scholar]
- Owen JE, Jaworski BK, Kuhn E, Makin-Byrd KN, Ramsey KM, & Hoffman JE (2015). mHealth in the Wild: Using Novel Data to Examine the Reach, Use, and Impact of PTSD Coach. JMIR Ment Health, 2(1), e7. doi: 10.2196/mental.3935 [DOI] [PMC free article] [PubMed] [Google Scholar]
- Proudfoot J, Parker G, Hadzi Pavlovic D, Manicavasagar V, Adler E, & Whitton A (2010). Community attitudes to the appropriation of mobile phones for monitoring and managing depression, anxiety, and stress. J Med Internet Res, 12(5), e64. doi: 10.2196/jmir.1475 [DOI] [PMC free article] [PubMed] [Google Scholar]
- Quanbeck A, Gustafson DH, Marsch LA, Chih MY, Kornfield R, McTavish F, … Shah DV (2018). Implementing a Mobile Health System to Integrate the Treatment of Addiction Into Primary Care: A Hybrid Implementation-Effectiveness Study. J Med Internet Res, 20(1), e37. doi: 10.2196/jmir.8928 [DOI] [PMC free article] [PubMed] [Google Scholar]
- Shaw RJ, Steinberg DM, Bonnet J, Modarai F, George A, Cunningham T, … Bosworth HB (2016). Mobile health devices: will patients actually use them? J Am Med Inform Assoc, 23(3), 462–466. doi: 10.1093/jamia/ocv186 [DOI] [PMC free article] [PubMed] [Google Scholar]
- Shilton K (2009). Four billion little brothers?: privacy, mobile phones, and ubiquitous data collection. Commun. ACM, 52(11), 48–53. doi: 10.1145/1592761.1592778 [DOI] [Google Scholar]
- Spector PE (1985). Measurement of human service staff satisfaction: development of the Job Satisfaction Survey. American Journal of Community Psychology, 13(6), 693–713. [DOI] [PubMed] [Google Scholar]
- Taylor CB, Graham AK, Flatt RE, & Fitzsimmons-Craft EE (Under review). Current state of scientific evidence on Internet-based interventions for the treatment of depression, anxiety, eating disorders, and substance abuse: An overview of systematic reviews and meta-analyses. European Journal of Public Health. [DOI] [PMC free article] [PubMed] [Google Scholar]
- Torous J, Nicholas J, Larsen ME, Firth J, & Christensen H (2018). Clinical review of user engagement with mental health smartphone apps: evidence, theory and improvements. Evid Based Ment Health, 21(3), 116–119. doi: 10.1136/eb-2018-102891 [DOI] [PMC free article] [PubMed] [Google Scholar]
- Torous J, & Roberts LW (2017). Needed Innovation in Digital Health and Smartphone Applications for Mental Health: Transparency and Trust. JAMA Psychiatry, 74(5), 437–438. doi: 10.1001/jamapsychiatry.2017.0262 [DOI] [PubMed] [Google Scholar]