

Abstract
Glycosylation is a ubiquitous post-translational modification that decorates proteins and lipids with glycans. These glycans can play critical roles in regulating biological events, and therefore, the discovery of strategies that target these molecules represent an important advancement toward understanding and controlling glycan-mediated cellular phenotypes. We describe the use of a small molecule, surfen, to temporarily silence the functions mediated by heparan sulfate glycosaminoglycans in mouse embryonic stem cells. Surfen binds heparan sulfate to antagonize growth factor interactions, thereby inhibiting signal transduction events that lead to differentiation. The strategies outlined in this chapter allow the characterization of resulting antagonistic effects caused by glycan-small molecule binding events toward maintaining embryonic stem cell pluripotency, curbing differentiation, and inhibiting signaling events.
1. Introduction: Glycosylation as a post-translational modification and proteoglycans
Glycosylation, likely the most common post-translational modification (PTM), is the enzymatic process in which proteins or lipids are conjugated to a carbohydrate molecule. It is estimated that >50% of the human proteome is glycosylated, and these modifications can have diverse effects on fundamental biological processes. Glycosylation can affect protein stabilization, trafficking, and function (O’Connor & Imperiali, 1996). Although grouped as PTMs, glycosylation can also occur co-translationally. The glycans attached can encompass a broad range of sizes, spanning a single (e.g., O-GlcNAc) to a few hundred (e.g., glycosaminoglycans) monosaccharides. Glycosylation is notorious for introducing tremendous chemical diversity, as a single protein glycosylation site can exist as multiple glycoforms. Despite this multiplicity, however, glycosylation is a finely-tuned process that is essential for life, and mutations that cause a lack or excess of glycans can have dramatic consequences, resulting in disease or lethality (Hennet & Cabalzar, 2015; Kanagawa, 2019).
Proteoglycans are an important class of transmembrane protein glycoconjugates found on cell surfaces (Iozzo & Schaeffer, 2015). Structurally, proteoglycans are composed of a core protein, which contains three to four specific sites for glycosylation (Fig. 1A) with glycosaminoglycans (GAGs, formerly called mucopolysaccharides) that can be sulfated at various positions (e.g., N-, 2O-, 6O-) along the carbohydrate chain (Fig. 1B). Different sulfation patterns can encode binding specificity for different growth factors such as FGF2 (Fibroblast Growth Factor 2). Thus, proteoglycans often serve as co-receptors for growth factors and their cognate receptors, and the formation of this ternary complex results in the activation of signaling pathways and corresponding changes in cellular phenotype, such as cellular differentiation. GAG biosynthesis (Fig. 1C) occurs first in the ER, followed by the Golgi, and results in different types of GAGs based on their repeating disaccharide units: heparan sulfate (GlcA/IdoA-GlcNAc), chondroitin sulfate (GlcA-GalNAc), dermatan sulfate (IdoA-GalNAc), or keratan sulfate (Gal-GlcNAc). Heparan sulfate proteoglycans (HSPGs) are prominent members of the cellular glycocalyx and are synthesized by all cell types.
Fig. 1.
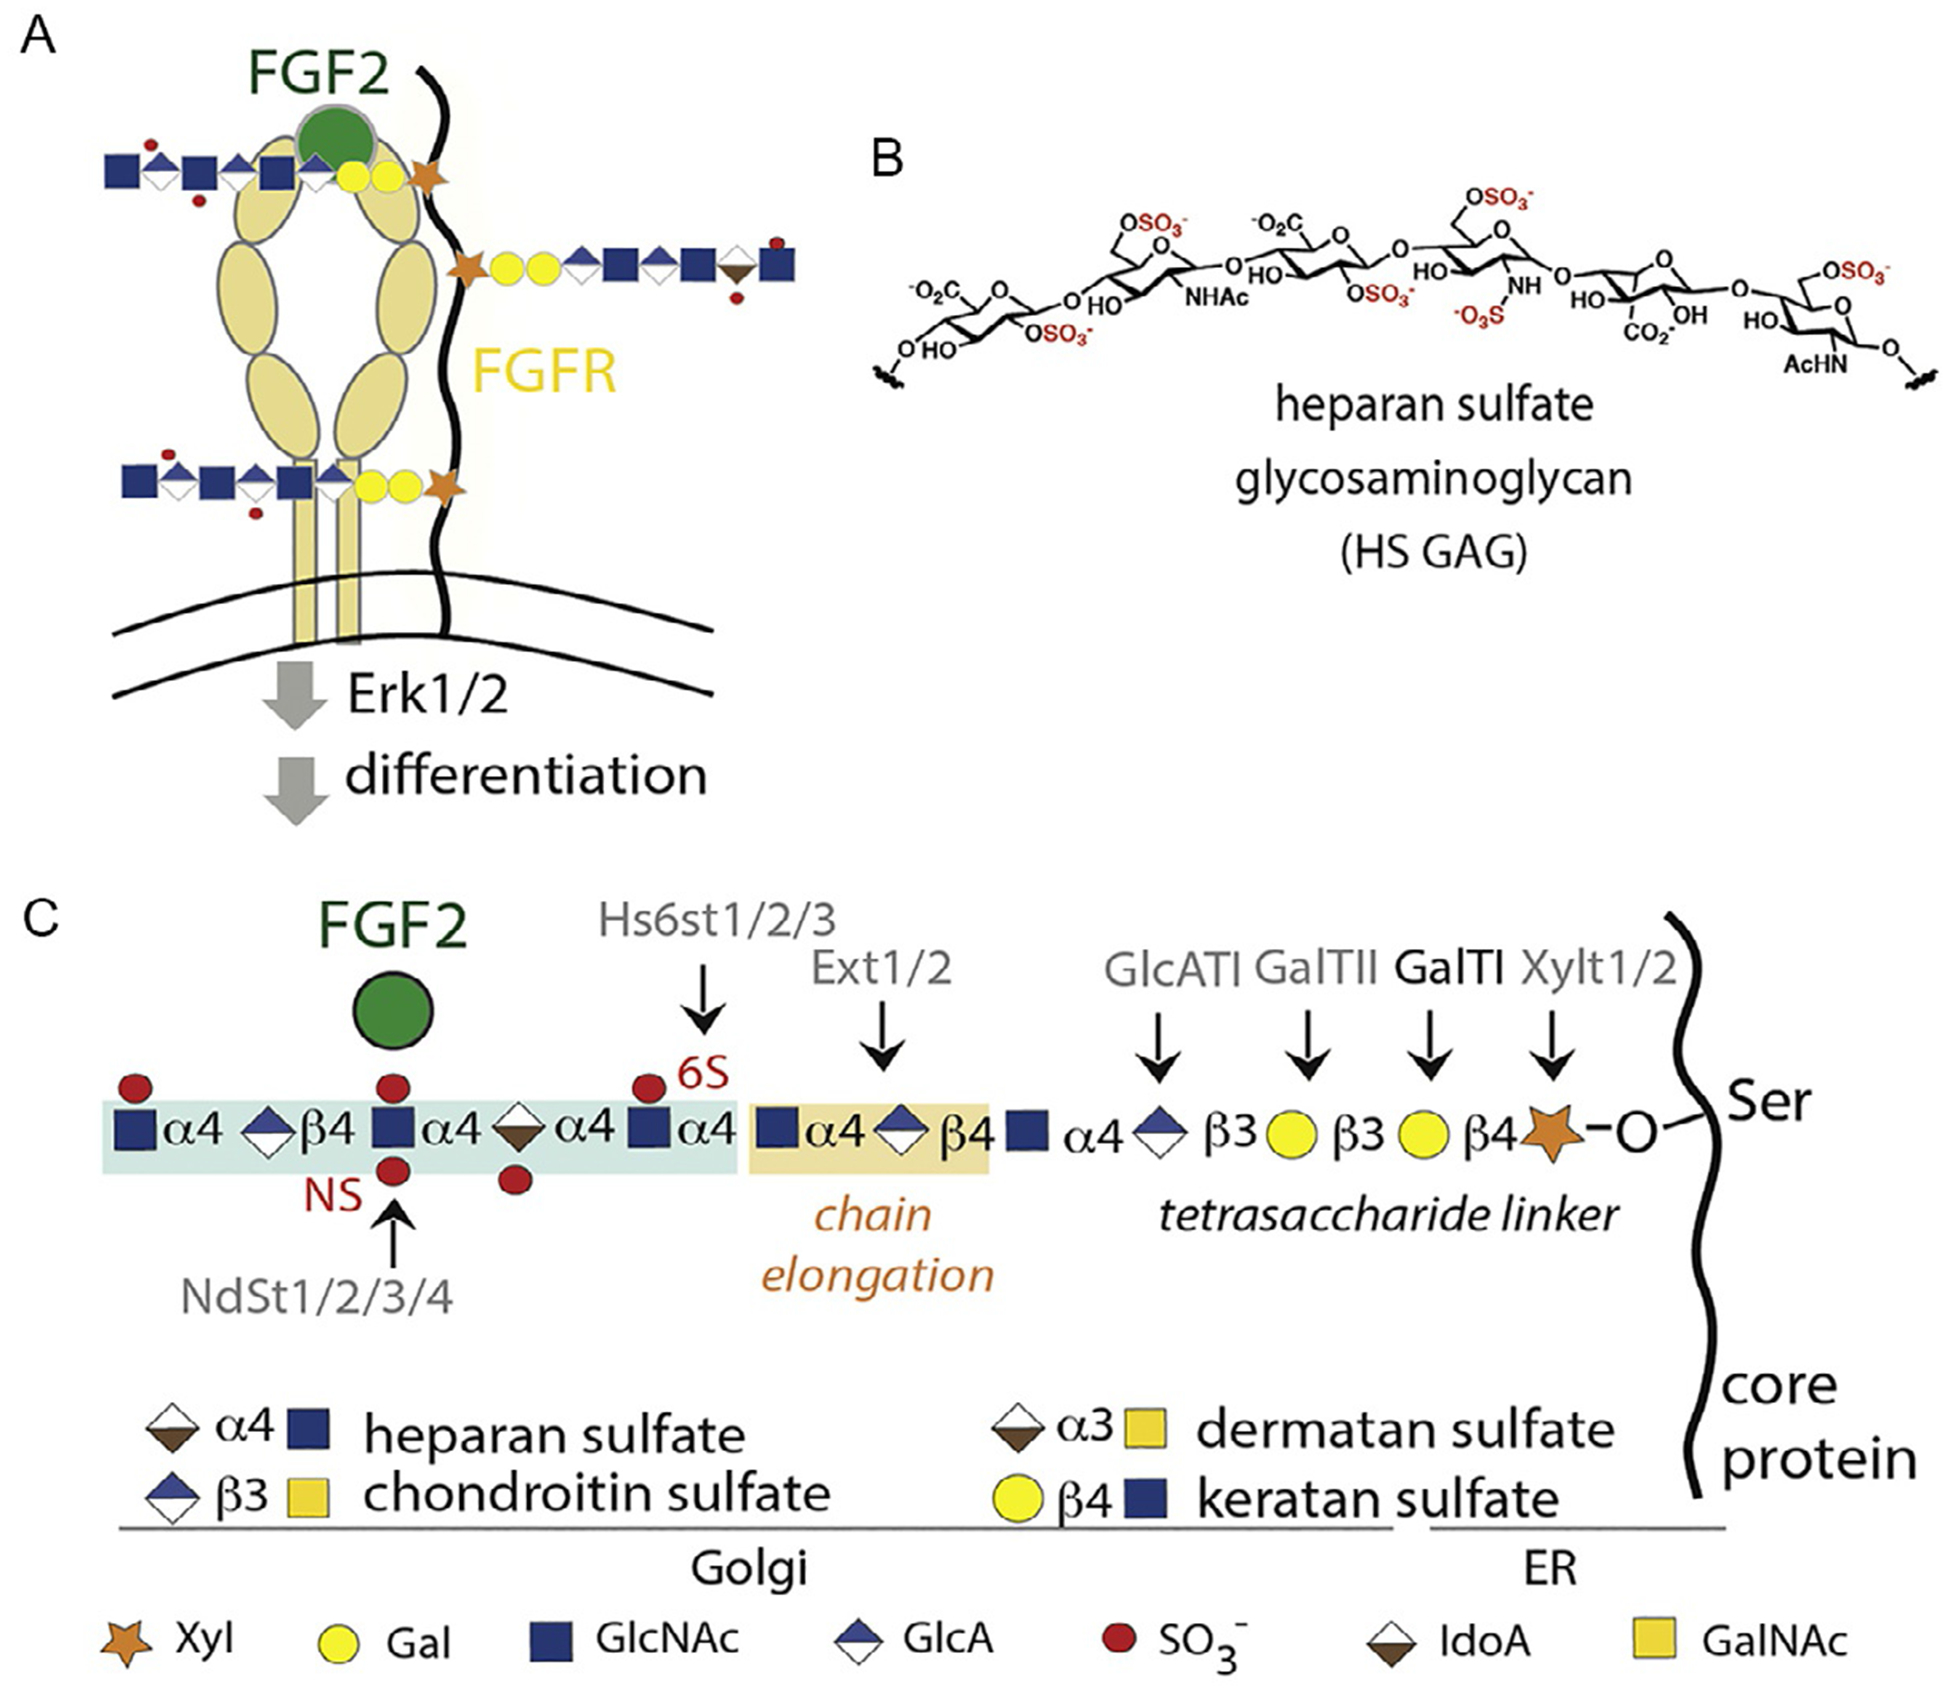
Proteoglycan (PG) structure and biosynthesis. (A) PGs are glycoconjugates composed of a core protein (black line) that is glycosylated with sulfated glycosaminoglycans. (B) PGs serve as co-receptors for growth factors and their receptors, such as FGF2 and FGFR to initiate signal transduction events and activate the differentiation of mouse embryonic stem cells. (C) PGs are synthesized in the ER and Golgi apparatus by a suite of glycosyltransferase and sulfotransferase enzymes.
Given their central role in orchestrating signaling and cellular phenotypes, there is tremendous opportunity to target proteoglycans and GAGs in order to interrupt or modulate cellular processes, especially for therapeutic applications (Naini & Soussi-Yanicostas, 2018). Interestingly, whereas the proteome and other classes of biomolecules have been greatly explored as receptors for small molecules, the therapeutic potential of the glycome as targets for small molecules remains largely untapped. There are very few examples that showcase the feasibility of the glycan or the glycoconjugate chemical space (Witten, Samad, & Ribbeck, 2019) as receptors for small molecules (Jin, Cheng, Reid, Li & Wang, 2010). We (Huang et al., 2018) and others (Schuksz et al., 2008; Yamazoe, Shimogawa, Sato, Esko, & Uesugi, 2009) have previously demonstrated that small molecules can be used as ligands for GAGs, and these binding events, in turn, can impart significant changes to cellular phenotypes. The chemical modulation of the glycome offers significant advantages. Compared to genetic approaches to silence glycan functions, chemical approaches may alleviate safety concerns regarding permanent modifications to the genome, and they may offer increased chemical stability and tunable pharmacological properties. Here, we describe methods to characterize and screen for small molecules that interact with specific units of the glycome in order to temporarily silence its biological effects.
2. Mouse embryonic stem cell (mESC) differentiation as a phenotypic model screening system
Glycosylation controls the self-renewal and differentiation of pluripotent mouse embryonic stem cells (mESCs). HSPGs are well-known regulators of development, (Hacker, Nybakken, & Perrimon, 2005) and the roles of GAGs and GAG sulfation in modulating mESC fates have been studied by multiple groups (Pickford et al., 2011) including ours (Naticchia et al., 2018). mESCs require autocrine Fibroblast Growth Factor (FGF) signaling to initiate differentiation, and heparan sulfate glycosaminoglycans (HS GAGs) promote FGF2 binding to the cell surface. The loss of HS results in embryonic lethality and arrests mESCs in the pluripotent state (Kraushaar et al., 2012), whereas undersulfation of HS restricts the differentiation potential of mESCs (Forsberg et al., 2012). Given the clearly delineated roles of HS GAGs and the defined effects of GAG antagonism, mESC differentiation serves as a suitable phenotypic screening system to evaluate the effects of potential small molecule binders to HS GAGs.
Here, we describe the use of a small molecule, surfen, to antagonize HS-growth factor interactions, in order to silence growth factor signaling and maintain stem cell pluripotency. We expect that similar or better small molecules may be discovered in the future, and that these methods can serve as a template for the evaluation and phenotypic screening for small molecules that can antagonize growth factor interactions by binding glycans. We present a multi-tiered set of experiments, starting from an ELISA (Section 3) experiment to select for molecules that can inhibit growth factor interactions with GAGs, and moving onto cellular differentiation as a phenotypic assay (Section 4). It should be noted, however, that these experiments do not exclude other biomolecules as potential targets. These methods merely point to the fact that a candidate molecule is interacting with HS GAGs on mESCs to alter pluripotency or differentiation.
3. Analysis of small molecule antagonism of heparan sulfate via enzyme-linked immunosorbent assay (ELISA)
3.1. Materials
Heparin-coated 96-well plates (Bioworld # 20140005–3)
Blocking buffer: 2% Bovine serum albumin (BSA)/phosphate buffered saline (PBS)
Incubation buffer: 1% BSA/PBS
Washing buffer: 0.05% Tween 20/PBS
Surfen hydrate (CAS # 5424–73-3; Sigma Aldrich # S6951; Fig. 2A) or candidate molecule
Recombinant FGF2 (Gibco # PHG0264)
Primary antibody: Anti-FGF2 antibody (host: mouse, e.g., Millipore # 05–117, clone bFM-1)
Secondary antibody: Horseradish Peroxidase (HRP)-conjugated anti-mouse antibody
3,3′,5,5′-Tetramethylbenzidine (TMB) substrate (eBioscience # 00–4201-56)
Fig. 2.
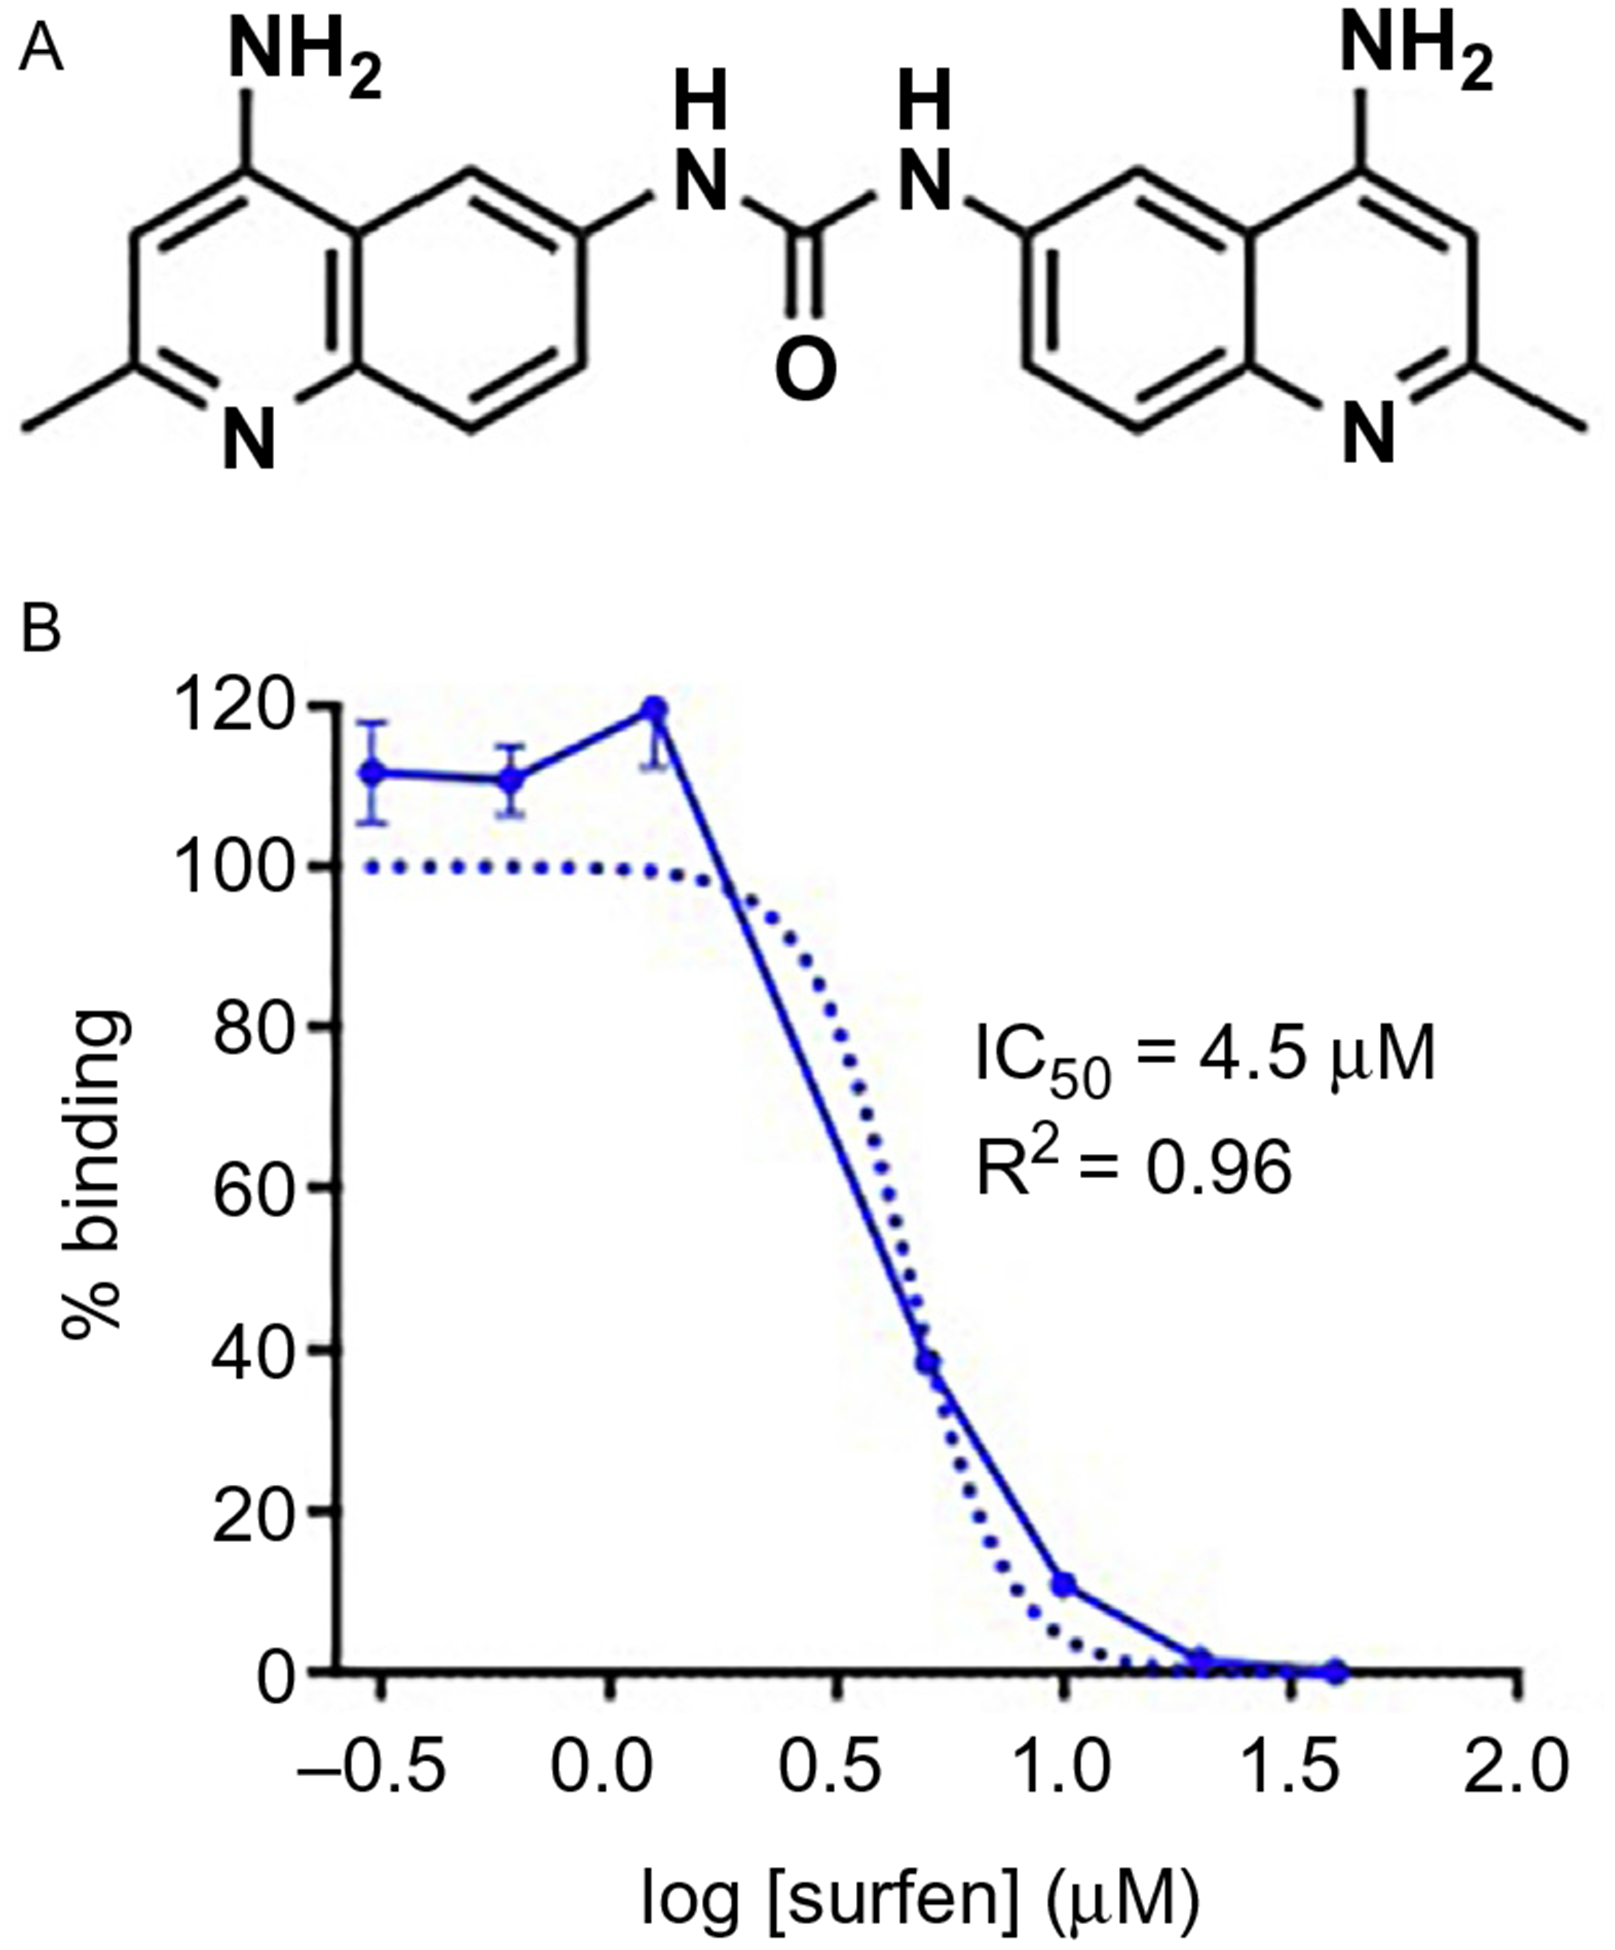
Surfen antagonizes GAG interactions with FGF2. (A) Chemical structure of surfen. (B) Inhibition of FGF2 binding to heparin-coated plates using surfen, demonstrated in an ELISA. Figures modified from Huang, M. L., Michalak, A. L, Fisher, C. J., Christy, M., Smith, R. A. A., & Godula, K. (2018). Small molecule antagonist of cell surface glycosaminoglycans restricts mouse embryonic stem cells in a pluripotent state. Stem Cells, 36(1), 45–54.
3.2. Procedure
Block the heparin coated plates for 1h at RT with blocking buffer (100 μL/well).
Wash the wells 3× with washing buffer (100 μL/well).
Incubate the wells with 100 μL volumes and triplicate dilutions of surfen or candidate molecule (e.g., 0–40 μM) in incubation buffer for 10–15min at RT.
Without washing the wells, add FGF2 to each well at a final concentration of 10nM and incubate at RT for 2h.
Wash the wells 3× with washing buffer (100 μL/well).
Add the mouse anti-FGF2 antibody at a final concentration of 1 μg/mL in washing buffer, and incubate for 1h at RT.
Wash the wells 3× with washing buffer (100 μL/well).
Add the HRP-conjugated anti-mouse secondary antibody at 1 μg/mL in washing buffer, and incubate for 1h at RT.
Add 1× TMB substrate (100 μL/well) at RT. Observe the color change of the solutions from clear to blue.
After 2–5min, quench the reaction with 2N sulfuric acid (100 μL/well).
Measure the absorbance at 450nm.
To analyze data, average the absorbance values from the blank wells, and subtract this value from each experimental well.
Plot these subtracted triplicate absorbance points against logarithmic values of small molecule concentrations.
Use non-linear regression analysis to fit a logarithmic curve onto the data points. Perform t-tests to determine statistical significance against different conditions or multiple t-tests to evaluate statistical significance for different doses.
Calculate IC50 and R2 values to measure inhibitory potency and goodness of fit, respectively (sample data described in Fig. 2B).
4. Mouse embryonic stem cell (mESC) culture maintenance and differentiation
Mouse embryonic stem cells (mESCs) can be cultured as pluripotent cell monolayers using LIF (Leukemia Inhibitory Factor)-supplemented media, which helps maintain pluripotency. mESCs grown in this manner exhibit a colony-like morphology, a hallmark of cell stemness (Fig. 3A). In the absence of LIF, mESCs can spontaneously differentiate. mESCs must also be cultured in sterile plasticware pre-coated with gelatin for proper adhesion. Alternatively, mESCs can be cultured in the presence of feeder cells that can supply LIF in situ and promote adhesion. Differentiation can be initiated by plating defined cellular densities and simple withdrawal of LIF (spontaneous differentiation) or by using defined media conditions designed to promote neural differentiation. To aid in the visualization of pluripotent and neural differentiation states, mESC knock-in cell lines that express green fluorescent protein (GFP) under the control of Oct4, a pluripotency marker, or Sox1, a neural differentiation marker, are employed to enable live cell fluorescence imaging to examine cell states (Forsberg et al., 2012). These changes in GFP expression can be easily viewed live under a fluorescence microscope or semi-quantitatively compared by flow cytometry. Over the course of 6 days in neural differentiation media, mESCs gradually lose pluripotency and commit to differentiating to Sox1-positive neural precursors (Ying, Stavridis, Griffiths, Li, & Smith, 2003) (Fig. 3B).
Fig. 3.
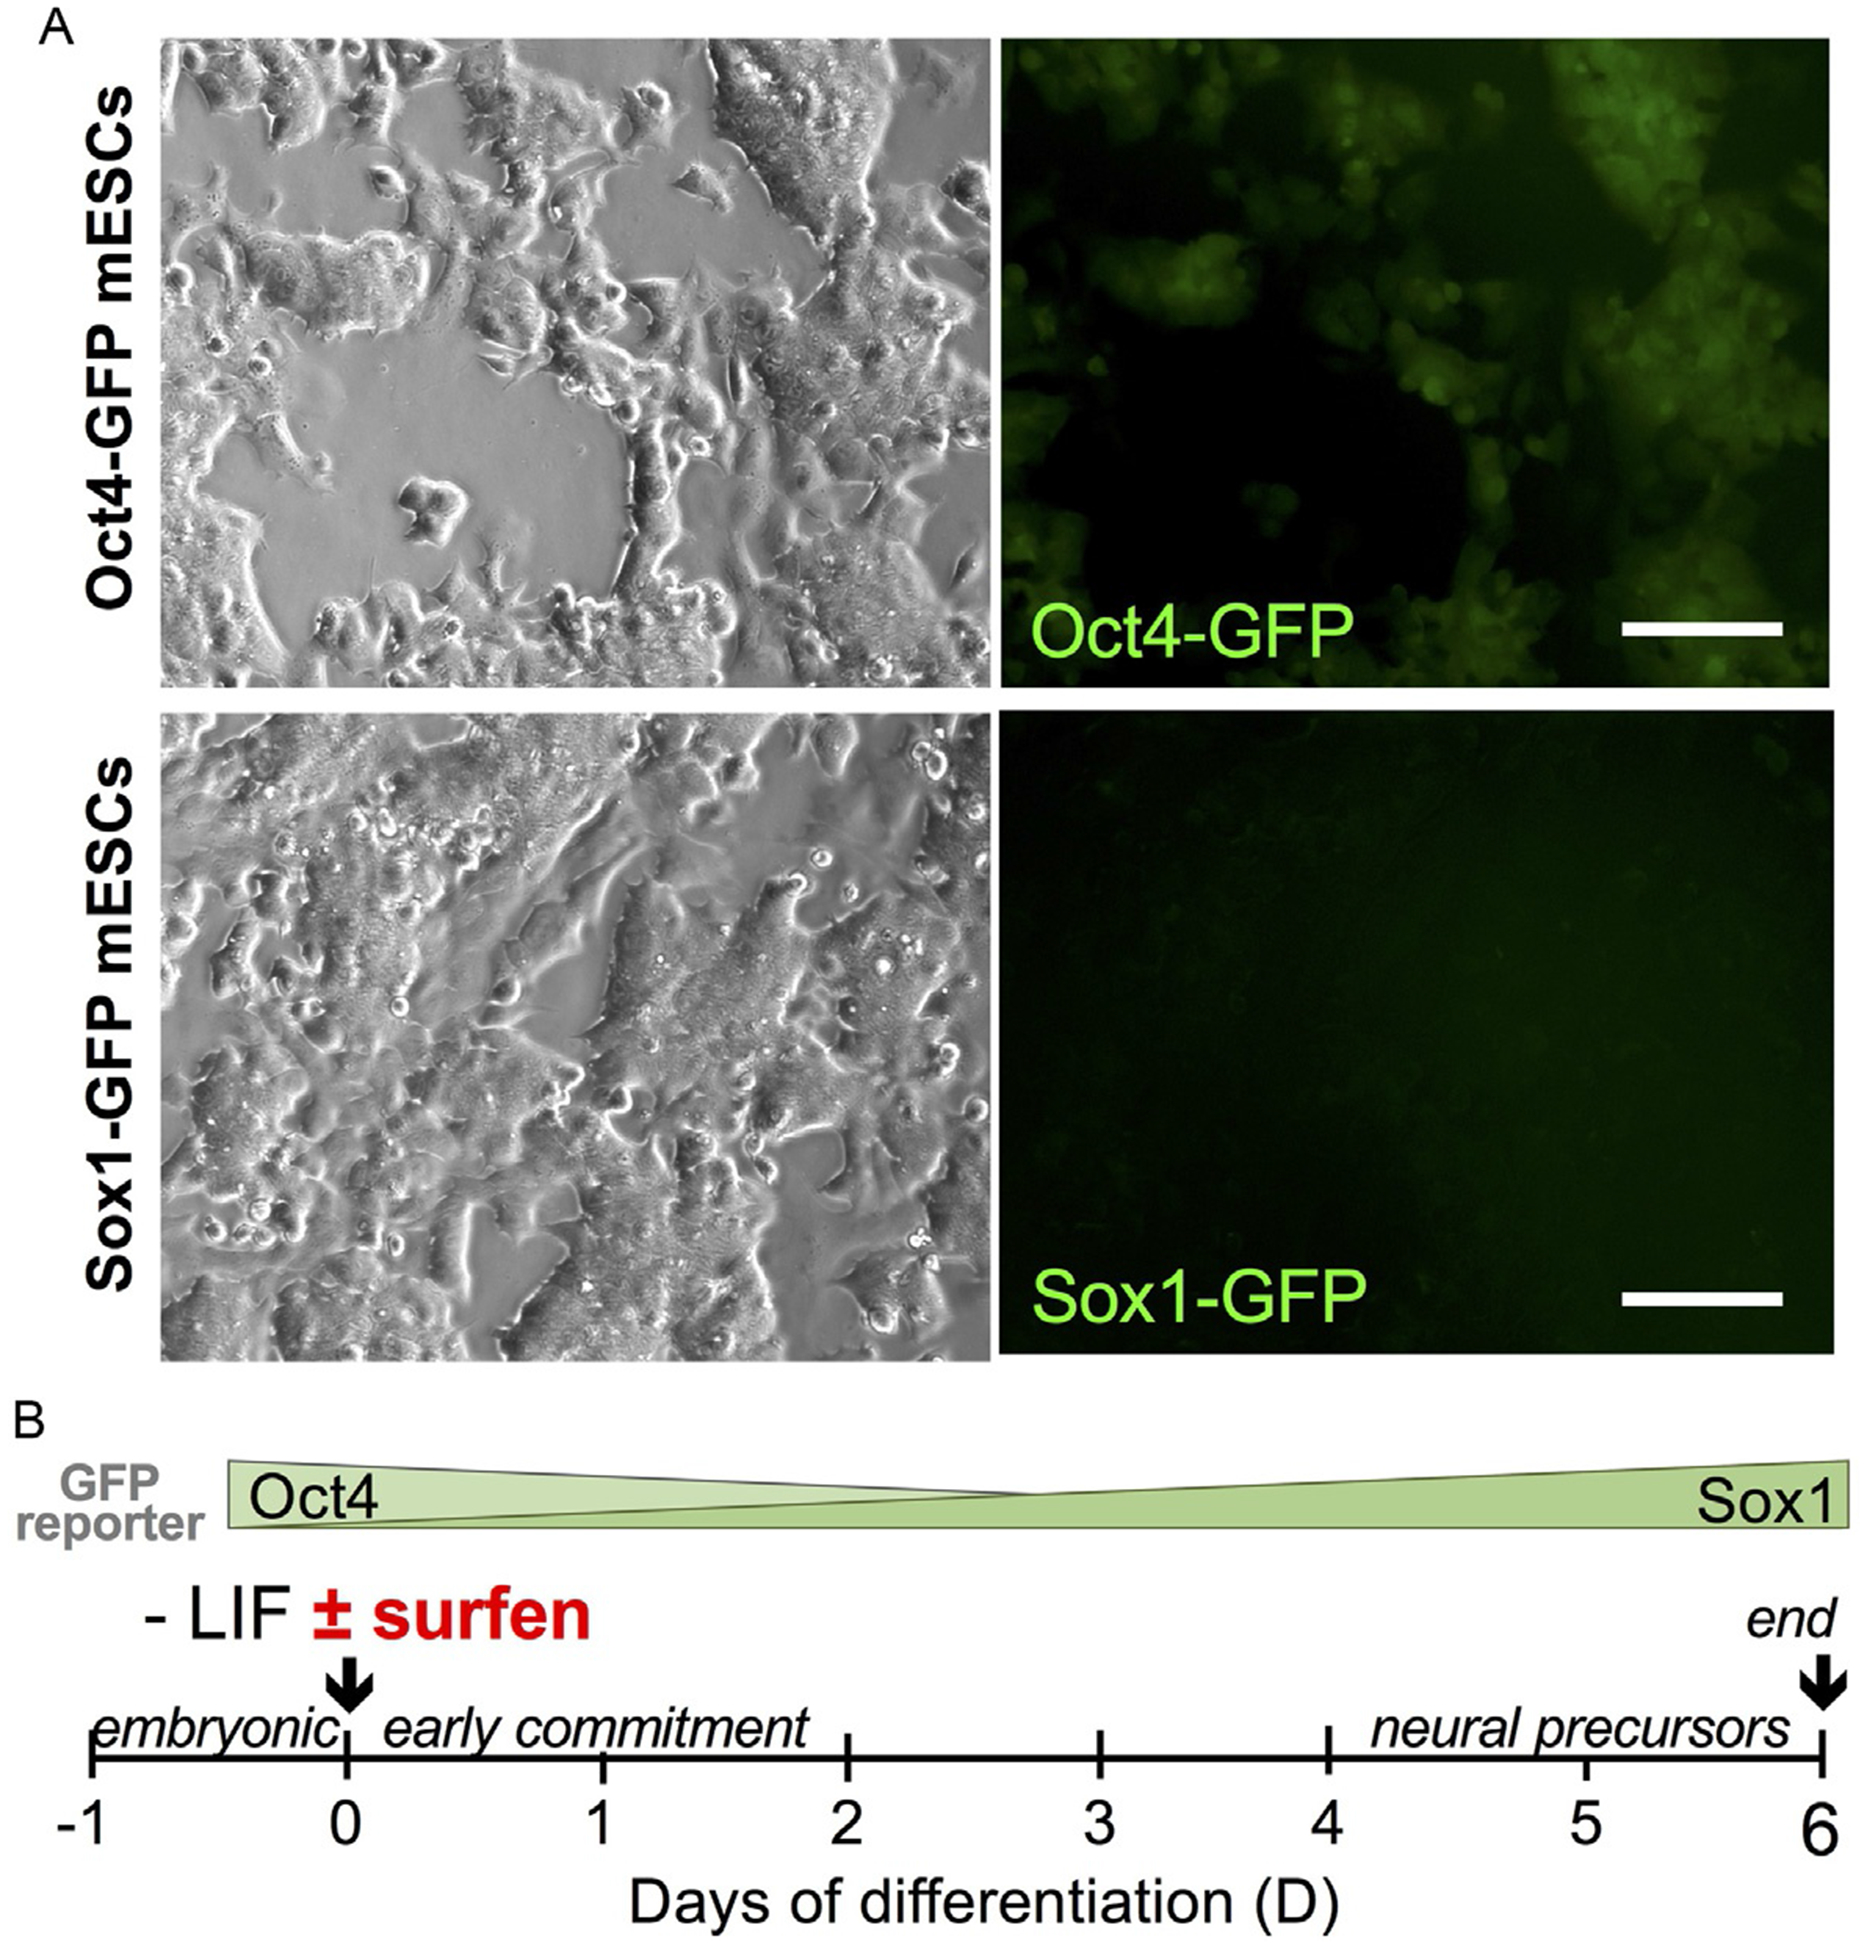
Dual endpoint GFP-reporter assay for evaluating heparan sulfate glycosaminoglycan (HS GAG) antagonists as inhibitors of neural differentiation in murine embryonic stem cells (mESCs). (A) Live cell fluorescence micrographs show pluripotency in Oct4 mESCs. Scale bar: 100 μm. (B) Oct4-GFP and Sox1-GFP mESC reporter lines were used to evaluate the ability of HS GAG antagonists to inhibit neural differentiation and promote pluripotency over 6 days in N2B27 culture. Figures adapted from Huang, M. L., Michalak, A. L, Fisher, C. J., Christy, M., Smith, R. A. A., & Godula, K. (2018). Small molecule antagonist of cell surface glycosaminoglycans restricts mouse embryonic stem cells in a pluripotent state. Stem Cells, 36(1), 45–54.
4.1. Materials
Oct4-GFP mESCs (Primcells # PCEMM08)
Sox1-GFP mESCs (Primcells # PCEMM01)
Recombinant Leukemia Inhibitory Factor (LIF; e.g., commercially sold by Millipore as ESGRO at 107 units/mL # ESG1107)
β-Mercaptoethanol
l-Glutamine
Minimal Essential Media-non-essential amino acids (MEM-NEAA)
Fetal bovine serum (FBS; pre-test lots to ensure compatibility with mESC growth)
Knockout-Dulbecco’s minimum essential media (KO-DMEM; Gibco # 10829–018)
Porcine gelatin stock solution (1.0w/v% in water; Sigma # G1890)
Tissue-culture treated sterile dishes
0.05% Trypsin-EDTA
Dulbecco’s phosphate buffered saline (DPBS)
Puromycin stock solution (10mg/mL in water)
Sterile vacuum filtration units
Penicillin/streptomycin (optional)
Neurobasal media (Gibco # 21103–049)
DMEM/F-12 media (Gibco # 11330–032)
B27 supplement (Gibco # 17504044)
N2 supplement (Gibco # 17504044)
Gelatin-coated plastic tissue-culture dishes
GAG inhibitor(s) (e.g., surfen)
4.2. Preparation of media and stock solutions
Growth or maintenance medium (suitable for all cell lines used in this study): To prepare 50mL, combine l-glutamine (0.5mL), MEM-NEAA (0.5mL), FBS (5mL) with KO-DMEM (44mL) and filter this solution through a 0.22 μm membrane filter to sterilize. Add β-mercaptoethanol (55 μL) and LIF (5 μL) to the filtrate. The addition of penicillin/streptomycin antibiotic is optional. Store up to 2 weeks at 4 °C. Scale-up to higher volumes by multiplying all values using a desired multiplication factor.
10× (1.0%) gelatin stock solution: Add 1.0g porcine gelatin to 100mL water to an autoclavable media bottle (make sure to rinse completely with water, as detergents can inhibit mESC adhesion), and autoclave. Store solution at 4 °C upon cooling.
Gelatin-coated plates: Pre-warm the 10× stock solution to 37 °C. Dilute the warm 10× gelatin solution 1:10 with water under sterile conditions to generate the working solution. Add enough solution to tissue-culture treated plates to cover the entire growth area. Incubate at RT for at least 10min and discard completely prior to adding cells.
Neural differentiation medium: To prepare 50mL, add 24mL each of DMEM/F-12 and Neurobasal media, B-27 supplements (0.5mL), N2 supplements(1.0mL), l-glutamine (0.5mL) to a conical tube, sterilize using a filter unit, then add 0.1% β-mercaptoethanol. The addition of penicillin/streptomycin antibiotic is optional. Store up to 2 weeks at 4°C. Scale-up to higher volumes by multiplying all values using a desired multiplication factor.
Compound stock solutions: Prepared in DMSO, ethanol, or water, depending on molecule solubility. Surfen stock solutions are prepared as 30mM solutions in DMSO. mESCs are sensitive to DMSO. Concentrations as low as 0.125% have been shown to induce differentiation in mESCs (Adler, Pellizzer, Paparella, Hartung, & Bremer, 2006). Final concentrations of <0.1% are highly recommended and must always be controlled for in experiments by running control samples containing only DMSO.
4.3. Procedure for mESC culture and maintenance
Prepare gelatinized tissue-culture treated plates or dishes as above (Section 4.2, steps 2 and 3).
Pre-warm all necessary solutions using a 37 °C water bath. mESCs are sensitive to temperature changes.
Thaw a cryovial of mESCs by quickly diluting a 1mL freshly thawed solution (from 37 °C water bath) to 4mL of pre-warmed maintenance media (Section 4.2, step 1) in a 15-mL conical tube. Centrifuge at 300×g for 4min. Remove the supernatant and resuspend the cells in 3mL of maintenance media and add to pre-gelatinized plates. Viability and cell numbers at this stage may be determined using a trypan blue exclusion assay. Place cells in a humidified incubator set at 37 °C, 5% CO2.
When cells are confluent (1–3 days), passage cells by washing once with DPBS, trypsinizing at RT for 3–5min and adding an equal volume of growth media to neutralize. Cells can be split at 1:3, 1:10, or 1:20 dilutions using new growth media.
The mESCs are subject to spontaneous differentiation and may occasionally lose pluripotency. Oct4-GFP cells can be enriched for GFP-positive populations by treatment with 1 μg/mL puromycin in mESC media for 2–3 days.
4.4. Procedure for mESC neural differentiation
Prepare gelatinized 24-well tissue-culture plates as before (Section 4.2, step 3).
Trypsinize and neutralize mESCs as before (Section 4.3, step 4).
Count viable cells using a hemacytometer and suitable exclusion dye (e.g., trypan blue). Cells must be >95% viable for proper differentiation to proceed.
Dilute cell suspension to 30,400 cells/mL using mESC growth medium.
Seed 0.5mL cell suspension to each well, such that the cell density per well is 8000 cells/cm2 or 15,200 cells per well of a 24-well plate. Incubate cells at 37 °C, 5% CO2 overnight. Count this date as D–1 (Fig. 3B).
Next day (D0), wash cells twice with DPBS, and add 0.5mL of pre-warmed neural differentiation media (Section 4.2, step 4).
Monitor cells daily. Wash cells with DPBS once and replenish with new neural differentiation media every 1–2 days. Media will need to be replaced more frequently after prolonged incubation periods.
After 6–7 days of differentiation, wash cells and proceed with downstream analysis.
To test GAG inhibitors for mESC phenotypic effects, add inhibitors starting at D0 in neural differentiation media, and replenish with media supplemented with the inhibitor. Include a corresponding DMSO control.
5. Analysis of small molecule effects toward mESC pluripotency and differentiation
In order to provide semi-quantitative descriptions of the extent of pluripotency remaining or the extent of differentiation present in samples, flow cytometry analysis of the GFP-expressing mESCs can be carried out. By culturing both Oct4-GFP and Sox1-GFP mESCs under similar test conditions, GFP expression can be used to monitor pluripotency and neural differentiation simultaneously using the respective cell lines. To determine the effects of the molecules toward the expression of other markers, immunocytochemistry techniques can be used. See Table 1 for description of common markers used for classifying pluripotency and differentiation. Quantitative PCR (qPCR) can also be used to determine levels of mRNA expression for different markers.
Table 1.
Common biomarkers used to define embryonic or differentiated cell states.
| (Neuro)ectoderm | Mesoderm | Endoderm | |
|---|---|---|---|
| Oct4 | Sox1 | Brachyury (T) | Sox17 |
| Nanog | Nestin | Foxa2 | |
| Sox2 | β-III-Tubulin |
5.1. Dual endpoint flow cytometry
5.1.1. Materials
Neutralization buffer: KO-DMEM with 10% FBS.
Analysis buffer: KO-DMEM with 1% FBS (consult with flow cytometry facility).
Sterile cell strainers with 0.22 μm filters.
5.1.2. Procedure
After desired number of days in differentiation, wash GFP-expressing cells twice with DPBS.
Add 0.05% trypsin-EDTA to cells and incubate for 3–5min until cells are single-celled and detached from plate.
Dilute trypsin with an equal volume of neutralization buffer.
Harvest cell suspension and filter through cell strainer to ensure that cells are single-celled.
Collect filtrate and centrifuge at 300×g for 3–4min.
Remove supernatant and re-suspend pellet in analysis buffer.
Keep samples on ice.
Analyze cells using a compatible flow cytometer equipped with a GFP fluorescence filter, such as the BD Accuri C6, collecting at least 10,000 events per sample and using embryonic-state Oct4-GFP or Sox1-GFP cells to gate against pluripotent cells.
Determine IC50 values by plotting %GFP-positive values for each cell line against the logarithm of compound concentrations. Fit the curve using a non-linear equation. Sample data acquired for surfen-mediated maintenance of pluripotency and inhibition of neural differentiation is shown in Fig. 4A.
Fig. 4.
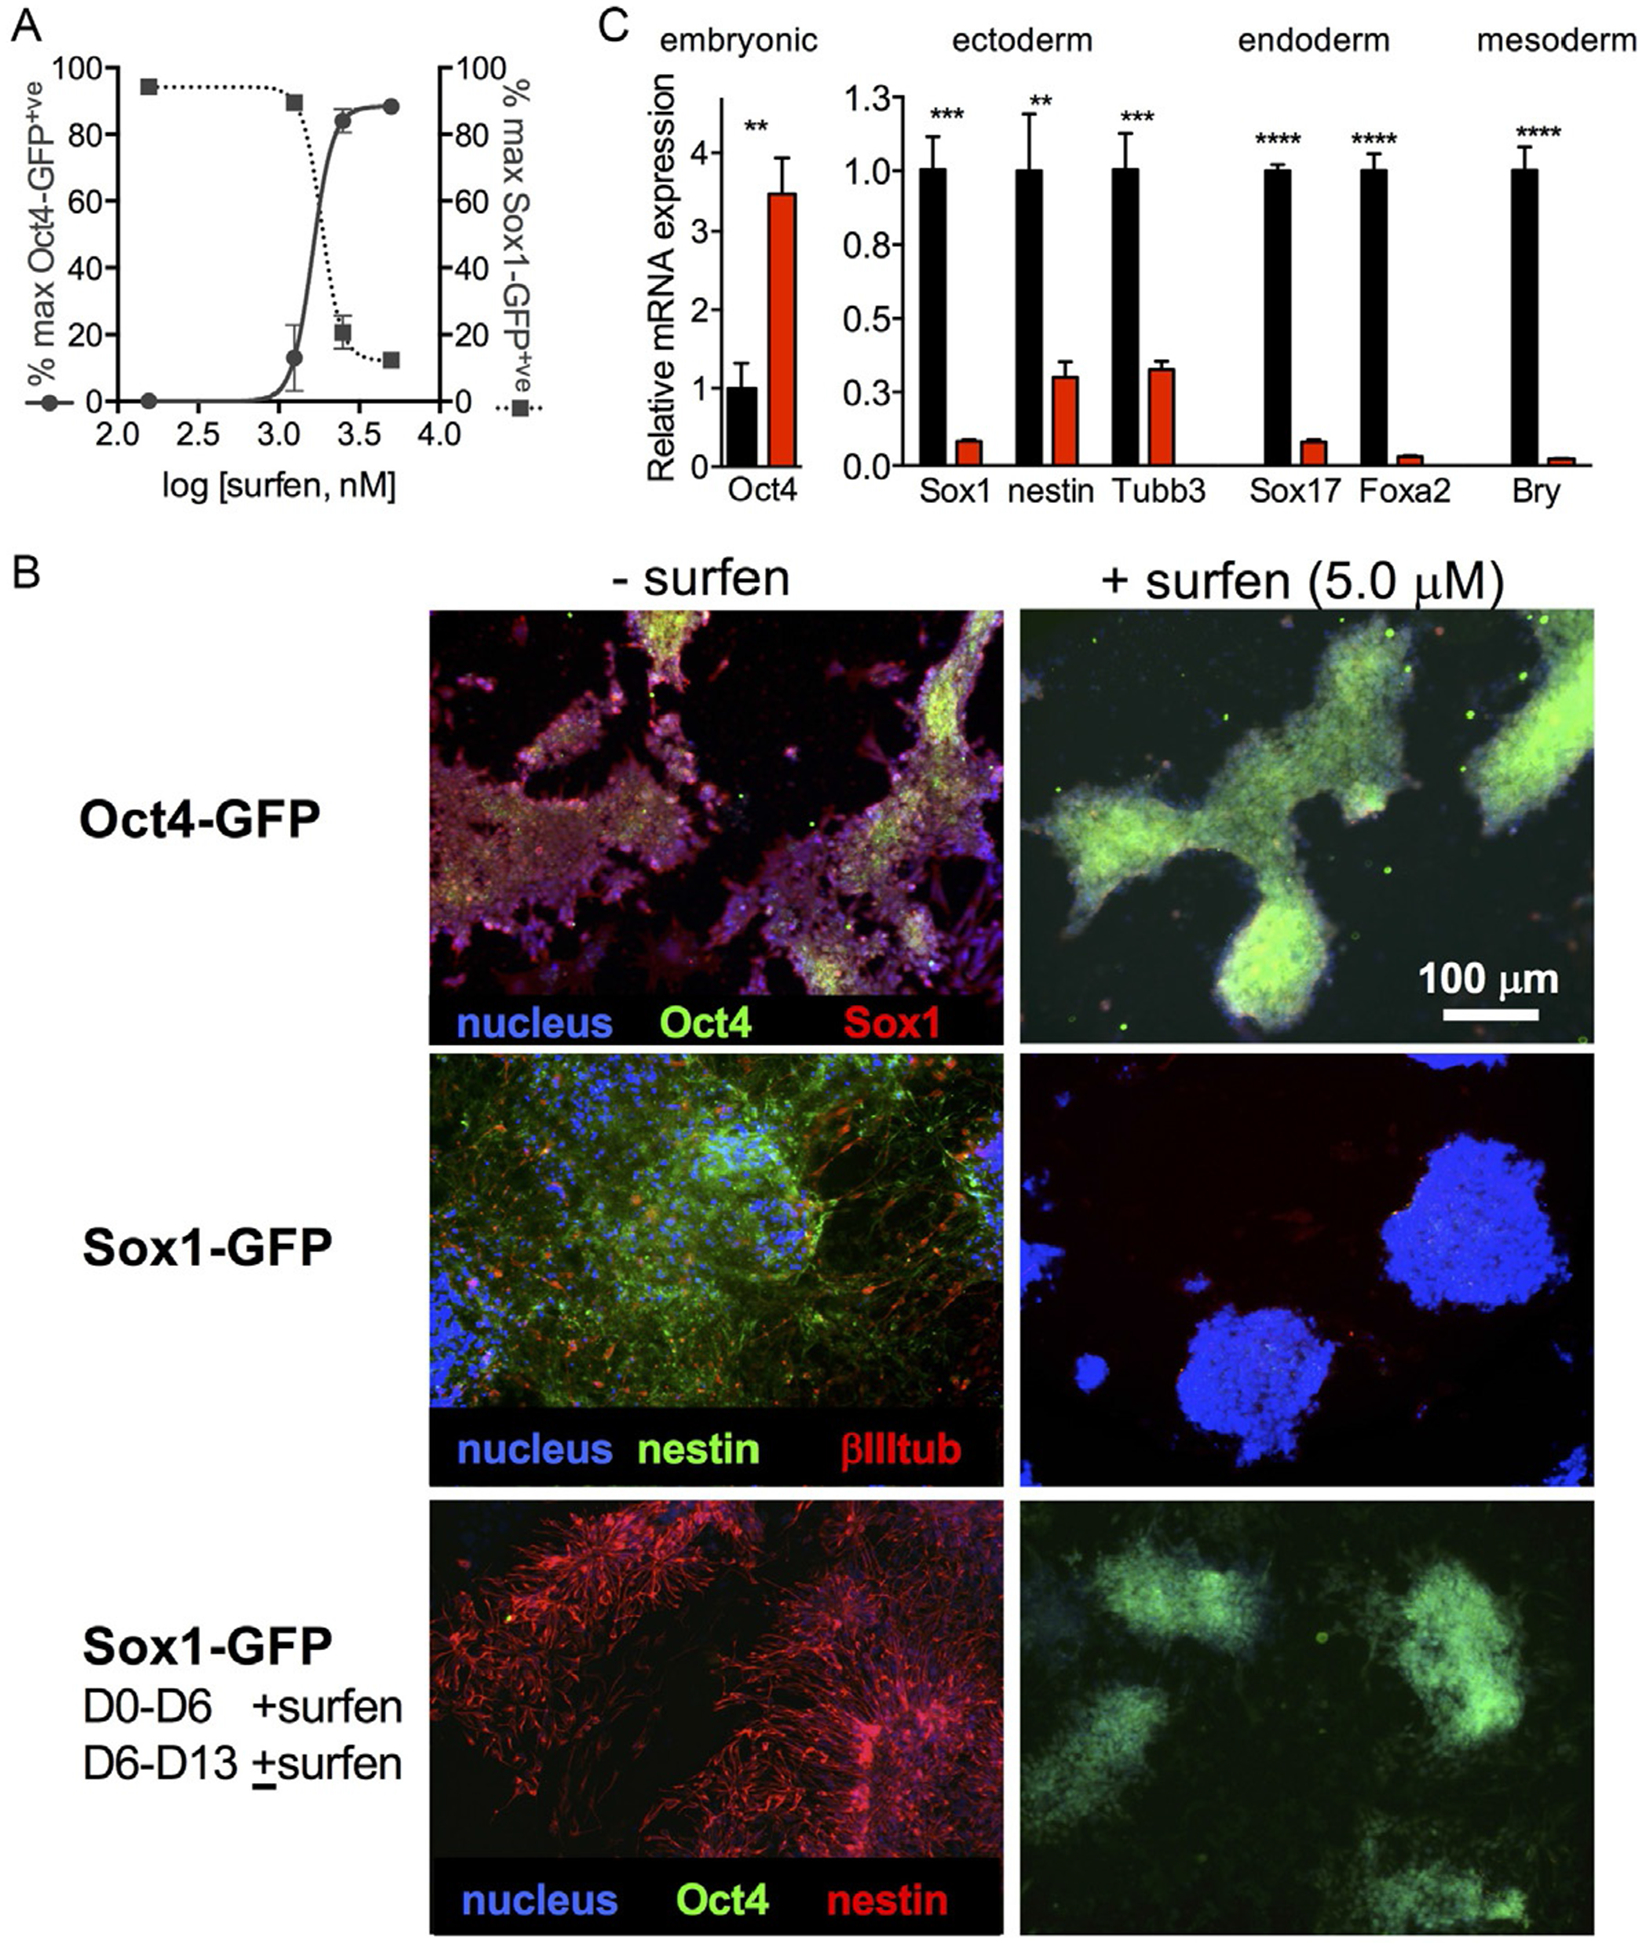
Analysis of mESC pluripotency and differentiation. (A) Live cell flow cytometry analysis of surfen-treated Oct4-GFP and Sox1-GFP cells at D6 of differentiation (IC50 ~5.0 μM). (B) Immunostaining for various markers demonstrate that surfen inhibits differentiation and promotes pluripotency. Surfen treatment is also reversible, as indicated by the bottom panel of images, where Sox1-GFP mESCs were treated with surfen for D6 and then surfen treatment was either discontinued (left) or continued (right) for another 6 days. (C) qPCR analysis of untreated (black bars) and surfen-treated cells (red bars) at D6 of differentiation. Figures adapted from Huang, M. L., Michalak, A. L, Fisher, C. J., Christy, M., Smith, R. A. A., & Godula, K. (2018). Small molecule antagonist of cell surface glycosaminoglycans restricts mouse embryonic stem cells in a pluripotent state. Stem Cells, 36(1), 45–54.
5.2. Immunocytochemistry
5.2.1. Materials
Fixation buffer: 4% PFA (p-formaldehyde)/DPBS.
Incubation buffer: 1% BSA/DPBS with 1.0% goat serum and 0.1% Triton X-100.
Prolong Gold Antifade Mountant with DAPI (ThermoFisher # P36931).
Primary antibodies: mouse-anti-Oct4 (Santa Cruz Biotechnology # SC-25401), rabbit-anti-Oct4 (Abcam # AB18976), mouse-anti-nestin (Millipore # MAB353, clone 401), rabbit anti-β-III-tubulin (Abcam # AB52623, clone EP1569Y), chicken anti-Sox1 IgY antibody (Millipore # AB5934).
Secondary antibodies: AlexaFluor647-anti-mouse, AlexaFluor555-anti-rabbit, Alexa647-anti-chicken IgY (Abcam # GR272372–1), Note: although these secondary antibodies can be replaced with other ones, the use of FITC or AlexaFluor488-emitting fluorophores should be avoided to prevent overlap with the GFP-expressing cells.
5.2.2. Procedure
Wash cells twice with DPBS and incubate with fixation buffer at RT for 10min.
Remove fixation buffer and wash cells twice with DPBS.
Block wells by incubating with blocking buffer for 1h at RT.
Incubate cells with primary antibodies in incubation buffer overnight at 4 °C. Note compatibility of primary antibody host organism to secondary antibody specificity, as well as potential overlap of targets if more than one antigen is to be detected per well.
Wash cells twice with incubation buffer and incubate with fluorophore-conjugated secondary antibodies in incubation buffer for 1h at RT. Note compatibility of fluorophores, antibody hosts and isotypes.
Wash cells twice with incubation buffer and once with DPBS alone.
Remove last amounts of DPBS and add enough Prolong Gold with DAPI dropwise to cover entire well. Incubate at RT for 10min to cure.
Image under a fluorescence microscope using appropriate filters. Sample data acquired for mESCs cultured with or without surfen is shown in Fig. 4B.
5.3. Quantitative RT-qPCR analysis (as mentioned in contents)
5.3.1. Materials
10× primer stocks (see Table 2 for sequences used): prepared as 100mM stock solutions in ddH2O
RNA extraction kit: (e.g., Qiagen RNeasy Mini extraction kit # 74104)
2× SYBR Green (e.g., Applied Biosystems # 4367659) or another suitable double-stranded DNA fluorophore
High capacity cDNA reverse transcription kit: includes buffers, random primers, reverse transcriptase, dNTP substrates (e.g., Applied Biosystems # 4368814)
RNAse-free DNAse (Qiagen # 79254)
Well plates suitable for qRT-PCR instrument
20G needle (sterile)
1mL syringes (sterile)
70% Ethanol
Doubly-distilled water (ddH2O) free from nucleases and nucleic acids
Table 2.
Primers used for qRT-PCR analysis.
| GAPDH (housekeeping) | TGC CTG CTT CAC CTT CT | CCA ATG TGT CCG TCG TGG AT | 83 |
| Oct4 | TTG CCT TGG CTC ACA GCA TC | TGT TCC CGT CAC TGC TCT GG | 82 |
| Sox1 | GGC CGA GTG GAA GGT CAT GT | TCC GGG TGT TCC TTC ATG TG | 93 |
| β-III-Tubulin (Tubb3) | TGA TGA CGA GGA ATC GG AAG C | GGA CAG ATG CTG CTT GTC TTG G | 101 |
| Nestin | CTA CCA GGA GCG CGT GGC | TCC ACA GCC AGC TGG AAC TT | 219 |
| Brachyury “T” | TTG AAC TTT CCT CCA TGT GCT GA | TCC CAA GAG CCT GCC ACT TT | 82 |
| Foxa2 | ACT GGA GCA GCT ACT ACG | CCC ACA TAG GAT GAC ATG | 152 |
| Sox17 | AGC CAT TTC CTC CGT GGT GT | AAC ACT GCT TCT GGC CCT CAG | 104 |
5.3.2. Procedure for RNA extraction and purification
Following treatment and/or differentiation, wash cells twice with DPBS.
Add Buffer RLT (from Section 5.3.4) supplemented with 1% β-mercaptoethanol (follow manufacturer’s instructions for volume to be used based on well plate size) and use a pipet to triturate a few times at RT.
Harvest cell lysate into Eppendorf tubes and homogenize lysates by pumping 5× through a 20G needle.
Collect homogenized lysate into a new Eppendorf tube and add an equal volume of 70% ethanol. Pipet to mix.
Transfer up to 700μL of the sample to a RNeasy Mini spin column placed in a 2mL collection tube. Centrifuge for 15s at 8000×g. Discard the flow-through.
Add 350μL Buffer RW1 to RNeasy column. Centrifuge for 15s at 8000×g. Discard flow-through.
Add 10μL DNase I stock solution to 70μL Buffer RDD. Mix gently by inversion. Centrifuge briefly and add the DNase I incubation mix (80μL) directly to RNeasy column membrane and incubate at RT for 15min.
Add 350μL Buffer RW1 to RNeasy column. Centrifuge for 15s at 8000×g. Discard flow-through.
Add 500μL Buffer RPE to RNeasy column. Centrifuge for 15s at 8000×g. Discard flow-through.
Add 500μL Buffer RPE to RNeasy column. Centrifuge for 2min at 8000×g. Discard flow-through.
Place the RNeasy spin column into a new 1.5mL collection tube. Add 30–50 μL RNase-free water directly to the spin column membrane. Centrifuge for 1min at >8000×g to elute the RNA.
Determine absorbance values at 260nm and 280nm using a suitable spectrophotometer (e.g., NanoDrop 2000c).
Calculate RNA concentration and ensure that sample is free of contamination by calculating A260/A280 ratios. Values of A260/A280 should be 1.8–2.1.
5.3.3. Procedure for reverse transcription
Normalize RNA to a final concentration of 50ng/μL using ddH2O.
Prepare a large stock of 2× master mix (10μL per sample to be analyzed): 2μL 10× RT Buffer, 0.8μL 25× Buffer, 2.0μL 10× RT random primers, 1.0μL Reverse Transcriptase, 4.2μL ddH2O.
Add equal volumes of 50ng/μL RNA samples and 2× RT Master Mix. Centrifuge briefly at high speed to eliminate air bubbles.
Run samples on thermal cycler as follows: 25 °C for 10min, 37 °C for 2h, 85 °C for 5min and hold at 4 °C.
Samples may be stored at 4 °C (short-term) or −20 °C (long-term).
5.3.4. Procedure for quantitative-PCR
Dilute resulting cDNA sample (now 25ng/μL) to 10ng/μL with ddH2O.
Prepare triplicate wells (or more) of each gene per sample.
In each well of the plate, add the following: 4μL ddH2O, 5μL 10ng/μL cDNA,
1μL (forward and reverse primer), 10μL 2× SYBR Green.
Include non-template control experiments that do not contain primer solutions.
Seal the plate with an optically clear adhesive and centrifuge at 300×g to collect sample to the bottom of the plate and remove air bubbles.
Perform qPCR run using a suitable instrument (e.g., Applied Biosystems).
Sample data for control and surfen-treated cells at D6 of differentiation is shown in Fig. 4C.
6. Analysis of small molecule effects on mESC signaling
Glycans mediate a number of signaling pathways. Proteoglycans, especially, are known to serve as co-receptors for GFs and their receptors, such as FGF2 and FGFR, respectively. The formation of such a ternary complex leads to the activation of signaling pathways (Fig. 1). In mESCs, HSPGs are known to be crucial mediators for the MAPK signaling pathway. However, HS is also suspected to mediate a number of other signaling events associated with mESC pluripotency and differentiation. Here, in addition to probing for the effects of a GAG inhibitor on the phosphorylation of Erk (Extracellular-related kinase), a protein within the MAPK cascade (Section 6.1), we also describe the use of a Receptor Tyrosine Kinase (RTK) capture array (Section 6.2), which includes a panel of 39 specific RTK antibodies, to allow simultaneous detection of changes toward other RTKs.
6.1. Effect of surfen on Erk phosphorylation
6.1.1. Materials
Serum free mESC media: Remove FBS from media in Section 4.2, step 1.
Gel tank and power pack: Bio-Rad Mini-PROTEIN® Tetra System.
Running buffer 10×: Weigh 30.3g Tris, 144.1g glycine, 10g SDS into 1L ddH2O.
Transfer buffer: 20% methanol in 1× running buffer.
Blocking buffer: 5% BSA in Tris-buffered saline, 0.1% Tween 20 (TBST).
Luminata Forte HRP Detection Reagent (Thermo Scientific # WBLUF0100).
Restore Plus Western blot stripping buffer (Thermo Scientific # 21059).
Recombinant FGF2.
Cell scraper.
Protein Quantification Kit: BCA assay (Thermo Scientific # 23225).
10% Tris-Glycine-sodium dodecyl sulfate polyacrylamide pre-cast gels.
Lysis buffer: RIPA buffer supplemented with protease inhibitor cocktail and phenylmethane sulfonyl fluoride (PMSF).
2× or 4× Laemmli buffer.
ECL Amersham Hyperfilm (GE Healthcare # 28906839).
Immobilon FL polyvinylidene fluoride (PVDF) membrane 0.45μm.
Primary antibodies: Anti-phosphoErk1/2 antibody (Cell Signaling Technology, rabbit, clone d13.14.4E), Anti-Erk1/2 antibody (Cell Signaling Technology, rabbit, clone 137F5), Anti-alpha tubulin (Cell Signaling Technology, mouse, clone DM1A). Note: these antibodies can be replaced by other specific antibodies relative to each target, but target specificity should be validated.
Plastic sheet protector or Saran wrap.
Secondary antibodies: HRP-anti-mouse and HRP-anti-rabbit antibody. Note: these may also be replaced with fluorophore-conjugated antibodies should fluorophore-based detection strategies be desired.
6.1.2. Procedure for FGF2 stimulation in the presence of compound
Seed a confluent plate or well of mESCs for 8–12h using growth media (Section 4.3) at 100,000 cells/cm2. Prepare one plate/well per desired condition.
Next day, wash cells twice and replace media with serum-free mESC media. Incubate cells overnight (~18h), 37 °C, 5% CO2.
Prepare solutions of FGF2 (25ng/mL) with or without the desired compound (e.g., surfen at 5.0μM) in serum-free mESC media. Treat cells for 15min.
Place plate on ice, wash cells twice with ice-cold DPBS.
Add ice-cold lysis buffer (1×10⁷ cells/mL) and scrape cells on ice.
Harvest whole cell lysates into pre-cooled Eppendorf tubes and centrifuge for 10min at 16,000×g at 4 °C.
Collect supernatant and determine protein concentrations using BCA Assay.
Normalize protein concentrations using lysis buffer.
6.1.3. Procedure for SDS-PAGE and Western blotting for Erk phosphorylation
Prepare 5 or 10μg of total protein per sample and normalize protein concentrations using ddH2O. Add appropriate amount of Laemmli buffer. Heat samples at 95 °C for 10min then cool samples on ice.
Load samples onto 10% SDS-PAGE minigel using running buffer. Resolve (e.g., a Biorad Mini Protean gel requires 90V ~80min) until dye front is at the bottom of the gel.
Remove gel from cassette and transfer gel onto a PVDF membrane using transfer buffer (e.g., 300mA, 1h, 4 °C). Place membrane in a new container.
Incubate with blocking buffer for 1h at RT with rocking.
Incubate blot with anti-phosphoErk1/2 antibody (1:4000) and anti-α tubulin (1:25,000) in blocking buffer overnight at 4 °C with rocking.
Wash blot 3× with TBST (10min, RT, rocking) then incubate with HRP-conjugated secondary antibodies, anti-rabbit HRP (1:10,000), anti-mouse HRP (1:10,000) in blocking buffer for 1h at RT.
Wash blot 3× with TBST, then add HRP detection reagent.
Wrap blot in Saran wrap, eliminating air bubbles, then expose blot to X-ray films in a dark room. Exposure times may need to be optimized for best signal to noise ratios.
Wash blot 3× with TBST, incubate with stripping buffer (10min, RT, rocking) then wash blot 3×with TBST again.
Repeat steps 4–8, replacing the anti-phosphoErk1/2 antibody (step 6) with the anti-Erk antibody. Sample data is shown in Fig. 5A.
Fig. 5.
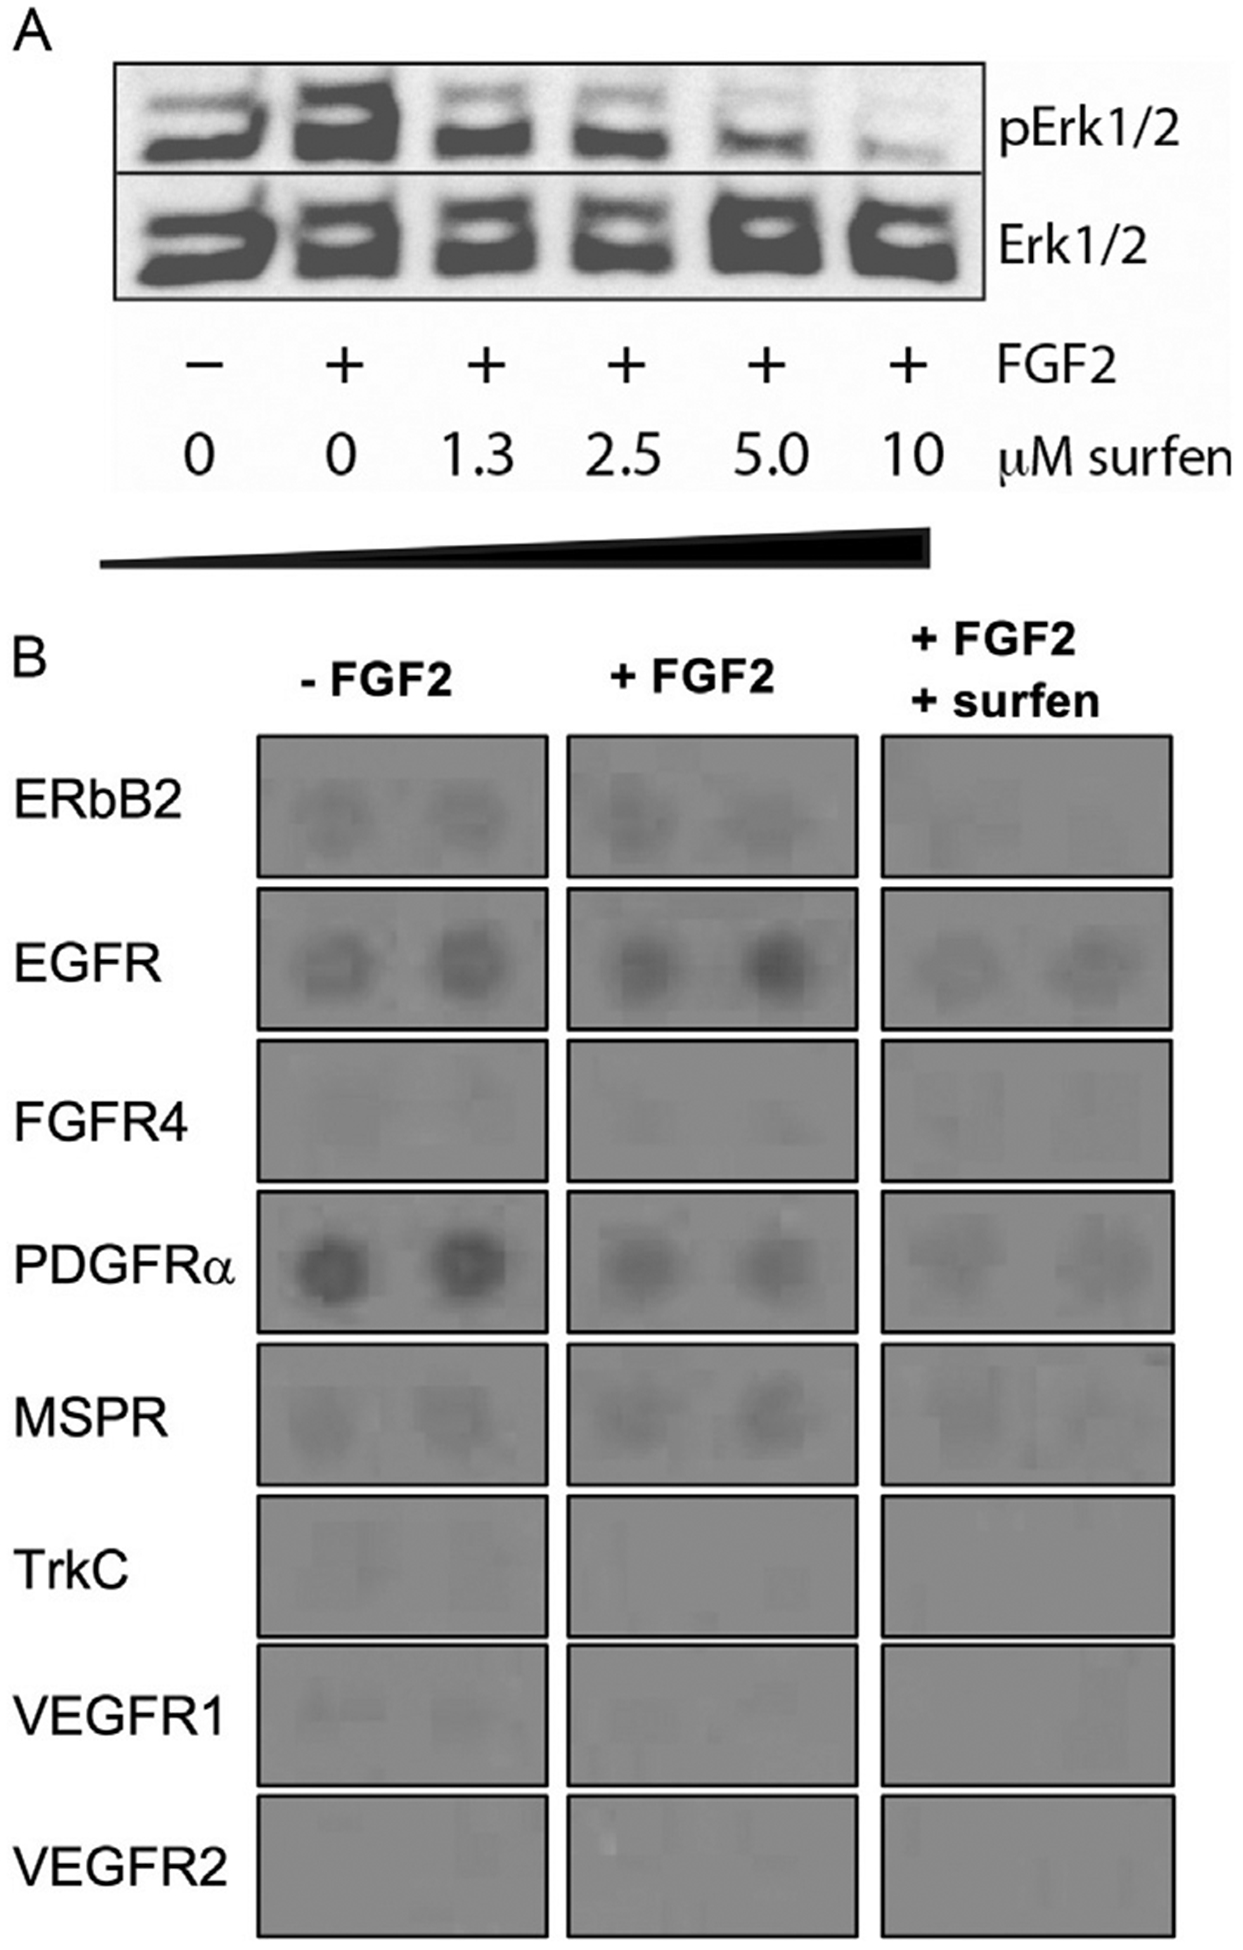
Surfen affects receptor tyrosine kinase signaling. (A) Surfen exhibits dose-dependent inhibition of Erk phosphorylation. (B) Surfen inhibits phosphorylation of a broad panel of RTKs. Figures adapted from Huang, M. L., Michalak, A. L, Fisher, C. J., Christy, M., Smith, R. A. A., & Godula, K. (2018). Small molecule antagonist of cell surface glycosaminoglycans restricts mouse embryonic stem cells in a pluripotent state. Stem Cells, 36(1), 45–54.
6.2. Receptor tyrosine kinase (RTK) assay
6.2.1. Materials
Mouse Phospho-receptor tyrosine kinase Array Kit (R&D Systems # ARY014): includes capture array with anti-RTK antibodies, Chemi Reagent Mix, buffers (Array Buffer 1–2, wash buffer), Anti-Phospho-Tyrosine-HRP antibody.
Clean plastic containers to wash arrays
6.2.2. Procedure for RTK array probing
Prepare cellular lysates as in Section 6.1.2.
Follow procedures indicated by the manufacturer for RTK Array kit.
Bring all reagents supplied in the kit to RT and keep samples on ice.
Incubate each array with 2.0mL Array Buffer 1 in the 4-well plate with rocking.
Dilute cell lysates with Array Buffer 1 to a final volume of 1.5mL and incubate with each array overnight, with rocking at 4 °C.
Wash each array 3× with 1× Wash Buffer for 10min, rocking, and incubate with anti-Phospho-Tyrosine-HRP Detection Antibody in 1× Array Buffer 2 for 2h at RT, with rocking.
Wash each array 3× with 1× Wash Buffer for 10min, rocking, then add 1mL of Chemi Reagent Mix evenly onto each membrane.
Place membrane on a plastic sheer protector and expose to X-ray film in a dark room. Sample data is shown in Fig. 5B.
7. Conclusions and future directions
Despite the complexity and seemingly untamable nature of the glycome, Nature has evolved lectins and glycan-binding proteins that recognize them with exquisite selectivity. Synthetic small molecules present new opportunities to interrogate and silence the glycome. Similar to how they have impacted protein biology, we expect small molecules that target glycans will inevitably reveal new mechanisms for how glycans regulate biological events. In this chapter, we have described the characterization of small molecules by their antagonistic effects toward growth factor binding to glycosaminoglycans and their corresponding effects toward mouse embryonic stem cell differentiation. By using this approach, we expect to enable discovery of GAG-binding molecules that exhibit important biological phenotypes.
Acknowledgments
This work was supported by startup funds from Scripps Research and the NIH Pathway to Independence Award to M.L.H. (NICHD: 1R00HD090292). T.N.S. is supported by an NIH Administrative Supplement Award (HD09029202S1). This work was also supported by the NIH Director’s New Innovator Award (NICHD: 1DP2HD087954–01). K.G. is supported by the Alfred P. Sloan Foundation (FG-2017–9094) and the Research Corporation for Science Advancement via the Cottrell Scholar Award (grant #24119).
List of Abbreviations
- °C
degrees centigrade
- BSA
bovine serum albumin
- DMEM
Dulbecco’s modified eagle medium
- DMSO
dimethyl sulfoxide
- ELISA
enzyme-linked immunosorbent assay
- Erk
extracellular-related kinase
- FBS
fetal bovine serum
- FGF2
fibroblast growth factor 2
- FGFR
fibroblast growth factor receptor
- GAG
glycosaminoglycan
- Gal
galactose
- GalNAc
N-acetylgalactosamine
- GF
growth factor
- GFP
green fluorescent protein
- GlcA
glucuronic acid
- GlcNAc
N-acetylglucosamine
- HRP
horseradish peroxidase
- HS
heparan sulfate
- HSPGs
heparan sulfate proteoglycans
- IdoA
iduronic acid
- LIF
leukemia inhibitory factor
- MAPK
mitogen-activated protein kinase
- MEM
minimum essential medium
- mESC
mouse embryonic stem cell
- NEAA
non-essential amino acid
- O-GlcNAc
O-linked N-acetylglucosamine
- PBS
phosphate buffered saline
- PG
proteoglycan
- PTM
post-translational modification
- RT
room temperature (~25 °C)
- RTK
receptor tyrosine kinase
- RT-qPCR
real time quantitative polymerase chain reaction
- TBST
tris-buffered saline, 0.1% Tween 20
- TMB
3,3′,5,5′-tetramethylbenzidine
References
- Adler S, Pellizzer C, Paparella M, Hartung T, & Bremer S (2006). The effects of solvents on embryonic stem cell differentiation. Toxicology In Vitro, 20(3), 265–271. [DOI] [PubMed] [Google Scholar]
- Alavi Naini A, & Soussi-Yanicostas N (2018). Heparan sulfate as a therapeutic target in tauopathies: Insights from zebrafish. Frontiers in Cell and Development Biology, 6, 163. [DOI] [PMC free article] [PubMed] [Google Scholar]
- Forsberg M, Holmborn K, Kundu S, Dagalv A, Kjellen L, & Forsberg-Nilsson K (2012). Undersulfation of heparan sulfate restricts differentiation potential of mouse embryonic stem cells. Journal of Biological Chemistry, 287(14), 10853–10862. [DOI] [PMC free article] [PubMed] [Google Scholar]
- Hacker U, Nybakken K, & Perrimon N (2005). Heparan sulphate proteoglycans: The sweet side of development. Nature Reviews Molecular Cell Biology, 6(7), 530–541. [DOI] [PubMed] [Google Scholar]
- Hennet T, & Cabalzar J (2015). Congenital disorders of glycosylation: A concise chart of glycocalyx dysfunction. Trends in Biochemical Sciences, 40, 377–384. [DOI] [PubMed] [Google Scholar]
- Huang ML, Michalak AL, Fisher CJ, Christy M, Smith RAA, & Godula K (2018). Small molecule antagonist of cell surface glycosaminoglycans restricts mouse embryonic stem cells in a pluripotent state. Stem Cells, 36(1), 45–54. [DOI] [PMC free article] [PubMed] [Google Scholar]
- Iozzo RV, & Schaeffer L (2015). Proteoglycan form and function: A comprehensive nomenclature of proteoglycans. Matrix Biology, 42, 11–55. [DOI] [PMC free article] [PubMed] [Google Scholar]
- Jin S, Cheng Y, Reid S, Li M, & Wang B (2010). Carbohydrate recognition by boronolectins, small molecules, and lectins. Medicinal Research Reviews, 30(2), 171–257. [DOI] [PMC free article] [PubMed] [Google Scholar]
- Kanagawa M (2019). Myo-Glyco disease biology: Genetic myopathies caused by abnormal glycan synthesis and degradation. Journal of Neuromuscular Diseases, 6, 175–187. 10.3233/JND-180369. [DOI] [PMC free article] [PubMed] [Google Scholar]
- Kraushaar DC, Rai S, Condac E, Nairn A, Zhang S, Yamaguchi Y, et al. (2012). Heparan sulfate facilitates FGF and BMP signaling to drive mesoderm differentiation of mouse embryonic stem cells. Journal of Biological Chemistry, 287(27), 22691–22700. [DOI] [PMC free article] [PubMed] [Google Scholar]
- Naticchia MR, Laubach LK, Tota EM, Lucas TM, Huang ML, & Godula K (2018). Embryonic stem cell engineering with a glycomimetic FGF2/BMP4 co-receptor drives mesodermal differentiation in a three-dimensional culture. ACS Chemical Biology, 13(10), 2880–2887. [DOI] [PMC free article] [PubMed] [Google Scholar]
- O’Connor SE, & Imperiali B (1996). Modulation of protein structure and function by asparagine-linked glycosylation. Chemistry and Biology, 3(10), 803–812. [DOI] [PubMed] [Google Scholar]
- Pickford CE, Holley RJ, Rushton G, Stavridis MP, Ward CM, & Merry CL (2011). Specific glycosaminoglycans modulate neural specification of mouse embryonic stem cells. Stem Cells, 29(4), 629–640. [DOI] [PubMed] [Google Scholar]
- Schuksz M, Fuster MM, Brown JR, Crawford BE, Ditto DP, Lawrence R, et al. (2008). Surfen, a small molecule antagonist of heparan sulfate. Proceedings of the National Academy of Sciences of the United States of America, 105(35), 13075–13080. [DOI] [PMC free article] [PubMed] [Google Scholar]
- Witten J, Samad T, & Ribbeck K (2019). Molecular characterization of mucus binding. Biomacromolecules, 20, 1505–1513. 10.1021/acs.biomac.8b01467. [DOI] [PMC free article] [PubMed] [Google Scholar]
- Yamazoe S, Shimogawa H, Sato S, Esko JD, & Uesugi M (2009). A dumbbell-shaped small molecule that promotes cell adhesion and growth. Chemistry & Biology, 16(7), 773–782. [DOI] [PubMed] [Google Scholar]
- Ying Q-L, Stavridis M, Griffiths D, Li M, & Smith A (2003). Conversion of embryonic stem cells into neuroectodermal precursors in adherent monoculture. Nature Biotechnology, 21(2), 183–186. [DOI] [PubMed] [Google Scholar]