Abstract
Acoustic clutter is a primary source of image degradation in ultrasound imaging. In the context of flow imaging, tissue and acoustic clutter signals are often much larger in magnitude than the blood signal, which limits the sensitivity of conventional power Doppler in SNR-limited environments. This has motivated the development of coherence-based beamformers, including Coherent Flow Power Doppler (CFPD), which have demonstrated efficacy in mitigating sources of diffuse clutter. However, CFPD uses a measure of normalized coherence, which incurs a non-linear relationship between image intensity and the magnitude of the blood echo. As a result, CFPD is not a robust approach to study gradation of blood signal energy, which depicts the fractional moving blood volume. We propose the application of mutual intensity, rather than normalized coherence, to retain the clutter suppression capability inherent in coherence beamforming, while preserving the underlying signal energy. Feasibility of this approach was shown via Field II simulations, phantoms, and in vivo human liver data. In addition, we derive an adaptive statistical threshold for the suppression of residual noise signals. Overall, this beamformer design shows promise as an alternative technique to depict flow volume gradation in cluttered imaging environments.
Index Terms: Doppler imaging, blood flow, spatial coherence, power Doppler, beamforming
I. INTRODUCTION
ASSESSMENT of blood flow using ultrasound has substantial clinical utility for diagnosis and surveillance. However, achieving adequate visualization in all patients remains a challenge for power Doppler imaging. Extraneous signals imposed by thermal noise, off-axis scattering, and reverberation can degrade image quality and obscure perception of blood flow [1]–[3].
A number of signal processing techniques may be used with conventional beamforming to improve sensitivity toward blood flow [4], [5]. Ultrafast acquisition sequences employ synthetic aperture focusing to amend the reduction in image quality inherent to unfocused transmissions [6], [7]. To improve rejection of the tissue signal, advanced filtering techniques, such as eigen-based filtering, have been proposed [8]–[10]. Further, filtering efficiency can be improved through down-mixing and motion compensation techniques [10], [11].
Despite these advancements, however, conventional delay- and-sum beamforming remains susceptible to acoustic clutter and thermal noise. This has motivated the development of coherence-based beamformers, which use aperture domain coherence as the basis of image formation rather than the magnitude of echo reflectivity [12]–[14].
Aperture domain, or ‘spatial’ coherence quantifies the similarity between echo signals received by a pair of elements. Mediums with diffuse structure, such as tissue or blood, exhibit a characteristic coherence behavior described by the van Cittert-Zernike (VCZ) theorem [15]. As described by Mallart and Fink, the spatial coherence function of these signals is proportional to the autocorrelation of the transmitter’s aperture function [16], [17]. In comparison, thermal noise and several forms of acoustic clutter are regarded as spatially incoherent signals [18], [19]. As a result, the coherence of aperture domain data can be leveraged to achieve suppression of acoustic clutter and thermal noise.
Li et al. established a coherence-based beamforming technique for blood flow visualization called Coherent Flow Power Doppler (CFPD), which employs a measure of correlation between received echo signals. In a number of studies, CFPD has demonstrated greater sensitivity over conventional power Doppler (PD) in cluttered environments [14], [20], [21]. However, a drawback of CFPD is that the image intensity portrays the normalized echo coherence, which is influenced by the signal-to-noise ratio [19], [22]. This implies that CFPD image intensity does not scale linearly with respect to blood signal power, but rather as a function of the relative noise power.
The non-linear relationship between CFPD image intensity and echo power compromises quantification of blood flow volume. In comparison, PD may be used to assess the fractional moving blood volume, as PD image intensity is proportional to the number of scatterers incurring a Doppler shift [23]–[25]. Assessment of the fractional moving blood volume is clinically valuable, as changes in local blood volume are correlated with malignancy and therapeutic response [26]–[28].
Herein, we propose a modification to the CFPD beamforming technique, termed power preserving Coherent Flow Power Doppler (ppCFPD). We demonstrate that utilizing a non-normalized coherence metric preserves sensitivity toward the underlying blood echo power, while maintaining superior rejection of acoustic clutter and thermal noise in comparison to conventional power Doppler. Furthermore, we derive a theoretical model for thresholding residual incoherent noise incurred by small, partial correlations. The efficacy of these techniques is demonstrated using simulation, phantom, and in vivo data.
II. IMAGE FORMATION TECHNIQUES
A. Power Doppler
Power Doppler is a conventional technique for blood flow imaging, depicting the integrated echo amplitude. In comparison to color Doppler, power Doppler offers several clinical advantages, namely being unaffected by aliasing and being relatively independent of insonation angle [25]. Unlike other Doppler methods, power Doppler does not measure blood flow velocity, but instead depicts the relative amount of flow within a pixel, termed the ‘fractional moving blood volume’ [24].
To isolate the blood signal, a clutter filter is applied to an ensemble of delay-and-sum beamformed RF-data to attenuate slowly moving tissue clutter. The power may then be estimated from the filtered complex data, r(a), over a temporal ensemble of length A.
| (1) |
Additionally, averaging over an axial kernel may be introduced to improve the estimation, as described by Loupas et al. [29].
B. Coherent Flow Power Doppler
Coherent Flow Power Doppler portrays the normalized spatial coherence of the backscattered echo. CFPD adapts the Short Lag Spatial Coherence (SLSC) tissue imaging technique by initially applying a filter to the delayed channel data to suppress the tissue signal. Subsequent calculation of the SLSC metric and summation over a temporal ensemble suppresses spatially incoherent clutter [14].
The SLSC metric is formulated using the normalized spatial coherence measured between two channel signals separated by a given distance, or ‘lag’. The normalized coherence, R(m), for a transmit aperture of size N may be written as
| (2) |
which is calculated for all pairs of time-delayed, filtered RF channel signals, yi and yi+m, separated by a given lag, m. To reduce random errors, estimation over a kernel, n, spanning approximately one wavelength is employed. Conventionally, m and N are described in terms of number of elements.
Measurement of the average normalized covariance is repeated for a set of M successive lags, which is used to obtain the SLSC metric,
| (3) |
The final CFPD image is reconstructed through computation of the SLSC metric for each pixel, which is squared and summed over a slow-time ensemble of length A, as
| (4) |
C. Power Preserving Coherent Flow Power Doppler
The proposed approach involves a modest, but impactful, modification to the CFPD beamforming scheme [30]. These adaptations are enacted to preserve the linear relation between pixel intensity and the blood echo power, while maintaining improved suppression of incoherent signals over PD. Omission of the denominator in the calculation for normalized coherence yields the spatial coherence, which may be written
| (5) |
In this paper, the term spatial coherence will be used to refer to Equation (5), and the term normalized spatial coherence will be used in reference to Equation (2). Coherence, also called mutual intensity, can be difficult to interpret in comparison to normalized coherence, as the resultant value is scaled by the relative signal intensities. However, in the context of a backscattered blood or tissue echo, spatial coherence may be theoretically described through an assessment of the van Cittert-Zernike theorem, as described in Section III–A.
Observing the spatial coherence for a given lag, m, allows the underlying signal energy to be conveyed in the intensity of the beamformed image. Averaging the spatial coherence for a defined set of M lags produces
| (6) |
Subsequently, the ppCFPD image is reconstructed by summing over a temporal ensemble, shown in Equation (7). Noting the omission of the squaring term used in Equation (4), the computation of the spatial coherence shown in Equation (7) effectively yields units of amplitude squared. As a result, the amplitude of the ppCFPD image exhibits a power scale equivalent to power Doppler.
| (7) |
III. THEORY
A. Coherence of Signals in the Aperture Domain
The van Cittert-Zernike theorem describes the development of wavefront coherence as a wave propagates away from an incoherent, quasi-monochromatic source [15]. In the context of ultrasound, insonification of an incoherent scattering medium gives rise to a backscattered echo, which is functionally equivalent to the medium acting as an incoherent source. As such, the coherence of the time-delayed echo observed at two channel positions across the aperture takes a predictable form [16]. For a pair of delayed channel signals, y1(f) and y2(f) at the focal depth, z, the spatial coherence may be written as
| (8) |
where χ(f) is the scattering function and Ro is the autocorrelation of the transmit aperture function evaluated as a function of the spatial separation between the channels, x1 − x2. As described in prior literature, the autocorrelation of a rectangular aperture may be modeled as a triangular function, [16]. Assuming a rectangular aperture, we may equivalently describe spatial coherence using the relation
| (9) |
The scattering function, χ(f), describes the collective acoustic scattering produced by the scatterers contained in the illuminated media. In a general sense, the scattering intensity and integrated Doppler spectra are linearly proportional to the number of scatterers incurring a Doppler shift [17], [23]; thus, spatial coherence is proportional to the fractional moving blood volume. Comparatively, measures of normalized spatial coherence portray only the transmitter aperture function and omit dependence on the scattering amplitude and depth [16].
B. The Effect of Noise on Coherence Measures
Acoustic clutter and thermal noise limit the performance of Doppler imaging techniques, particularly for slow flow assessment [2] and deep imaging targets [22]. These incoherent signals, which we refer to as ‘noise’ for brevity, produce a spatial coherence function that may be modeled by a delta function at lag zero [18], [19]. Coherence-based beamformers leverage this characteristic, as tissue and blood signals exhibit higher measures of normalized coherence in the short lag region (M < 30% N) [12], [14]. However, normalization imparts a dependency on the signal-to-noise (SNR) level, which is a practical drawback for beamforming applications.
This effect can be demonstrated by considering a scenario in which a received echo has been corrupted by noise. To begin, we note that the normalized spatial coherence described in Equation (2) is equivalent to the first moment, or mean, of the correlation, , measured between two channel signals.
If we consider the noise signal, n, to be uncorrelated from the signal of interest, s, the correlation measured between the two channel signals may be written
| (10) |
where the symbol denotes the expectation operator.
Assuming a rectangular receive aperture and that the respective signal powers associated with any two elements on the array are approximately equal, we can describe the correlation coefficient as
| (11) |
where ps represents the underlying blood signal power and Pn denotes noise power [19], [31]. Thus, the normalized coherence observed between two signals retains a dependence on the signal SNR.
In comparison, we may perform an analogous derivation for the spatial coherence posed in Equation (5). We note that this spatial coherence expression is equivalent to the first moment of the covariance, . Using the same assumptions as before, we obtain
| (12) |
As described in prior literature, the spatial coherence function of incoherent noise signals can be approximated as a delta function at lag zero, which is excluded from the summation in Equation (6) [18]. Therefore, we may theoretically conclude that the ppCFPD pixel intensity scales linearly with the power of the received blood echo, and is independent of additive noise for non-zero lags, as performed in Equation (6).
IV. ROBUST NOISE THRESHOLDING
Despite a favorable theoretical assessment, a small amount of uncorrelated noise will persist at non-zero lags due to random partial correlations [19]. The residual noise signal is often low amplitude; however, remaining noise may misguide assessment of flow, particularly in SNR-limited environments.
Further, a consequence of employing a measure of coherence in the ppCFPD beamforming scheme is the potential for negative pixel values to be produced. Negative pixel values confound image quality metrics and need to be addressed for standard log compression. Prior literature in related areas have associated negative pixel values with partial correlations incurred by clutter, and thus have enforced thresholding to set all negative pixel values to zero [32], [33].
We propose a statistically-driven threshold to adaptively suppress residual additive noise and simultaneously justify eliminating the negative signals generated by incoherent backscattered signals. The additive noise is modeled as a statistically independent process from the blood signal. Therefore, the threshold may be defined through an exercise where we presume that the channel data contain only noise.
A. An Expression of ppCFPD Pixel Intensity for Noise Signals
We begin by writing an equivalent statement of the ppCFPD pixel intensity, shown in Equation (7), for the particular scenario in which the channel data contain only noise. We model this noise signal as an independent, normally distributed random variable with constant variance, distributed identically across all elements. The ppCFPD coherence measure described in Equation (5) may be written in terms of the normalized correlation coefficient, , through the relationship
| (13) |
Due to the assumption of constant variance, this equation may be simplified by noting that the noise variance can be equivalently written as
| (14) |
where H indicates the axial kernel size. Thus we may further simplify Equation (13) to
| (15) |
Modeling as an ergodic random variable, we may extend this derivation to Equations (6) and (7), to obtain an expression of ppCFPD pixel intensity as
| (16) |
B. Modeling Gaussian Statistics of ppCFPD Pixel Intensity for Noise Signals
Next, we consider the statistical character of the correlation measured between channel signals, , and subsequently, the statistical character of ppCFPD pixel intensity. For a Gaussian noise signal, the expected value of the correlation coefficient is zero. In application, estimation of the sample correlation using finite signal lengths will incur non-zero correlation measures, i.e. non-zero variance.
The exact distribution of the sample correlation measured between two normal variables is rather arduous, so we employ an approximation as follows [34]. For small correlations, we note the Fisher transform is approximately an identity function, such that the value of ρ(m) is approximately equal to its related Z-score, z(m). The correlation coefficient may be transformed to the Z-space via the Fisher Transform,
| (17) |
For the derivation of ppCFPD pixel intensity statistics, we will approximate the distribution of the correlation coefficient using its correspondent Z-score statistical distribution, which is approximately normally distributed, (z ~ N(0, σz)), with calculable standard deviation
| (18) |
Modeling ρ(m) as a normally distributed random variable allows us to generalize the statistical character of ppCFPD pixel intensity via properties of location-scale family probability distributions, which we briefly discuss in Appendix A. Thus, we find that the pixel intensity for noise signals is normally distributed with a mean and variance described as
| (19) |
Additionally, it may be noted that the summation term may be expressed via generalized harmonic numbers, as
| (20) |
such that a closed form approximation can be obtained using the truncated series form
| (21) |
This derivation is further described in Appendix B.
C. Approximation of Noise Variance
In practice, it is necessary to estimate the noise variance, , as depicted in Equation (14). Reasserting our assumption that the noise signal is zero-mean, the noise variance is equal to the noise power . As described in prior literature [19], [35], we can obtain an expression for noise power in terms of the SNR, as
| (22) |
where the SNR can be estimated via a lag-one autocorrelation technique described by Long et al. [36].
D. Definition of a Threshold
Once we obtain an estimate of the ppCFPD pixel variance for the noise signal as shown in Equation (19), we can derive a threshold to suppress residual noise. Here, we will define the threshold as the upper bound of the 95% statistical interval of noise signal intensity. For a given pixel, x, this may be written
| (23) |
We note that the method of setting negative pixel values to zero used by other investigators is equivalent to defining the threshold as the upper bound of the 50% statistical interval of pixel intensity [32], [33], [37].
Comparatively, PD and CFPD pixel intensity is biased by noise. A supplementary derivation of pixel intensity for PD is presented in Appendix C. For channel data containing only noise, we observe PD pixel intensity is approximately Gamma distributed with mean and variance described as
| (24) |
V. METHODS
A. Simulated Data Acquisition
Simulations were performed using Field II to study the performance of ppCFPD under varied noise conditions [38], [39]. The simulated phantom included a single blood vessel with a 5 mm diameter, embedded in a 9 cm by 5 cm homogeneous tissue block at a 45° angle relative to the transducer. The blood signal was simulated using scatterers moving in a laminar flow state. The velocity distribution was parabolic [40], with a maximum velocity of 5 cm/sec. This models the range of velocities observed in capillary (<1 mm/sec), arteriole (<1 cm/sec), and small arteries [2], [40].
Channel data for the blood scatterers and tissue scatterers were simulated separately, then combined into a single channel data set. The blood channel data were scaled −60 dB relative to the surrounding tissue. Normally distributed white noise was added to the channel data to simulate thermal noise [19]. The noise was scaled between 20 to −20 dB relative to the power of the blood channel data. No temporal motion was simulated.
The simulated acquisitions were performed using a 128-element linear array transducer with a center frequency of 3 MHz and pitch of 0.257 mm. For each acquisition, plane waves between −4° and 4° spaced by 1° were simulated at a PRF of 9 kHz. The channel data were delayed using Plane Wave Synthetic Focusing (PWSF), in which the delayed channel data acquired at consecutive angles were summed to produce a final pulse repetition frequency of 1 kHz [41]. PWSF achieves a uniform focusing throughout the image and maintains consistent coherence measures [31]. A 10 Hz IIR filter cutoff was used for temporal clutter suppression, chosen empirically to provide filter stability and rejection of the tissue signal.
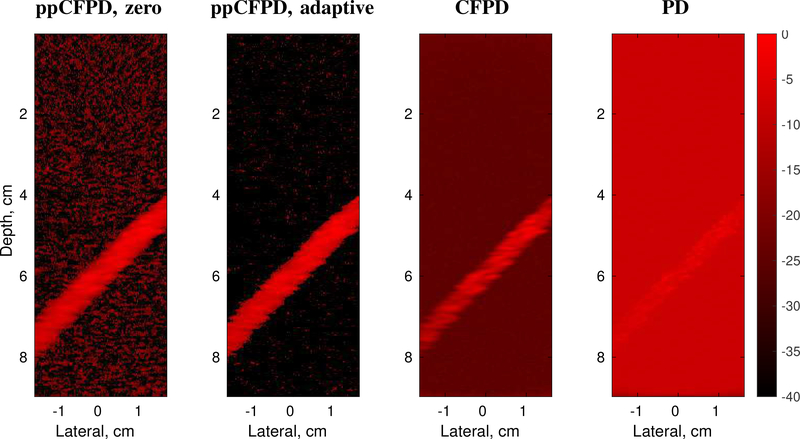
Matched PD, CFPD, and ppCFPD images were generated as shown in Figure 1. For ppCFPD and CFPD processing, a maximum lag (M) of 20 was used to correspond with prior literature [20]. A kernel size (H) equal to one wavelength was employed, to reconcile the trade-off between jitter and loss of spatial resolution [42]. Images were formed using an ensemble of 50 frames, and displayed on a 10log10(·) dB scale.
Fig. 1:
Comparison of image formation techniques. For ppCFPD, application of the theoretical threshold (ppCFPD, adaptive) suppressed the noise floor more effectively than thresholding negative values (ppCFPD, zero). Note that the dynamic range is extended so that the noise floor is visible in all cases. Images depict a 100% fractional moving blood volume realization with −10dB blood channel SNR.
B. Perception of Fractional Moving Blood Volume
The assertion that ppCFPD image intensity is linearly proportional to the blood echo power was evaluated via a successive dilution study, emulating a prior PD assessment by Rubin et al. [24]. As described in subsection V–A, the blood channel data was obtained independently from the tissue channel data using Field II. The blood scatterers were separated into two groups: a stationary subset and a moving subset. The fractional moving blood volume was modified by incrementally changing the ratio of moving-to-stationary blood scatterers. This was done to fix the acoustic scattering strength of the blood scatterers across fractional levels and produce equivalent scaling for a given SNR. The stationary blood scatterers are rejected during processing, so the observed blood signal power decreases proportionally with the fractional moving blood volume, in agreement with prior literature [23], [24]. The fraction of moving blood scatterers was iteratively decreased from 100% (all moving) to 1% (nearly all stationary). Five independent simulations of blood and tissue were generated for each fractional step. In addition, additive thermal noise was added to the channel data containing blood and tissue to assess discrimination of fractional moving blood volume at five blood channel SNR levels.
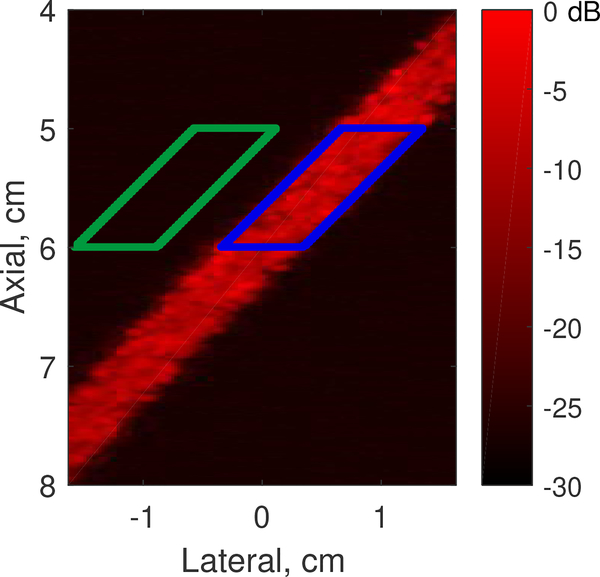
The average blood pixel intensity was measured within a defined region of interest for each non-log compressed image, as shown in Figure 2. For each fractional step, the mean and standard deviation of the average intensity was measured across the five independent simulations to generate curves. The curves were normalized to the highest mean value for each noise case, in accordance with the technique by Rubin et al. [24]. The theoretical thresholding was not applied when estimating the fractional moving blood volume. However, negative pixels were excluded from the calculation of mean and standard deviation, since negative pixels are produced by out-of-phase noise signals [33].
Fig. 2:
Signal (blue) and background (green) ROIs for image quality metrics.
C. Image Quality Metrics
Conventional image quality metrics, including contrast and contrast-to-noise ratio (CNR), were calculated as shown in Equations (25) and (26). Negative pixels were not considered when calculating image quality metrics. This approach is consistent with similar coherence algorithms used in prior literature, which set negative pixels to zero [32], [33], [37].
We calculated image quality using
| (25) |
| (26) |
where Si indicates the signal within the vessel ROI, and So indicates the signal within the background ROI, as shown in Figure 2. The standard deviation of the pixel values is represented by σ. The mean signal value is denoted by an overbar symbol. The theoretical thresholding was not applied when calculating metrics.
We acknowledge that the image quality metrics measured across PD, CFPD, and ppCFPD may not be entirely comparable; these algorithms depict fundamentally different quantities (echo intensity and spatial coherence, respectively), so conventional metrics may not equally impute the ability to discriminate structures with a similar intensity level. For instance, squaring the SLSC metric in the summation of Equation (4) extends the dynamic range of CFPD, which improves measures of contrast, but does not necessarily improve feature detection. Recently, Rodriguez-Morales et al. proposed an alternative image quality metric termed the generalized contrast-to-noise ratio (GCNR) [43]. The GCNR metric depicts the likelihood of discriminating a signal of interest as an expression of probability density function overlap, which is invariant to changes in dynamic-range. For completeness, we include an assessment of image quality in terms of the GCNR, measured
| (27) |
where OVL is the overlap between the intensity distribution of the background and the intensity distribution of the blood signal. This formulation implies that GCNR = 1 if there is complete discrimination of the blood signal, and GCNR = 0 if the distributions completely overlap. To compute the GCNR, histograms with 1,000 equally spaced bins were generated for the data within the signal and noise ROIs, respectively. The fraction of pixels contained in overlapping bins was measured as OVL. The GCNR was measured at each fractional moving blood volume increment, for blood channel SNR levels between −20 and 20 dB.
D. Assessment of Theoretical Bound for Noise Thresholding
For algorithm validation, the theoretical noise threshold was applied to the simulation and phantom data produced in subsections V–A and V–E. The noise power was estimated using the lag-one spatial coherence described by Long et al. [36]. For the Field II simulations, a single estimate of pixel variance was obtained as shown in Equation 19, using the average of the noise power estimates for . Values below the theoretical threshold were set to zero prior to log compression.
For the phantom data, local estimates of pixel variance were obtained to accommodate depth-dependent attenuation. Noise variance, as shown in Equation 12, was computed for each pixel via lag-one spatial coherence, using a kernel matching the SLSC axial kernel.
E. Phantom Data Acquisition
A wall-less vessel phantom study was conducted for further validation. An aqueous solution of 6% (mass %) polyvinyl-alcohol (PVA) with a molecular weight of 89,000 (Sigma-Aldrich, St. Louis, MO) was heated to 85° C and stirred until fully dissolved. To form a scattering medium, graphite powder was added to the solution at a 6% mass concentration [44]. Once the solution reached room temperature, the PVA/graphite solution was poured into a mold made of a 12 oz disposable paper cup. Prior to adding a PVA/graphite solution, a 6.35 mm (1/4 in) diameter glass rod was inserted to form a single 45 degree vessel. The phantom was stored in a freezer at −20° C for 16 hours, then thawed at room temperature for 8 hours to complete one freeze-thaw cycle. Three freeze-thaw cycles were completed to increase phantom stiffness and preserve the vessel structure upon removal of the glass rod.
An aqueous cornstarch solution served as a blood-mimicking fluid. The concentration of cornstarch was varied to emulate fractional changes in the proportion of blood scatterers. The base solution contained contained 3% (mass %) cornstarch [14], which corresponded to the 100% relative concentration. The base solution was diluted to obtain 85, 70, 55, 40, 25, 10 and 0% relative concentrations. To ensure the concentration remained constant, the solution was placed in a beaker and continuously stirred. A continuous-flow pump (Cole-Parmer, Vernon Hills, IL) was used to circulate the solution through the vessel at velocities of 3 and 5 cm/s (95 and 57 ml/min). Proximal to the phantom, the blood mimicking fluid was passed through a pulse dampener to obtain a laminar flow profile.
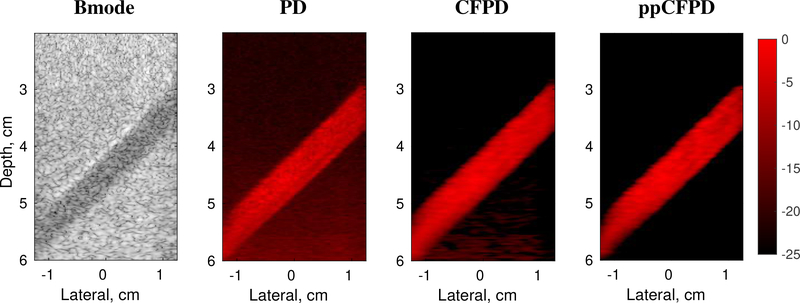
The phantom study was conducted using a Verasonics Vantage system (Verasonics, Inc., Kirkland, WA) and an L12–5 linear array probe with a 5.43 MHz center frequency. Channel data were acquired from nine angled plane wave transmits spanning from −4° to 4°, spaced by 1°. The channel data acquired at the nine angles were compounded to achieve synthetic aperture focusing, resulting in a final PRF of 1 KHz. Data were acquired at 11, 16, and 21 Volts to obtain varied SNR. For each voltage, the SNR was estimated from the RF data using the temporal lag-one correlation [35]. A 50 Hz IIR filter was used to suppress tissue clutter. The PD, CFPD, and ppCFPD images were formed using matched ensembles of 50 frames, as shown in Figure 3. For ppCFPD and CFPD processing, a maximum lag (M) of 20 and a kernel size (H) equal to one wavelength was employed.
Fig. 3:
Phantom study images. Figure depicts a 100% fractional moving blood volume realization with 5 cm/s flow, obtained at 11 V. Bmode image shown on a 60 dB scale.
F. In Vivo Data Acquisition
An in vivo liver imaging case was obtained from a healthy adult male subject in compliance with Vanderbilt’s Institutional Review Board (IRB) protocol. The study was conducted using a Verasonics Vantage system (Verasonics, Inc., Kirkland, WA) and a C5–2 curvilinear array probe with a 4.16 MHz center frequency. Channel data were acquired at 21 V from nine angled unfocused transmits spanning from −4° to 4°, spaced by 1°. The steered transmit delays were calculated as , where r is the probe radius, ϕ is the elemental angle span, θ is the steering angle, and c is the speed of sound. The channel data were coherently compounded to achieve synthetic aperture focusing, producing a final PRF of 600 Hz.
An adaptive demodulation scheme was applied to the channel data to reduce motion incurred by the patient and sonographer, using a kernel size of 10 λ and a lag of 1 frame [4], [11]. A 120 Hz IIR filter was applied to suppress tissue clutter. For ppCFPD and CFPD processing, a maximum lag (M) of 20 and a kernel size (H) equal to one wavelength was employed. The theoretical threshold was applied. The images were formed using 50 frame ensembles.
VI. RESULTS
A. Fractional Moving Blood Volume
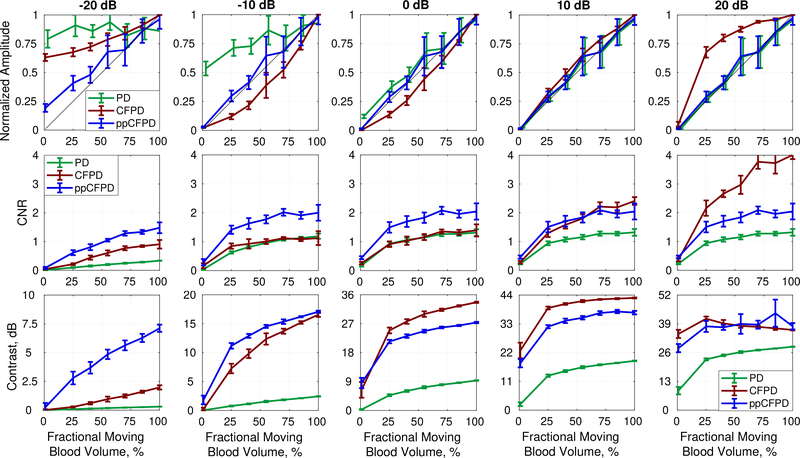
Figure 4 depicts plots of PD, CFPD, and ppCFPD image intensity as a function of the fractional moving blood volume for five simulated SNR levels. CFPD produces a non-linear response with respect to echo magnitude, whereas the ppCFPD image response is linear. The observed variability of CFPD is a result of normalization, which imparts a dependence on SNR, as CFPD image intensity is proportional to . This relationship results in a concave or convex function of intensity, depending on the SNR.
Fig. 4:
Plots depict the mean and standard deviation of image quality metrics measured across simulation realizations.
Top Row: The ppCFPD blood signal amplitude remains a linear approximation of the fractional moving blood volume despite variation in the blood channel signal-to-noise ratio (SNR) from −20 dB to 20 dB. This may be observed in the figure, as the ppCFPD curve closely approximates the theoretical value, shown in black. Center Row: The CNR of ppCFPD remained nearly constant across noise levels indicating effective suppression of the noise floor relative to the blood signal. Bottom Row: For all noise cases, ppCFPD and CFPD offered greater contrast than conventional PD.
As observed in prior literature, PD is an effective linear estimator of the fractional moving blood volume in good imaging conditions [25]. However, this relationship is compromised in SNR-limited environments, as noise overwhelms the PD signal. In comparison, ppCFPD is robust to varied SNR and remains proportional to the fractional moving blood volume. The greater capability of ppCFPD to accurately estimate relative concentrations of blood flow in SNR-limited environments is attributed to greater suppression of incoherent noise, which extends the dynamic range and improves sensitivity toward low-amplitude features.
B. Image Quality
Figures 4 and 5 depict image quality measures for ppCFPD, CFPD, and PD obtained at seven blood volume concentrations and five levels of SNR. In matched simulations, ppCFPD yielded marked image quality improvement over PD, exhibiting contrast improvements up to 26.24 dB and a CNR gain of 1.38.
Fig. 5:
Each plot depicts the GCNR metric as a function of the blood channel signal-to-noise ratio, for incrementally decreasing fractional blood volume levels. The fractional moving blood volume ranged from 100% (left), indicating full flow, to 1% (right), indicating nearly no flow. The ppCFPD images produced a higher GCNR for blood flow at all levels of flow, indicating greater discrimination capability in comparison to PD and CFPD.
In Figure 4, we observe that measures of contrast and CNR for CFPD exceed those of ppCFPD in several cases. This illustrates the dependence of CFPD image quality on SNR. At 20dB SNR, CFPD demonstrates a substantial CNR gain in comparison to lower SNR levels. This behavior is similar to SLSC performance, where the CNR value has been shown to peak at a specific SNR depending on intrinsic contrast of the medium [19], [45]. In comparison, CNR performance of ppCFPD is fairly flat, indicating that it is robust to noise.
It is worth noting that we observed low intensity side lobes in both CFPD and ppCFPD under conditions of low channel noise, which has also been observed in previous literature [14], [32]. These side lobe artifacts are due to out-of-phase correlations produced by off-axis signals. The squaring term in CFPD transforms these negative correlation values to positive pixel intensities; as a result, CFPD exhibits a slight reduction in contrast at high SNR levels due to the presence of these side lobes [14]. In ppCFPD image formation, negative values are removed, so these side lobes do not degrade image quality metrics. The squaring operation in CFPD additionally decreases the GCNR of CFPD in SNR-limited environments, as a greater proportion of the noise pixel intensity may overlap with low, positive blood pixel values.
C. Theoretical Thresholding
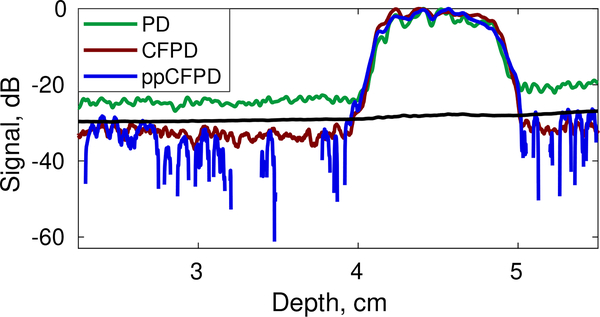
Initial simulations demonstrate feasibility in using the theoretical threshold for robust noise suppression. For a case of channel data containing only noise, the assumption that the statistical distribution of the correlation coefficient is equivalent to the distribution of the Z-score appears to hold. Extension of this model to ppCFPD pixel intensity appears to remain valid in simulation, as depicted in Figures 6 and 7. Figure 7 depicts an axial cross section for simulations with 10 dB and −10 dB channel SNR. Both ppCFPD and CFPD demonstrate greater dynamic ranges as a result of improved noise suppression. The theoretical threshold remains effective at both SNR levels.
Fig. 6:
Left: Distribution of pixel intensity for channel data containing only noise. The theoretical threshold is an effective approximation of the 95% confidence interval, compared to the empirically measured value. Right: The confidence interval remained a robust approximation of noise pixel variance for simulations additionally containing blood. Data shown depicts a 100% fractional moving blood volume realization with −10dB SNR.
Fig. 7:
Axial cross sections of simulation data for 10dB channel SNR (left) and −10dB channel SNR (right) cases. Realization shown depicts a 100% fractional moving blood volume case. The black line depicts the theoretical threshold.
Both ppCFPD and CFPD beamforming improve discrimination of the blood signal from background noise in comparison to PD. Application of the theoretical threshold further improves this delineation, shown in single vessel simulations in Figure 1.
The presence of side lobes in the high SNR cases did skew the distribution of ppCFPD pixel intensity toward negative values, which violates the assumption of Gaussian distributed noise. As a result, we observed underestimation of the theoretical noise threshold for simulations with high SNR. However, in these conditions, the blood is readily observed without thresholding.
Preliminary efficacy of the theoretical threshold was also observed in phantom data. Figure 8 shows an axial cross section of the phantom with locally-derived threshold estimates. The theoretical threshold can be applied to effectively suppress the noise floor in the ppCFPD images.
Fig. 8:
Axial cross section of phantom ppCFPD data (blue) depicting the theoretical threshold (black) obtained using local estimates.
D. Phantom Study
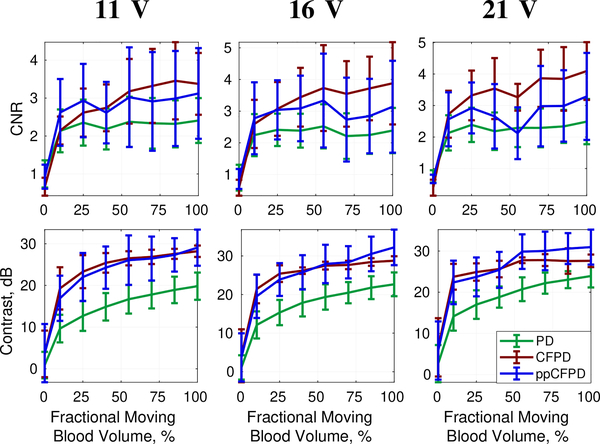
Overall, ppCFPD offered greater noise suppression than PD, resulting in image quality improvements of up to 13.42 dB in contrast and 2.1757 for CNR. Figure 12 depicts image quality metrics for the 5 cm/s case across voltages. Varying the acquisition voltage between 11, 16, and 21 Volts produced varied SNR levels of 28.14 ± 3.67 dB, 31.16 ± 3.66 dB, and 33.31 ± 3.68 dB, respectively.
Fig. 12:
CNR and Contrast plots for phantom data obtained at 11, 16, and 21 V. Mean and standard deviation of metrics shown for the 5 cm/s velocity realizations.
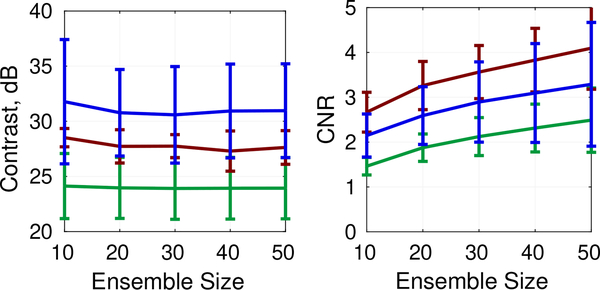
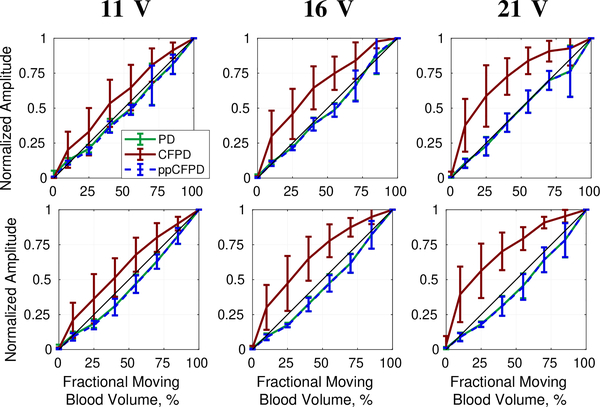
Figures 9 and 10 depict results for ensemble lengths ranging from 10 to 50 frames. As shown in Fig. 10, ppCFPD remains an effective estimator of the fractional moving blood volume for short ensemble lengths, which is necessary for most clinical systems.
Fig. 9:
Contrast and CNR for varied ensemble lengths. Phantom data shown corresponds to the 5cm/s flow rate and 21 V acquisition.
Fig. 10:
Fractional moving blood volume plots for ensemble lengths between 10 (left) and 50 (right) frames. The phantom data shown correspond to 5 cm/s flow obtained at 21 Volts.
Figures 11 and 12 demonstrate that ppCFPD image performance was consistent across the varied voltage levels, indicating that ppCFPD is robust to varied SNR. In comparison, the CFPD image performance exhibits a non-linear relationship toward the fractional moving blood volume.
Fig. 11:
Fractional moving blood volume plots for phantom data obtained at 11, 16, and 21 V for 3 cm/s (top) and 5 cm/s (bottom) blood flow velocities.
A small amount of clutter is visible in the deeper region of the ppCFPD image of Figure 3; however, the clutter signal is likely tissue signal that was not suppressed by the wall filter. The application of motion compensation techniques [11] and advanced clutter filters [8] would improve suppression of residual tissue signals.
E. In Vivo Case
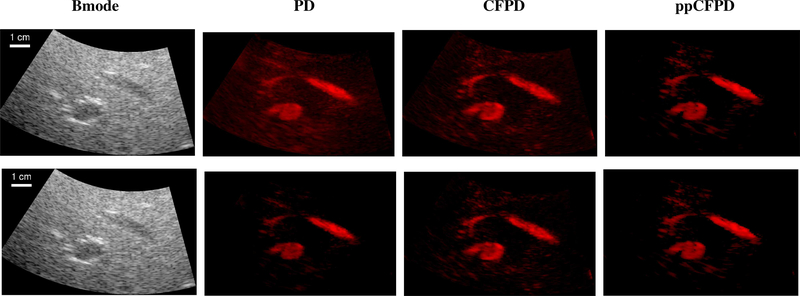
PD, CFPD, and ppCFPD images of a healthy liver were produced to demonstrate preliminary in vivo efficacy, as shown in Figure 13. The in vivo case had a beamformed SNR of 33.14 dB.
Fig. 13:
Preliminary images of liver blood flow to demonstrate in vivo feasibility. Bmode images shown on a 60 dB scale. Top Row: PD, CFPD, and ppCFPD images displayed on a 27 dB scale. Images produced via the ppCFPD algorithm effectively delineated small vessels, which are nearly indistinguishable from the noise floor in the PD case.
Bottom Row: The dynamic range is scaled to just above the perceptible noise floor for each image. The dynamic range is 21 dB for PD, 25 dB for CFPD, and 27 dB for ppCFPD. Decreasing the dynamic range compromises the visibility of low-intensity vasculature in PD relative to ppCFPD and CFPD.
The CFPD and ppCFPD images have a greater dynamic range than the PD image, resulting in greater discrimination of low amplitude vasculature. As shown with in vivo data, limiting the PD display dynamic range improves contrast, but results in the loss of low intensity image features.
VII. DISCUSSION AND CONCLUSIONS
This paper presents an adapted coherence-based beamforming technique based on a measure of spatial coherence, rather than normalized spatial coherence, to mitigate incoherent clutter signals while preserving the backscattered echo intensity. In addition, a theoretical threshold was derived to rigorously justify the suppression of negative pixel values and small positive pixels associated with clutter signals, and to facilitate improved perception of vasculature.
The performance of ppCFPD was robust to varied ensemble lengths, SNR levels, and blood flow velocities. The coherence metric used in ppCFPD is not normalized; therefore, ppCFPD images portray the mutual intensity of the channel signals. As shown in simulation and phantom data, the resultant ppCFPD image intensity scales linearly with the underlying echo magnitude. This means that the ppCFPD image intensity portrays the fractional moving blood volume, which may be clinically valuable for in vivo assessment of local changes in perfusion. In comparison, CFPD employs a normalized measure of coherence, which results in varied performance depending on the SNR.
The ppCFPD technique produced higher image quality over PD, which is ascribed to improved suppression of thermal noise and incoherent clutter. Subsequently, ppCFPD images exhibit a greater dynamic range than PD images, which enables low intensity blood vessels to be more readily observed.
The simulation and phantom experiments assessed ppCFPD performance for varied conditions of white thermal noise. We anticipate that other forms of spatially incoherent clutter, such as reverberation, will be suppressed in accordance with our theoretical derivation, though not directly studied here. However, other forms of image degradation, such as phase aberration, may reduce overall coherence measures [18]. In the presence of these factors, spatial coherence would be decreased and the ppCFPD pixel intensity would likely be degraded, though PD would suffer as well.
We note that coherence-based beamformers can be used in conjunction with other advanced tissue clutter suppression techniques. In this paper, an adaptive demodulation technique proposed by Tierney et al. was used to compensate for tissue motion in vivo [11]. Advanced filtering techniques would likely further improve suppression of residual tissue, which is not inherently mitigated in coherence-based beamforming. Filtering is necessary because tissue signals are coherent in the aperture domain. We expect that the combination of coherence beamforming and advanced clutter filters will yield superior sensitivity toward blood flow.
As described for similar coherence-based beamforming approaches, computational cost remains a practical drawback of this technique. The ppCFPD beamforming scheme has a substantially larger computational burden in comparison to power Doppler due to the necessity to perform coherence estimates of channel data signals. We anticipate that a software beamforming implementation would make a real-time implementation of ppCFPD feasible, using approaches developed by others [21].
An unresolved challenge for coherence imaging in general is the presence of so-called ‘dark-region artifacts’ [46], [47]. These artifacts occur when regions adjacent to bright targets exhibit reduced coherence measures due to high amplitude off-axis scattering. In the context of blood flow imaging, out-of-phase or negative correlation measures produce the appearance of negative pixel values. Since measures of signal power and PD are inherently positive valued, the consensus in prior investigations has been to set these values to zero [32], [37]. We hypothesize that the development of advanced filters may reduce the amplitude of acoustic clutter, which can produce dark-region artifacts and reduce visualization of adjacent, low-amplitude blood flow.
Overall, this approach shows promise for improving discrimination of blood flow within cluttered environments. Both CFPD and ppCFPD offer improved image quality over PD; however, we demonstrated that the CFPD technique exhibited non-linear characteristics as a function of varied SNR. In comparison, ppCFPD was robust to thermal noise power and retained sensitivity to relative variations in fractional moving blood volume. This preliminary study suggests that a mutual intensity metric may be a valuable approach to assess blood flow gradation in cluttered imaging environments.
ACKNOWLEDGMENT
The authors would like to thank the staff of the Vanderbilt University ACCRE computing resource.
This work was supported by National Institute of Biomedical Imaging and Bioengineering Grant T32-EB021937 and National Science Foundation Award IIS-1750994.
APPENDIX A
ELABORATION ON LOCATION-SCALE PROBABILITY
As asserted in Section IV–A, location-scale probability statistics, which includes the normal distribution, are used to obtain the model of ppCFPD pixel intensity for noise signals. The family of location-scale probability distributions assert that for any random variable X described by a class of distributions, Ω, that belongs to the location-scale family, the distribution is also a member of Ω.
This means that for two independent, normally-distributed random variables, and , their linear combination will also be normally distributed,
| (28) |
As posed previously in Equation (16), the expression for the ppCFPD pixel intensity for a signal containing only noise is
where we describe the variable to be a normally distributed random variable with calculable mean and variance as described in 18, assuming that is approximately equal to its comparable Z-score, z(m), for low correlation values as obtained in the case of IID noise.
The remaining variables in Equation (16) are defined as constants, such that the ppCFPD pixel intensity shares a linear relationship with , following the assertions in Equation (28). This allows us to obtain the final probability distribution for the ppCFPD pixel intensity described in Equation (19).
APPENDIX B
CLOSED FORM APPROXIMATION OF A HARMONIC NUMBER
We note that an approximate closed form solution for generalized harmonic numbers is formulated as
| (29) |
where Bk are Bernoulli numbers and γ is the Euler-Mascheroni constant, which describes how harmonic numbers asymptotically approach the natural log. A closed form approximation can be obtained using a truncated series
| (30) |
The accuracy of using the truncated series approximation in the difference equation is depicted below in Table I. The relative error was evaluated for N = 128 elements and M = 20 lags as
| (31) |
TABLE I:
Accuracy of Approximation
| Approximation Form | Error, dB |
|---|---|
| −47.3 dB | |
| −98.1 dB | |
| −194.7 dB |
APPENDIX C
POWER DOPPLER NOISE STATISTICS
The formula for power Doppler shown in Equation (1) may be expanded to
| (32) |
where the power Doppler signal is computed as the squared sum of N delayed channel signals, yi(n), summed over a temporal ensemble, A.
If we assert the same assumptions as in the ppCFPD analysis, namely that , we find that
| (33) |
Squaring this normal term yields a Gamma distribution,
| (34) |
of shape and scale . The summation of A Gamma distributed parameters, Xi, with the same scale, θ, produces
| (35) |
hence we find that power Doppler pixel intensity computed for channel signals containing only noise is distributed
| (36) |
with a non-zero mean and variance of
REFERENCES
- [1].Torp-Pedersen ST and Terslev L, “Settings and artefacts relevant in colour/power doppler ultrasound in rheumatology,” Annals of the rheumatic diseases, vol. 67, no. 2, pp. 143–149, 2008. [DOI] [PubMed] [Google Scholar]
- [2].Heimdal A and Torp H, “Ultrasound doppler measurements of low velocity blood flow: limitations due to clutter signals from vibrating muscles,” IEEE transactions on ultrasonics, ferroelectrics, and frequency control, vol. 44, no. 4, pp. 873–881, 1997. [Google Scholar]
- [3].Kim M, Abbey CK, and Insana MF, “Efficiency of us tissue perfusion estimators,” IEEE transactions on ultrasonics, ferroelectrics, and frequency control, vol. 63, no. 8, pp. 1131–1139, 2016. [DOI] [PubMed] [Google Scholar]
- [4].Tierney J, Walsh K, Griffith H, Baker J, Brown D, and Byram B, “Combining slow flow techniques with adaptive demodulation for improved perfusion ultrasound imaging without contrast,” IEEE transactions on ultrasonics, ferroelectrics, and frequency control, 2019. [DOI] [PMC free article] [PubMed] [Google Scholar]
- [5].Nayak R, Kumar V, Webb J, Fatemi M, and Alizad A, “Non-invasive small vessel imaging of human thyroid using motion-corrected spatiotemporal clutter filtering,” Ultrasound in medicine & biology, 2019. [DOI] [PMC free article] [PubMed] [Google Scholar]
- [6].Bercoff J, Montaldo G, Loupas T, Savery D, Mézière F, Fink M, and Tanter M, “Ultrafast compound doppler imaging: Providing full blood flow characterization,” IEEE transactions on ultrasonics, ferroelectrics, and frequency control, vol. 58, no. 1, pp. 134–147, 2011. [DOI] [PubMed] [Google Scholar]
- [7].Nikolov SI and Jensen JA, “In-vivo synthetic aperture flow imaging in medical ultrasound,” IEEE transactions on ultrasonics, ferroelectrics, and frequency control, vol. 50, no. 7, pp. 848–856, 2003. [DOI] [PubMed] [Google Scholar]
- [8].Yu AC and Lovstakken L, “Eigen-based clutter filter design for ultrasound color flow imaging: A review,” IEEE transactions on ultrasonics, ferroelectrics, and frequency control, vol. 57, no. 5, pp. 1096–1111, 2010. [DOI] [PubMed] [Google Scholar]
- [9].Demené C, Deffieux T, Pernot M, Osmanski B-F, Biran V, Gennisson J-L, Sieu L-A, Bergel A, Franqui S, Correas J-M et al. , “Spatiotemporal clutter filtering of ultrafast ultrasound data highly increases doppler and fultrasound sensitivity,” IEEE transactions on medical imaging, vol. 34, no. 11, pp. 2271–2285, 2015. [DOI] [PubMed] [Google Scholar]
- [10].Bjaerum S, Torp H, and Kristoffersen K, “Clutter filters adapted to tissue motion in ultrasound color flow imaging,” IEEE transactions on ultrasonics, ferroelectrics, and frequency control, vol. 49, no. 6, pp. 693–704, 2002. [DOI] [PubMed] [Google Scholar]
- [11].Tierney J, Coolbaugh C, Towse T, and Byram B, “Adaptive clutter demodulation for non-contrast ultrasound perfusion imaging,” IEEE transactions on medical imaging, vol. 36, no. 9, pp. 1979–1991, 2017. [DOI] [PMC free article] [PubMed] [Google Scholar]
- [12].Lediju MA, Trahey GE, Byram BC, and Dahl JJ, “Short-lag spatial coherence of backscattered echoes: Imaging characteristics,” IEEE transactions on ultrasonics, ferroelectrics, and frequency control, vol. 58, no. 7, pp. 1377–1388, 2011. [DOI] [PMC free article] [PubMed] [Google Scholar]
- [13].Camacho J, Parrilla M, and Fritsch C, “Phase coherence imaging,” IEEE transactions on ultrasonics, ferroelectrics, and frequency control, vol. 56, no. 5, pp. 958–974, 2009. [DOI] [PubMed] [Google Scholar]
- [14].Li YL and Dahl JJ, “Coherent flow power doppler (cfpd): flow detection using spatial coherence beamforming,” IEEE transactions on ultrasonics, ferroelectrics, and frequency control, vol. 62, no. 6, pp. 1022–1035, 2015. [DOI] [PMC free article] [PubMed] [Google Scholar]
- [15].Goodman JW, Statistical optics. John Wiley & Sons, 2015. [Google Scholar]
- [16].Mallart R and Fink M, “The van cittert-zernike theorem in pulse echo measurements,” The Journal of the Acoustical Society of America, vol. 90, no. 5, pp. 2718–2727, 1991. [Google Scholar]
- [17].Fink M, Mallart R, and Cancre F, “The random phase transducer: A new technique for incoherent processing-basic principles and theory,” IEEE transactions on ultrasonics, ferroelectrics, and frequency control, vol. 37, no. 2, pp. 54–69, 1990. [DOI] [PubMed] [Google Scholar]
- [18].Pinton G, Trahey G, and Dahl J, “Characteristics of the spatial coherence function from backscattered ultrasound with phase aberration and reverberation clutter,” in Ultrasonics Symposium (IUS), 2011 IEEE International. IEEE, 2011, pp. 684–687. [Google Scholar]
- [19].Bottenus NB and Trahey GE, “Equivalence of time and aperture domain additive noise in ultrasound coherence,” The Journal of the Acoustical Society of America, vol. 137, no. 1, pp. 132–138, 2015. [DOI] [PMC free article] [PubMed] [Google Scholar]
- [20].Li YL, Hyun D, Abou-Elkacem L, Willmann JK, and Dahl JJ, “Visualization of small-diameter vessels by reduction of incoherent reverberation with coherent flow power doppler,” IEEE transactions on ultrasonics, ferroelectrics, and frequency control, vol. 63, no. 11, pp. 1878–1889, 2016. [DOI] [PMC free article] [PubMed] [Google Scholar]
- [21].Li YL, Hyun D, Durot I, Willmann JK, and Dahl JJ, “High sensitivity liver vasculature visualization using a real-time coherent flow power doppler (cfpd) imaging system: A pilot clinical study,” in 2018 IEEE International Ultrasonics Symposium (IUS) IEEE, 2018, pp. 1–9. [Google Scholar]
- [22].Dahl JJ, Hyun D, Li Y, Jakovljevic M, Bell MA, Long WJ, Bottenus N, Kakkad V, and Trahey GE, “Coherence beamforming and its applications to the difficult-to-image patient,” in Ultrasonics Symposium (IUS), 2017 IEEE International IEEE, 2017, pp. 1–10. [Google Scholar]
- [23].Dymling SO, Persson HW, and Hertz CH, “Measurement of blood perfusion in tissue using doppler ultrasound,” Ultrasound in Medicine and Biology, vol. 17, no. 5, pp. 433–444, 1991. [DOI] [PubMed] [Google Scholar]
- [24].Rubin JM, Adler RS, Fowlkes JB, Spratt S, Pallister JE, Chen J-F, and Carson PL, “Fractional moving blood volume: estimation with power doppler us.” Radiology, vol. 197, no. 1, pp. 183–190, 1995. [DOI] [PubMed] [Google Scholar]
- [25].Rubin JM, Bude RO, Carson PL, Bree RL, and Adler RS, “Power doppler us: a potentially useful alternative to mean frequency-based color doppler us.” Radiology, vol. 190, no. 3, pp. 853–856, 1994. [DOI] [PubMed] [Google Scholar]
- [26].Gillies RJ, Schomack PA, Secomb TW, and Raghunand N, “Causes and effects of heterogeneous perfusion in tumors,” Neoplasia, vol. 1, no. 3, pp. 197–207, 1999. [DOI] [PMC free article] [PubMed] [Google Scholar]
- [27].Sahani DV, Holalkere N-S, Mueller PR, and Zhu AX, “Advanced hepatocellular carcinoma: Ct perfusion of liver and tumor tissueinitial experience,” Radiology, vol. 243, no. 3, pp. 736–743, 2007. [DOI] [PubMed] [Google Scholar]
- [28].Tierney J, Baker J, Borgmann A, Brown D, and Byram B, “non-contrast power doppler ultrasound imaging for early assessment of transarterial chemoembolization of liver tumors,” Scientific reports, vol. 9, no. 1, pp. 1–12, 2019. [DOI] [PMC free article] [PubMed] [Google Scholar]
- [29].Loupas T, Peterson R, and Gill RW, “Experimental evaluation of velocity and power estimation for ultrasound blood flow imaging, by means of a two-dimensional autocorrelation approach,” IEEE transactions on ultrasonics, ferroelectrics, and frequency control, vol. 42, no. 4, pp. 689–699, 1995. [Google Scholar]
- [30].Ozgun K, Tierney J, and Byram B, “An adapted coherent flow power doppler beamforming scheme for improved sensitivity towards blood signal energy,” in 2018 IEEE International Ultrasonics Symposium (IUS) IEEE, 2018, pp. 1–4. [Google Scholar]
- [31].Bottenus N, Byram BC, Dahl JJ, and Trahey GE, “Synthetic aperture focusing for short-lag spatial coherence imaging,” IEEE transactions on ultrasonics, ferroelectrics, and frequency control, vol. 60, no. 9, pp. 1816–1826, 2013. [DOI] [PMC free article] [PubMed] [Google Scholar]
- [32].Stanziola A, Leow CH, Bazigou E, Weinberg PD, and Tang M-X, “Asap: Super-contrast vasculature imaging using coherence analysis and high frame-rate contrast enhanced ultrasound,” IEEE transactions on medical imaging, vol. 37, no. 8, pp. 1847–1856, 2018. [DOI] [PubMed] [Google Scholar]
- [33].Nair AA, Tran TD, and Bell MAL, “Robust short-lag spatial coherence imaging,” IEEE transactions on ultrasonics, ferroelectrics, and frequency control, vol. 65, no. 3, pp. 366–377, 2018. [DOI] [PMC free article] [PubMed] [Google Scholar]
- [34].Kenney JF and Keeping E, Mathematics of statistics. Pt. II, 2nd ed. D. Van Nostrand Co., Inc, 1951, pp. 215–225. [Google Scholar]
- [35].Friemel BH, Bohs LN, Nightingale KR, and Trahey GE, “Speckle decorrelation due to two-dimensional flow gradients,” IEEE transactions on ultrasonics, ferroelectrics, and frequency control, vol. 45, no. 2, pp. 317–327, 1998. [DOI] [PubMed] [Google Scholar]
- [36].Long W, Bottenus N, and Trahey GE, “Lag-one coherence as a metric for ultrasonic image quality,” IEEE transactions on ultrasonics, ferroelectrics, and frequency control, vol. 65, no. 10, pp. 1768–1780, 2018. [DOI] [PMC free article] [PubMed] [Google Scholar]
- [37].Huang C, Song P, Gong P, Trzasko JD, Manduca A, and Chen S, “Debiasing-based noise suppression for ultrafast ultrasound microvessel imaging,” IEEE transactions on ultrasonics, ferroelectrics, and frequency control, 2019. [DOI] [PMC free article] [PubMed] [Google Scholar]
- [38].Jensen JA, “Field: A program for simulating ultrasound systems,” in 10th Nordicbalti Conference on Biomedical Imaging, vol. 4 Citeseer, 1996, pp. 351–353. [Google Scholar]
- [39].Jensen JA and Svendsen NB, “Calculation of pressure fields from arbitrarily shaped, apodized, and excited ultrasound transducers,” IEEE transactions on ultrasonics, ferroelectrics, and frequency control, vol. 39, no. 2, pp. 262–267, 1992. [DOI] [PubMed] [Google Scholar]
- [40].Jensen JA, Estimation of blood velocities using ultrasound: a signal processing approach. Cambridge University Press, 1996. [Google Scholar]
- [41].Montaldo G, Tanter M, Bercoff J, Benech N, and Fink M, “Coherent plane-wave compounding for very high frame rate ultrasonography and transient elastography,” IEEE transactions on ultrasonics, ferroelectrics, and frequency control, vol. 56, no. 3, pp. 489–506, 2009. [DOI] [PubMed] [Google Scholar]
- [42].Pinton GF, Dahl JJ, and Trahey GE, “Rapid tracking of small displacements with ultrasound,” IEEE transactions on ultrasonics, ferroelectrics, and frequency control, vol. 53, no. 6, pp. 1103–1117, 2006. [DOI] [PubMed] [Google Scholar]
- [43].Rodriguez-Molares A, Rindal OMH, D’hooge J, Måsøy S-E, Austeng A, and Torp H, “The generalized contrast-to-noise ratio,” in 2018 IEEE International Ultrasonics Symposium (IUS) IEEE, 2018, pp. 1–4. [DOI] [PMC free article] [PubMed] [Google Scholar]
- [44].Dumont D, Dahl J, Miller E, Allen J, Fahey B, and Trahey G, “Lower-limb vascular imaging with acoustic radiation force elastography: demonstration of in vivo feasibility,” IEEE transactions on ultrasonics, ferroelectrics, and frequency control, vol. 56, no. 5, pp. 931–944, 2009. [DOI] [PMC free article] [PubMed] [Google Scholar]
- [45].Dahl JJ, Hyun D, Lediju M, and Trahey GE, “Lesion detectability in diagnostic ultrasound with short-lag spatial coherence imaging,” Ultrasonic imaging, vol. 33, no. 2, pp. 119–133, 2011. [DOI] [PMC free article] [PubMed] [Google Scholar]
- [46].Rindal OMH, Rodriguez-Molares A, and Austeng A, “The dark region artifact in adaptive ultrasound beamforming,” in 2017 IEEE International Ultrasonics Symposium (IUS) IEEE, 2017, pp. 1–4. [Google Scholar]
- [47].Morgan MR, Trahey GE, and Walker WF, “Multi-covariate imaging of sub-resolution targets (mist),” IEEE transactions on medical imaging, 2019. [DOI] [PMC free article] [PubMed] [Google Scholar]


