

Abstract
Background:
Huntington’s disease (HD) is a genetic disorder known for affecting motor control. Despite evidence for the impact of HD on visual cortico-striatal loops, evidence for impaired visual perception in early symptomatic HD patients is limited; much less is known about what happens during the HD prodrome.
Objective:
The goals of this study were to evaluate perceptual processing in motor pre-manifest HD gene-carriers (Pre-HDs) during a visual mental rotation task.
Methods:
To achieve this goal, 79 participants including 24 Pre-HD participants and 55 healthy matched controls were scanned using functional MRI as they performed a mental rotation task. Another group of 36 subjects including 15 Pre-HDs and 21 healthy age/gender matched controls participated in a control behavioral test of judgment of line orientation outside the scanner.
Results:
We found that, although Pre-HDs (in this stage of disease) did not demonstrate slower response times, their response accuracy was lower than controls. On the fMRI task, controls showed a significant decrease in activity in the occipito-temporal (OT) visual network and increase in activity in the caudo-fronto-parietal (CFP) network with mental rotation load. Interestingly, the amount of mental rotation-related activity decrease in the OT network was reduced in Pre-HDs compared to controls while, the level of CFP response remained unchanged between the two groups. Comparing the link between the evoked BOLD activity within these networks and response accuracy (i.e., behavior), we found that the models fit to data from controls were less accurate in predicting response accuracy of Pre-HDs.
Conclusion:
These findings provide some of the earliest functional evidence of impaired visual processing and altered neural processing underlying visual perceptual decision making during the HD prodrome.
Keywords: Mental rotation, Pre-HD, visual system, functional MRI
INTRODUCTION
Huntington’s disease (HD) is a neurodegenerative disorder caused by the abnormal expansion of a CAG segment of DNA on chromosome 4 [1–3]. Although classically defined as a movement and motor control disorder [4], accumulating behavioral data suggest that the impact of the genetic expansion is not limited to motor impairments, but also involves visual perception and perceptual decision making [5–8], likely through the degeneration of (visual) cortico-striatal loops [9–12].
Using functional MRI, evidence of altered visual cortical processing in early symptomatic HD patients was reported recently [9]. Specifically it was shown that, compared to healthy matched controls, early symptomatic HD patients showed decreased response selectivity in temporal visual areas, mostly within the posterior portion of the Parahippocampal Place Area (PPA), an area that contributes to scene perception [13, 14] and shape processing [15–20]. This decrease in response selectivity was accompanied by reduced shape and scene discrimination accuracy. Together with other studies, which have also demonstrated decreased fMRI activity within temporal visual areas [5] or thinning of occipital and occipito-parietal visual cortex early in the disease [21–24], these data suggest that there are likely clinically relevant changes in the visual system in HD. Much less is known about how early visual perceptual changes might be present, including during the HD prodrome, and whether these HD-related changes are confined to relatively higher level visual areas (e.g., PPA [5, 9]) or if they could also be detected in earlier visual areas.
To evaluate early visual impairments in HD, we studied a group of motor pre-symptomatic HD gene carriers (Pre-HDs). We used a 2D mental rotation visual task [25, 26] during which Pre-HD subjects and healthy matched controls were asked to determine whether visually presented objects were rotated in a picture plane relative to each other or not (Fig. 1A, B). Previous functional imaging studies have shown that, in healthy individuals, this task evokes robust activation within occipito-temporal (visual) and fronto-parietal (association) cortical areas [27–29]. We also used a modeling approach to test whether there were any changes in the association between neural and behavioral responses in Pre-HDs compared to controls as supportive evidence for compensatory functional changes.
Fig. 1.
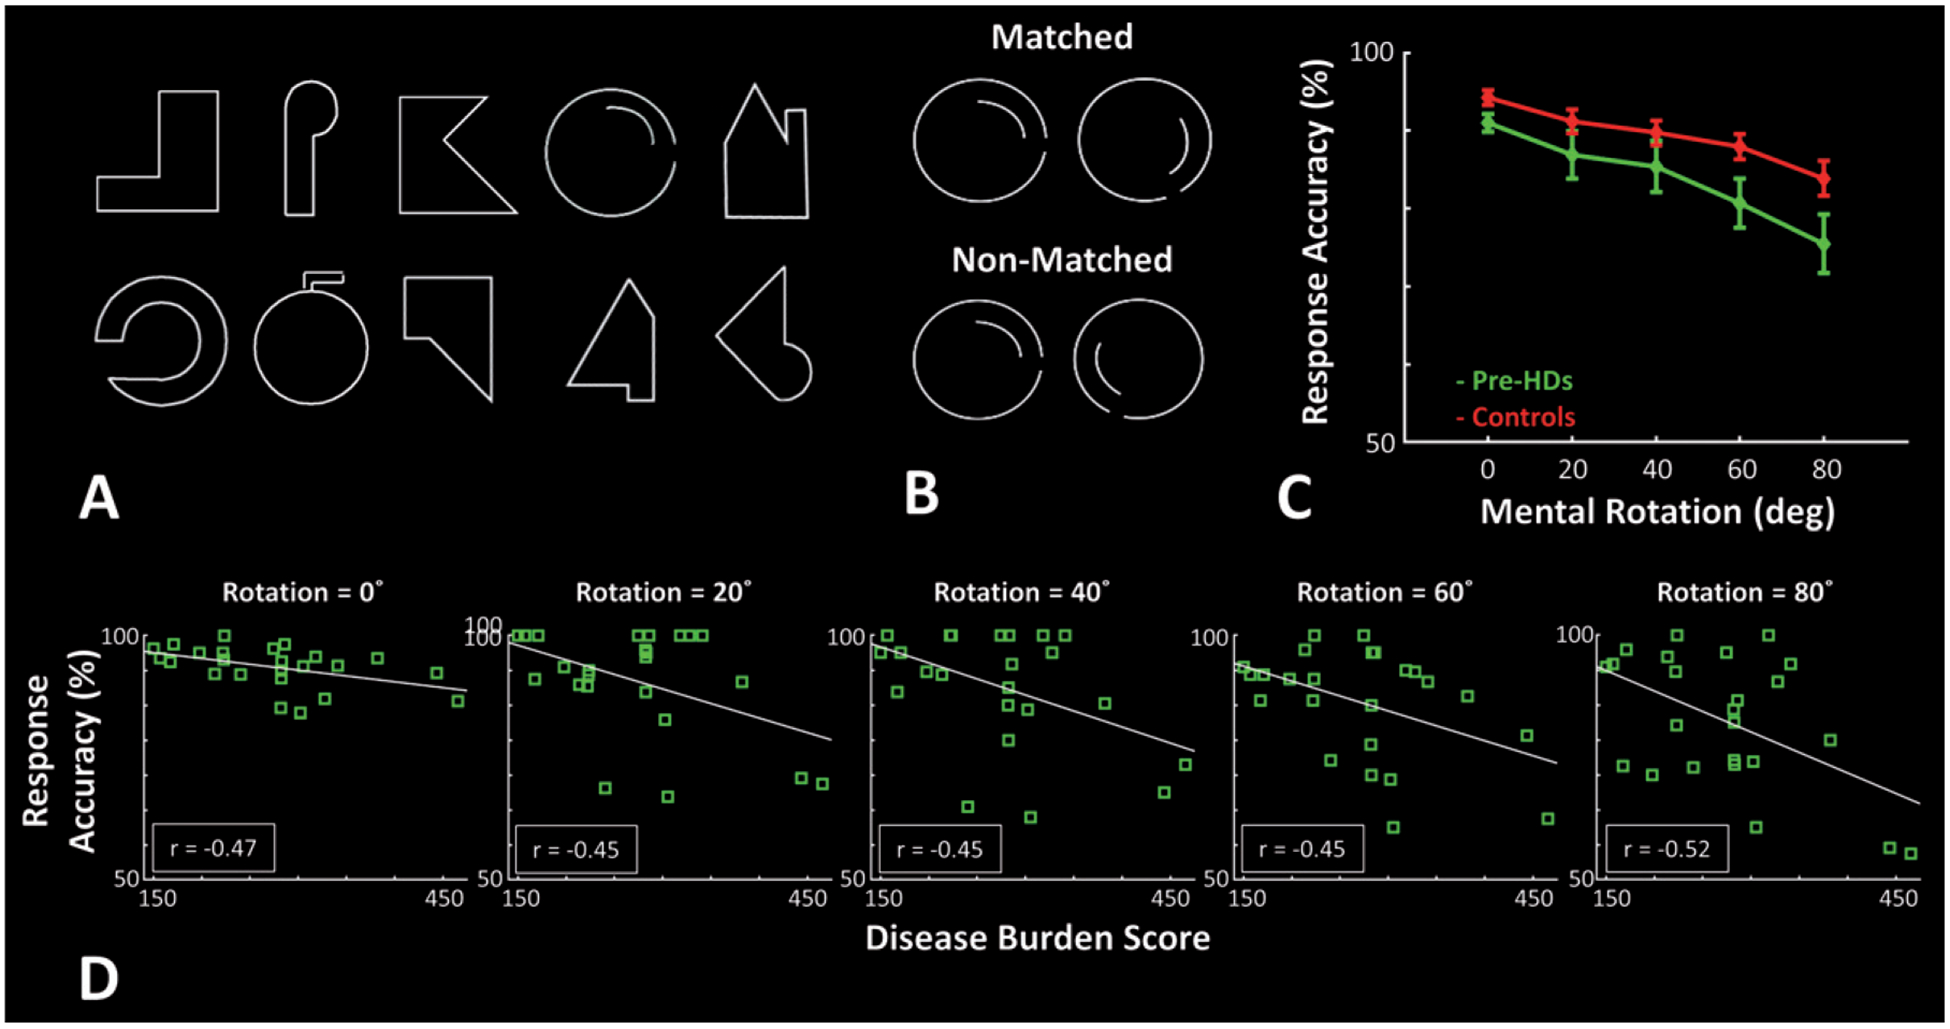
Experimental procedure and participants’ response accuracy during the mental rotation task. A) Stimuli were 10 different line drawing shapes subtended 4° × 4° on the screen. B) In each trial, two stimuli were presented side-by-side with 4° center-to-center distance. In 50% of trials they were matched, and in the rest of trials they were non-matched. C) Response accuracy of Pre-HDs (green) and healthy matched controls (red) decreased with increase in the mental rotation degree, and Pre-HD showed a lower response accuracy relative to healthy matched controls. D) In all mental rotation conditions, response accuracy of Pre-HD individuals decreased with increase in disease burden score [34]. Error bars show one standard error of mean.
Our findings demonstrate that HD-related neural and behavioral impairments are detectable during the HD prodrome in early visual areas. They also demonstrate that models which link neural and behavioral responses developed from healthy matched participants were less accurate in predicting the Pre-HD’s behavior compared to other controls (validation group). Together, these results suggest that HD reflects a ‘global’ cortico-striatal dysfunction that encompasses both sensory (visual) and association cortical regions early in the course of the disease.
MATERIALS AND METHODS
Participants
Twenty-four Pre-HDs (14 female) aged 43.72 ± 11.62 (mean ± S.D.) years old along with 55 healthy matched controls (31 female) aged 39.38 ± 11.44 years old were recruited for the imaging portion of this study (Table 1). Here we used the term ‘presymptomatic’ (Pre-HD) to imply that formal clinical criteria (the UHDRS diagnostic confidence score) have not been met and all Pre-HD subjects had a clinical confidence score of less than three, as assessed by a specialist in Huntington’s disease. However, subtle motor signs have been shown previously to be present in as many as 77% of pre-symptomatic gene-expanded individuals and interestingly in as many as 33% of non-gene expanded individuals in the Predict HD study [30], suggesting that motor assessments are neither sensitive nor specific during the HD prodrome.
Table 1.
Participants demography
| Mental Rotation Task (Performed Inside the Scanner) | ||||||||
|---|---|---|---|---|---|---|---|---|
| Controls | Pre-HDs | |||||||
| N | Age Range | Mean | S.D. | N | Age Range | Mean | S.D. | |
| Female | 31 | 22–59 | 41.50 | 12.1 | 14 | 27–60 | 42.56 | 10.64 |
| Male | 24 | 23–54 | 36.64 | 9.93 | 10 | 25–62 | 43.70 | 11.37 |
| Judgment of Line Orientation (Performed Outside the Scanner) | ||||||||
| Controls | Pre-HDs | |||||||
| N | Age Range | Mean | S.D. | N | Age Range | Mean | S.D. | |
| Female | 10 | 32–69 | 53.33 | 13.26 | 5 | 28–65 | 45.31 | 15.09 |
| Male | 11 | 23–71 | 51.72 | 14.76 | 10 | 30–68 | 50.67 | 11.41 |
A two-way application ANOVA (Gender (Male vs. Female) and Group (Controls vs. Pre-HDs)) to subject’s age did not yield any significant difference between participants age based on their Gender (F(1, 78) = 0.45, p = 0.50), Group (F(1, 78) = 2.17, p = 0.15) and/or Gender × Group interaction (F(1, 78) = 1.18, p = 0.28).
In addition, fifteen Pre-HDs (5 female) aged 48.89 ± 12.47 years old along with 21 healthy matched controls (10 female) aged 52.49 ± 13.73 years old were recruited for the control behavioral test (Table 1). The application of a two-way ANOVA to the participants age did not yield any significant effect of Gender (F(1, 32) = 0.16, p = 0.69), Group (F(1, 32) = 0.54, p = 0.47) and/or Gender × Group interaction (F(1, 32) = 0.92, p = 0.34). This lack of significant Gender and/or Gender × Group interaction effects argue against the possibility that our findings were mainly due to the gender bias in mental rotation or judgment of line orientation, as has been suggested by previous studies in healthy individuals [31–33].
In the two Pre-HD groups, CAG repeat expansion ranged between 40–46 repetitions. The Disease Burden Score (DBS), an indicator of extent of exposure to the effects of CAG repeat expansion in gene-expanded carriers (DBS = (CAG repetition number −35.5) × Age)) [34], varied between 150.15 to 465.36 (273 ± 83.06). Separate applications of t-tests did not show any significant difference between age (t = 0.65, p = 0.52), CAG repeat expansion (t = 0.26, p = 0.79) and/or DBS (t = 1.27, p = 0.21) between the two Pre-HD groups.
Participants had no history of neurological, psychiatric, or serious medical illness. All procedures were performed in compliance with the relevant laws and institutional guidelines of the Internal Review Board of the Massachusetts General Hospital and with the Declaration of Helsinki. Procedures were fully explained to all subjects, and informed written consent was obtained before any study procedures were conducted.
Experimental design
Mental rotation
During fMRI scanning, stimuli consisted of ten different white 2D line drawing geometrical shapes, subtended 4° × 4° on-screen, presented against a black background (Fig. 1A) using E-Prime software (Psychology Software Tools, Pittsburg, PA; RRID:SCR 009567). Stimuli were back projected (Sharp XG-NV6X LCD Projector) onto a translucent screen visible from within the magnet bore through a mirror mounted on the head coil.
The experiment was an event-related design. In each trial, two images were presented simultaneously, one on the left and one on the right side of a centrally presented fixation spot (4° center-to-center distance). Across trials, these two images were rotated either 0°, 20°, 40°, 60° or 80° relative to each other. In 50% of trials, they were matched and in the other 50% of trials, they were flipped (i.e., non-match) relative to each other (Fig. 1B). Subjects were instructed to respond whether the two images on-screen were matched or not, irrespective of their rotation relative to each other. They reported their response by pressing two keys on a keypad using their dominant hand without receiving any feedback about the accuracy of their response. To avoid eye movement during the trials, the fixation spot remained presented during the entire experiment and subjects were instructed not to move their eyes.
The task was self-paced. Each image was displayed for a maximum of 4000 ms and removed from the screen if the subject responded early. This maximum presentation time was much longer than the response time of controls (1.86 ± 0.41 s (mean ± S.D.)) or Pre-HDs (1.90 ± 0.35 s) during the most challenging experimental trials (i.e., mental rotation load = 80°). Thus, in almost all trials, the decision was made while stimuli were still on screen and therefore working memory load remained small. The sequence of trials and the amount of time between trials was jittered and optimized using ‘optseq2’ command in Freesurfer (version 5.3; http://surfer.nmr.mgh.harvard.edu/) (RRID:SCR_001847) to increase subject attentiveness and to reduce the overlap from the estimate of the hemodynamic response and effects of habituation and expectation [35].
During the scans, subjects completed 480 trials through 6 runs (i.e., 80 trials per run). Response accuracy and speed were both stressed and recorded. Reaction times less than 200 ms (from the stimulus onset) were considered anticipatory and were disregarded. Before the scans, subjects practiced with the task long enough to feel confident about their performance and fixation stability. During these practice trials (but not during the main trials) participants received feedback about those response accuracy. Their performance during those trials was not included in the results.
Judgement of line orientation
Outside the scanner, a second comparable group of subjects matched for CAG repeat, DBS and age, participated in a standardized test of judgment of line orientation [36]. Briefly, each subject participated in 30 trials. In each trial, two set of lines were presented concurrently on screen. One set (target set) consisted of two lines whose orientations varied across trials. The other set (test set) consisted of 11 lines whose orientations varied between 0° to 180° (18° steps).
Subjects were asked to choose lines from the test set with the same spatial orientation as within the target set. Subjects scored 1 point for each correct choice (i.e., maximum possible score was 30). During the experiment, subjects did not receive any feedback about their response accuracy and accuracy was stressed more than speed. Before the experiment, subjects completed five practice trials during which they were received feedback about their response accuracy.
Imaging
Functional and high resolution structural imaging scans were conducted using a 1.5 T Siemens scanner (Avanto), using the vendor-supplied 12 channel receive coil array. Functional data were collected using a single-shot gradient-echo EPI sequence with voxels of nominally 3.125 × 3.125 × 5 mm resolution, using the following protocol parameters: TR = 2000 ms, TE = 40 ms, flip angle = 90°, matrix = 64 × 64, FOV = 200 × 200 mm, 26 axial slices covering the entire brain. In the same scan session, structural (anatomical) data were also acquired using a high-resolution 3D T1-weighted MPRAGE sequence with voxel size = 1.0 × 1.0 × 1.33 mm, using the following protocol parameter values: TR = 2730 ms, TE = 3.31 ms, TI = 1000 ms, flip angle = 7°, FOV = 256 × 256 × 170 mm.
Data analysis
Anatomical and functional data were processed using FreeSurfer and FS-FAST (version 5.3; http://surfer.nmr.mgh.harvard.edu/)(RRID:SCR_001847) [37].
Anatomical data
For each subject, the inflated and flattened cortical surfaces were reconstructed [38–40] and followed by cortical and subcortical segmentations [40–42] based on their own high-resolution anatomical data; these segmentations identified the regions of interest used for the functional analyses (see below). Cortical thickness for each individual subject was also measured by defining the gray-white matter interface, and the surface of the gray matter, based on the high-resolution structural scans [38–40].
Functional data
All functional images were corrected for motion artifacts. All runs during which subjects moved more than 3 mm were excluded from analysis. Notably, we did not find any meaningful difference between the amount of head motion between the two groups. For each subject, functional data from each run were rigidly aligned (6 DOF) relative to their own structural data. All functional data were then spatially smoothed using a 3D Gaussian kernel (3 mm HWHM), and normalized across scans. To estimate the amplitude of the BOLD response, a standard hemodynamic model based on a gamma function was fit to the fMRI signal, then the average BOLD response maps were calculated for each condition. Voxel-wise statistical tests were conducted by computing contrasts based on a univariate general linear model. All maps were corrected for multiple comparisons within each space (left and right cortical surfaces and the subcortical space) using a Monte Carlo simulation with 10,000 iterations and Bonferroni correction across the three spaces. The voxel- and cluster-wise correction threshold was set at p < 10−3.
To generate group-averaged maps for human subjects, functional data were further aligned relative to an independently generated averaged brain template (fsaverage - Freesurfer) using a Boundary-Based Registration method [43]. Functional maps were then spatially normalized across subjects and then averaged using random effects models [44]. Between-groups differential activity maps were also calculated and presented after correction for multiple comparison (see above). Here, voxel- and cluster-wise analysis was performed at p < 0.05 threshold.
Regions of interest (ROIs)
All findings based on activity maps were further reconfirmed based on more sensitive ROI-based analysis.
Cortical ROIs
For each participant, cortical ROIs were defined bilaterally based on each subject’s brain structure, using their own high-resolution structural scan (see above), and independent from the functional results. Specifically, as a part of Freesurfer [37] brain reconstruction pipeline and according to Destrieux atlas [45], each participant’s cortex was divided into multiple regions. Here, we only reported those regions: 1) in which HD-related impairments were expected based on our prior knowledge (e.g., [22]) and/or 2) which demonstrated a significant mental rotation related response (contrasting the evoked response during maximum vs. no mental rotation trials (i.e., 80° vs. 0°) (Fig. 3)) plus a between-groups difference in mental rotation related response (Fig. 4A).
Fig. 3.
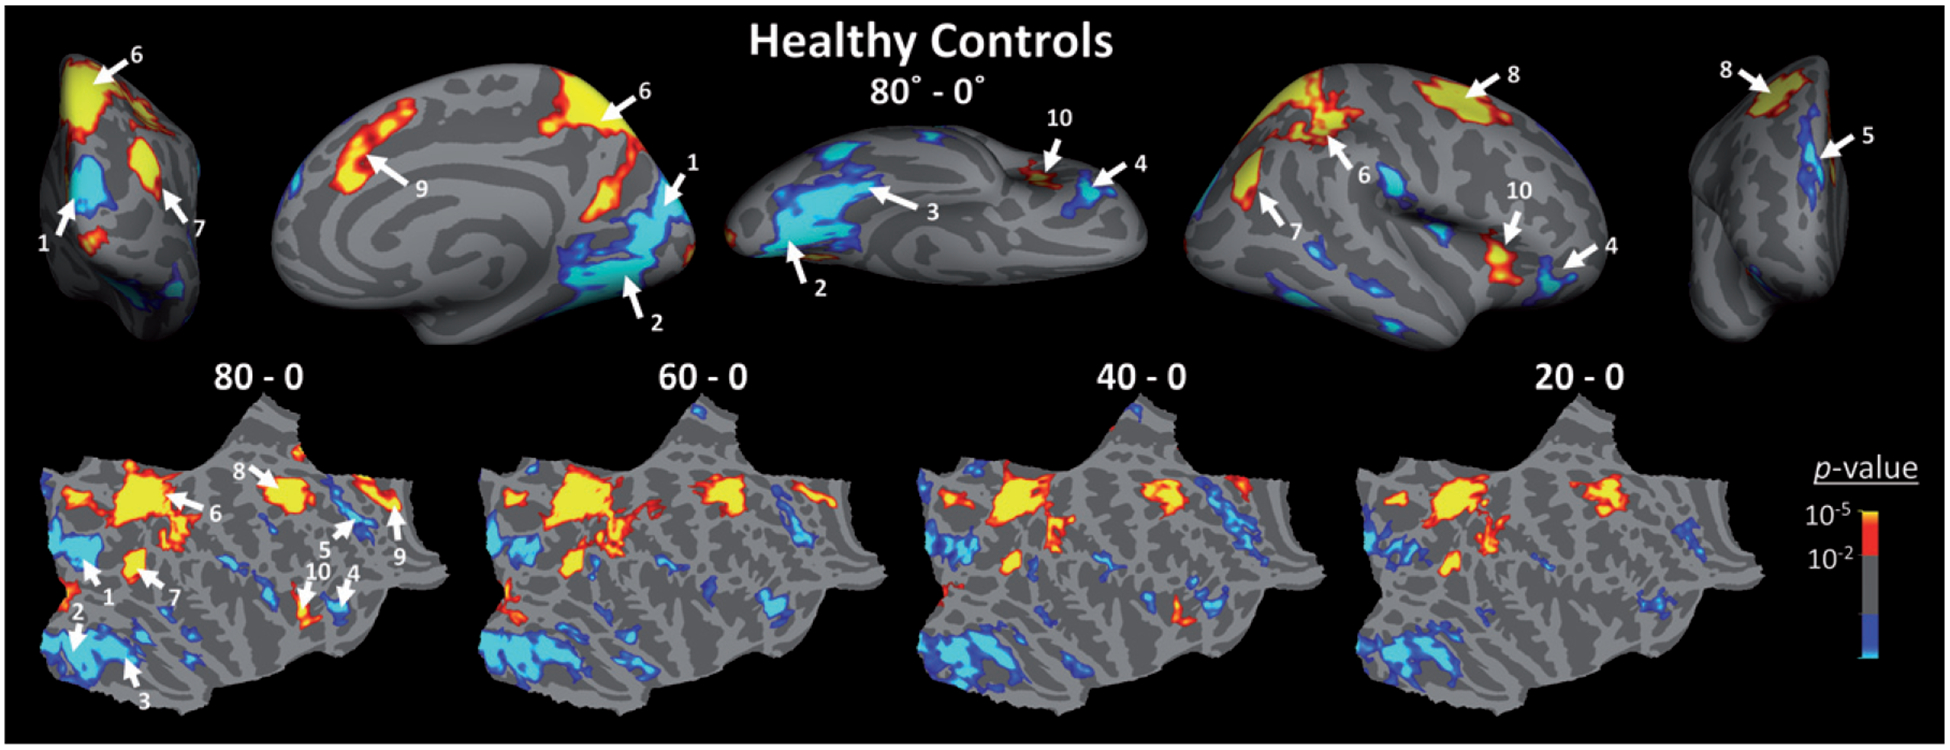
Brain areas that showed a significant response to mental rotation in healthy matched controls. Top) Activity map (p-values) evoked by contrasting the evoked response during trials in which stimuli were rotated 80° relative to each other, compared to trials in which stimuli were presented from the same angle (i.e., 0° mental rotation). Blue-to-cyan and red-to-yellow colors indicate those regions that show respectively an increase and a decrease in their level of FMRI activity during mental rotation relative no rotation trials. Activity map is overlaid on the inflated right hemisphere of the average brain (see Methods). Similar activity map was also evoked within the left hemisphere (not shown here). Bottom) Mental rotation related activity maps generated by contrasting the activity evoked during 80°, 60°, 40° and 20° mental rotation trials relative to activity evoked during 0° mental rotation trials in controls, overlaid on flattened cortex (right hemisphere). All maps are corrected for multiple comparisons. 1: cuneus and superior occipital gyri, 2: lingual gyrus and posterior transverse collateral sulcus, 3: fusiform gyrus, 4: orbitofrontal cortex, 5: superior frontal cortex, 6: superior parietal cortex, 7: inferior parietal cortex, 8: fronto-central cortex, 9: mid-anterior cingulate cortex, 10: anterior insular cortex.
Fig. 4.

Between-groups (Pre-HDs - Controls) comparison of activity evoked by mental rotation. A) Mental rotation (80° – 0°) evoked a larger (more negative) response in healthy controls relative to Pre-HD individuals within early visual areas, centered anteriorly relative to borders of the primary visual area (V1; [50]). The activity map (p-values) is corrected for multiple comparison. B) Border of regions of interest, defined based on subjects’ own high-resolution structural scans (i.e., defined independently from the functional responses), overlaid on an average inflated brain. Red and cyan outlines indicate ROIs that showed a higher and lower activity during mental rotation compared to not rotated trials, respectively. C) BOLD activity measured within cortical regions-of-interest (ROIs) of Pre-HDs (green) and healthy matched controls (red) across different mental rotation conditions relative to 0° trials. Consistent with the activity maps, impaired mental rotation related activity was found within early visual areas. However, this sensitive test also showed impaired activity within superior frontal cortex and orbitofrontal cortex of Pre-HDs relative to controls (Table 2). Error bars show one standard error of mean.
These ROIs included 1) early visual areas (including cuneus, lingual, superior occipital gyri), 2) fusiform gyrus (higher level visual area), 3) superior frontal, 4) orbitofrontal, 5) superior parietal (including precuneus and superior parietal gyri), 6) inferior parietal, 7) fronto-central (including superior precentral and superior frontal sulci), 8) anterior insular and 9) mid-anterior cingulate (Fig. 4B). While an exploratory analysis included the other cortical parcellations, including the posterior insular cortex, occipital pole and the anterior portion of the medial temporal sulcus, we did not find any additional HD-related impairment in regions other than those reported in the Results section and these were therefore not included in our results.
Subcortical ROIs
We also assessed the activity within the caudate, the main striatal nucleus affected by HD [46–49] and other basal ganglia nuclei including putamen, pallidum and nucleus accumbens. The size of the amygdala, hippocampus and thalamus were also measured to evaluate whether or not there was any a priori evidence of atrophy in Pre-HDs, which might contribute to findings. Here again, these subcortical brain regions were defined according to individual high-resolution anatomical scan and by using the Freesurfer segmentation pipeline. This automatic subcortical segmentation is based on the existence of probabilistic information on the location of structures as described previously elsewhere [37, 40]. Validity of this technique has been shown in several studies as providing accurate segmentations in the setting of neurodegenerative diseases, even in their early stages [9, 40].
Statistical analysis
Statistical tests were done using repeated measures ANOVA with a group factor (Pre-HDs vs. controls). Results of this analysis were corrected for violation of sphericity assumption (Mauchly test) using the Greenhouse-Geisser method. In few cases, we also used a 2-tailed t-test. In all cases, p < 0.05 was considered significant. All statistical analyses were conducted using MATLAB 2017a statistics and machine learning toolbox (MathWorks, Inc., Natick, Massachusetts, United States) (RRID:SCR_001622).
Modeling
We used a linear regression model to predict the subject’s response accuracy across different mental rotation loads based on their own evoked BOLD responses using the ‘stepwiselm’ command in MATLAB 2018a statistics and machine learning toolbox. This model used the first order BOLD signal values and interactions among them measured within our main ROIs (i.e., early visual areas, orbitofrontal, superior frontal, inferior parietal, superior parietal, fronto-central, mid-anterior cingulate and anterior insular cortical areas and caudate nucleus (see above)). The model was trained, using a ‘forward’ selection, based on data from 40 randomly selected healthy controls (out of 55) and was evaluated by using the other controls and 15 randomly selected Pre-HD individuals (out of 24). This procedure was repeated for 1000 times and each time the least mean square error of prediction was measured separately for the two evaluation groups. The significance of the linear regression models was tested with the F-statistic against the constant model (i.e., null hypothesis) to assure us that the model reached statistical significance (p < 0.05).
RESULTS
Behavior
Figure 1C shows the participant’s response accuracy measured during trials with different degrees of mental rotation (0° vs. 20° vs. 40° vs. 60° vs. 80°). In all participants, response accuracy decreased with an increase in the degree of mental rotation. However, compared to healthy matched controls, Pre-HD subjects were generally less accurate. An application of one-way repeated measure ANOVA (Rotation (0° vs. 20° vs. 40° vs. 60° vs. 80°)) with a Group factor (Pre-HDs vs. Controls) to a participant’s measured response accuracy showed a significant effect of Rotation (F(4, 308) = 22.95, p < 10−12) and a significant effect of Group (F(1, 77) = 4.31, p = 0.04) but no significant Group × Rotation interaction (F(4, 308) = 1.17, p = 0.28). Importantly, reaction times of the Pre-HDs were comparable to healthy controls, further supporting that they were indeed pre-manifest; application of the same analysis to participant’s reaction time showed a significant effect of Rotation (F(4, 308) = 145.19, p < 10−52), but not a significant effect of Group (F(1, 77) = 1.59, p = 0.21) and/or Group × Rotation interaction (F(4, 308) = 1.62, p = 0.18).
We also tested whether there was a correlation between the response accuracy of Pre-HDs and DBS (an index of disease progress with age [34]). Separate applications of the Pearson test of correlation to response accuracy with different degrees of mental rotation showed significant inverse correlations (r < –0.44, p < 0.03; not corrected for multiple comparisons (see below)), suggesting that response accuracy of Pre-HDs decreased as DBS increased (Fig. 1D). In contrast, the level of correlation between response accuracy and subject’s age was not significant across all mental rotation levels (r > –0.40, p > 0.05).
It also appeared that the relationship between DBS and Pre-HD’s response accuracy varied with the mental rotation load (i.e., a moderator effect); in higher mental rotation loads, Pre-HDs with higher DBS showed lower response accuracy (Fig. 1D). To test the significance of this ‘moderator effect’ on response accuracy, and also to avoid any error due to multiple comparisons, we applied an analysis of linear regression to the measured response accuracy using DBS, mental rotation and DBS × mental rotation as independent parameters. The results of this analysis showed a significant relationship between the response accuracy and DBS (Beta = –0.28, p < 0.01) and also response accuracy and DBS × mental rotation (Beta = –0.38, p < 10−4). Thus, as expected from the nature of this progressive disease, Pre-HDs with a higher DBS showed a more prominent mental rotation impairments compared to those with lower DBS.
As the next step, we further tested if Pre-HD participants might also show an impaired visuospatial attention control. A separate group of Pre-HD and healthy controls, whose age and DBS (for Pre-HDs) matched the subjects imaged (see Methods and Table 1), participated in a standardized test of judgement of line orientation [36]. Despite the high attentional demand, and perceptual similarities between the two tasks (i.e., judgement of line orientation vs. mental rotation), we did not find any significant difference between Pre-HD’s (23.53 ± 7.16) and control’s (25.71 ± 4.05) score in this task (t-test; t(34) = 1.16, p = 0.25). We also did not find any significant correlation between Pre-HDs score and DBS (r = –0.07, p = 0.80). Although this test does not rule out attentional/perceptual deficits in HDs (and Pre-HDs), it highlights the greater sensitivity of the mental rotation as compared to the judgment of line orientation, to HD-related visual perceptual impairments, at least during the HD prodrome.
FMRI activity during mental rotation
First, we checked the visually evoked response during those trials in which mental rotation was not necessary (i.e., Rotation = 0°), measured relative to intervals with the blank presentation. As demonstrated in Fig. 2, our stimuli evoked activity within occipito-temporal, parietal and frontal cortical regions. We did not find any significant difference between the pattern of evoked responses in healthy controls and Pre-HDs; the whole-brain between-groups comparison of the evoked activity maps similarly did not show any significant (p < 0.05) activity difference between the two groups. In subsequent analyses, the activity evoked during this trial condition was used as the baseline.
Fig. 2.

Activity evoked during those trials in which mental rotation was not required (i.e., 0° mental rotation) in healthy controls (left columns) and Pre-HD individuals (right columns). In Red-to-yellow colors represent p < 10−3 to p < 10−6 in controls and p < 0.05 to p < 10−3 in Pre-HDs. This threshold difference is due to the higher number of controls compared to Pre-HDs. Otherwise, in both groups, we found a strong activity within occipital, occipito-temporal, parietal and frontal regions without any statistically significant (p < 0.05) difference between the two groups. Lack of activity within the foveal region (e.g., occipital pole) is due to peripheral stimulus presentation in our paradigm (see Methods). In each column, lateral, medial and flattened cortical views are presented in top, middle and bottom rows, respectively.
Second, we compared the activity evoked during mental rotation trials between Pre-HDs and controls. Figure 3 shows the activity maps evoked in controls across trials with different degrees of mental rotation measured relative to baseline (i.e., Rotation = 0°; see above). In these maps, two groups of brain areas showed distinctive responses during the mental rotation task; in one set of areas, mainly consisting of the occipito-temporal, orbitofrontal and superior frontal areas, BOLD activity decreased during mental rotation compared to 0° trials. These areas were likely sensitive to the level of physical ‘similarity’ between stimuli and therefore their response decreased with increase in mental rotation. In contrast, in the other set, mainly consisting of the superior parietal, inferior parietal, fronto-central, mid-anterior cingulate and anterior insular areas, we found that the BOLD response increased during mentally rotated relative to 0° trials, suggesting a sensitivity to the level of physical ‘difference’ between the two concurrently presented stimuli.
Figure 4A shows the map of the difference in activity evoked in the right hemisphere of Pre-HDs vs. controls during 80° mental rotation trials. In both hemispheres, at this signal to noise ratio (SNR), the difference between the two groups was mainly limited to early visual areas within the OT visual network. Although in some regions the between group difference also extended to the primary visual area (V1) [50], the center of between-groups activity difference appeared more anteriorly, close to the posterior borders of intraparietal and fusiform sulci and likely within V2-V4 visual areas. We also checked the maps in which correction for multiple comparisons was avoided to make sure that no small between-groups activity difference was ignored. In those maps (not shown here), we also found small patches of between-group activity differences within the orbitofrontal and superior frontal areas, but not within fronto-central, inferior/superior parietal, anterior insula and/or mid-anterior cingulate cortex.
We further confirmed our findings using a more sensitive, but spatially restricted, ROI-based analysis (see Methods). For this analysis, in each hemisphere, ROIs were defined independently for each subject based on their brain structure, measured using a high-resolution structural scan (see Methods). This analysis yielded similar results as in the whole-brain between-groups tests. Specifically, in early visual, orbitofrontal and superior frontal areas, 0° trials evoked a stronger response than mentally rotated ones, and this effect was more apparent in healthy controls as compared to Pre-HDs (Fig. 4C). Here, the application of two-factor repeated measures ANOVA (Rotation (0° vs. 20° vs. 40° vs. 60° vs. 80°) and Trial-Type (Match vs. Non-Match)) with a Group factor (Pre-HDs vs. Controls) to the measured BOLD signal within early visual areas showed a significant effect of Rotation (F(4, 308) = 5.47, p < 10−3), a significant effect of Trial-Type (due to a stronger response to matched rather than non-match trials) (F(1, 77) = 23.98, p < 10−5) and more importantly, a significant interaction between the effects of Group × Rotation (F(4, 308) = 2.58, p = 0.04). We also found a significant effect of Rotation (F(4, 308) > 2.68, p ≤ 0.03) and Group × Rotation (F(4,308) > 3.60, p < 0.01) in orbitofrontal and superior frontal areas. However, in contrast to visual areas, orbitofrontal and superior frontal areas did not show any significant effect of Trial-Type (F(1, 77) < 2.79, p > 0.09) (Table 2).
Table 2.
Effect of independent factors on activity measure within ROIs
| Rotation | Trial-Type | Trial-Type × Rotation | Group | Group × Rotation | Group × Trial-Type | Group × Rotation × Trial-Type | |
|---|---|---|---|---|---|---|---|
| Early Visual | F = 5.47 | F = 23.98 | F = 0.07 | F = 1.92 | F = 2.57 | F = 0.03 | F = 1.72 |
| p < 10−3** | p < 10−5** | p = 0.99 | p = 0.17 | p = 0.04* | p = 0.86 | p = 0.15 | |
| Orbitofrontal | F = 3.57 | F = 2.79 | F = 0.28 | F = 0.03 | F = 4.92 | F = 0.46 | F = 0.89 |
| p <0.01** | p = 0.09 | p = 0.88 | p = 0.86 | p<10−3** | p = 0.50 | p = 0.46 | |
| Superior Frontal | F = 2.68 | F = 0.02 | F= 1.41 | F = 0.05 | F = 3.60 | F = 0.21 | F = 1.82 |
| p = 0.03* | p = 0.89 | p = 0.23 | p = 0.82 | p <0.01** | p = 0.65 | p = 0.14 | |
| Superior Parietal | F = 34.51 | F = 7.37 | F = 2.04 | F = 0.01 | F= 1.34 | F= 1.19 | F = 0.71 |
| p <10−21** | p <0.01** | p = 0.09 | p = 0.93 | p = 0.26 | p = 0.28 | p = 0.57 | |
| Inferior Parietal | F = 20.41 | F = 2.27 | F = 6.87 | F = 3.48 | F = 0.72 | F = 1.46 | F = 0.42 |
| p <10−13** | p = 0.14 | p <10−4** | p = 0.06 | p = 0.57 | p = 0.23 | p = 0.76 | |
| Fronto-Central | F = 20.71 | F= 13.69 | F=3.38 | F= 1.17 | F= 1.39 | F = 2.11 | F = 1.02 |
| p <10−13** | p < 10−3** | p = 0.01** | p = 0.28 | p = 0.24 | p = 0.15 | p = 0.39 | |
| Mid-Anterior Cingulate | F = 5.92 | F = 25.27 | F = 1.74 | F = 0.04 | F = 2.13 | F = 0.06 | F = 0.96 |
| p < 10−3** | p < 10−5** | p = 0.15 | p = 0.83 | p = 0.08 | p = 0.81 | p = 0.42 | |
| Anterior Insular | F = 9.14 | F = 23.42 | F=1.11 | F = 0.26 | F = 2.04 | F= 1.41 | F= 1.31 |
| p < 10−6** | p < 10−5** | p = 0.35 | p = 0.61 | p = 0.09 | p = 0.24 | p = 0.27 | |
| Caudate | F = 4.93 | F = 4.43 | F = 0.50 | F = 2.61 | F = 0.69 | F = 0.53 | F = 1.04 |
| p < 10−3** | p = 0.04* | p = 0.72 | p = 0.11 | p = 0.59 | p = 0.47 | p = 0.38 | |
| Fusiform | F = 5.58 | F = 1.75 | F = 8.63 | F = 2.53 | F= 1.21 | F = 0.29 | F = 1.04 |
| p < 10−3** | p = 0.19 | p < 10−5** | p = 0.12 | p = 0.31 | p = 0.59 | p = 0.38 |
p ≤ 0.05;
p ≤ 0.01.
We also tested the impact of gene-positive status on the activity within fusiform gyrus (Fig. 4C), a higher visual area in which previous studies have shown impaired responses in early HD [5, 9]. Consistent with the between-groups activity difference map (Fig. 4A), and despite the overall similarity between the response profile (i.e., BOLD – mental rotation relationship) in this region relative to the early visual areas, we only found a significant effect of Rotation (F(4, 308) = 5.58, p < 10−3), and a significant Trial-Type × Rotation interaction effect (F(4, 308) = 8.63, p < 10−5). In contrast, the effect of Group and its interaction with other factors remained insignificant (F ≤ 2.53, p ≥ 0.12) (Table 2). This response was likely due to the simple shape of our stimuli (Fig. 1A) compared to the more complicated shapes of preferred stimuli of this region (i.e., faces and scenes [13, 14, 51]) (see Discussion). Application of the same tests to other cortical regions did not yield any significant (p < 0.05) effect of HD status on evoked mental rotation related responses (not shown here).
Consistent with the activity maps, mentally rotated (compared to 0°) stimuli evoked a stronger response within superior/inferior parietal, fronto-central, mid-anterior cingulate and anterior insular association areas, and the level of this mental rotation-related response increased with the degree of mental rotation (Fig. 5). Here, application of the same analysis (as mentioned above) yielded a significant effect of Rotation in all of these areas (F(4, 308) ≥ 5.92, p < 10−3) (Table 2). In all of these areas, with the exception of the inferior parietal area, we also found a significant effect of Trial-Type due to a stronger response to non-matched rather than match trials (F(1, 77) ≥ 7.37, p < 0.01). Amongst these areas, we found only: 1) a marginal (insignificant) effect of Group (F(1, 77) = 3.48, p = 0.06) in the inferior parietal cortex due to slightly weaker responses in Pre-HDs compared to controls and 2) a marginal (insignificant) Group × Rotation (F(4, 308) ≤ 2.13, p > 0.08) in mid-anterior cingulate and anterior insular cortex.
Fig. 5.

Mental rotation related activity measured within attention control area (superior and inferior parietal, fronto-central and mid-anterior cingulated cortex) and striatal nuclei (caudate, putamen, pallidum and accumbens) of controls (red) and Pre-HDs (green). Activity is measured during mental rotation trials relative to 0° trials. In this stage of disease, the between-groups difference remained non-significant in all of these brain regions (see also Table 2).
We also measured the level of BOLD response within the major basal ganglia nuclei including caudate, putamen, pallidum and nucleus accumbens (Fig. 5). In the caudate, the level of BOLD response increased with the level of mental rotation demand (F(4, 312) = 4.93, p < 10−3) and non-matched trials evoked a stronger response compared to the matched trials (F(1, 78) = 4.43, p = 0.04) (Table 2). Here again, at this SNR, we did not find any significant difference between the level of activity evoked within the caudate in Pre-HDs versus healthy controls (F(1, 78) = 2.61, p = 0.11) and/or a significant interaction between the effect of Group and other independent factors. We did not find any systematic response to mental rotation demand in the other basal ganglia nuclei (including putamen and pallidum) and effects of Rotation, Trial-Type and/or Rotation × Trial-Type interaction remained insignificant in these regions (F < 1.91, p > 0.11). It is important to note that, in conventional fMRI studies (i.e., voxel size > 2 mm isotropic) the tail of caudate, (presumably the caudate region earliest affected in HD [46]) is not easily visualized by MRI (see also [52]). Thus, the absence of any measurable effect in the caudate should be considered with caution. Nevertheless, these results suggest that changes in visual perception during the HD prodrome could be detected more ‘reliably’ within OT visual rather than the caudo-fronto-parietal (CFP) association network.
Correlation between fMRI activity and DBS in Pre-HDs
To test the relationship between DBS and brain activity during mental rotation task, for each mental rotation condition, we estimated the correlation between the evoked BOLD signal measured within our ROIs and the calculated DBS. Interestingly, among our ROIs, activity in fronto-central gyrus and caudate nucleus, but not early visual areas, showed a significant inverse correlation (r < –0.43, p < 0.05) with DBS (Fig. 6 and Table 3). Subjects with higher DBS showed a weaker BOLD response in fronto-central area and caudate nucleus. We also found a weak correlation between DBS and BOLD response within the superior/inferior parietal regions and superior frontal gyrus. However, in superior/inferior parietal regions, this correlation was limited to the most difficult trials (i.e., Rotation = 60–80°) while in the superior frontal gyrus, this correlation was limited to the easiest trials. Among the tested ROIs, none showed a significant correlation between the evoked activity and subject age (r(23) < 0.25, p > 0.21). These results suggest that the effect of mutant huntingtin has a differential impact on the activity within OT and CFP regions (see Discussion).
Fig. 6.

Relationship between the measured disease burden score and evoked brain activity in Pre-HDs across different mental rotation conditions. Among ROIs (i.e., those brain regions that showed a significant effect of rotation (Fig. 3)), activity within fronto-central and caudate, but not early visual areas, showed a significant correlation with disease burden score in all mental rotation degrees (see also Table 3). In these regions, the level of BOLD activity decreased as disease burden score increased. In each panel, each dot represents BOLD activity measured in the target ROI of one individual Pre-HD subject.
Table 3.
Correlation between the disease burden score and the level of activity measured within ROIs
| Mental Rotation 0° | Mental Rotation 20° | Mental Rotation 40° | Mental Rotation 60° | Mental Rotation 80° | |
|---|---|---|---|---|---|
| Early Visual | r = −0.27 | r = −0.16 | r = −0.21 | r = −0.24 | r = −0.30 |
| p = 0.20 | p = 0.44 | p = 0.32 | p = 0.25 | p = 0.15 | |
| Orbitofrontal | r=0.15 | r = 0.29 | r = 0.30 | r = 0.29 | r = 0.01 |
| p = 0.47 | p = 0.17 | p = 0.16 | p = 0.17 | p = 0.96 | |
| Superior Frontal | r = −0.41 | r = −0.35 | r = −0.33 | r = −0.39 | r = −0.18 |
| p = 0.04* | p = 0.08 | p = 0.11 | p = 0.06 | p = 0.39 | |
| Superior Parietal | r = −0.09 | r = −0.30 | r = −0.34 | r = −0.43 | r = −0.48 |
| p = 0.66 | p = 0.15 | p = 0.11 | p = 0.04* | p = 0.02* | |
| Inferior Parietal | r = −0.23 | r = −0.37 | r = −0.32 | r = −0.55 | r = −0.36 |
| p = 0.28 | p = 0.07 | p = 0.13 | p<0.01** | p = 0.08 | |
| Fronto-Central | r = −0.45 | r = −0.55 | r = −0.61 | r = −0.59 | r = −0.63 |
| p = 0.02* | p<0.01** | p<0.01** | p<0.01** | p < 10−3** | |
| Mid-Anterior Cingulate | r = −0.01 | r = −0.07 | r = −0.16 | r = −0.14 | r = −0.18 |
| p = 0.98 | p = 0.73 | p = 0.44 | p = 0.52 | p = 0.39 | |
| Anterior Insular | r = 0.18 | r = 0.11 | r = 0.08 | r = 0.01 | r = −0.16 |
| p = 0.40 | p = 0.60 | p = 0.71 | p = 0.92 | p = 0.44 | |
| Caudate Nucleus | r = −0.43 | r = −0.47 | r = −0.52 | r = −0.50 | r = −0.52 |
| p = 0.03* | p = 0.02* | p<0.01** | p = 0.01** | p <0.01** | |
| Fusiform | r = −0.21 | r = 0.01 | r=0.15 | r = 0.09 | r=0.16 |
| p = 0.34 | p = 0.95 | p = 0.48 | p = 0.68 | p = 0.47 |
p ≤ 0.05;
p ≤ 0.01.
Subsequently we checked if there might be any moderator effect of the mental rotation load, as we found in the Pre-HD’s behavior, on the relationship between DBS and the level of evoked fMRI response within caudate, fronto-central gyrus and superior/inferior parietal regions (i.e., those regions that showed a significant correlation between evoked fMRI and DBS, in at least 2 different levels of mental rotation load). Application of linear regression to activity within caudate and fronto-central gyrus only showed a significant relationship between the level activity of evoked within these two regions and DBS (Beta < –0.49, p < 10−5) but no significant relationship with DBS × mental rotation load (p > 0.40). Application of the same analysis to activity within superior and inferior regions did not yield any significant relationship between the evoked response and DBS and DBS × mental rotation load (p > 0.10), consistent with weaker correlation in these regions compared to caudate and fronto-central gyrus (Table 3). Notably, all p-values are also corrected for multiple comparison based on Bonferroni methods.
Between-groups structural differences
We also tested whether the decrease in BOLD response within early visual areas was associated with cortical thinning within the same regions of the visual cortex. As shown in Fig. 7A, despite the relatively liberal threshold used in this figure (p < 0.05), we did not find any overlap between the visual areas with cortical thinning and the portion that showed a significant difference in the level of fMRI response between Pre-HDs and controls. Rather, cortical thinning in this group of Pre-HDs was limited to the posterior tip of medial temporal sulcus, and also along intraparietal and superior frontal sulci.
Fig. 7.
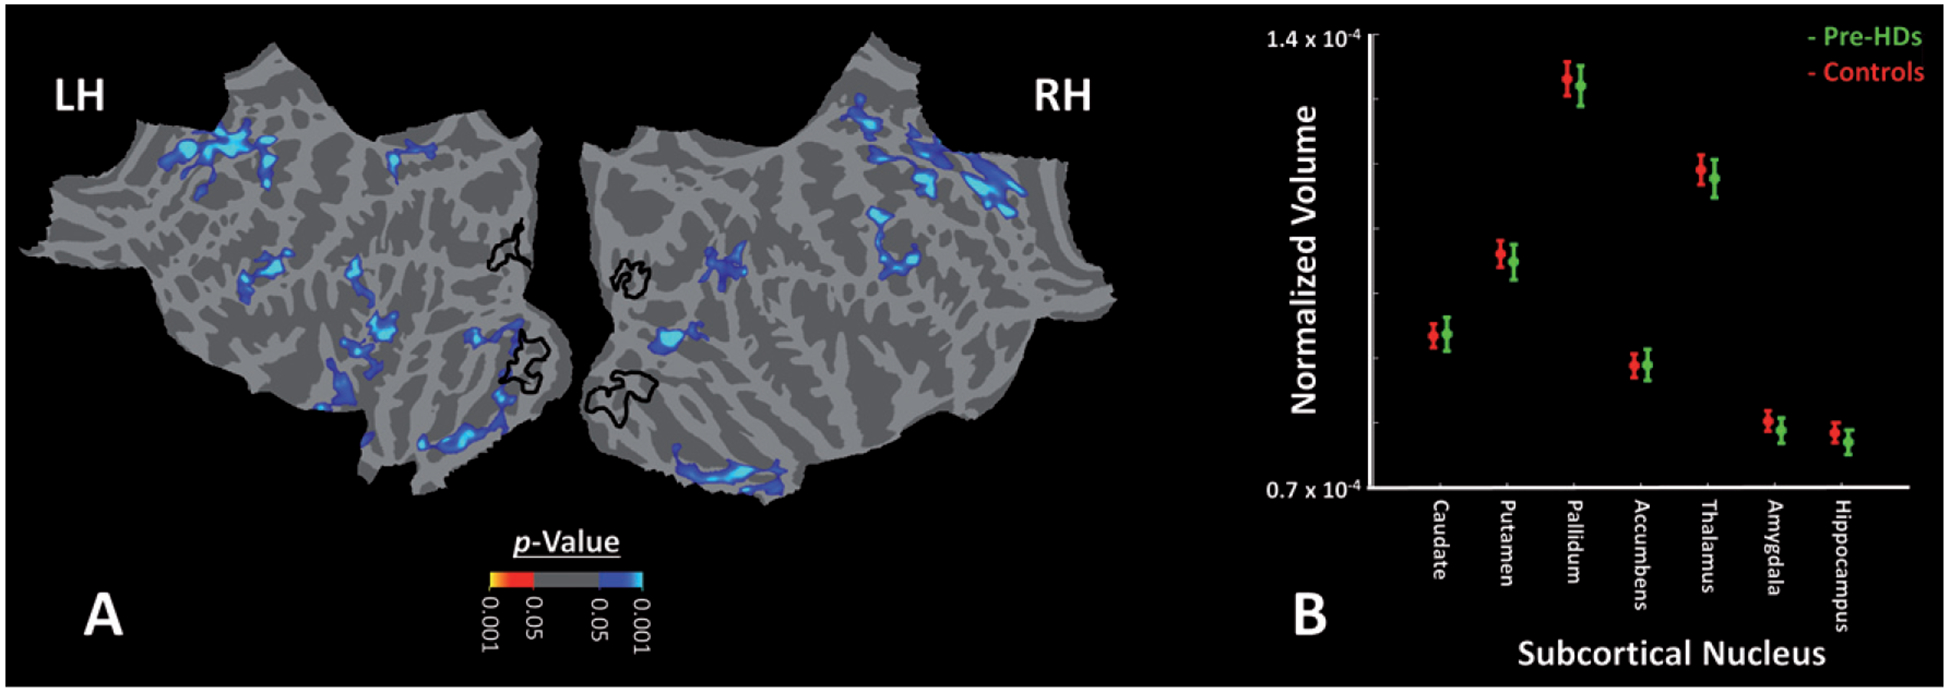
Impact of HD on cortical thickness and size of subcortical nuclei of Pre-HD individuals compared to healthy matched controls. A) The significance of cortical thinning in Pre-HDs compared to controls in the left and right hemispheres. We did not find any cortical thinning within early visual regions that showed functional impairments in Pre-HDs vs. controls outlined by black lines. Similar results were also obtained in the left hemisphere (not shown here). B) We also did not find any decrease in size of subcortical nuclei in Pre-HD (green) individuals compared to healthy controls (red). Notably, all measurements were normalized relative to the individual subject’s brain volume. These results are consistent with the fact that gene-expanded individuals participated in our tests were all in early motor pre-symptomatic stages of HD.
We also tested whether there was any basal ganglia volume loss in the Pre-HD individuals studied as compared to controls (Fig. 7B). While striatal atrophy has been reported in previous studies of Pre-HDs [53, 54], no significant atrophy has been reported in others, particularly in those individuals expected far from onset [55]. In our subjects, the application of t-tests (2-tailed) showed no significant difference between the two groups in the size of basal ganglia nuclei including caudate (t(77) = 0.42, p = 0.67), putamen (t(77) = 0.13, p = 0.89), pallidum (t(77) = 0.10, p = 0.92), nucleus accumbens (t(77) = 0.43, p = 0.67) and/or other subcortical structures including amygdala (t(77) = 0.40, p = 0.69), hippocampus (t(77) = 0.39, p = 0.69) or thalamus (t(77) = 0.20, p = 0.84). Notably, all measurements were normalized relative to the individual subject’s brain volume. According to these results, it seemed unlikely that the reduced BOLD activity within early visual areas during the mental rotation were a result of either cortical thinning in those areas and/or structural degeneration of subcortical nuclei. However, two points should be considered here: First, it is generally difficult to localize and assess the volume of tail of caudate, a region highly connected to visual areas, in structural scans [52]. Second, the spatial resolution of the structural scans and likelihood of subthreshold between-groups differences should be considered in interpretation of these results (see Discussion).
The link between neural and behavioral response: A modeling approach
Although we found decreased BOLD activity in early visual areas in Pre-HDs compared to controls, it was not clear if these effects were associated with a clinical/behavioral outcome. To test whether there was any evidence for such a change during the HD prodrome, we compared the link between neural and behavioral responses within Pre-HDs and controls using a linear regression modeling approach (see Methods).
Figure 8 shows the resultant least mean square error (LMSE) in predicting subject’s response accuracy based on this approach. Irrespective of the areas that drove the model, in both groups, LMSE increased with increase in the level of mental rotation demand. More importantly, the LMSE for predicting Pre-HDs response accuracy was higher than in controls across all mental rotation conditions. Here, the application of one-factor repeated measures ANOVA (Rotation (0° vs. 20° vs. 40° vs. 60° vs. 80°)) with a Group factor (Pre-HDs vs. Controls) to the measured LMSE values showed a significant effects of Rotation (F(4, 792) = 794.72, p < 0.01) and Group (F(1, 198) = 1328.8, p < 0.01). Thus, the link between neural activity and behavior differed significantly between Pre-HDs and controls, supporting the likelihood of altered neural mechanisms involved in mental rotation in Pre-HDs as compared to controls (see Discussion).
Fig. 8.

Results of predicting subjects’ behavior, based on the level of evoked BOLD response. We used a linear regression model to predict subjects’ response accuracy based on BOLD activity measured within the ROIs. Model was optimized based on the brain activity and response accuracy of 40 randomly selected healthy controls, and tested against the rest of controls and 15 randomly selected Pre-HDs. In all repetitions (n = 1000), model showed a better performance predicting the response accuracy (mean square error) of healthy controls (red) rather than Pre-HDs (green). Error bars show one standard error of mean.
DISCUSSION
Our study demonstrates reduced mental rotation performance during the HD prodrome, accompanied by decreased fMRI BOLD activity within early visual areas. Importantly, our modelling analysis suggests that the presence of the genetic mutation also influences the relationship between brain fMRI activity and response accuracy during mental rotation. These findings highlight the likely impact of the mutant huntingtin gene, including during the motor pre-symptomatic stage, on sensory visual processing and supports the hypothetical compensatory mechanisms, utilized by Pre-HD individuals, to reduce them.
Impact of the impaired neural processing in early visual areas
Our findings suggest that early deficits in neural processing affect processing within the early visual areas. These areas are anatomically located anterior to the calcarine sulcus and posterior to the fusiform gyrus (Fig. 4), i.e., they overlap with retinotopic visual areas V2-V4. Studies in human and non-human primates have shown that neural structures within these areas are mainly involved in spatial frequency, depth (disparity), shape and color encoding [56–64]. Therefore, perceptual impairments in Pre-HDs may not be limited to mental rotation and may also affect other aspects of their visual perception. These perceptual impairments could interfere with normal daily activities such as driving, and likely lead to occupational decline as reported previously in HD [65–67].
These visual perceptual deficits may be due to altered connectivity within (visual) cortico-striatal loops [68–71] and/or neural degeneration either within the striatum, visual system or both. Although the absence of measurable occipital cortical thinning (and/or striatal atrophy) in our cohort suggests that these findings may not be attributable to the structural degeneration, which has been reported in early symptomatic HD [21–23, 72], the spatial resolution of the used MRI technique (1 mm) should be considered in interpretation of these findings.
Impaired visual processing in higher level visual areas
Decreased stimulus selectivity within PPA, a higher category-selective visual area responsible for scene [13, 14] and shape encoding [16, 18, 19, 73], has been reported previously in early symptomatic HD [9]. The absence of altered activation of the PPA and/or other object-selective areas such as lateral occipital complex (LOC) [74–77] in our current study could have two explanations: First, because early HD-related atrophy is more prominent in the tail of caudate [46], a region heavily connected to early visual areas [52, 68–71], HD-related impairments in visual cortical processing would be expected to extend from posterior to more anterior visual areas with disease progression [52, 71].
Second, the absence of an impaired response within the higher visual areas might be (at least in part) due to the simple form of the stimuli (i.e., line drawing shapes) used in this study. These stimuli are different from the complex visual stimuli preferred by high level visual areas such as faces [51, 78], scenes [13, 14] and/or natural objects [75, 79].
Impaired attentional control in Pre-HDs
HD-related cognitive impairments, in general, and attention control impairment, in particular, have been reported previously [80–84]. Here, we have shown impaired mental-rotation related activity within OT visual but not within the CFP regions that contribute to attention control [85]. This OT activity decrease, in presence of the mostly intact CFP activation, may be due to A) stronger HD impacts on sensory processing rather than attentional control in this stage of disease, B) reduced functional link between CFP attention and OT sensory regions or C) a combination of these effects. Thus, although our findings do not rule out attentional and/or cognitive impairments in Pre-HD individuals, they suggest that sensory impairments may be present even in absence of decreased activity within CFP regions of Pre-HD individuals.
Potential impact of differential eye movement in Pre-HDs vs. controls
Previous studies have shown that HD impairs eye movement control [86–89] which is directly associated with disease severity [87]. To control the potential impact of this impairment, subjects were instructed to avoid eye movement during the experiment by looking at a centrally presented fixation spot that remained visible during the whole experiment. This procedure and the inclusion of only pre-symptomatic individuals, in whom eye movement impairments are less prominent [87], suggest that our findings of functional impairments in visual areas are unlikely due to the differential eye movements in Pre-HDs vs. controls.
This conclusion is also supported by the location of impairment within the visual cortex. Specifically, any effect of impaired extraocular movements would be expected to be stronger in primary visual area V1, in which neurons have smaller receptive fields compared to higher order visual areas. In our study, the between group difference was stronger in more anterior visual areas (V2-V4) compared to V1 (Fig. 4).
Absence of correlation between DBS and functional impairments in OT visual network
Disease burden score (DBS) was originally introduced to provide a measure of the cumulative effects of exposure to the genetic expansion (CAG repeats) that is associated with striatal atrophy [34]. However, at the time of that study, the impact of HD on cortical structure (e.g., [5, 21, 23, 90]) and functional activity (e.g., [5, 9]) were mostly unknown. Thus, the absence of a significant relationship between DBS and HD-related BOLD activity change in OT visual areas is not a surprise. Rather, it suggests that visual activity impairment follows a different time line and may precede HD-related striatal atrophy.
Perceptual impairments and compensatory strategies in Pre-HDs
Only a few behavioral studies have found perceptual impairments in HD, including less accurate shape and face discrimination capability, in both motor pre-symptomatic and early symptomatic patients [5–9, 21]. However, as reported here, these impairments are more apparent during more demanding experimental conditions. Specifically, while a group of Pre-HD individuals showed strong mental rotation impairment, another group showed intact response accuracy during judgment of line orientation, a simple standardized task used to assess visuospatial processing.
Previous studies have suggested that intact behavioral performance of Pre-HD individuals during simple tasks is likely due to compensatory mechanisms that may be at play during the HD prodrome [91]. Supporting this hypothesis, we found that models that best predicted healthy control response were poor at predicting Pre-HD subjects’ behavior, suggesting intrinsic differences in neural mechanisms that underlie perceptual decision-making between Pre-HDs vs. healthy matched controls.
Conclusion
In 1872, George Huntington described a ‘disease of nervous system’ which was originally called simply ‘chorea’ or ‘hereditary chorea’ referring to the patient’s well-known movement disorder. Since then, accumulating evidence has suggested that HD is not limited to motor control, but also affects cognitive capabilities and perception. Our findings support early impairments in visual perception during the HD prodrome. These perceptual impairments may have significant impact on early onset of functional deficits in HD gene-carriers. Our findings also support altered relationship between evoked fMRI responses (an index of neural activity) within CFP/OT networks and visual perception, as suggested by existence compensatory mechanism(s). However, understanding the exact nature of this mechanism requires more studies in future.
ACKNOWLEDGMENTS
This work was supported by the National Institutes of Health (NS042861, NS058793 R56 to HDR and 5P41-EB-015896-17 to the Martinos Center for Biomedical Imaging). We are very grateful to the individuals who participated in this study, who so generously contributed their time and energy to this work, and without whom it would not have been possible. We thank the individuals who helped recruit participants for this study, including: Paul Wilkens, Maria Aristolova, Tyler Triggs, William Monaco, Jessica Meyers, Angela Hu and Keith Malarick.
Footnotes
CONFLICT OF INTEREST
The authors have no conflict of interest to report.
REFERENCES
- [1].Andrew SE, Goldberg YP, Kremer B, Telenius H, Theilmann J, Adam S, et al. The relationship between trinucleotide (CAG) repeat length. Nat Genet. 1993;4:398–403. [DOI] [PubMed] [Google Scholar]
- [2].O’Donovan MC. A novel gene containing a trinucleotide repeat that is expanded and unstable on Huntington’s disease chromosomes. Cell. 1993;72(6):971–83. [DOI] [PubMed] [Google Scholar]
- [3].Kremer B, Goldberg P, Andrew SE, Theilmann J, Telenius H, Zeisler J, et al. A worldwide study of the Huntington’s disease mutation: The sensitivity and specificity of measuring CAG repeats. N Engl J Med. 1994;330(20):1401–6. [DOI] [PubMed] [Google Scholar]
- [4].Huntington G On chorea. The Medical and Surgical Reporter: A Weekly Journal. 1872;26(15):317–21. [Google Scholar]
- [5].Wolf RC, Sambataro F, Vasic N, Baldas EM, Ratheiser I, Bernhard Landwehrmeyer G, et al. Visual system integrity and cognition in early Huntington’s disease. Eur J Neurosci. 2014;40(2):2417–26. [DOI] [PubMed] [Google Scholar]
- [6].Lawrence AD, Watkins LH, Sahakian BJ, Hodges JR, Robbins TW. Visual object and visuospatial cognition in Huntington’s disease: Implications for information processing in corticostriatal circuits. Brain. 2000;123(Pt 7):1349–64. [DOI] [PubMed] [Google Scholar]
- [7].Gomez-Tortosa E, del Barrio A, Barroso T, Garcia Ruiz PJ. Visual processing disorders in patients with Huntington’s disease and asymptomatic carriers. J Neurol. 1996;243(3):286–92. [DOI] [PubMed] [Google Scholar]
- [8].Jacobs DH, Shuren J, Heilman KM. Impaired perception of facial identity and facial affect in Huntington’s disease. Neurology. 1995;45(6):1217–8. [DOI] [PubMed] [Google Scholar]
- [9].Nasr S, Rosas HD. Impact of visual corticostriatal loop disruption on neural processing within the parahippocampal place area. J Neurosci. 2016;36(40):10456–71. [DOI] [PMC free article] [PubMed] [Google Scholar]
- [10].Leh SE, Ptito A, Chakravarty MM, Strafella AP. Frontostriatal connections in the human brain: A probabilistic diffusion tractography study. Neurosci Lett. 2007;419(2): 113–8. [DOI] [PMC free article] [PubMed] [Google Scholar]
- [11].Di Martino A, Scheres A, Margulies DS, Kelly AM, Uddin LQ, Shehzad Z, et al. Functional connectivity of human striatum: A resting state FMRI study. Cereb Cortex. 2008;18(12):2735–47. [DOI] [PubMed] [Google Scholar]
- [12].Seger CA. How do the basal ganglia contribute to categorization? Their roles in generalization, response selection, and learning via feedback. Neurosci Biobehav Rev. 2008;32(2):265–78. [DOI] [PMC free article] [PubMed] [Google Scholar]
- [13].Nasr S, Liu N, Devaney KJ, Yue X, Rajimehr R, Ungerleider LG, et al. Scene-selective cortical regions in human and nonhuman primates. J Neurosci. 2011;31(39):13771–85. [DOI] [PMC free article] [PubMed] [Google Scholar]
- [14].Epstein R, Kanwisher N. A cortical representation of the local visual environment. Nature. 1998;392(6676):598–601. [DOI] [PubMed] [Google Scholar]
- [15].Rajimehr R, Devaney KJ, Bilenko NY, Young JC, Tootell RB. The “parahippocampal place area” responds preferentially to high spatial frequencies in humans and monkeys. PLoS Biol. 2011;9(4):e1000608. [DOI] [PMC free article] [PubMed] [Google Scholar]
- [16].Nasr S, Echavarria CE, Tootell RB. Thinking outside the box: Rectilinear shapes selectively activate scene-selective cortex. J Neurosci. 2014;34(20):6721–35. [DOI] [PMC free article] [PubMed] [Google Scholar]
- [17].Nasr S, Tootell RB. A cardinal orientation bias in scene-selective visual cortex. J Neurosci. 2012;32(43):14921–6. [DOI] [PMC free article] [PubMed] [Google Scholar]
- [18].Zeidman P, Mullally SL, Schwarzkopf DS, Maguire EA. Exploring the parahippocampal cortex response to high and low spatial frequency spaces. Neuroreport. 2012;23(8):503–7. [DOI] [PMC free article] [PubMed] [Google Scholar]
- [19].Troiani V, Stigliani A, Smith ME, Epstein RA. Multiple object properties drive scene-selective regions. Cereb Cortex. 2014;24(4):883–97. [DOI] [PMC free article] [PubMed] [Google Scholar]
- [20].Harel A, Kravitz DJ, Baker CI. Deconstructing visual scenes in cortex: Gradients of object and spatial layout information. Cereb Cortex. 2013;23(4):947–57. [DOI] [PMC free article] [PubMed] [Google Scholar]
- [21].Labuschagne I, Cassidy AM, Scahill RI, Johnson EB, Rees E, O’Regan A, et al. Visuospatial processing deficits linked to posterior brain regions in premanifest and early stage Huntington’s disease. J Int Neuropsychol Soc. 2016;22(6):595–608. [DOI] [PubMed] [Google Scholar]
- [22].Rosas HD, Salat DH, Lee SY, Zaleta AK, Pappu V, Fischl B, et al. Cerebral cortex and the clinical expression of Huntington’s disease: Complexity and heterogeneity. Brain. 2008;131(Pt 4):1057–68. [DOI] [PMC free article] [PubMed] [Google Scholar]
- [23].Rosas H, Hevelone N, Zaleta A, Greve D, Salat D, Fischl B. Regional cortical thinning in preclinical Huntington disease and its relationship to cognition. Neurology. 2005;65(5):745–7. [DOI] [PubMed] [Google Scholar]
- [24].Rüb U, Vonsattel JPG, Heinsen H, Korf H-W. The cerebral cortex in Huntington’s disease (HD) The Neuropathology of Huntington’s Disease: Classical Findings, Recent Developments and Correlation to Functional Neuroanatomy: Springer; 2015. pp. 25–39. [PubMed] [Google Scholar]
- [25].Hertzog C, Vernon MC, Rypma B. Age differences in mental rotation task performance: The influence of speed/accuracy tradeoffs. J Gerontol. 1993;48(3):P150–6. [DOI] [PubMed] [Google Scholar]
- [26].Shepard RN, Metzler J. Mental rotation of three-dimensional objects. Science. 1971;171(3972):701–3. [DOI] [PubMed] [Google Scholar]
- [27].Cohen MS, Kosslyn SM, Breiter HC, DiGirolamo GJ, Thompson WL, Anderson A, et al. Changes in cortical activity during mental rotation A mapping study using functional MRI. Brain. 1996;119(1):89–100. [DOI] [PubMed] [Google Scholar]
- [28].Jordan K, Heinze H-J, Lutz K, Kanowski M, Jäncke L Cortical activations during the mental rotation of different visual objects. Neuroimage. 2001;13(1):143–52. [DOI] [PubMed] [Google Scholar]
- [29].Zacks JM. Neuroimaging studies of mental rotation: A meta-analysis and review. J Cogn Neurosci. 2008;20(1):1–19. [DOI] [PubMed] [Google Scholar]
- [30].Duff K, Beglinger LJ, Paulsen JS. “Pre-symptomatic” Huntington’s disease. Handb Clin Neurol. 2008;89:589–98. [DOI] [PMC free article] [PubMed] [Google Scholar]
- [31].Rahman Q, Wilson GD. Large sexual-orientation-related differences in performance on mental rotation and judgement of line orientation tasks. Neuropsychology. 2003;17(1):25. [PubMed] [Google Scholar]
- [32].Caparelli-Dáquer EM, Oliveira-Souza R, Moreira Filho PF. Judgment of line orientation depends on gender, education, and type of error. Brain Cogn. 2009;69(1):116–20. [DOI] [PubMed] [Google Scholar]
- [33].Maylor EA, Reimers S, Choi J, Collaer ML, Peters M, Silverman I. Gender and sexual orientation differences in cognition across adulthood: Age is kinder to women than to men regardless of sexual orientation. Arch Sex Behav. 2007;36(2):235–49. [DOI] [PubMed] [Google Scholar]
- [34].Penney JB Jr, Vonsattel JP, MacDonald ME, Gusella JF, Myers RH. CAG repeat number governs the development rate of pathology in Huntington’s disease. Ann Neurol. 1997;41(5):689–92. [DOI] [PubMed] [Google Scholar]
- [35].Dale AM. Optimal experimental design for event-related fMRI. Hum Brain Mapp. 1999;8(2–3):109–14. [DOI] [PMC free article] [PubMed] [Google Scholar]
- [36].Benton AL, Hamsher K, Varney NR, Spreen O. Judgment of line orientation: Oxford University Press; New York; 1983. [Google Scholar]
- [37].Fischl B FreeSurfer. Neuroimage. 2012;62(2):774–81. [DOI] [PMC free article] [PubMed] [Google Scholar]
- [38].Fischl B, Sereno MI, Dale AM. Cortical surface-based analysis. II: Inflation, flattening, and a surface-based coordinate system. Neuroimage. 1999;9(2):195–207. [DOI] [PubMed] [Google Scholar]
- [39].Dale AM, Fischl B, Sereno MI. Cortical surface-based analysis. I. Segmentation and surface reconstruction. Neuroimage. 1999;9(2):179–94. [DOI] [PubMed] [Google Scholar]
- [40].Fischl B, Salat DH, Busa E, Albert M, Dieterich M, Hasel-grove C, et al. Whole brain segmentation: Automated labeling of neuroanatomical structures in the human brain. Neuron. 2002;33(3):341–55. [DOI] [PubMed] [Google Scholar]
- [41].Fischl B, van der Kouwe A, Destrieux C, Halgren E, Segonne F, Salat DH, et al. Automatically parcellating the human cerebral cortex. Cereb Cortex. 2004;14(1):11–22. [DOI] [PubMed] [Google Scholar]
- [42].Desikan RS, Segonne F, Fischl B, Quinn BT, Dickerson BC, Blacker D, et al. An automated labeling system for subdividing the human cerebral cortex on MRI scans into gyral based regions of interest. Neuroimage. 2006;31(3):968–80. [DOI] [PubMed] [Google Scholar]
- [43].Greve DN, Fischl B. Accurate and robust brain image alignment using boundary-based registration. Neuroimage. 2009;48(1):63–72. [DOI] [PMC free article] [PubMed] [Google Scholar]
- [44].Friston KJ, Holmes AP, Price CJ, Buchel C, Worsley KJ. Multisubject fMRI studies and conjunction analyses. Neuroimage. 1999;10(4):385–96. [DOI] [PubMed] [Google Scholar]
- [45].Destrieux C, Fischl B, Dale A, Halgren E. Automatic parcellation of human cortical gyri and sulci using standard anatomical nomenclature. Neuroimage. 2010;53(1):1–15. [DOI] [PMC free article] [PubMed] [Google Scholar]
- [46].Vonsattel JP, Myers RH, Stevens TJ, Ferrante RJ, Bird ED, Richardson EP Jr. Neuropathological classification of Huntington’s disease. J Neuropathol Exp Neurol. 1985;44(6):559–77. [DOI] [PubMed] [Google Scholar]
- [47].Aylward EH, Sparks BF, Field KM, Yallapragada V, Shpritz BD, Rosenblatt A, et al. Onset and rate of striatal atrophy in preclinical Huntington disease. Neurology. 2004;63(1):66–72. [DOI] [PubMed] [Google Scholar]
- [48].Bohanna I, Georgiou-Karistianis N, Hannan AJ, Egan GF. Magnetic resonance imaging as an approach towards identifying neuropathological biomarkers for Huntington’s disease. Brain Res Rev. 2008;58(1):209–25. [DOI] [PubMed] [Google Scholar]
- [49].Rosas HD, Goodman J, Chen YI, Jenkins BG, Kennedy DN, Makris N, et al. Striatal volume loss in HD as measured by MRI and the influence of CAG repeat. Neurology. 2001;57(6):1025–8. [DOI] [PubMed] [Google Scholar]
- [50].Hinds OP, Rajendran N, Polimeni JR, Augustinack JC, Wiggins G, Wald LL, et al. Accurate prediction of V1 location from cortical folds in a surface coordinate system. Neuroimage. 2008;39(4):1585–99. [DOI] [PMC free article] [PubMed] [Google Scholar]
- [51].Kanwisher N, McDermott J, Chun MM. The fusiform face area: A module in human extrastriate cortex specialized for face perception. J Neurosci. 1997;17(11):4302–11. [DOI] [PMC free article] [PubMed] [Google Scholar]
- [52].Seger CA. The visual corticostriatal loop through the tail of the caudate: Circuitry and function. Front Syst Neurosci. 2013;7:104. [DOI] [PMC free article] [PubMed] [Google Scholar]
- [53].Aylward EH, Brandt J, Codori A, Mangus R, Barta PE, Harris G. Reduced basal ganglia volume associated with the gene for Huntington’s disease in asymptomatic at-risk persons. Neurology. 1994;44(5):823. [DOI] [PubMed] [Google Scholar]
- [54].Paulsen J, Langbehn D, Stout J, Aylward E, Ross C, Nance M, et al. Detection of Huntington’s disease decades before diagnosis: The Predict-HD study. J Neurol Neurosurg Psychiatry. 2008;79(8):874–80. [DOI] [PMC free article] [PubMed] [Google Scholar]
- [55].Harrington DL, Long JD, Durgerian S, Mourany L, Koenig K, Bonner-Jackson A, et al. Cross-sectional and longitudinal multimodal structural imaging in prodromal Huntington’s disease. Mov Disord. 2016;31(11):1664–75. [DOI] [PMC free article] [PubMed] [Google Scholar]
- [56].Tootell RB, Nasr S. Columnar segregation of magnocellular and parvocellular streams in human extrastriate cortex. J Neurosci. 2017;37(33):8014–32. [DOI] [PMC free article] [PubMed] [Google Scholar]
- [57].Nasr S, Polimeni JR, Tootell RB. Interdigitated color- and disparity-selective columns within human visual cortical areas V2 and V3. J Neurosci. 2016;36(6):1841–57. [DOI] [PMC free article] [PubMed] [Google Scholar]
- [58].Vanduffel W, Tootell RB, Schoups AA, Orban GA. The organization of orientation selectivity throughout macaque visual cortex. Cereb Cortex. 2002;12(6):647–62. [DOI] [PubMed] [Google Scholar]
- [59].Goncalves NR, Ban H, Sanchez-Panchuelo RM, Francis ST, Schluppeck D, Welchman AE. 7 tesla FMRI reveals systematic functional organization for binocular disparity in dorsal visual cortex. J Neurosci. 2015;35(7):3056–72. [DOI] [PMC free article] [PubMed] [Google Scholar]
- [60].Anzai A, Chowdhury SA, DeAngelis GC. Coding of stereoscopic depth information in visual areas V3 and V3A. J Neurosci. 2011;31(28):10270–82. [DOI] [PMC free article] [PubMed] [Google Scholar]
- [61].Tootell RB, Nelissen K, Vanduffel W, Orban GA. Search for color ‘center(s) ’ in macaque visual cortex. Cereb Cortex. 2004;14(4):353–63. [DOI] [PubMed] [Google Scholar]
- [62].Pasupathy A, Connor CE. Population coding of shape in area V4. Nat Neurosci. 2002;5(12):1332. [DOI] [PubMed] [Google Scholar]
- [63].Kobatake E, Tanaka K. Neuronal selectivities to complex object features in the ventral visual pathway of the macaque cerebral cortex. J Neurophysiol. 1994;71(3):856–67. [DOI] [PubMed] [Google Scholar]
- [64].Nasr S, Tootell RB. Columnar organization of mid-spectral and end-spectral hue preferences in human visual cortex. Neuroimage. 2018;181:748–59. [DOI] [PMC free article] [PubMed] [Google Scholar]
- [65].Devos H, Nieuwboer A, Vandenberghe W, Tant M, De Weerdt W, Uc EY. On-road driving impairments in Huntington disease. Neurology. 2014;82(11):956–62. [DOI] [PubMed] [Google Scholar]
- [66].Beglinger LJ, O’Rourke JJ, Wang C, Langbehn DR, Duff K, Paulsen JS, et al. Earliest functional declines in Huntington disease. Psychiatry Res. 2010;178(2):414–8. [DOI] [PMC free article] [PubMed] [Google Scholar]
- [67].Rebok GW, Bylsma FW, Keyl PM, Brandt J, Folstein SE. Automobile driving in Huntington’s disease. Mov Disord. 1995;10(6):778–87. [DOI] [PubMed] [Google Scholar]
- [68].Baizer JS, Desimone R, Ungerleider LG. Comparison of subcortical connections of inferior temporal and posterior parietal cortex in monkeys. Vis Neurosci. 1993;10(1):59–72. [DOI] [PubMed] [Google Scholar]
- [69].Yeterian EH, Pandya DN. Corticostriatal connections of extrastriate visual areas in rhesus monkeys. J Comp Neurol. 1995;352(3):436–57. [DOI] [PubMed] [Google Scholar]
- [70].Cheng K, Saleem KS, Tanaka K. Organization of corticostriatal and corticoamygdalar projections arising from the anterior inferotemporal area TE of the macaque monkey: A Phaseolus vulgaris leucoagglutinin study. J Neurosci. 1997;17(20):7902–25. [DOI] [PMC free article] [PubMed] [Google Scholar]
- [71].Middleton FA, Strick PL. The temporal lobe is a target of output from the basal ganglia. Proc Natl Acad Sci U S A. 1996;93(16):8683–7. [DOI] [PMC free article] [PubMed] [Google Scholar]
- [72].Tabrizi SJ, Langbehn DR, Leavitt BR, Roos RA, Durr A, Craufurd D, et al. Biological and clinical manifestations of Huntington’s disease in the longitudinal TRACK-HD study: Cross-sectional analysis of baseline data. Lancet Neurol. 2009;8(9):791–801. [DOI] [PMC free article] [PubMed] [Google Scholar]
- [73].Watson DM, Hymers M, Hartley T, Andrews TJ. Patterns of neural response in scene-selective regions of the human brain are affected by low-level manipulations of spatial frequency. Neuroimage. 2016;124:107–17. [DOI] [PubMed] [Google Scholar]
- [74].Op de Beeck HP, Dicarlo JJ, Goense JB, Grill-Spector K, Papanastassiou A, Tanifuji M, et al. Fine-scale spatial organization of face and object selectivity in the temporal lobe: Do functional magnetic resonance imaging, optical imaging, and electrophysiology agree? J Neurosci. 2008;28(46):11796–801. [DOI] [PMC free article] [PubMed] [Google Scholar]
- [75].Grill-Spector K, Kourtzi Z, Kanwisher N. The lateral occipital complex and its role in object recognition. Vision Res. 2001;41(10–11):1409–22. [DOI] [PubMed] [Google Scholar]
- [76].Echavarria C, Nasr S, Tootell R. Smooth versus textured surfaces: Feature-based category selectivity in human visual cortex. eNeuro. 2016;3(5):ENEURO.0051–16.2016. [DOI] [PMC free article] [PubMed] [Google Scholar]
- [77].Denys K, Vanduffel W, Fize D, Nelissen K, Peuskens H, Van Essen D, et al. The processing of visual shape in the cerebral cortex of human and nonhuman primates: A functional magnetic resonance imaging study. J Neurosci. 2004;24(10):2551–65. [DOI] [PMC free article] [PubMed] [Google Scholar]
- [78].Rajimehr R, Young JC, Tootell RB. An anterior temporal face patch in human cortex, predicted by macaque maps. Proc Natl Acad Sci U S A. 2009;106(6):1995–2000. [DOI] [PMC free article] [PubMed] [Google Scholar]
- [79].Grill-Spector K The neural basis of object perception. Curr Opin Neurobiol. 2003;13(2):159–66. [DOI] [PubMed] [Google Scholar]
- [80].Lemiere J, Decruyenaere M, Evers-Kiebooms G, Vandenbussche E, Dom R. Cognitive changes in patients with Huntington’s disease (HD) and asymptomatic carriers of the HD mutation. J Neurol. 2004;251(8):935–42. [DOI] [PubMed] [Google Scholar]
- [81].Georgiou N, Bradshaw JL, Phillips JG, Chiu E. The effect of Huntington’s disease and Gilles de la Tourette’s syndrome on the ability to hold and shift attention. Neuropsychologia. 1996;34(9):843–51. [DOI] [PubMed] [Google Scholar]
- [82].Sprengelmeyer R, Lange H, Hömberg V. The pattern of attentional deficits in Huntington’s disease. Brain. 1995;118(1):145–52. [DOI] [PubMed] [Google Scholar]
- [83].Ho A, Sahakian B, Brown R, Barker R, Hodges J, Ané M-N, et al. Profile of cognitive progression in early Huntington’s disease. Neurology. 2003;61(12):1702–6. [DOI] [PubMed] [Google Scholar]
- [84].Thompson JC, Poliakoff E, Sollom AC, Howard E, Craufurd D, Snowden JS. Automaticity and attention in Huntington’s disease: When two hands are not better than one. Neuropsychologia. 2010;48(1):171–8. [DOI] [PubMed] [Google Scholar]
- [85].Corbetta M Frontoparietal cortical networks for directing attention and the eye to visual locations: Identical, independent, or overlapping neural systems? Proc Natl Acad Sci U S A. 1998;95(3):831–8. [DOI] [PMC free article] [PubMed] [Google Scholar]
- [86].Lasker AG, Zee DS. Ocular motor abnormalities in Huntington’s disease. Vision Res. 1997;37(24):3639–45. [DOI] [PubMed] [Google Scholar]
- [87].Peltsch A, Hoffman A, Armstrong I, Pari G, Munoz D. Saccadic impairments in Huntington’s disease. Exp Brain Res. 2008;186(3):457. [DOI] [PubMed] [Google Scholar]
- [88].Patel SS, Jankovic J, Hood AJ, Jeter CB, Sereno AB. Reflexive and volitional saccades: Biomarkers of Huntington disease severity and progression. J Neurol Sci. 2012;313(1):35–41. [DOI] [PMC free article] [PubMed] [Google Scholar]
- [89].Antoniades CA, Xu Z, Mason SL, Carpenter R, Barker RA. Huntington’s disease: Changes in saccades and hand-tapping over 3 years. J Neurol. 2010;257(11):1890–8. [DOI] [PubMed] [Google Scholar]
- [90].Johnson EB, Rees EM, Labuschagne I, Durr A, Leavitt BR, Roos RA, et al. The impact of occipital lobe cortical thickness on cognitive task performance: An investigation in Huntington’s disease. Neuropsychologia. 2015;79:138–46. [DOI] [PubMed] [Google Scholar]
- [91].Papoutsi M, Labuschagne I, Tabrizi SJ, Stout JC. The cognitive burden in Huntington’s disease: Pathology, phenotype, and mechanisms of compensation. Mov Disord. 2014;29(5):673–83. [DOI] [PubMed] [Google Scholar]