Abstract
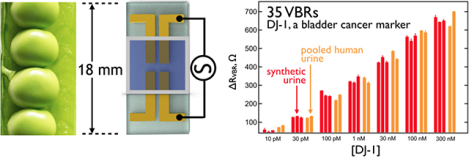
DJ-1, a 20.7 kDa protein, is overexpressed in people who have bladder cancer (BC). Its elevated concentration in urine allows it to serve as a marker for BC. But no biosensor for the detection of DJ-1 has been demonstrated. Here, we describe a virus bioresistor (VBR) capable of detecting DJ-1 in urine at a concentration of 10 pM in one minute. The VBR consists of a pair of millimeter-scale gold electrodes that measure the electrical impedance of an ultra-thin (≈150–200 nm), two-layer polymeric channel. The top layer of this channel (90–105 nm in thickness) consists of an electrodeposited virus-PEDOT (PEDOT is poly(3,4-ethylenedioxythiophene)) composite containing embedded M13 virus particles that are engineered to recognize and bind to the target protein of interest, DJ-1. The bottom layer consists of spin-coated PEDOT-PSS (poly(styrene sulfonate)). Together, these two layers constitute a current divider. We demonstrate here that reducing the thickness of the bottom PEDOT-PSS layer increases its resistance, and concentrates the resistance drop of the channel in the top virus-PEDOT layer, thereby increasing the sensitivity of the VBR and enabling the detection of DJ-1. Large signal amplitudes coupled with the inherent simplicity of the VBR sensor design results in high signal-to-noise (S/N > 100) and excellent sensor-to-sensor reproducibility characterized by coefficients of variation in the range of 3–7% across the DJ-1 binding curve down to a concentration of 30 pM, near the 10 pM limit of detection (LOD), encompassing four orders of magnitude in concentration.
Graphical Abstract
I. INTRODUCTION
Minimally invasive cancer screening using bodily fluids – so called “liquid biopsies” – may eventually eliminate the evaluation of suspected malignancies using surgery.1 Liquid biopsies involve the detection in blood, urine, and other bodily fluids of nucleic acids, circulating tumor cells (in blood), or distinctive protein markers that signal the presence of a particular cancer. DJ-1, a 20.7 kDa protein, is elevated in the urine of people with bladder cancer (BC).2,3 Presently, the measurement of DJ-1 in urine requires an enzyme-linked immunosorbent assay (ELISA), which is both slow and inconvenient. A biosensor for DJ-1 could accelerate its assessment for the detection of BC recurrence in patients who have undergone treatment for the disease. But no biosensor for DJ-1 has been demonstrated, to our knowledge. Here we demonstrate that a new type of biosensor – the Virus BioResistor or VBR - that uses virus particles as receptors can be programmed to detect DJ-1 in human urine.
The VBR is a bioresistor contacted with two gold electrodes. The bioresistor consists of an electronically conductive channel composed of a layer of poly(3,4ethylene dioxythiophene) (PEDOT) doped with virus particles. Recently4, we demonstrated the VBR concept for the detection of human serum albumin (HSA, 66.5 kDa) in high salt (160 mM NaCl) buffer. A limit-of-detection for HSA (LODHSA) of 7 nM was achieved in that study.4 However, a sub-1.0 nM LOD for protein markers is required to enable cancer surveillance in urine. Here we unlock higher sensitivity for VBRs simply by engineering the PEDOT channel to concentrate the impedance in an ultra-thin (≈90 nm) virus-PEDOT composite layer. With this modification, a limit-of-detection of (LODDJ1) of 10 pM is achieved in urine (synthetic and human), coupled with a dynamic range of more than four orders of magnitude from 10 pM to 300 nM. This performance is clinically relevant because it allows for the detection of elevated DJ-1 in the urine of patients who have bladder cancer (≈ 100 pM).2,3,5,6 Importantly, the modifications to the VBR do not compromise either the speed or the simplicity of its operation. As before4, the VBR operates in a dip-and-read modality, and produces a stable, quantitative signal within 1.0 min. The sensing performance reported here also eclipses prior virus-based biosensors that we have studied over a period of 14 years in our laboratories.7,8,9,10,11,12
The mechanism by which the VBR transduces protein binding remains under investigation. A hypothesis presented here proposes that a target protein permeates the virus-PEDOT layer as it undergoes immunoaffinity-driven partitioning to virus particles entrained in this layer. As the volume fraction of electrically insulating proteins increases, the electrical conductivity of the resistor channel imparted by PEDOT is reduced, generating the VBR signal.
II. EXPERIMENTAL METHODS
Materials and methods.
Gold electrodes were prepared by photolithography and physical vapor deposition. The following materials and reagents were purchased commercially and used as received: PMMA cells (Wainamics Inc., Fremont CA) and bare gold electrodes were oxygen plasma-cleaned (PDC-32G, Harrick Plasma). PEDOT-PSS (poly(3,4-ethylenedioxythiophene) polystyrene sulfonate) Heraeus Clevios™ PH1000 from Ossila; lithium perchlorate 99+% purity from Acros organics; EDOT (3,4-ethylenedioxythiophene) from Sigma Aldrich; ethylene glycol from Macron Fine Chemicals. Phosphate buffered saline (PBS, 10x concentrate) from Sigma Aldrich. 1x concentrate of the PBS yielded a phosphate-buffered saline solution at pH 7.4 with a sodium chloride concentration of 0.154 M and a phosphate buffer concentration of 0.01 M. The DJ-1 over-expression plasmid pET3a-His-DJ1 was a gift from Michael J. Fox Foundation, MJFF (Addgene plasmid #51488). DJ-1 was recombinantly overexpressed in E. coli. Interleukin 6 (IL-6) was purchased from Tonbo Bioscences. M13 phage library design and procedures for the selection of DJ-1 binders using this library are described in the Supporting Information (SI).
The affinity of engineered M13 virus particles for DJ-1 can be seen from the results of two enzyme-linked immunosorbent assay (ELISA) measurements (Figure 1). The ELISA measurement was conducted two ways: With DJ-1 adsorbed onto a 96 well plate, measuring the recognition of adsorbed DJ-1 by phage particles in solution (Figure 1a), and by adsorbing the phage particles on the plate and measuring the binding of DJ-1 to this virus layer (Figure 1b). The latter configuration, which yields a much lower apparent dissociation constant, Kd,app, more closely resembles that situation relevant to the VBR.
Figure 1.
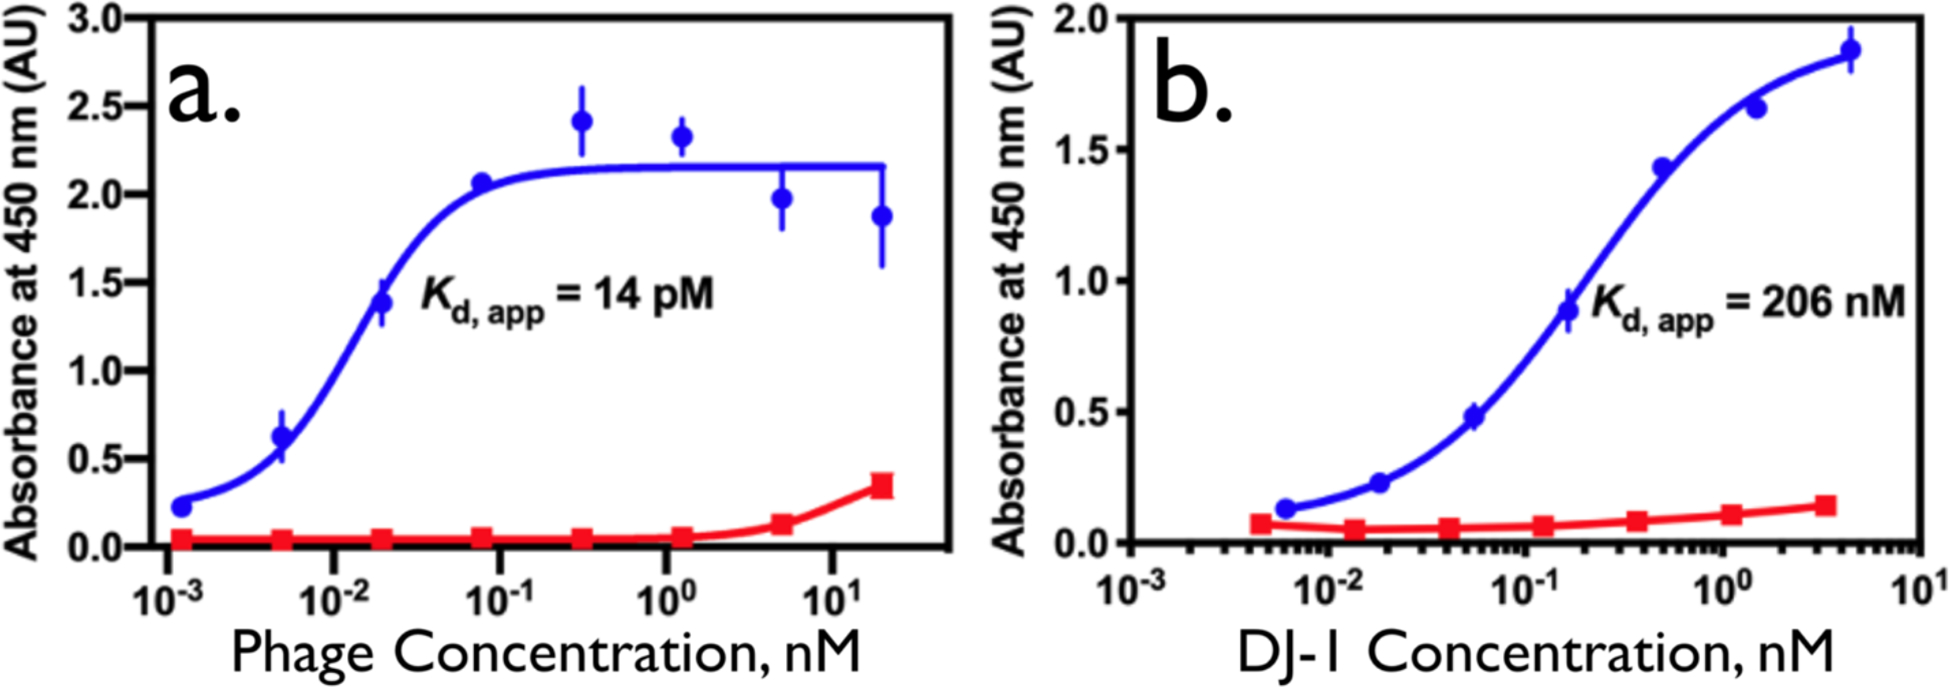
Two ELISAs for M13 phage binding of DJ-1: a) Phage ELISA of the DJ-1binding phage DL-1 and a negative control Stop4 phage. Here, DJ-1 is immobilized and the DL-1 phage is detected. The data were fit with a four-parameter logistic curve fit (R2 = 0.9230). Measurements were performed in triplicate; error bars represent the standard deviation of the mean. b) Sandwich ELISA of DJ-1. In this case, DL-1 phage (or the control Stop4 phage) are immobilized and the DJ-1 protein is detected. This format mimics the function of the VBR. The data were fit as described above (R2 = 0.9944). Measurements were performed in triplicate; error bars represent the standard deviation of the mean.
VBR Fabrication.
The fabrication process for the VBRs is similar to that described previously4 with minor modifications. Briefly, gold-film electrodes were cleaned in an O2 plasma for 10 min immediately before use. Thick (≈70 nm) and thin (≈48 nm) PEDOT-PSS films were prepared as follows: thick PEDOT-PSS films were obtained by stirring a solution of 3% (v/v) ethylene glycol with PEDOT-PSS for 30 min. Thin PEDOT-PSS films were obtained by stirring a solution of 1.5% (v/v) ethylene glycol in PEDOT-PSS for 30 min. These solutions were spin-coated on the gold electrodes at 2500 rpm for 80 s and then heated for 1 h at 90 °C. A PMMA cell was then attached to the PEDOT-PSS film and PEDOT-PSS coated gold electrodes were equilibrated in PBS for 30 min. Next, virus-PEDOT films were electropolymerized onto the PEDOT-PSS/gold-film electrodes using a platinum foil counter and MSE reference electrodes. Virus-PEDOT films were then electrodeposited onto the PEDOT-PSS film from aqueous solutions containing 8 nM M13 bacteriophage, 12.5 mM LiClO4 and 2.5 mM EDOT by performing two voltammetric scans from 0.2 V to 0.8 V vs. MSE at a scan rate of 20 mV/s. A PARSTAT 2263 controlled by Electrochemistry PowerSuit 2.6 software was used for this deposition. All VBRs employed for sensing measurements conformed to the screening parameters applied at each step of the fabrication process, as described in detail in the SI. For additional detail, see Figure S1.
Impedance Spectroscopy (IS).
All solutions were prepared and equilibrated at room temperature (20 °C) prior to IS measurements. The VBR cell was first rinsed three times with PBS after which impedance measurements were conducted as follows: Background IS measurement (in triplicate) was acquired in urine (synthetic or human) that contained no added protein, and a second IS measurement (again in triplicate) was acquired in the same urine containing added DJ-1 or IL-6 at the indicated concentrations. The difference in Zre between these two measurements at each frequency is ΔRVBR. The two RVBR inputs to ΔRVBR are obtained by fitting an impedance frequency spectrum that spans the range from 1 Hz to 40 kHz. All IS data were acquired using a Princeton Applied Research PARSTAT Model 2263 controlled by Electrochemistry PowerSuit 2.6 software. 50 data points were acquired across a frequency range of 1 Hz to 40 kHz. The amplitude of the applied voltage was 10 mV for all IS measurements. VBRs are single use devices. A different VBR was therefore used for each measurement. Equivalent circuit fitting was accomplished using EIS Analyzer (ABC Chemistry). Minimization algorithm Powell (300 iterations) was used to generate values for each circuit element.
Time scan experiment.
The time scan experiment was performed on four different VBRs for four concentrations of DJ-1 protein, 10 pM, 30 pM, 100 pM and 1 nM. Each VBR was first equilibrated in synthetic urine for 9 min. A “pure” urine baseline RVBR was then acquired at f = 0.1 Hz for 1.0 min. The synthetic urine was then removed from the PMMA cell and replaced with synthetic urine supplemented with DJ-1 protein at the specified concentration, without disconnecting the VBR from the potentiostat. After a one-minute exposure to the test solution, RVBR was again recorded for 10 min.
Control experiments.
Three negative control experiments were undertaken to test for signal specificity. In the first, a Stop-4 M13 virus, which has no displayed peptide binding moieties, was substituted for DJ-1-binding phage. The Stop-4 control VBRs were exposed to 500 nM DJ-1. Second, VBRs containing no phage were exposed to 500 nM DJ-1. Interleukin 6 (IL-6, 20.9 kDa, pI = 6.2) that is similar in size and pI to DJ-1, was used as a third control.
SEM Analysis.
Scanning electron microscopy (SEM) data were acquired using a FEI Magellan 400L XHR FE-SEM. An accelerating voltage of 2 keV was used for uncoated films and 10 keV for samples coated with 3 nm of iridium.
III. RESULTS AND DISCUSSION
III.A. VBR Fabrication and Characterization.
Starting with patterned gold electrodes on glass (Figure 2a), VBRs are prepared in three steps (Figure 2b). First, a PEDOT-PSS layer is deposited by spin-coating. Second, a poly(methyl methacrylate) or PMMA solution cell with adhesive backing is pressed onto the PEDOT-PSS layer. Third, this solution cell is used to electrodeposit a virus-PEDOT layer. This electrodeposition process applied the following protocol: The VBR cell is rinsed with PBS buffer and filled with an aqueous solution of EDOT (2.5 mM), LiClO4 (12.5 mM), and engineered M13 virus particles (8 nM). Using a mercurous sulphate reference electrode (MSE), and a platinum counter electrode, the virus-PEDOT composite layer is electrodeposited onto the PEDOT-PSS surface by scanning its potential (20 mV/s) from +0.20 V to +0.80 V and back versus MSE in two cycles (Figure 2a, b). Under these conditions, EDOT is oxidized and the growth of EDOT oligomers proceeds until insoluble cationic PEDOT is precipitated as a film, together with charge-compensating ClO4− anions, onto the PEDOT-PSS electrode.13 If M13 virus is present in the plating solution, virus particles are incorporated into the growing film, a process promoted by the high negative charge density of these particles. At neutral pH, each M13 vision is blanketed with ≈6000 negative charges.14 Previously, we have demonstrated that the electrodeposition of films from a plating solution containing M13 virus particles and EDOT produces a composite virus-PEDOT film that concentrates virus particles by a factor of 500 times relative to the M13 concentration in the plating solution.15 As seen in the photograph of a VBR shown in Figure 1c, the resulting VBR “channel”, consisting of a PEDOT-PSS bottom layer and a virus-PEDOT top layer, is transparent.
Figure 2.
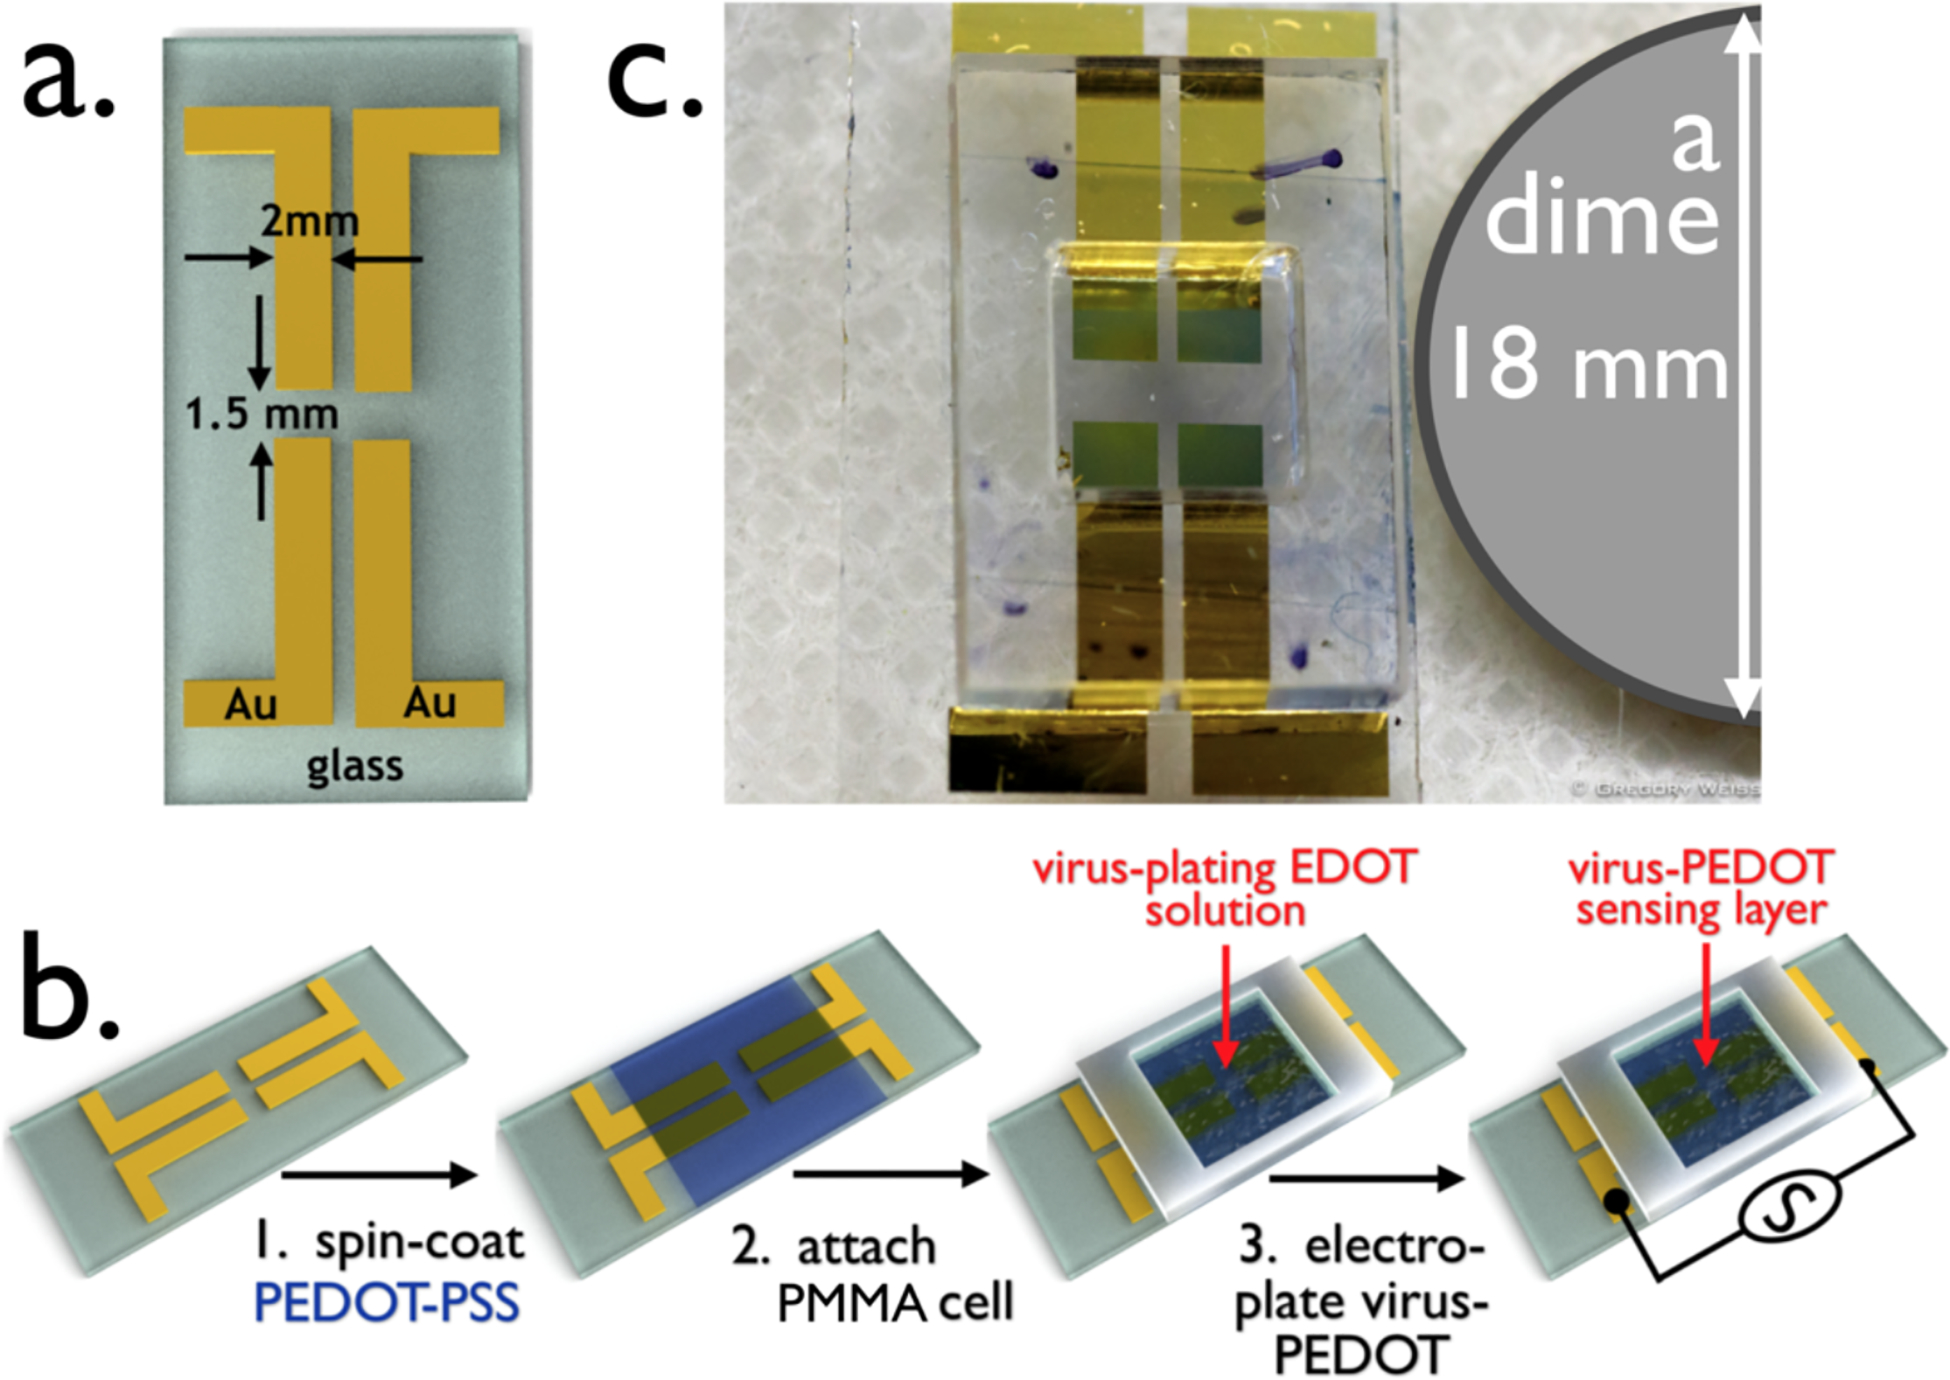
The Virus BioResistor (VBR). a) Rendering of gold electrodes for a two-VBR chip showing its dimensions. The two electrodes at left comprise one VBR and the two on the right a second VBR. These two VBRs will share a single bioaffinity layer. b) The three-step process for fabricating a VBR: Step 1 – a conductive PEDOT-PSS base layer is spin-coated onto the gold-on-glass template shown in (a). This film is baked at 90 °C for 60 min; Step 2 – A poly(methylmethacrylate)(PMMA) cell is attached on top of the dried PEDOT-PSS film; Step 3 – the PMMA cell is filled with aqueous EDOT-virus plating solution, and a virus-PEDOT film is deposited by electrooxidation. This VBR biosensor is ready for use. c) Photograph of a two-VBR chip with PMMA solution cell.
The VBR device architecture and polymeric channel resembles that of an organic electrochemical transistor (OECT).16,17,18, 19, 20 The differences between these two types of devices are the following: 1). The VBR is a two-terminal device with no gate electrode. This simplifies its operation considerably, as the VBR measures the impedance of its channel at its rest potential in the analysis solution without the need for gate scans and the requirement for optimization of the gate potential prior to a measurement.21 2). The VBR measures an impedance frequency spectrum for the channel, typically across five orders of magnitude in frequency instead of the DC resistance of the channel, as is common practice with EOCTs.22,23 This impedance data set allows the channel impedance, RVBR, which provides the VBR signal, to be cleanly separated from the solution impedance, Rsoln, which is correlated with the salt concentration of the analysis solution.4 For bodily fluids such as urine, Rsoln has the potential to provide information relating to the hydration state of a patient. 3). VBRs use engineered virus particles as receptors. Virus particles may be entrained in a PEDOT film by co-electrodeposition of the virus with the polymer as described above. A fourth difference may be the mechanism of signal generation, as described below.
The architecture and resultant properties of the VBR channel dictate its sensing performance. We focus attention here on the importance of the PEDOT-PSS layer thickness and electrical resistance. SEM cross-sectional images (Figure 3c,d) show that both polymer layers are tens of nanometers in total thickness. The thickness of the PEDOT-PSS bottom layer is influenced both by the presence of ethylene glycol (EG) in the deposition solution24,25 and the spin coater speed. The addition of EG is known to increase the conductivity of PEDOT-PSS by altering its morphology.26,27 Relatively thick (70 (± 3) nm) low resistance films were obtained using 3% (v/v) EG while high resistance films (48 (± 2) nm) were prepared using 1.5% (v/v) EG (Figure 3c,d). The electrical resistance of these layers, RPEDOT-PSS, is = 75 – 79 Ω (thick) and 240 – 380 Ω (thin). The increased resistance of the PEDOT-PSS bottom layer has little effect on the thickness of the virus-PEDOT top layer electrodeposited on it and the virus-PEDOT top layers had similar thicknesses of 92 (± 4) nm (high PEDOT-PSS resistance) versus 103 (± 4) nm (low resistance). As we demonstrate below, a reduction in thickness of the PEDOT-PSS layer, and an increase in its resistance, boosts the sensitivity of the VBR for the detection of HSA and DJ-1.
Figure 3.
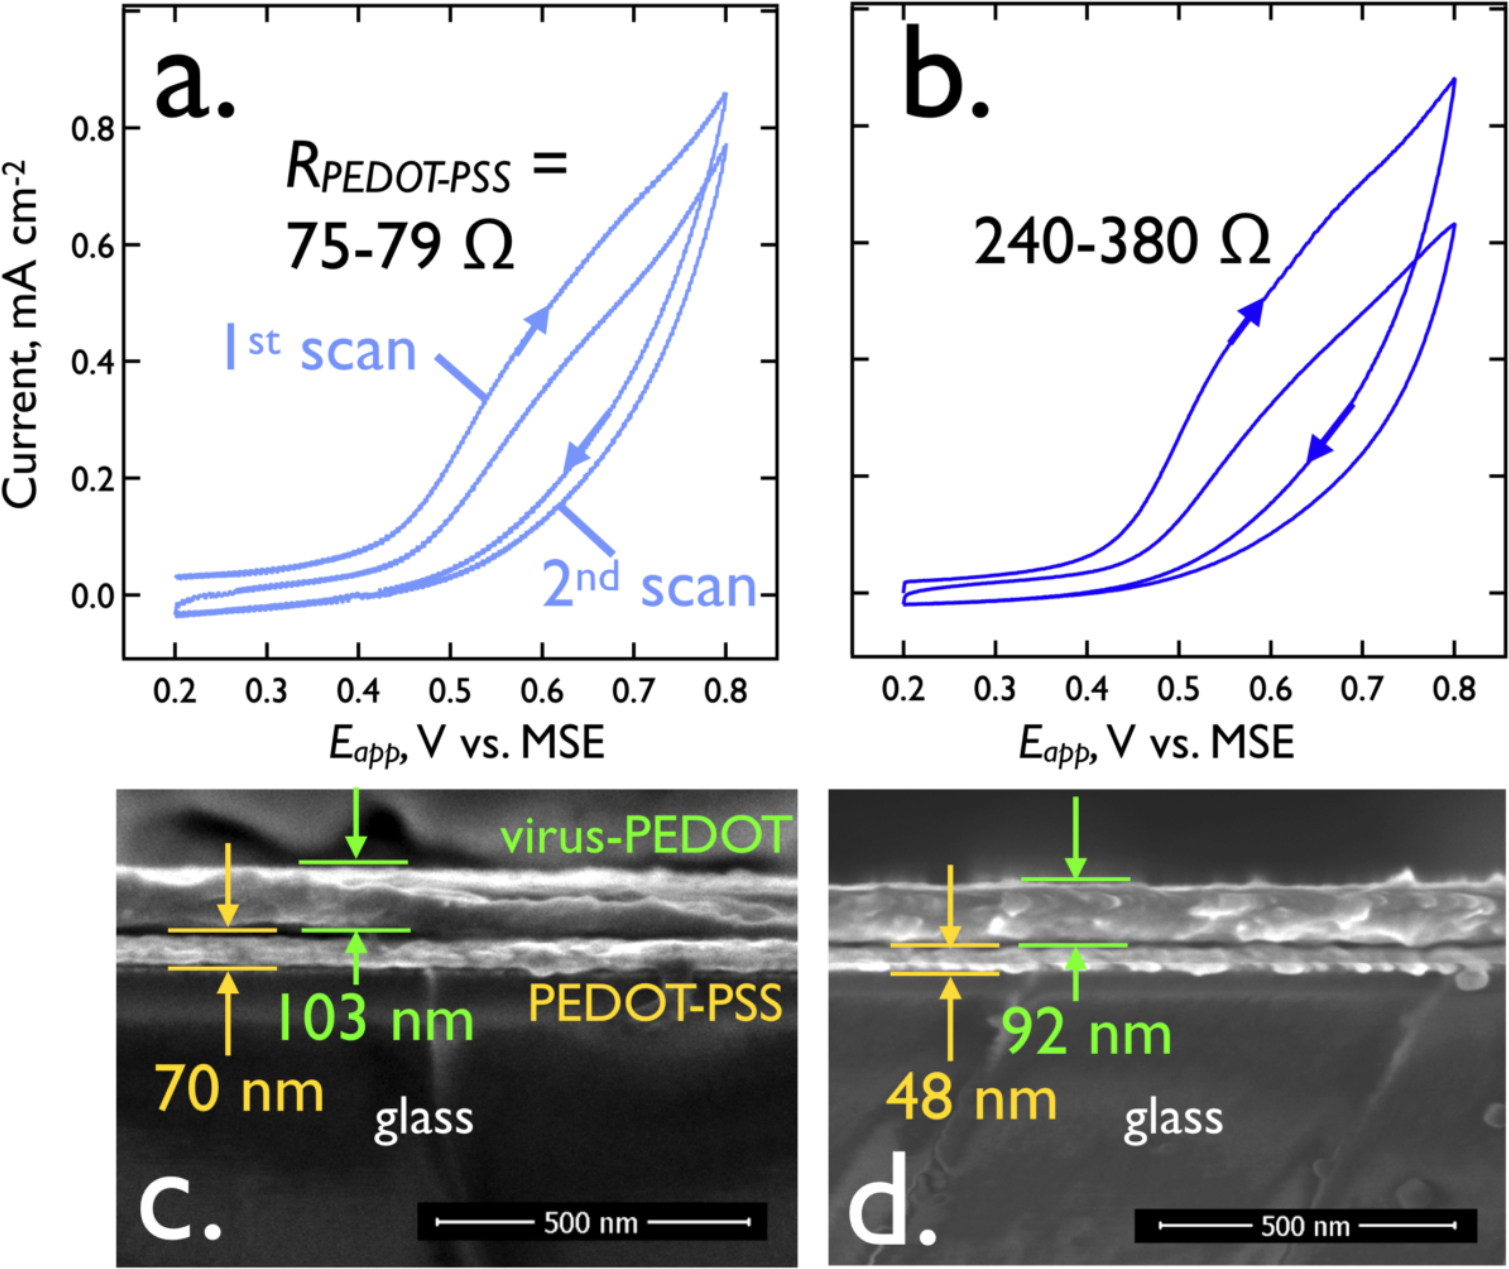
Electrodeposition and SEM cross-sections of virus-PEDOT bioaffinity layers. a). A virus-PEDOT bioaffinity layer is electrodeposited on a PEDOT-PSS base layer using two voltametric scans, as shown. The plating solution is aqueous 2.5 mM EDOT and 12.5 mM LiClO4, 8 nM virus, and the scan rate is 20 mV/s. The DC resistance, RPEDOT-PSS, of the PEDOT-PSS layer here is 75 – 79 Ω. b). Same electrodeposition process for a thinner, PEDOT-PSS base layer with RPEDOT-PSS in the range from 240 – 380 Ω. c,d). Cross-sectional SEM images of these two layers show that the more conductive PEDOT-PSS layer (RPEDOT-PSS = 75 – 79 Ω) is 70 nm (± 3 nm) in thickness whereas the less conductive PEDOT-PSS layer is 48 nm (± 2 nm) in thickness. The electrodeposited virus-PEDOT layer is also somewhat thinner in (d) relative to (c) in accordance with the lower deposition currents observed for the second deposition scan.
Electrodeposited virus-PEDOT and PEDOT-only films have a characteristic topography imparted by PEDOT crystallites protruding by up to a micron from the planar surface of the PEDOT film (Figure 4). These “PEDOT stalagmites” are not related to virus particles as they are observed both in the absence (Figure 4a, b) and presence (Figure 4c, d) of added phage particles. PEDOT stalagmites have attributes of crystallites, including a faceted appearance, as previously reported in the literature.28,29 In virus-PEDOT films, entrained M13 virus particles appear as black filamentous objects against a gray PEDOT background (Figure 4c,d,e). SEM examination of several samples show that the virus concentration within the plane of the virus-PEDOT film is nonuniform with 10 μm2 – 30 μm2 regions that are intensely black – indicating high virus concentrations – and other regions that are gray with a relatively low virus concentration. The clustering of virus particles within the film is interesting and surprising, given the high negative charge density of these particles.
Figure 4.
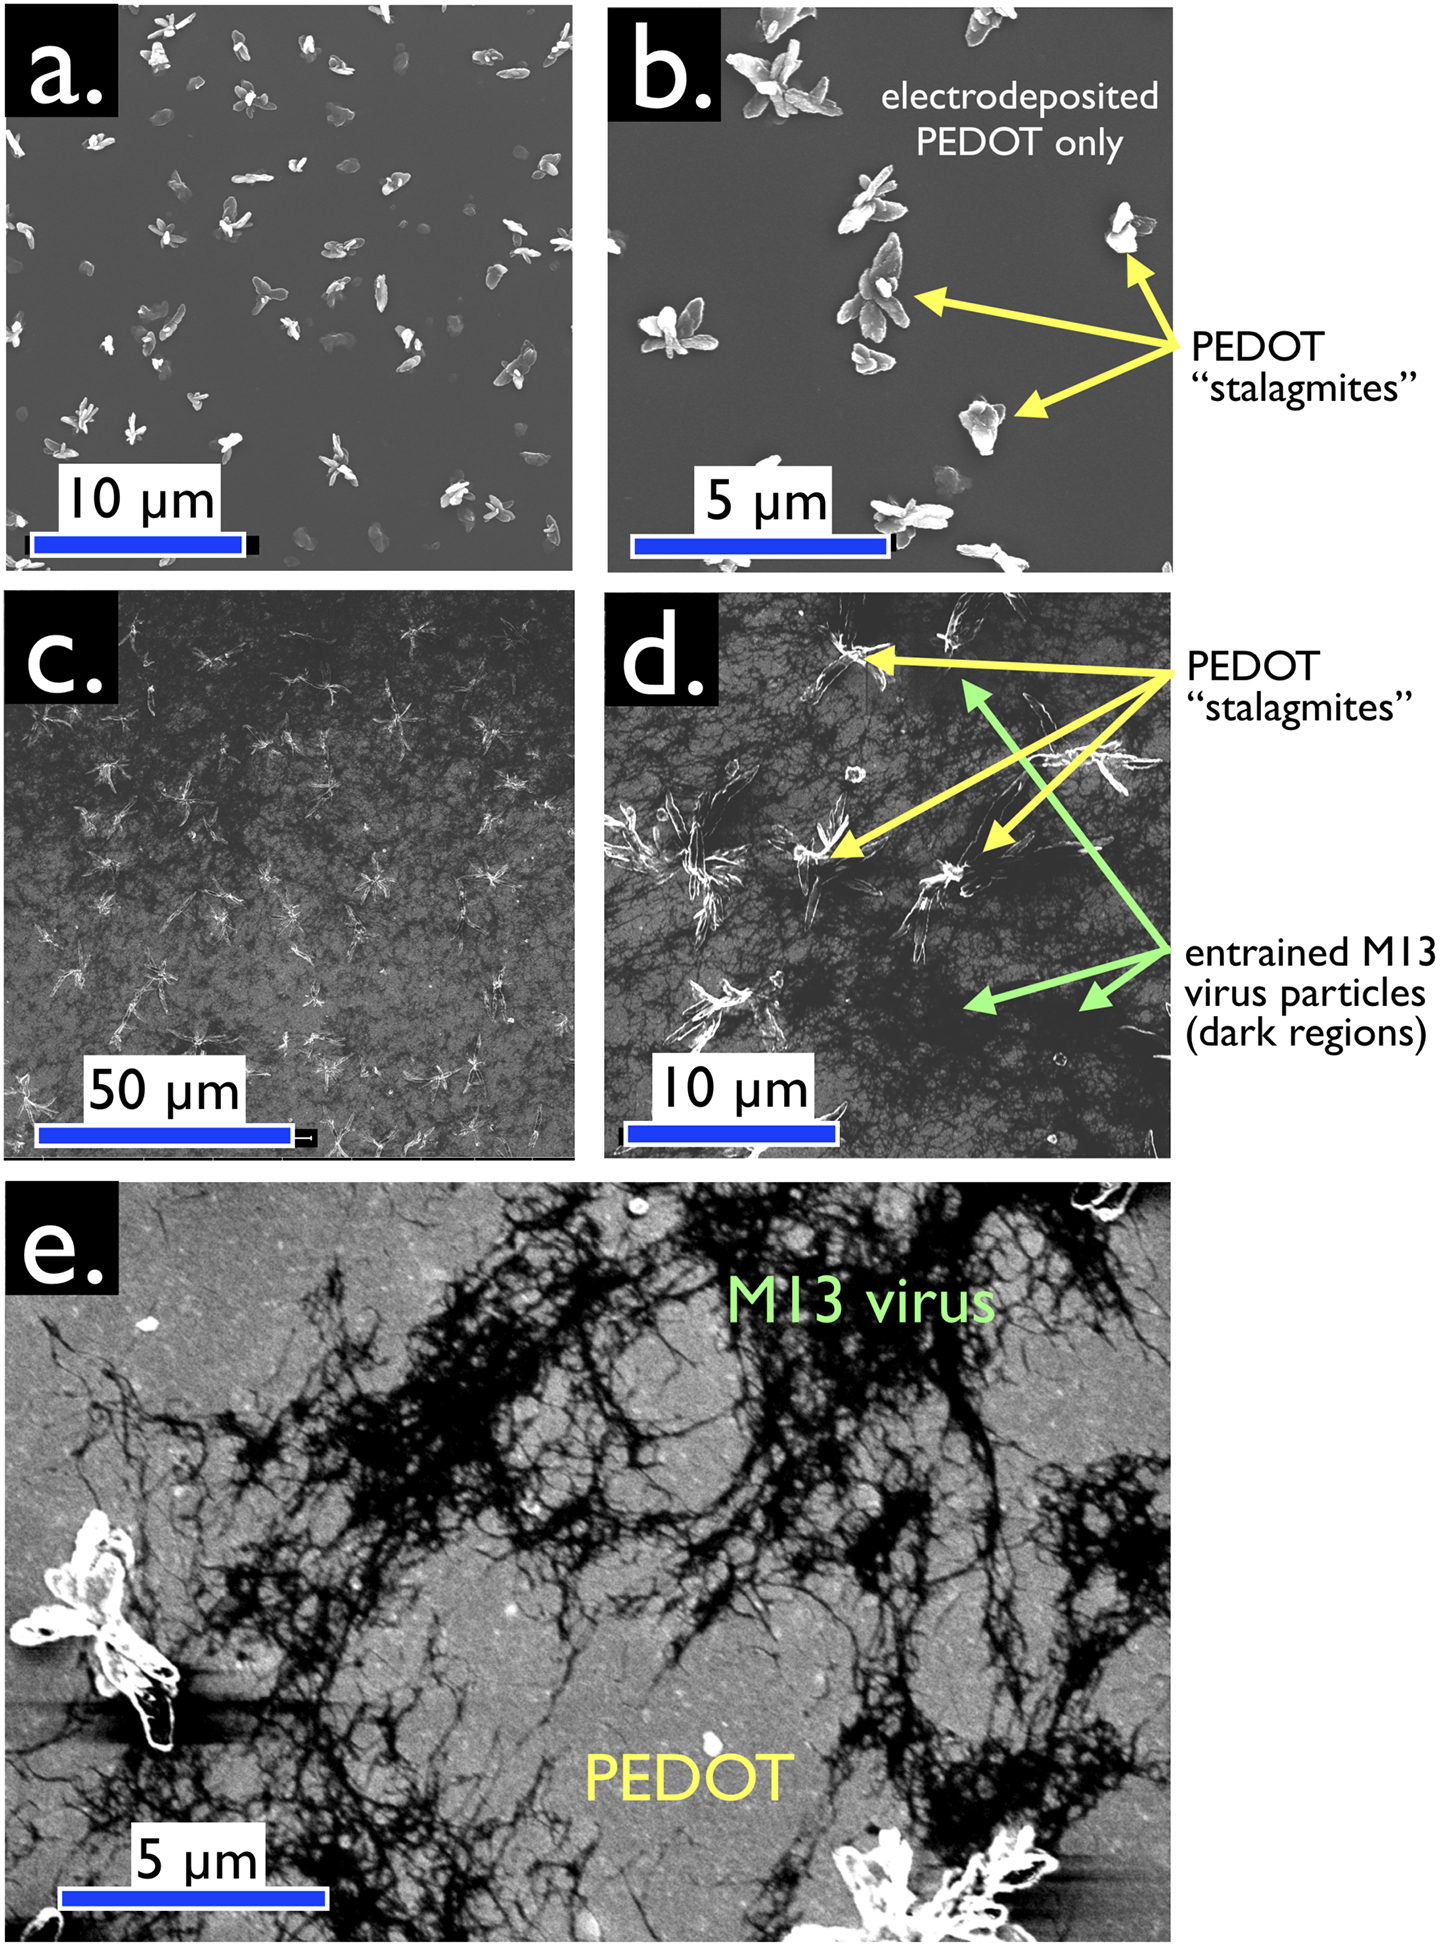
Plan-view SEM images, acquired with secondary electron detection (SED), of virus-free (a,b) and virus-containing (c,d,e) bioaffinity layers. (a,b) Control VBR bioaffinity layer prepared by electrodeposition from a solution containing no virus particles. Micron scale protrusions from the surface of this film are characteristic of electrodeposited PEDOT. These protrusions are not seen at PEDOT-PSS films prepared by spin-coating. We refer to these structures as “PEDOT stalagmites”. (c,d,e) VBR bioaffinity layers containing M13 virus particles. Filamentous M13 virus particles comprise the dark regions of these images. Lighter gray regions contain no virus. PEDOT stalagmites are also observed. Enhanced contrast (e) exposes tangles of M13, again distributed nonuniformly inside a virus-PEDOT bioaffinity layer.
III.B. VBR Electrical Response and Signal.
As previously proposed4, a simple equivalent circuit containing four circuit elements accounts for the measured frequency-dependent impedance of the VBR channel from DC to 40 kHz (Figure 5a). In this circuit, the capacitance of the virus-PEDOT/solution interface is represented by a total capacitance, C. This capacitance provides coupling between the AC voltage signal applied to the channel and the analyte solution. Three resistors represent the resistance of the analyte solution (Rsoln), the resistance of the top polymer layer (RPEDOT-virus) and the resistance of the bottom PEDOT-PSS layer (RPEDOT-PSS).
Figure 5.
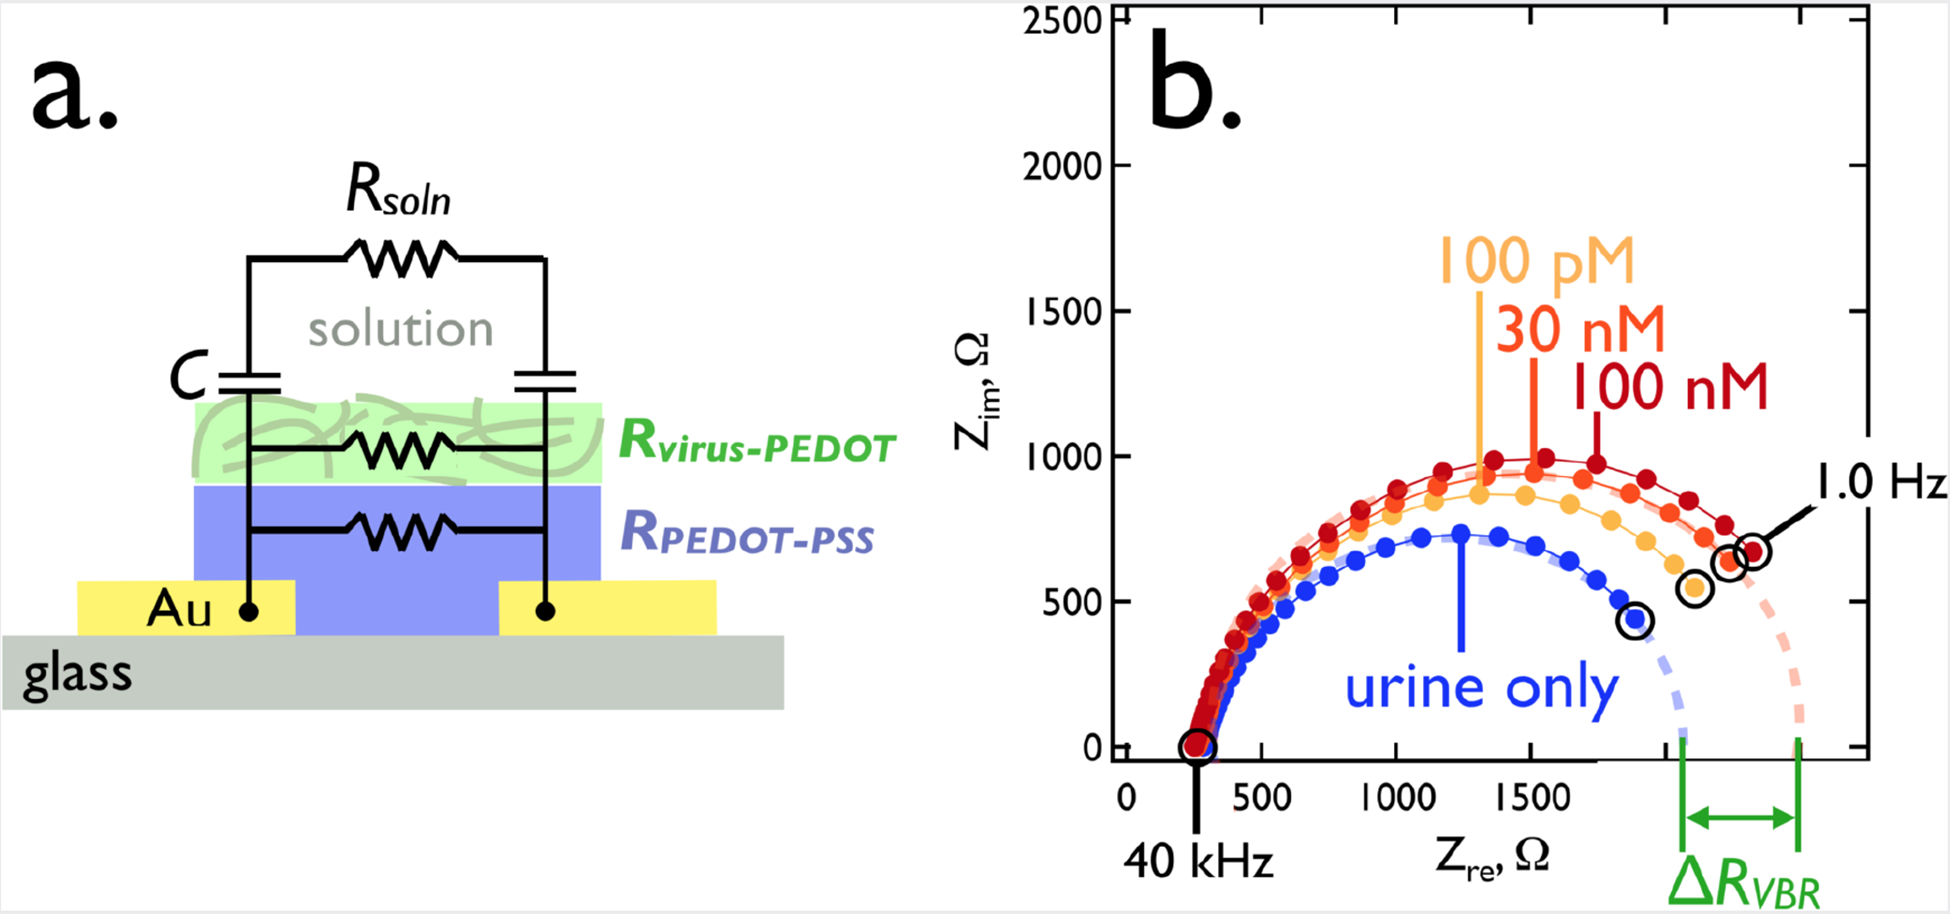
The VBR equivalent circuit (a) and a typical impedance response (b). This Nyquist plot (Zim versus Zre) shows the impedance frequency spectrum plotted between 1.0 Hz and 40 kHz for a synthetic urine solution that was supplemented with DJ-1. A single VBR measured these solutions at the indicated DJ-1 concentrations.
The impedance response of a VBR is characterized by a semi-circular Nyquist plot (Zim versus Zre, Figure 5b). A qualitative understanding of the VBR response is provided by examining its limiting behaviors at low and high frequencies across the range from 1.0 Hz to 40 kHz. At f = 1.0 Hz, the capacitive reactance of the virus-PEDOT/solution interface, (ZC = (2πfC)−1 ≈ 6 kΩ) is larger than RVBR (≈ 2.1–2.7 kΩ, Table 1). So, although Rsoln is small by comparison to RVBR (289–330 Ω), the value of ZC strongly attenuates the AC signal that accesses Rsoln. In this limit, RVBR is approximated by the parallel combination of RPEDOT-virus and RPEDOT-PSS (RVBR, Eq. 1).
| [1] |
As shown below and previously,2 RVBR increases in the presence of a target protein that is bound by virus particles in the virus-PEDOT layer. The difference between RVBR in the presence and absence of this protein is the VBR signal, ΔRVBR.
Table 1.
VBR circuit element values, and ΔRVBR, corresponding to the Nyquist plots of Figure 5b.
| Synthetic Urine | 100 pM DJ-1 | 30 nM DJ-1 | 100 nM DJ-1 | ||||||||
|---|---|---|---|---|---|---|---|---|---|---|---|
| Value | Stdev | Value | Stdev | Value | Stdev | Value | Stdev | ||||
| Rsol (Ω) | 331 | 8 | 288.7 | 0.9 | 293 | 7 | 279.3 | 0.2 | |||
| Rvbr (Ω) | 2156 | 1 | 2436 | 5 | 2641 | 4 | 2733 | 8 | |||
| ΔRVBR (Ω) | 0 | 280 | 485 | 577 | |||||||
| aCPE, Q (F) | 2.77 × 10⁻⁵ | 0.03 × 10⁻⁵ | 2.59 × 10⁻⁵ | 0.01 × 10⁻⁵ | 2.65 × 10⁻⁵ | 0.02 × 10⁻⁵ | 2.520 × 10⁻⁵ | 0.009 × 10⁻⁵ | |||
| aCPE, n | 0.84 | 0.00 | 0.85 | 0.00 | 0.85 | 0.00 | 0.86 | 0.00 | |||
Constant phase element (CPE) approximation of the capacitance, C.52 . The phase angle, ϴ, of the impedance response is, ϴ = −(90*n)°, with 0 > n > 1. n = 1 corresponds to ideal capacitor behavior.
At the high frequency limit, f = 40 kHz, the capacitive reactance approaches zero (ZC = (2πfC)− 1 ≈ 0.15 Ω), and the circuit of Figure 5a simplifies to three resistors in parallel:
| [2] |
At f = 40 kHz, RVBR is much lower than at 1 Hz because the small resistor Rsoln is accessed in parallel to RPEDOT-PSS and Rvirus-PEDOT. To a first approximation, the impedance at both of these frequency limits, 1.0 Hz and 40 kHz, is purely resistive but at intermediate frequencies, a significant capacitive component is introduced, producing the characteristic semicircular Nyquist plot that is observed, as seen in Figure 5b.
The values of C, Rsoln, and RVBR (encompassing RPEDOT-virus and RPEDOT-PSS) are obtained by deconvolution of the complex impedance data set. How do RVBR, Rsoln, and C, change in response to the concentration of a target protein? For DJ-1 concentrations from 0 – 100 nM, variations of Rsoln are constant within the error bars for this measurement and are independent of DJ-1 concentration (Table 1). The capacitance, C, approximated as a constant phase element (CPE, ), varies weakly with the DJ-1 concentration (Table 1). RVBR at low frequency, in contrast, is strongly correlated with the DJ-1 concentration and, as already indicated, ΔRVBR, is used to transduce the concentration of a target protein bound by entrained virus particles (Table 1).
Since, as noted above, the VBR signal ΔRVBR is best measured at low frequency, wouldn’t it be simpler to use the DC resistance of the VBR channel to derive signal? In practice, the DC measurement does work, but there are two reasons for measuring the frequency spectrum instead: 1). In DC sensing mode, one does not acquire the high frequency impedance (Eq. 2) that permits deconvolution (and measurement) of the solution resistance from the ΔRVBR signal. 2). The reproducibility of the impedance at low frequency is better than for a DC measurement. That is, the signal-to-noise at low frequencies down to 1 Hz is higher than the noise at DC (data not shown).
III.C. Tuning the VBR signal amplitude using RPEDOT-PSS.
Eq. [1] predicts that at low frequencies, increasing RPEDOT-PSS causes RVBR to converge on RPEDOT-virus (Figure 6a). If ΔRVBR is generated by the virus-PEDOT toplayer, then an increase in RPEDOT-PSS should increase VBR sensitivity. This expectation is confirmed by measurement of ΔRVBR for the protein human serum albumin, HSA, a 66.5 kDa protein that is a marker for renal failure (Figure 6). A plot of ΔRVBR versus RPEDOT-PSS for [HSA] = 100 nM shows that increasing RPEDOT-PSS is from 70 Ω to 380 Ω by reducing thickness of this layer, increases the ΔRVBR from 40 Ω to more than 500 Ω (Figure 6b).
Figure 6.
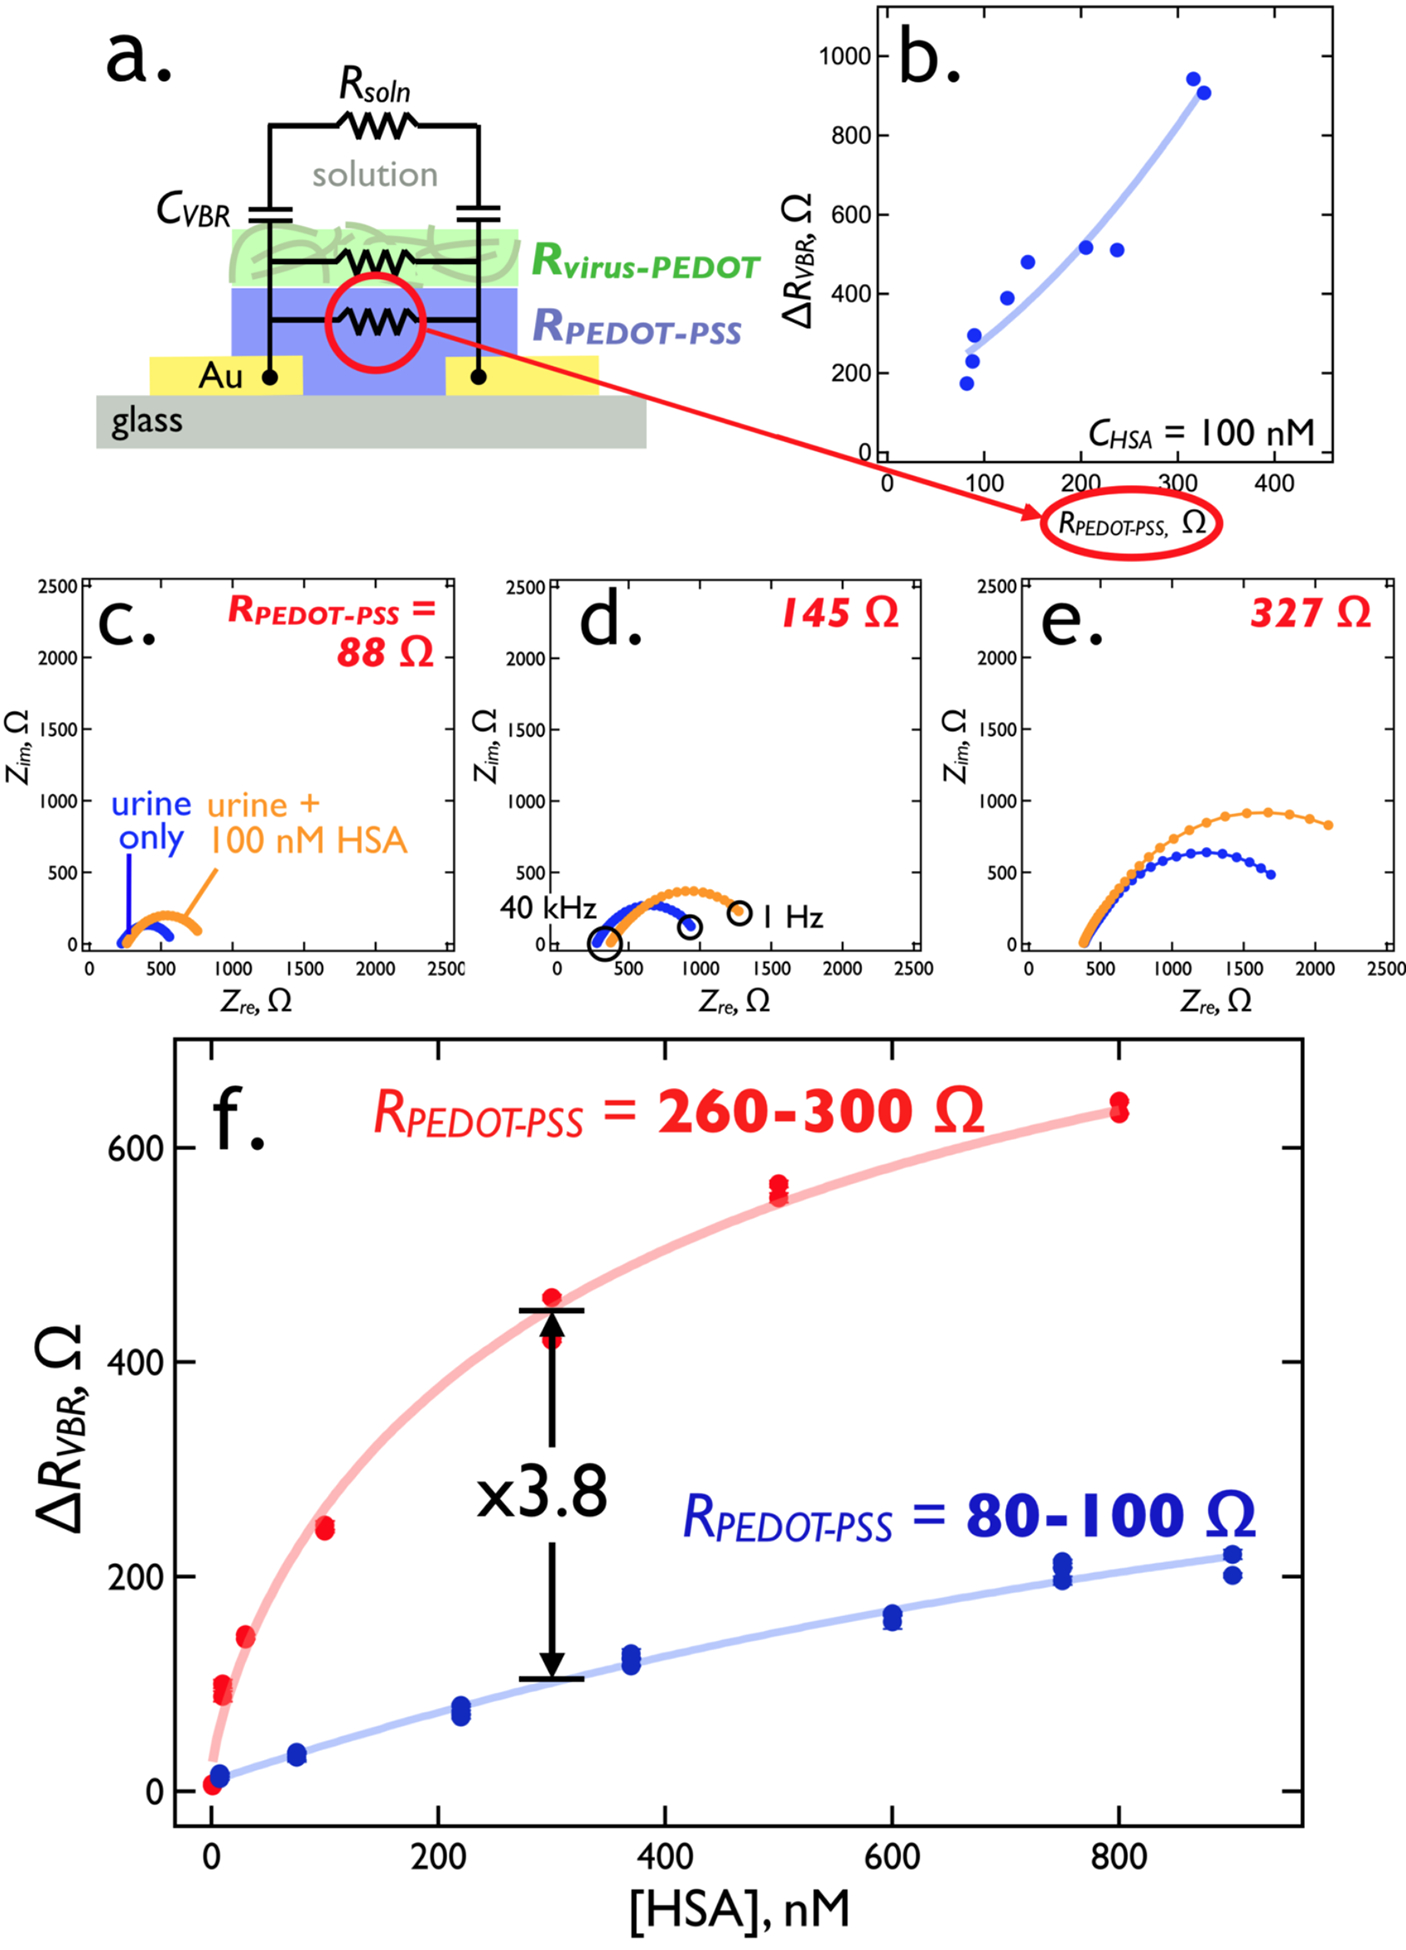
RPEDOT-PSS tuning of the VBR sensitivity for HSA. (a)- The equivalent circuit for the VBR places the electrical impedance of the virus-PEDOT layer, RVBR, in parallel with that of the PEDOT-PSS bottom layer, RPEDOT-PSS, forming a current divider. (b) Increasing RPEDOT-PSS from 80 Ω to 300 Ω, by reducing the PEDOT-PSS layer thickness, forces current, i, through the virus-PEDOT measurement layer, increasing the signal for 100 nM HSA by a factor of 3 to 5 from 200 Ω to more than 900 Ω. (c,d,e) Three Nyquist plots corresponding to three values of the resistor, RPEDOT-PSS, as indicated. In each plot, impedances are plotted in the complex plane from 1 Hz (right) to 40 kHz (left). A shift in the low frequency Zre from synthetic urine only (blue trace) to 100 nM DJ-1 (orange trace) approximates the signal, ΔRVBR. (f) RVBR versus [HSA] calibration plots for a series of 42 VBR sensors (21 in each plot) with RPEDOT-PSS values in the range from 80 to 100 Ω and 260 to 300 Ω. The higher RPEDOT-PSS devices produce 3 to 5 times more signal amplitude across the HSA binding curve.
Nyquist plots for three RPEDOT-PSS values (Figure 6c,d,e) document the increase in sensitivity for three VBRs. It should be noted that RPEDOT-PSS ≈ 300 Ω is a practical upper limit in our experiments. Attempts to further thin the PEDOT-PSS layer to achieve even higher sensitivities resulted in pronounced irreproducibility in both RPEDOT-PSS and measured ΔRVBR values.
Two calibration plots for HSA in PBS buffer solution acquired using VBRs compare the performance of high resistance PEDOT-PSS layers, (RPEDOT-PSS = 260 – 300 Ω) with low resistance PEDOT-PSS layers (RPEDOT-PSS = = 80 – 100 Ω, Figure 6f). The ΔRVBR signal for HSA increases by between 10x (at low concentrations) to 3x (at high concentrations) across the HSA concentration range encompassed by these data.
RPEDOT-PSS tuning of the VBR sensitivity also works for DJ-1 – a bladder cancer marker that is significantly smaller than HSA (20.8 kDa versus 66.5 kDa). Again, a plot of ΔRVBR versus RPEDOT-PSS for a concentration of DJ-1 of 100 nM in synthetic urine shows that increasing RPEDOT-PSS from 75 Ω to 300 Ω increases ΔRVBR from 50 Ω to 550 Ω (Figure 7a). Nyquist plots for three RPEDOT-PSS values (Figure 7b, c, d) document the increase in sensitivity for three VBRs.
Figure 7.

RPEDOT-PSS tuning of the VBR sensitivity for DJ-1. (a) Increasing RPEDOT-PSS from 80 Ω to 300 Ω, by reducing the PEDOT-PSS layer thickness increases the signal for 100 nM DJ-1 by a factor of ≈10 from 50 Ω to 550 Ω. (b,c,d) Three Nyquist plots corresponding to three values of the resistor, RPEDOT-PSS, as indicated. In each plot, impedances are plotted in the complex plane from 1 Hz (right) to 40 kHz (left). A shift in the low frequency Zre from synthetic urine only (blue trace) to 100 nM DJ-1 (green trace) approximates the signal, ΔRVBR.
Looking more carefully at the DJ-1 sensing performance of VBRs with high resistance PEDOT-PSS layers (RPEDOT-PSS ≈ 300 Ω), Nyquist plots (Figure 8a, b, c) show the accessible DJ-1 dynamic range extends from a limit-of-detection of 10 pM to 300 nM – a range of more than four orders of magnitude (see values of all circuit elements for these three VBR sensors in Table S1). A plot of ΔRVBR versus DJ-1 concentration across this same range for a total of 35 VBR sensors (Figure 8d) conforms to the Hill Equation:30
| [3] |
A best fit of equation [3] to these data yields the following parameter values: ΔRVBR,lim = 950 ± 640 Ω, DRVBR,0 = 50 ± 140 Ω, KD = 39 ± 170 nM, h = 0.3 ± 0.2, and R2 = 0.94. It should be noted that these data encompass measurements of DJ-1 in synthetic urine (21 sensors) and in pooled human urine (14 sensors). Each of these VBRs was used for a single DJ-1 concentration data point in Figure 8d. The measured value of h indicates strong negative cooperativity, meaning that the microscopic dissociation constant, KD, is increased (the affinity interaction is reduced) as the fraction of binding sites occupied by the target protein increases.30 This has the effect of stretching the binding curve across a wider range of DJ-1 concentration range – exceeding four orders of magnitude in the present case (Figure 8d).
Figure 8.
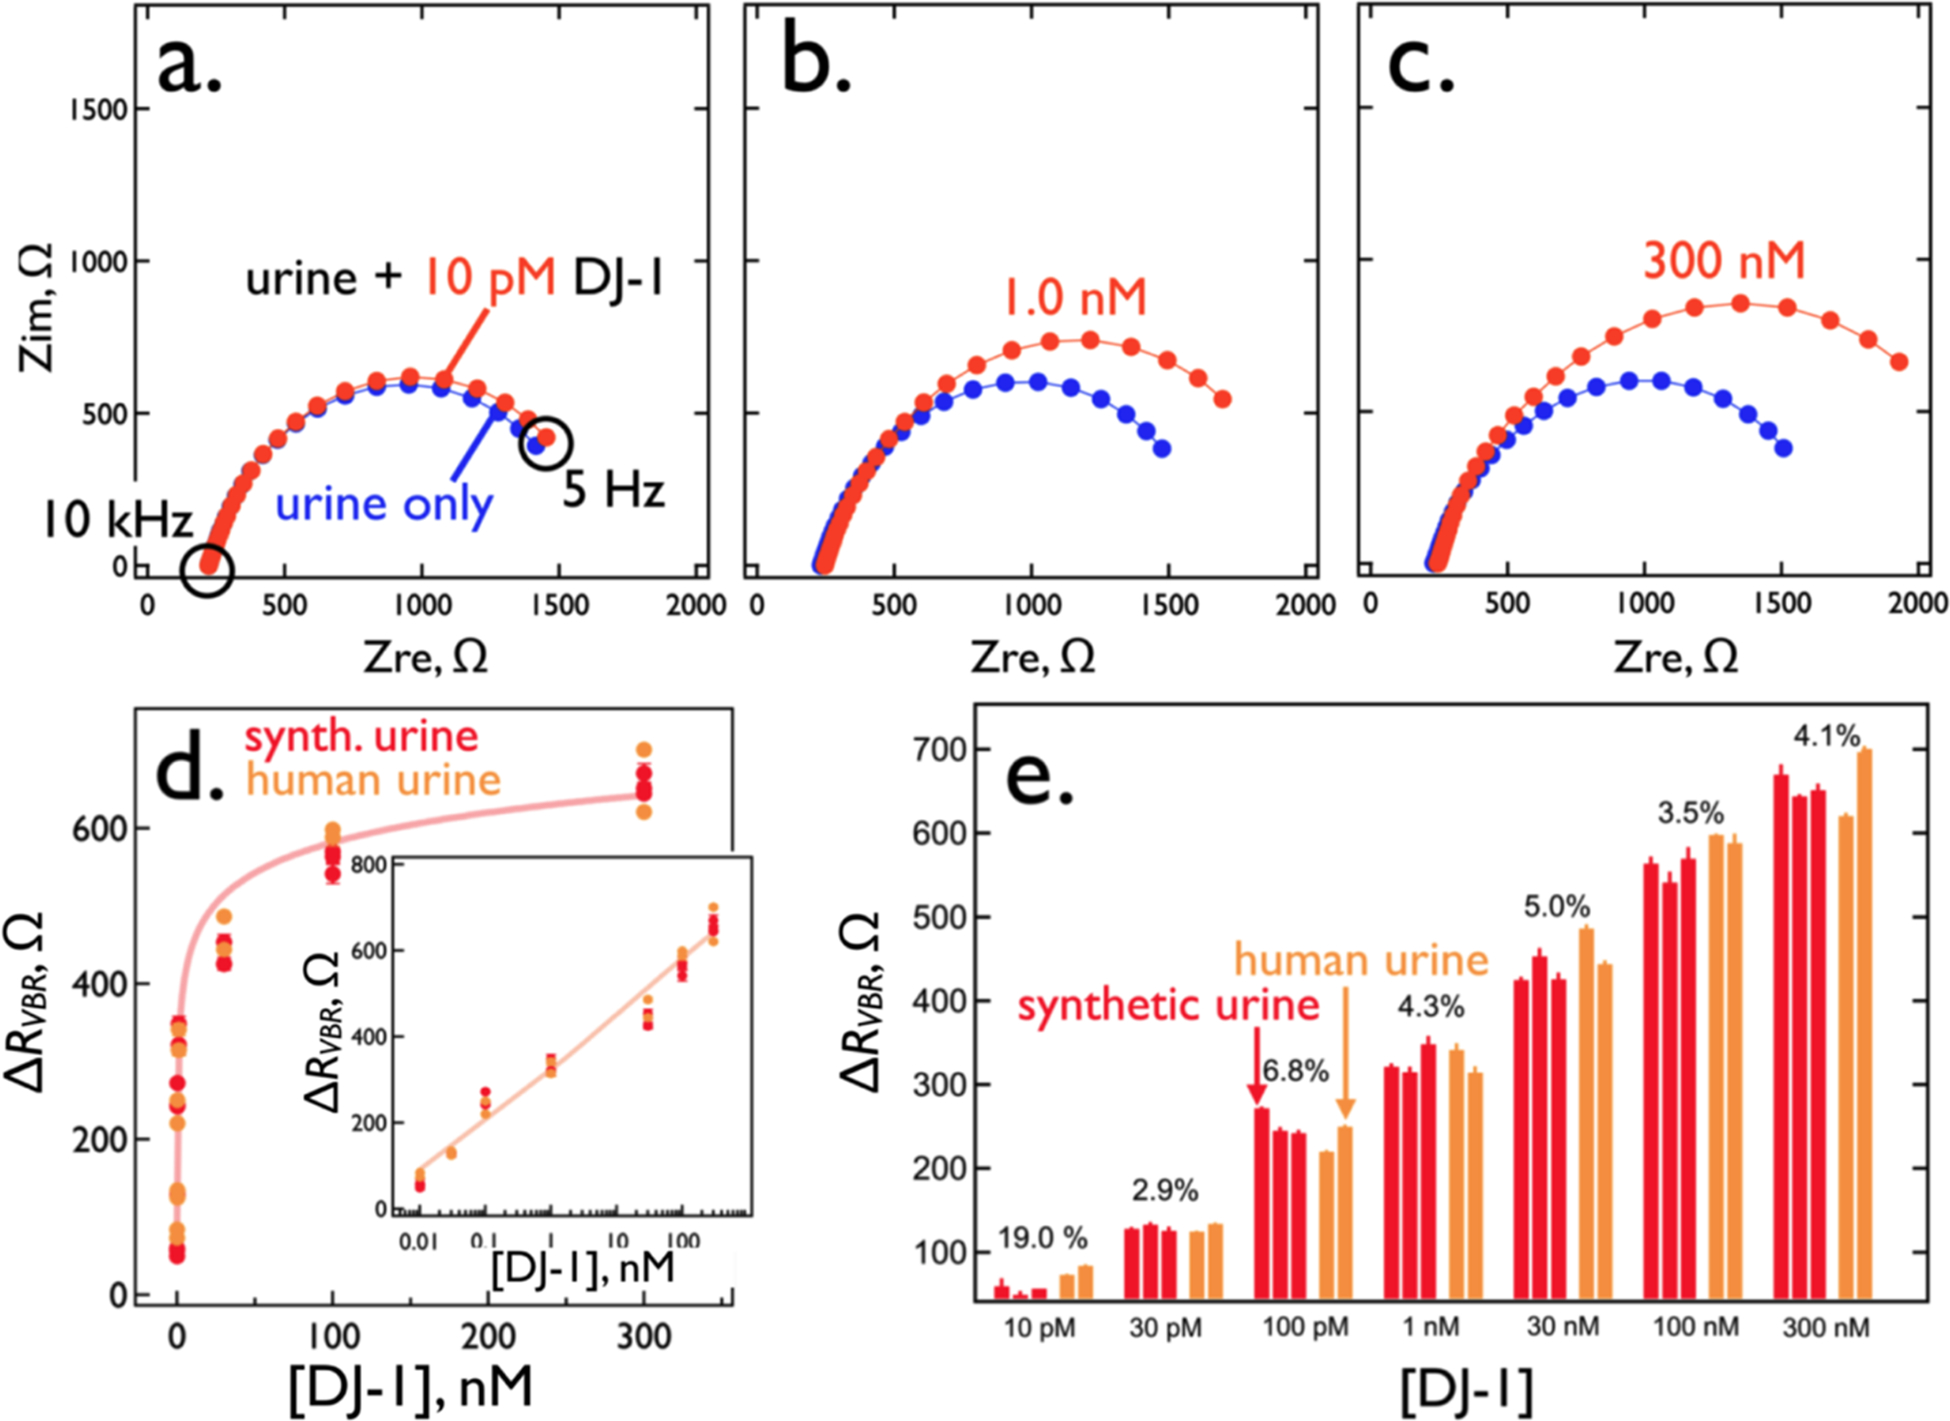
DJ-1 sensing performance using VBRs with RPEDOT-PSS = 280 to 300 Ω. (a,b,c) Nyquist plots for three DJ-1 concentrations of (a) 10 pM, (b) 1 nM, and (c) 300 nM. Also shown (blue traces) are background Nyquist responses in synthetic urine only. (d) A calibration curve for the detection of DJ-1 using the RVBR signal constructed using 21 individual measurements from the same number of VBRs, at seven concentrations. Values of KD and h (the Hill exponent) obtained from a best fit of the experimental data to equation (2), are indicated. (e) Bar plot for ΔRVBR measurements acquired from 21 electrodes, illustrating the sensor-to-sensor reproducibility of these data. CoVs for these data, shown, are in the 2 to 8% range across four orders of magnitude in DJ-1 concentration. The values of each of the circuit elements is indicated in Table S1.
In principle, the absence of a gate and an applied gate potential referenced to an external reference electrode, leaves open the possibility of potential drift of the channel that could drive doping and de-doping reactions of the PEDOT sensing layers, causing baseline drift of the sensor and degrading reproducibility of the concentration measurements. But the data of Figure 8e shows that this “channel conductivity drift” is inconsequential on the time scale of 1–2 minutes required for carrying out VBR measurements of concentration. To this end, we made measurements of DJ-1 conducted in triplicate (for synthetic urine) and duplicate (for human urine) document the reproducibility of VBRs (Figure 8e). Sensor-to-sensor coefficients-of-variation (CoV) vary from 2.9% (30 pM), to 4.1% (300 nM), extraordinarily low values. As expected, at the 10 pM LOD, a higher CoV of 19% is obtained. It should be noted that VBRs are effectively single use devices, because the off-rate for bound DJ-1 after a single exposure is several hours (data not shown). This means that individual VBRs cannot be calibrated; every VBR sensor must respond to the same calibration curve placing a premium on the sensor-to-sensor reproducibility.
Nonspecific adsorption at the unmodified virus-PEDOT surface of a VBR is negligible, contributing to the simplicity of VBR fabrication (Figure 2b). Blocking, often accomplished by pre-equilibrating a bioaffinity layer with solutions of bovine serum albumin (BSA), casein,31 ,32 ,33 or poly (ethylene glycol),34 prior to exposure to a target protein, is not required. Three sets of negative controls (Figure 9a) for VBRs containing no phage, VBRs prepared using Stop-4 phage (which has no displayed peptides at its surface), and VBRs prepared using DJ-1 binding phage in the presence of Interleukin 6 or IL-6 (a protein of similar size, 20.9 kDa, and pI, 6.2 versus 6.7 for DJ-1) - either produce no measurable signal or a small “negative” signal, corresponding to a negative value of ΔRVBR (Figure 9a).
Figure 9.
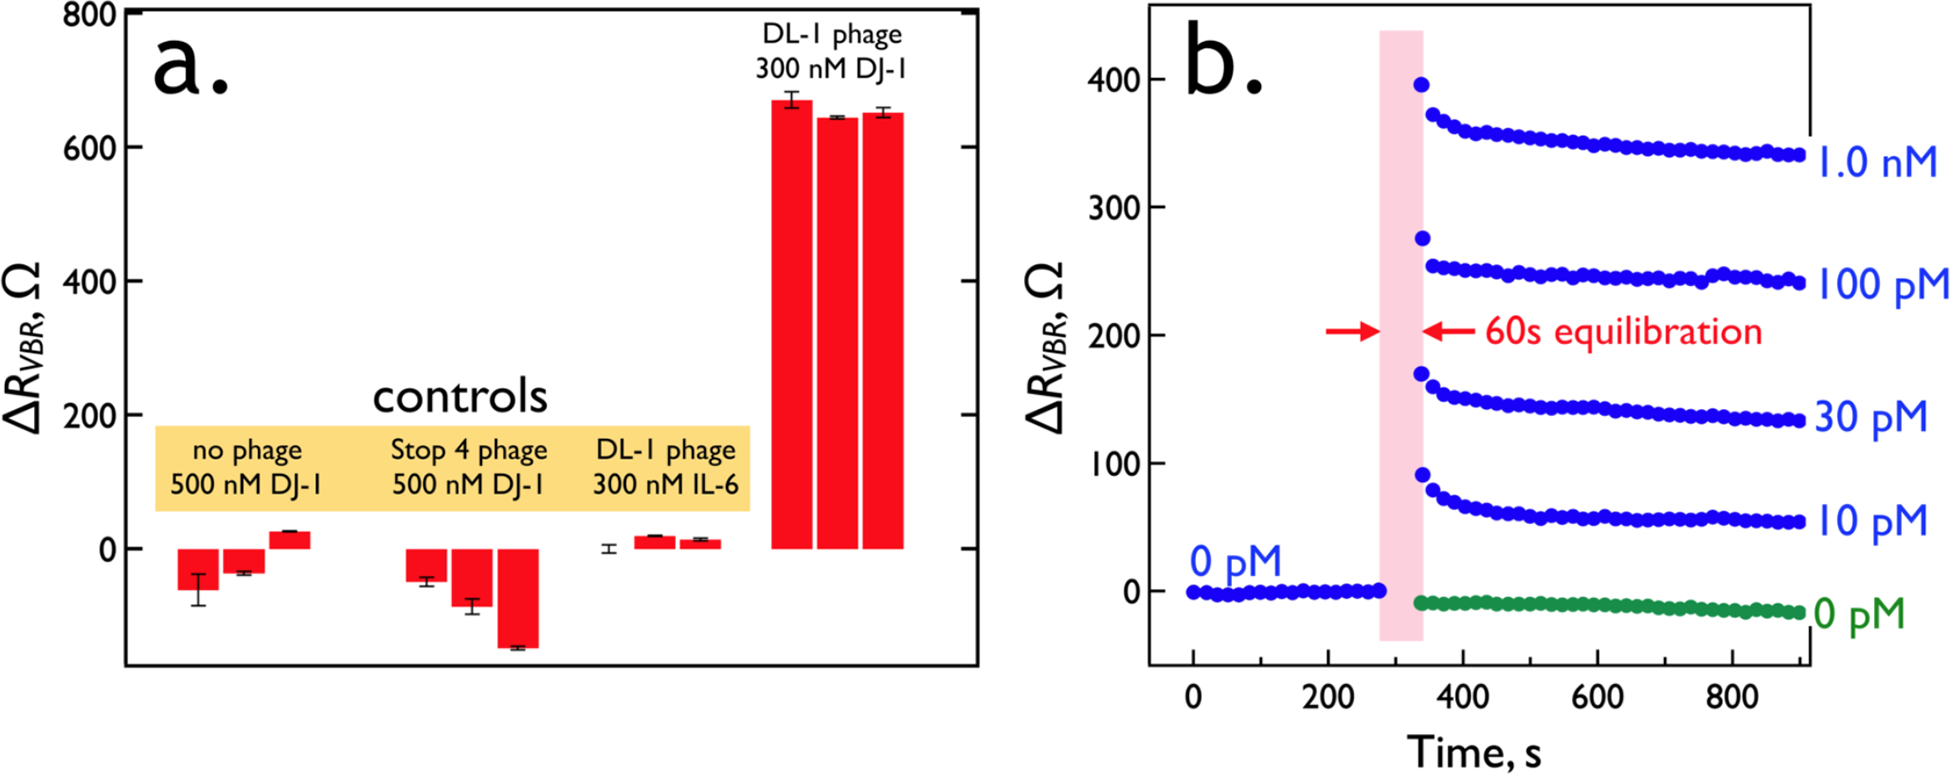
VBR specificity and speed. (a) Three control experiments: At left is the response of three VBRs prepared with no phage exposed to 500 nM DJ-1. To the right of this is the response of three VBRs prepared with Stop-4 phage that has no displayed peptides on its surface. Finally, at right are shown the results of three VBRs containing DL1 phage (selected for the binding to DJ-1) upon exposure to IL-6, a protein of similar MW (20.9 kDa) and pI (6.2) to DJ-1 (20.7 kDa and pI of 6.7, respectively). (b) Real-time VBR sensing data. Responses for five VBR sensors are shown for DJ-1 exposures of 0 pM (green trace), 10 pM, 30 pM, 100 pM, and 1.0 nM. These traces were obtained by first stabilizing sensors in synthetic urine for 9 min, measuring a RVBR baseline at 0.10 Hz, and then interrupting for 1.0 min while the synthetic urine was replaced with synthetic urine supplemented with DJ-1 at the specified concentration, after which ΔRVBR signal was acquired.
Analysis speed and simplicity of operation are two requirements for biosensors that are used either at the point-of-care (PoC) or outside a care facility, at a point-of-need (PoN).35,36 The VBR provides for detection of DJ-1 across a range of concentrations within one minute in a dip-and-read modality (Figure 9b). Thus, the VBR is well-adapted to PoC and PoN applications.
The frequency-dependent signal-to-noise ratio (S/N) for the VBR (Figure 10a) increases with decreasing frequency from 40 kHz to 1.0 Hz. In this measurement, noise is defined as the standard deviation of repetitive measurements (N = 3) for ΔRVBR (the signal) at a defined concentration of target protein. At a DJ-1 concentration of 300 nM, S/N peaks at 150 at 1.0 Hz and decreases to 60 at 100 pM and 4 at 10 pM, the limit-of-detection. S/N ratios at 40 kHz, in contrast, are in the range from 2 to 14 for this range of DJ-1 concentration. Consistent with the equivalent circuit of Figure 5a, increasing frequency reduces the impedance of the virus-PEDOT solution capacitance, ZC, opening a low impedance path through the analyte solution, Rsoln, and by-passing the signal-generating current path of the channel. It should be noted that the S/N versus frequency data sets (Figure 10a) are themselves noisy. Repeated measurements of these data shows that the sharp peaks and valleys seen in these traces are not reproduced. This means that there are temporal variations in the noise present in the VBR circuit. However, the trend of increasing S/N with decreasing frequency remains prominent in these data.
Figure 10.
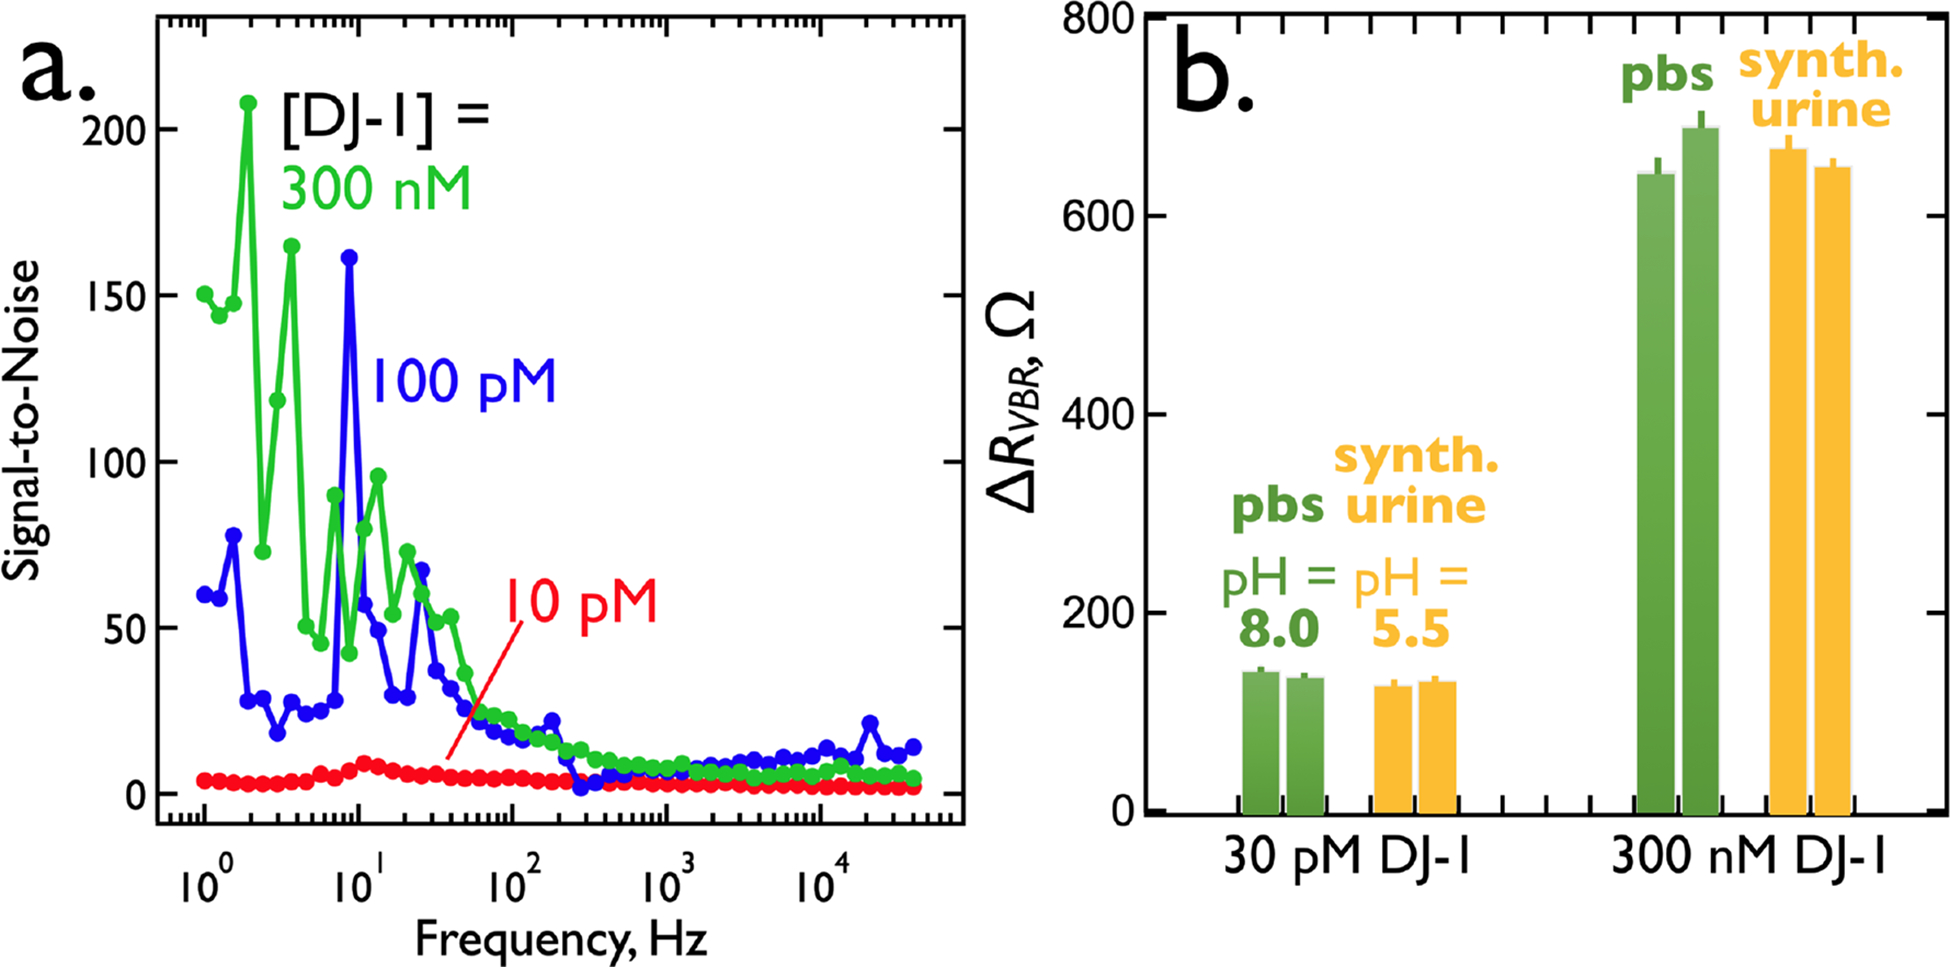
(a) Signal-to-noise (S/N) versus frequency for the detection of DJ-1. Shown are three plots of S/N versus frequency measured for three VBRs immersed in three DJ-1-spiked synthetic urine solutions containing DJ-1 at the indicated concentrations. Noise is calculated as the standard deviation of three replicate measurements at each frequency. S/N consistently increases from high to low frequencies. (b) Comparison of ΔRVBR for the detection of DJ-1 in two electrolytes: synthetic urine (pH = 5.5) and PBS buffer (pH = 8.0). The charge state of DJ-1 (pI = 6.7) inverts across this pH difference, and is negatively charged at pH = 8.0 and positively charged at pH = 5.5. However, ΔRVBR at two different concentrations are the same, despite changes in pH, within the reproducibility of these measurements.
III.D. A proposed mechanism for VBR signal generation.
The mechanism by which the VBR produces an impedance increase in the presence of target protein is of interest. This mechanism must account for three experimental observations: 1). ΔRVBR is positive. In particular, the sign of the protein charge, positive or negative, has no influence on the signal. For example, DJ-1 (pI = 6.7) can be measured both at pH = 5.5 and at 8.0, corresponding to a positively charged protein, and a negatively charged protein, respectively (Figure 10b). ΔRVBR signal is unaffected by this charge inversion. 2). VBR signal is insensitive to the salt concentration of the test solution. Previously,4 we demonstrated this for the detection of 75 nM HSA in salt solutions ranging from 134 mM to 670 mM NaCl where no significant change in HSA signal was observed. Collectively, (1) and (2) imply that a charge gating mechanism, responsible for signal in field-effect transistors,37 cannot be operating in VBRs. 3) The signal-to-noise ratio is strongly frequency dependent - S/N is high at low frequency (≈ 1 Hz) and near zero at high frequency (≈ 40 kHz) where it is also independent of the concentration of a target protein. The implication is that the signal generating process does not require the transmission of AC signal through electrolyte. This includes electrolyte that is present in the voids within the porous virus-PEDOT signal-generating layer. Thus, RVBR decreases by just 24 Ω or 4% (against a background of 600 Ω) in protein-free aqueous NaCl as CNaCl is increased by a factor of 50 from 0.02 M to 1.00 M (Figure S2).
A simple mechanism that may account for these observations is shown schematically in Figure 11. Here, just the virus-PEDOT layer is illustrated. The virus-PEDOT layer itself is semi-crystalline, containing crystalline PEDOT-only domains surrounded by disordered domains that contain disordered PEDOT chains and, likely, most of the virus particles (Figure 11a). Electrical conduction within this layer occurs by two processes: i) intrachain charge transport (via bipolarons) and, ii) interchain electron hopping (Figure 11a). Interchain hopping, in particular, can be disrupted by the partitioning of protein into this layer, promoted by the immunoaffinity partitioning of target protein by virus particles entrained in the virus-PEDOT film.38
Figure 11.
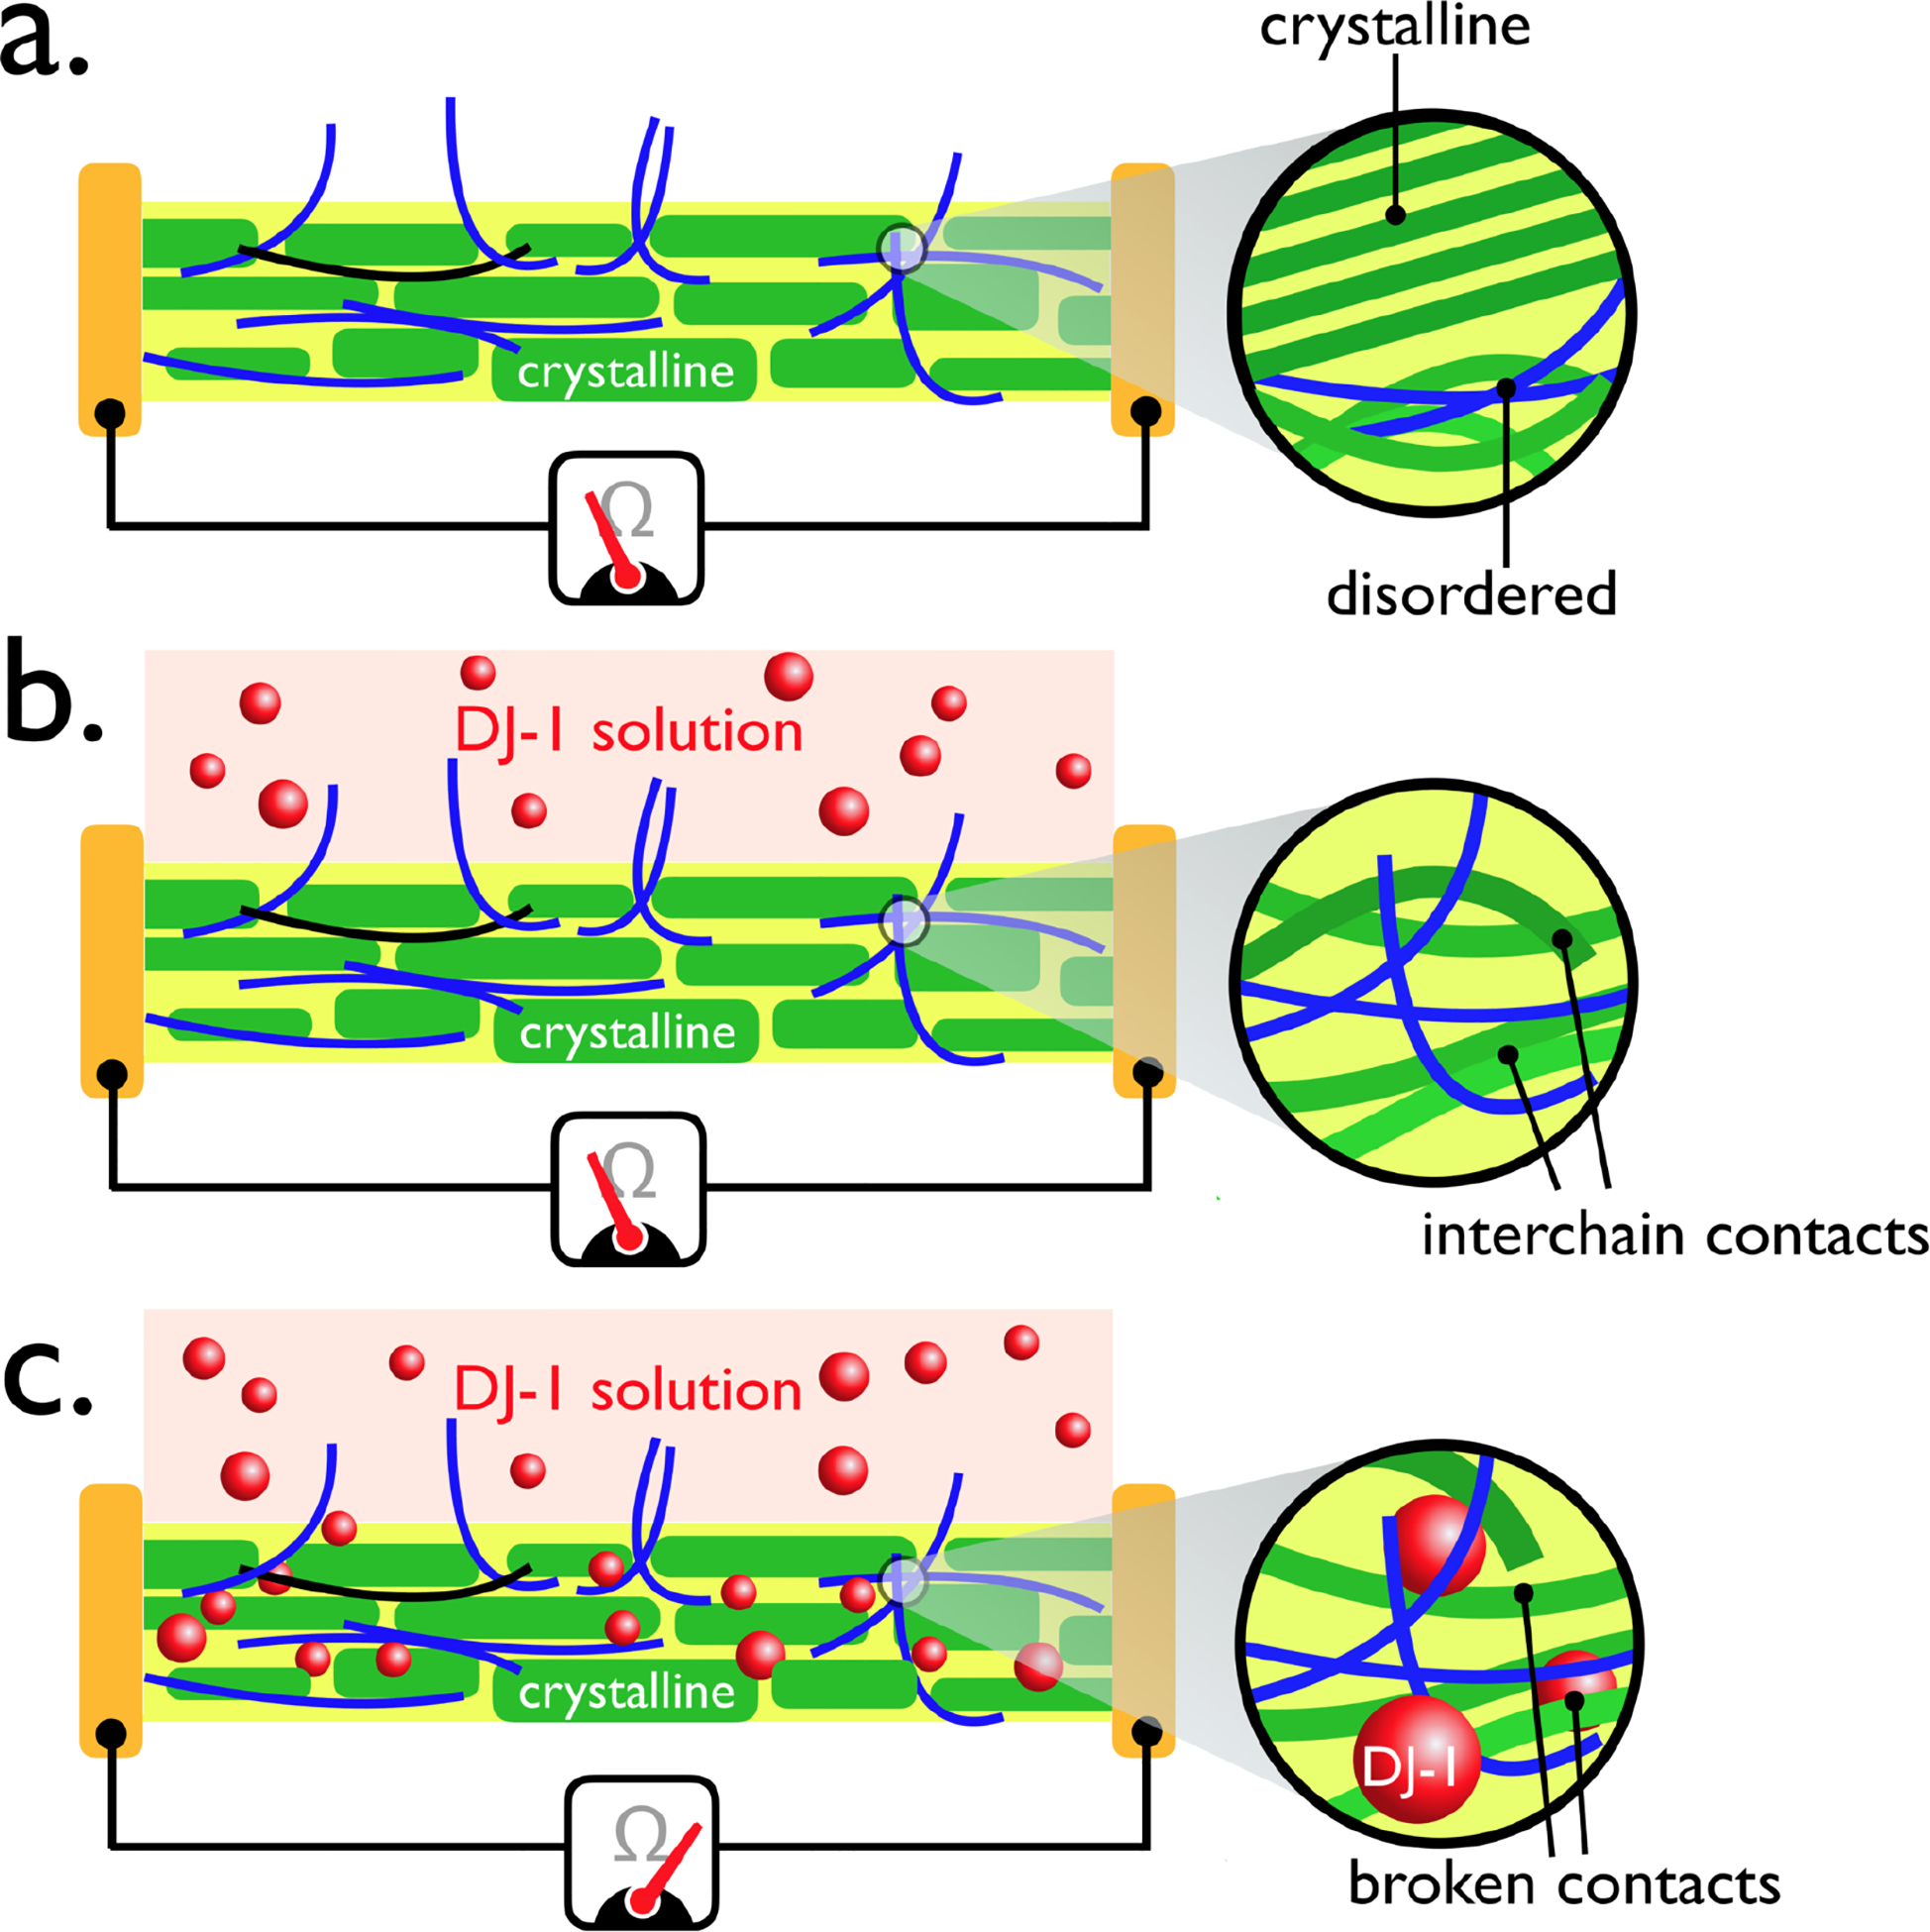
Schematic representation of a hypothesized signal transduction mechanism for the VBR. (a) The virus-PEDOT layer shown here consists of semi-crystalline PEDOT with virus particles that are concentrated within disordered regions of the PEDOT layer, (b) When exposed to the DJ-1 protein solution, ΔRVBR is initially zero, because an induction time is associated with the rate-limiting diffusion of the protein into the virus-PEDOT layer. (c) Permeation of the virus-PEDOT layer by DJ-1 is associated with an increase in its resistance as the insulating protein interferes with conduction pathways within this layer.
This mechanism is analogous to that proposed for chemiresistive gas sensors that exploit a carbon/polymer composite chemiresistor.39,40,41,42,43 In these systems, permeation of a carbon/polymer (insulating) composite by a molecule in the vapor phase causes an increase in the volume of the composite and a decrease in the volume fraction of the conducting carbon phase, leading to a reduction in the conductivity of the composite, a process that is described by percolation theory:44,45
| [4] |
Where σ0 is the conductivity of the composite in the absence of permeating vapor species, σ is the conductivity of the composite after exposure to this vapor, V is the volume fraction of the conductive component of the composite, Vc is the volume fraction of the conductive phase at the percolation threshold, and α is a scaling exponent that depends only on the dimensionality of the percolation process (2 dimensional or 3 dimensional). Eq (4) is intended to model the conductivity at values of V near the percolation threshold, but more generally, it provides a signal transduction mechanism for chemiresistors in which the resistor is comprised of a nonconductive and a conductive component and for which permeation of analyte(s) induces swelling of this system.
The mechanism depicted (Figure 11) requires that target protein diffuses into the virus-PEDOT layer. Does this occur on the one-minute time-scale of signal generation, and if so, what mass loading of protein is obtained in this layer during this brief period? These questions can be addressed using quartz crystal microbalance (QCM) gravimetry. In this measurement, a two-layer PEDOT-PSS + virus-PEDOT bioaffinity layer is prepared on a QCM crystal coated with a thin photoresist layer. Exactly the same processes used for VBR fabrication (Figure 12a), involving the PVD deposition of gold electrodes, spin-coating of the PEDOT-PSS layer, and electrodeposition of the virus-PEDOT layer, are used for the preparation of these layers, for these experiments, the gold electrodes are not used to make electrical measurements.
Figure 12.
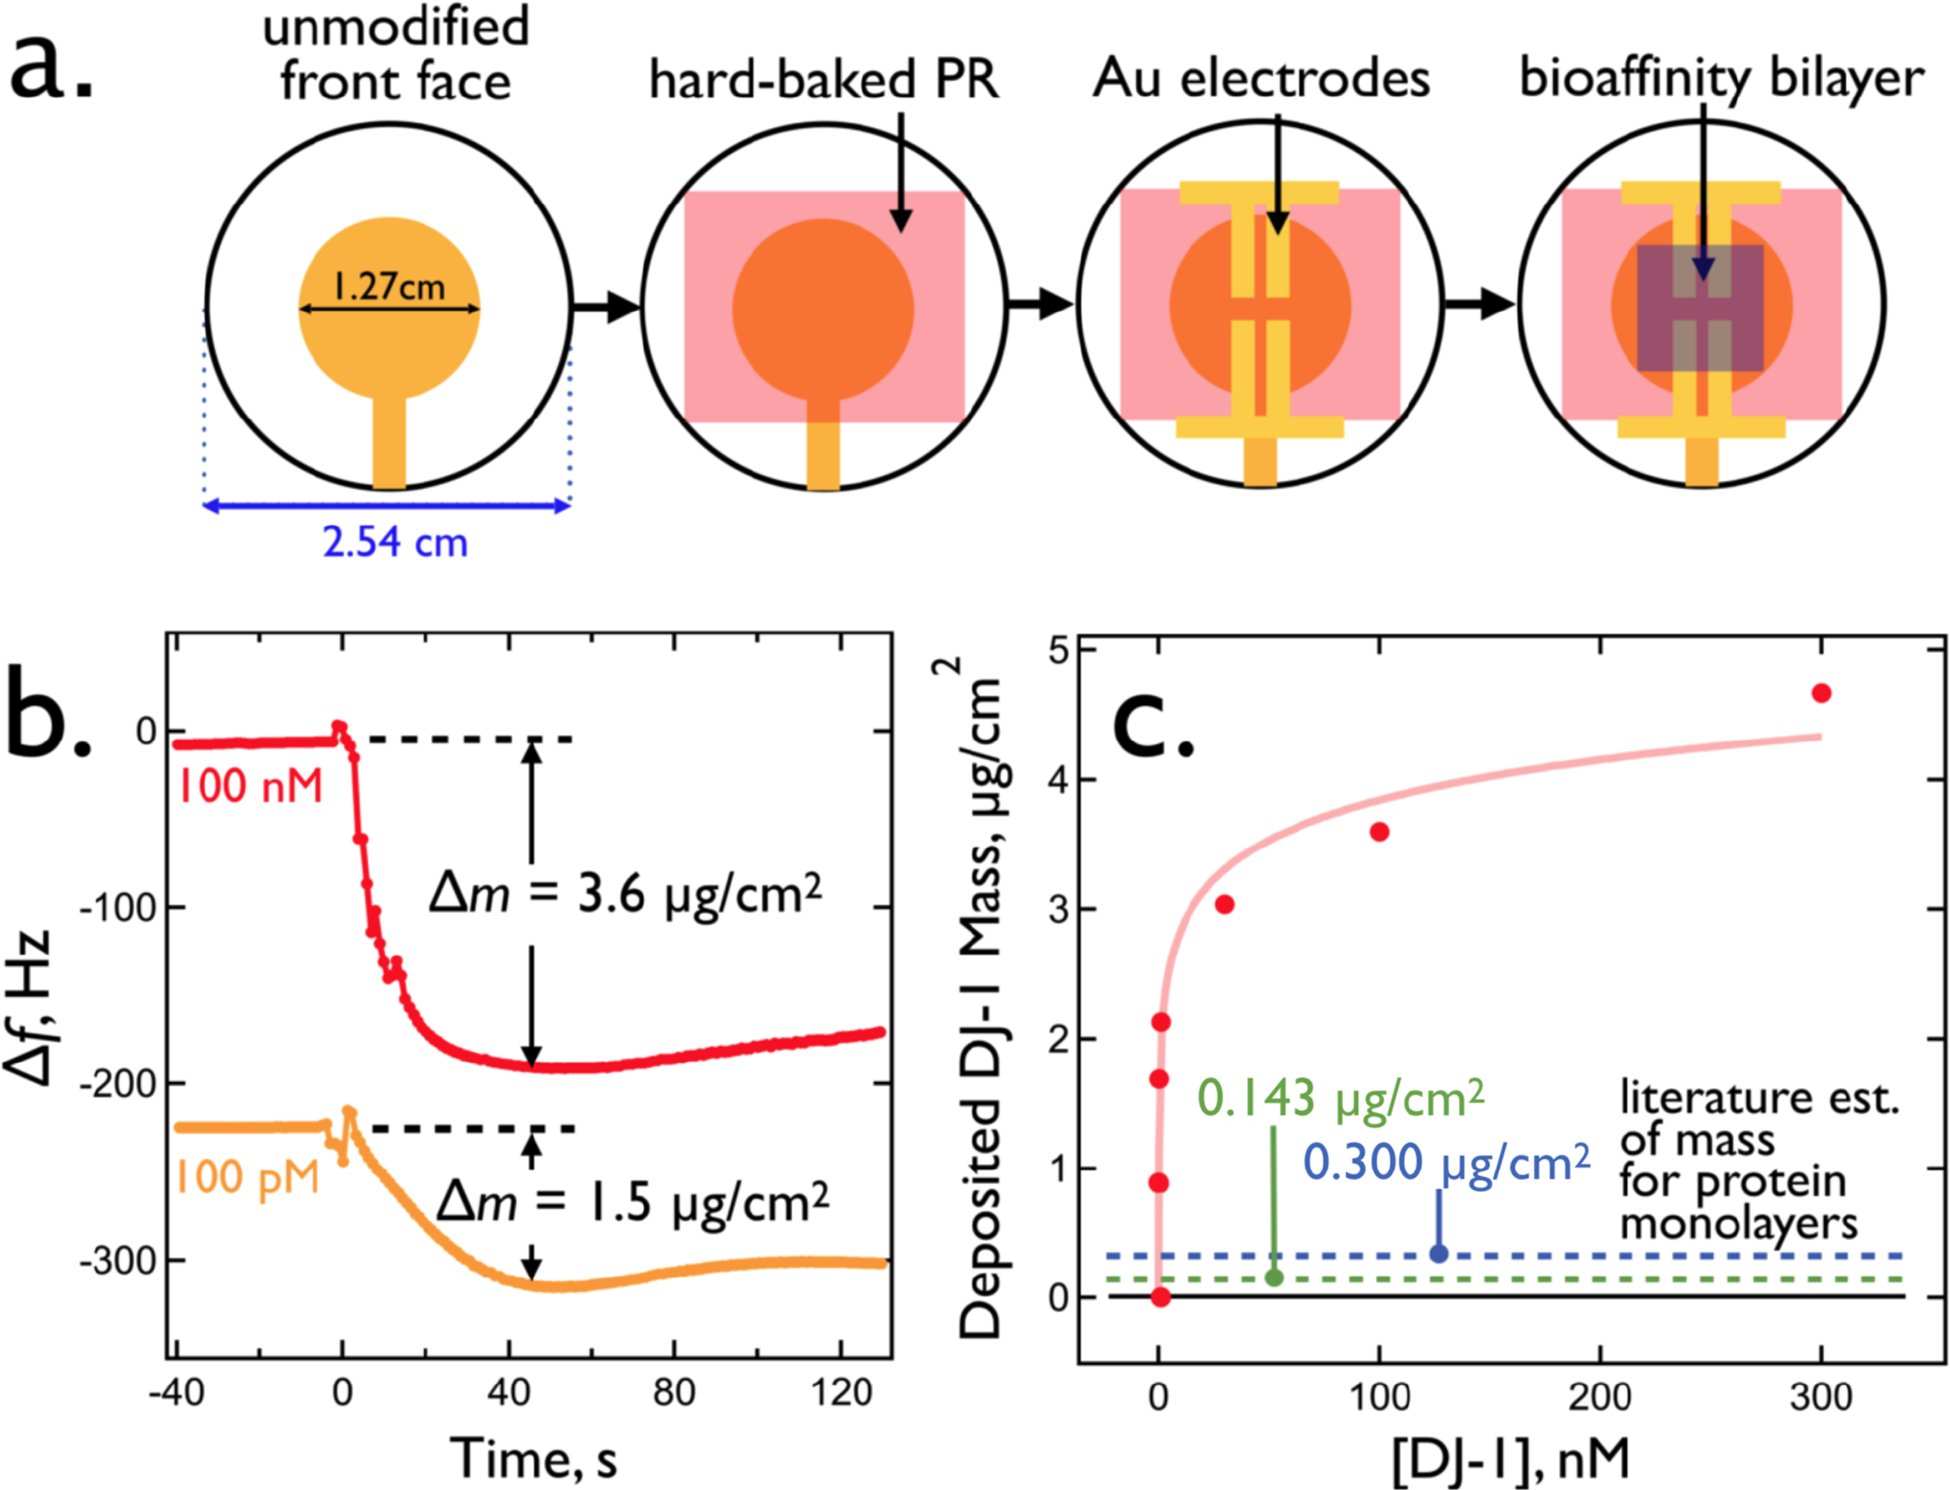
Measurement of DJ-1 mass loading for VBR bioaffinity layers using quartz crystal microbalance (QCM) gravimetry. (a) Four step fabrication of a complete VBR bioaffinity layer on a commercial QCM crystal. (b) Change in frequency, Δf, versus time for the exposure of two VBRs to solutions of DJ-1 at 100 pM and 100 nM. The measured DJ-1 mass loading is indicated and traces are shifted along the Δf axis for clarity. (c) The concentration of DJ-1 versus its measured mass loading. This isotherm was acquired in PBS buffer solution.
Upon exposure to DJ-1 solutions, the resonant frequency, fR, decreases within seconds and stabilizes within ≈40–60 s (Figure 12b) Using the Sauerbrey Equation46 the observed frequency change, Δf, can be translated into a mass change, Δm:
| [5] |
where fR is the resonant frequency of the quartz crystal oscillator in air, ρq, is the density of this crystal, d is its thickness, and A is the area of the gold electrodes deposited onto this crystal.
A plot of Δm versus DJ-1 concentration shows saturation behavior resembling the VBR calibration plot for DJ-1 (Figure 8d). The mass loading saturates at ≈ 4 μg/cm2 which corresponds to more than 1.0 monolayer of DJ-1 at the surface of the virus-PEDOT layer - even if this layer has significant roughness. For purposes of comparison, the mass of a hydrated protein monolayers has been measured using QCM for several proteins including RNAase (13.7 kDa, 300 ng/cm2 on silica), bovine serum albumen (66.5 kDa, 150 ng/cm2 on silica)47, and human serum albumin (66.5 kDa, 230 ng/cm2 on oxidized gold)48 An estimate of the mass of a closest packed DJ-1 monolayer can also be derived from the dimensions of this protein previously reported using single crystal x-ray diffraction49. The refined crystallographic data includes 323 structural water molecules per DJ-1 protein, which should be considered a lower bound to the actual water content of this system. The mass of this monolayer is predicted to be 146 ng/cm2.
The low end (146 ng/cm2) and high end of these estimates (300 ng/cm2) are indicated by dashed lines in Figure 12c. Based upon these numbers, the ≈4 μg/cm2 plateau measured for DJ-1 corresponds to 13–27 equivalent protein monolayers. These data are consistent with permeation of DJ-1 into the virus-PEDOT layer, and perhaps the PEDOT-PSS layer as well, on the one-minute time scale as required by the mechanism depicted in Figure 11.
Finally, it is useful to confirm that the diffusion coefficient, DDJ-1, required for DJ-1 permeation by diffusion in one minute is physically realistic. DDJ-1 can be estimated using the equation:50 DDJ-1 = T2/2t where T is the total thickness of the two-layer channel (≈ 150 – 170 nm) and t is the time required for diffusive permeation of DJ-1 (≈60 s) which we estimate as the time required for signal generation. The range of calculated DDJ-1 values is (1.9 – 2.4) × 10−12 cm2/s, which is approximately 5–6 orders of magnitude slower than the diffusion coefficient for proteins of this size (D ≈ 10−7 – 10−6 cm2/s)51 in aqueous electrolyte solutions, qualitatively as expected. Potentially, the estimates of T, derived from SEM data (Figure 3), could be too low because these values pertain to dried films. However, doubling the estimate of T (≈ 300 – 340 nm) produces DDJ-1 values of (7.5 – 9.6) × 10−12 cm2/s within an order of magnitude of the dried values.
To test the signal transduction mechanism for VBRs proposed here, simultaneous measurements of the electrical impedance and direct QCM measurements of the mass loading of protein, are required for comparison with the predictions of Eq. (4). We expect to carry out these measurements soon.
III. SUMMARY
The VBR is a biosensor that exploits direct electrical communication with virus particles to measure the concentration of protein biomarkers for cancer and disease. These virus particles, which are engineered to recognize and bind a target protein of interest, are entrained within an electrodeposited virus-PEDOT film. The electrical impedance of this film directly produces the signal required for protein quantitation, eliminating the need for any additional amplification. In addition, no reagents such as redox couples are required for these measurements.
The conductive polymer bilayer comprising the VBR channel can be engineered to adjust its sensitivity. In particular, a reduction in the thickness of the PEDOT-PSS bottom layer from 70 nm to 48 nm significantly increases the resistance of this layer, from ≈80 Ω to ≈300 Ω increasing the VBR signal for HSA (66.5 kDa) by a factor of 3x to 10x. Applying this strategy to the detection of a smaller protein, DJ-1 (20.8 kDa) enables the measurement of this bladder cancer marker at concentrations down to 10 pM using a measurement time of 1.0 min. in a dip-and-read modality. The extreme simplicity of the VBR allows for its fabrication in three steps, contributing to excellent sensor-to-sensor reproducibility characterized by CoVs below 7% down to 30 pM for DJ-1, across the entire DJ-1 binding curve spanning four orders of magnitude in concentration.
Direct QCM measurement of the mass of the bioaffinity bilayer demonstrates that the equivalent of multiple (>10) monolayers of DJ-1 protein are able to diffuse into this layer from solution within one minute, a process that coincides temporally with the generation of the VBR impedance signal. The resulting QCM binding curve for DJ-1 resembles the binding curve measured by the VBR for this protein. Based upon this observation as well as other evidence, a simple model is proposed for signal transduction involving the dilution of the PEDOT conductor by insulating protein molecules resulting in an increased resistance for this layer, a mechanism analogous to that operating in carbon/polymer chemiresistor gas sensors.
Supplementary Material
ACKNOWLEDGEMENTS
R.M.P. gratefully acknowledges the financial support of this work by the National Science Foundation, through contract CBET-1803314. R.M.P. and G.A.W. both gratefully acknowledge support from the National Cancer Institute of the NIH (1R33CA206955-01), PhageTech Inc (PHAGE-203015), and the Chao Family Comprehensive Cancer Center, UC Irvine. FE-SEM data were acquired using the instrumentation of the LEXI (lexi.eng.uci.edu) and IMRI (ps.uci.edu/imri/) facilities at UCI. We thank the healthy urine donors who consented to have their urine used in this study through UCI clinical protocol IRB HS# 2014-1758.
Footnotes
CONFLICT OF INTEREST DISCLOSURE
R.M.P. and G.A.W. have a financial interest in a company, PhageTech Inc., that is commercializing the technologies described here. J.S.B., M.T., and S.V.S. are employees of PhageTech Inc., and also have a financial interest in the company. The terms of this arrangement have been reviewed and approved by the University of California, Irvine in accordance with its conflict of interest policies.
Supporting Information
Materials and Fabrication of VBR; Process windows compliance assessment of VBRs; Influence of CNaCl on VBR response in the absence of protein; VBR circuit elemental values corresponding to the Nyquist plots Figure 8a–c; Protein expression and selection of DJ-1 binders; Site-directed mutagenesis of DL1; Phage propagation and purification procedures.
References Cited:
- (1).Di Meo A; Bartlett J; Cheng Y; Pasic MD; Yousef GM Liquid Biopsy: A Step Forward towards Precision Medicine in Urologic Malignancies. Molecular Cancer. 2017. 10.1186/s12943-017-0644-5. [DOI] [PMC free article] [PubMed] [Google Scholar]
- (2).Kumar P; Nandi S; Tan TZ; Ler SG; Chia KS; Lim W-Y; Bütow Z; Vordos D; De laTaille A; Al-Haddawi M; et al. Highly Sensitive and Specific Novel Biomarkers for the Diagnosis of Transitional Bladder Carcinoma. Oncotarget 2015, 6 (15). 10.18632/oncotarget.3841. [DOI] [PMC free article] [PubMed] [Google Scholar]
- (3).Soukup V; Capoun O; Pesl M; Vavrova L; Sobotka R; Levova K; Hanus T; Zima T; Kalousova M The Significance of Calprotectin, CD147, APOA4 and DJ-1 in Non-Invasive Detection of Urinary Bladder Carcinoma. Neoplasma 2019, 66 (06), 1019–1023. 10.4149/neo_2019_190124N74. [DOI] [PubMed] [Google Scholar]
- (4).Bhasin A; Ogata AF; Briggs JS; Tam PY; Tan MX; Weiss GA; Penner RM The Virus Bioresistor: Wiring Virus Particles for the Direct, Label-Free Detection of Target Proteins. Nano Lett 2018, 18 (6), 3623–3629. 10.1021/acs.nanolett.8b00723. [DOI] [PMC free article] [PubMed] [Google Scholar]
- (5).Ku JY; Lee CH; Lee K; Kim KH; Baek SR; Park JH; Lee JZ; Park HJ; Han SH; Jeong IY; et al. Highly Sensitive and Specific Novel Biomarkers for the Diagnosis of Transitional Bladder Carcinoma. Eur. Urol. Suppl 2017, 16 (3), e1450–e1453. 10.1016/S1569-9056(17)30884-9. [DOI] [Google Scholar]
- (6).D’Costa JJ; Goldsmith JC; Wilson JS; Bryan RT; Ward DG A Systematic Review of the Diagnostic and Prognostic Value of Urinary Protein Biomarkers in Urothelial Bladder Cancer. Bl. Cancer 2016, 2 (3), 301–317. 10.3233/BLC-160054. [DOI] [PMC free article] [PubMed] [Google Scholar]
- (7).Yang L-MC; Tam PY; Murray BJ; McIntire TM; Overstreet CM; Weiss GA; Penner RM Virus Electrodes for Universal Biodetection. Anal. Chem 2006, 78 (10), 3265–3270. 10.1021/ac052287u. [DOI] [PubMed] [Google Scholar]
- (8).Yang L-MC; Diaz JE; McIntire TM; Weiss GA; Penner RM Covalent Virus Layer for Mass-Based Biosensing. Anal. Chem 2008, 80 (4), 933–943. 10.1021/ac071470f. [DOI] [PubMed] [Google Scholar]
- (9).Donavan KC; Arter JA; Pilolli R; Cioffi N; Weiss GA; Penner RM Virus–Poly(3,4-Ethylenedioxythiophene) Composite Films for Impedance-Based Biosensing. Anal. Chem 2011, 83 (7), 2420–2424. 10.1021/ac2000835. [DOI] [PMC free article] [PubMed] [Google Scholar]
- (10).Arter JA; Diaz JE; Donavan KC; Yuan T; Penner RM; Weiss GA Virus-Polymer Hybrid Nanowires Tailored to Detect Prostate-Specific Membrane Antigen. Anal. Chem 2012. 10.1021/ac203143y. [DOI] [PMC free article] [PubMed] [Google Scholar]
- (11).Mohan K; Donavan KC; Arter JA; Penner RM; Weiss GA Sub-Nanomolar Detection of Prostate-Specific Membrane Antigen in Synthetic Urine by Synergistic, Dual-Ligand Phage. J. Am. Chem. Soc 2013, 135 (20), 7761–7767. 10.1021/ja4028082. [DOI] [PMC free article] [PubMed] [Google Scholar]
- (12).Ogata AF; Edgar JM; Majumdar S; Briggs JS; Patterson SV; Tan MX; Kudlacek ST; Schneider CA; Weiss GA; Penner RM Virus-Enabled Biosensor for Human Serum Albumin. Anal. Chem 2017, 89 (2), 1373–1381. 10.1021/acs.analchem.6b04840. [DOI] [PMC free article] [PubMed] [Google Scholar]
- (13).Seki Y; Takahashi M; Takashiri M Effects of Different Electrolytes and Film Thicknesses on Structural and Thermoelectric Properties of Electropolymerized Poly(3,4-Ethylenedioxythiophene) Films. RSC Adv 2019, 9 (28), 15957–15965. 10.1039/C9RA02310K. [DOI] [PMC free article] [PubMed] [Google Scholar]
- (14).Purdy KR; Fraden S Isotropic-Cholesteric Phase Transition of Filamentous Virus Suspensions as a Function of Rod Length and Charge. Phys. Rev. E 2004, 70 (6), 061703 10.1103/PhysRevE.70.061703. [DOI] [PubMed] [Google Scholar]
- (15).Donavan KC; Arter JA; Weiss GA; Penner RM Virus-Poly(3,4Ethylenedioxythiophene) Biocomposite Films. Langmuir 2012, 28 (34), 12581–12587. 10.1021/la302473j. [DOI] [PMC free article] [PubMed] [Google Scholar]
- (16).Kim D-J; Lee N-E; Park J-S; Park I-J; Kim J-G; Cho HJ Organic Electrochemical Transistor Based Immunosensor for Prostate Specific Antigen (PSA) Detection Using Gold Nanoparticles for Signal Amplification. Biosens. Bioelectron 2010, 25 (11), 2477–2482. 10.1016/j.bios.2010.04.013. [DOI] [PubMed] [Google Scholar]
- (17).Picca RA; Manoli K; Macchia E; Sarcina L; Di Franco C; Cioffi N; Blasi D; Österbacka R; Torricelli F; Scamarcio G; et al. Ultimately Sensitive Organic Bioelectronic Transistor Sensors by Materials and Device Structures’ Design. Adv. Funct. Mater 2019, 1904513, 1904513 10.1002/adfm.201904513. [DOI] [Google Scholar]
- (18).Gentili D; D’Angelo P; Militano F; Mazzei R; Poerio T; Brucale M; Tarabella G; Bonetti S; Marasso SL; Cocuzza M; et al. Integration of Organic Electrochemical Transistors and Immuno-Affinity Membranes for Label-Free Detection of Interleukin-6 in the Physiological Concentration Range through Antibody–Antigen Recognition. J. Mater. Chem. B 2018, 6 (33), 5400–5406. 10.1039/C8TB01697F. [DOI] [PubMed] [Google Scholar]
- (19).Gualandi I; Tessarolo M; Mariani F; Cramer T; Tonelli D; Scavetta E; Fraboni B Nanoparticle Gated Semiconducting Polymer for a New Generation of Electrochemical Sensors. Sensors Actuators B Chem. 2018, 273, 834–841. 10.1016/j.snb.2018.06.109. [DOI] [Google Scholar]
- (20).Kim Y; Lim T; Kim C-H; Yeo CS; Seo K; Kim S-M; Kim J; Park SY; Ju S; Yoon M-H Organic Electrochemical Transistor-Based Channel Dimension-Independent Single-Strand Wearable Sweat Sensors. NPG Asia Mater. 2018, 10 (11), 1086–1095. 10.1038/s41427-018-0097-3. [DOI] [Google Scholar]
- (21).Macchia E; Romele P; Manoli K; Ghittorelli M; Magliulo M; Kovács-Vajna ZM; Torricelli F; Torsi L Ultra-Sensitive Protein Detection with Organic Electrochemical Transistors Printed on Plastic Substrates. Flex. Print. Electron 2018, 3 (3), 034002 10.1088/2058-8585/aad0cb. [DOI] [Google Scholar]
- (22).Fu Y; Wang N; Yang A; Law HK; Li L; Yan F Highly Sensitive Detection of Protein Biomarkers with Organic Electrochemical Transistors. Adv. Mater 2017, 29 (41), 1703787 10.1002/adma.201703787. [DOI] [PubMed] [Google Scholar]
- (23).Gualandi I; Tonelli D; Mariani F; Scavetta E; Marzocchi M; Fraboni B Selective Detection of Dopamine with an All PEDOT:PSS Organic Electrochemical Transistor. Sci. Rep 2016, 6 (1), 35419 10.1038/srep35419. [DOI] [PMC free article] [PubMed] [Google Scholar]
- (24).Zhang F; Johansson M; Andersson MR; Hummelen JC; Inganäs O Polymer Photovoltaic Cells with Conducting Polymer Anodes. Adv. Mater 2002, 14 (9), 662–665. . [DOI] [Google Scholar]
- (25).Pasha A; Khasim S; Al-Hartomy OA; Lakshmi M; Manjunatha KG Highly Sensitive Ethylene Glycol-Doped PEDOT–PSS Organic Thin Films for LPG Sensing. RSC Adv 2018, 8 (32), 18074–18083. 10.1039/C8RA01061G. [DOI] [PMC free article] [PubMed] [Google Scholar]
- (26).Thomas JP; Zhao L; McGillivray D; Leung KT High-Efficiency Hybrid Solar Cells by Nanostructural Modification in PEDOT:PSS with Co-Solvent Addition. J. Mater. Chem. A 2014, 2 (7), 2383–2389. 10.1039/c3ta14590e. [DOI] [Google Scholar]
- (27).Ouyang J; Xu Q; Chu C-W; Yang Y; Li G; Shinar J On the Mechanism of Conductivity Enhancement in Poly(3,4-Ethylenedioxythiophene):Poly(Styrene Sulfonate) Film through Solvent Treatment. Polymer (Guildf). 2004, 45 (25), 8443–8450. 10.1016/j.polymer.2004.10.001. [DOI] [Google Scholar]
- (28).Poverenov E; Li M; Bitler A; Bendikov M Major Effect of Electropolymerization Solvent on Morphology and Electrochromic Properties of PEDOT Films. Chem. Mater 2010, 22 (13), 4019–4025. 10.1021/cm100561d. [DOI] [Google Scholar]
- (29).nee Włodarczyk KC; Karczewski J; Jasiński P Influence of Electropolymerization Conditions on the Morphological and Electrical Properties of PEDOT Film. Electrochim. Acta 2015, 176, 156–161. 10.1016/j.electacta.2015.07.006. [DOI] [Google Scholar]
- (30).Kurganov B .; Lobanov A .; Borisov I.; Reshetilov A . Criterion for Hill Equation Validity for Description of Biosensor Calibration Curves. Anal. Chim. Acta 2001, 427 (1), 11–19. 10.1016/S0003-2670(00)01167-3. [DOI] [Google Scholar]
- (31).Islam F; Haque MH; Yadav S; Islam MN; Gopalan V; Nguyen N-T; Lam AK; Shiddiky MJA An Electrochemical Method for Sensitive and Rapid Detection of FAM134B Protein in Colon Cancer Samples. Sci. Rep 2017, 7 (1), 133 10.1038/s41598-017-00206-8. [DOI] [PMC free article] [PubMed] [Google Scholar]
- (32).Frey BL; Jordan CE; Kornguth S; Corn RM Control of the Specific Adsorption of Proteins onto Gold Surfaces with Poly(L-Lysine) Monolayers. Anal. Chem 1995, 67 (24), 4452–4457. 10.1021/ac00120a003. [DOI] [Google Scholar]
- (33).Pasinszki T; Krebsz M; Tung TT; Losic D Carbon Nanomaterial Based Biosensors for Non-Invasive Detection of Cancer and Disease Biomarkers for Clinical Diagnosis. Sensors 2017, 17 (8), 1919 10.3390/s17081919. [DOI] [PMC free article] [PubMed] [Google Scholar]
- (34).Ortiz-Aguayo D; del Valle M Label-Free Aptasensor for Lysozyme Detection Using Electrochemical Impedance Spectroscopy. Sensors 2018, 18 (2), 354 10.3390/s18020354. [DOI] [PMC free article] [PubMed] [Google Scholar]
- (35).Roda A; Michelini E; Zangheri M; Di Fusco M; Calabria D; Simoni P Smartphone-Based Biosensors: A Critical Review and Perspectives. TrAC Trends Anal. Chem 2016, 79, 317–325. 10.1016/j.trac.2015.10.019. [DOI] [Google Scholar]
- (36).Brás EJS; Fortes AM; Chu V; Fernandes P; Conde JP Microfluidic Device for the Point of Need Detection of a Pathogen Infection Biomarker in Grapes. Analyst 2019, 144 (16), 4871–4879. 10.1039/C9AN01002E. [DOI] [PubMed] [Google Scholar]
- (37).Kaisti M Detection Principles of Biological and Chemical FET Sensors. Biosens. Bioelectron 2017, 98, 437–448. 10.1016/j.bios.2017.07.010. [DOI] [PubMed] [Google Scholar]
- (38).Karr LJ; Shafer SG; Harris JM; Van Alstine JM; Snyder RS ImmunoAffinity Partition of Cells in Aqueous Polymer Two-Phase Systems. J. Chromatogr. A 1986. 10.1016/S0021-9673(01)87028-X. [DOI] [PubMed] [Google Scholar]
- (39).Field CR; Yeom J; Salehi-Khojin A; Masel RI Robust Fabrication of Selective and Reversible Polymer Coated Carbon Nanotube-Based Gas Sensors. Sensors Actuators B Chem. 2010, 148 (1), 315–322. 10.1016/j.snb.2010.05.026. [DOI] [Google Scholar]
- (40).Alizadeh T; Rezaloo F A New Chemiresistor Sensor Based on a Blend of Carbon Nanotube, Nano-Sized Molecularly Imprinted Polymer and Poly Methyl Methacrylate for the Selective and Sensitive Determination of Ethanol Vapor. Sensors Actuators B Chem. 2013, 176, 28–37. 10.1016/j.snb.2012.08.049. [DOI] [Google Scholar]
- (41).Llobet E Gas Sensors Using Carbon Nanomaterials: A Review. Sensors Actuators B Chem. 2013, 179, 32–45. 10.1016/j.snb.2012.11.014. [DOI] [Google Scholar]
- (42).Hangarter CM; Chartuprayoon N; Hernández SC; Choa Y; Myung NV Hybridized Conducting Polymer Chemiresistive Nano-Sensors. Nano Today 2013, 8 (1), 39–55. 10.1016/j.nantod.2012.12.005. [DOI] [Google Scholar]
- (43).Doleman BJ; Sanner RD; Severin EJ; Grubbs RH; Lewis NS Use of Compatible Polymer Blends To Fabricate Arrays of Carbon Black–Polymer Composite Vapor Detectors. Anal. Chem 1998, 70 (13), 2560–2564. 10.1021/ac971238h. [DOI] [PubMed] [Google Scholar]
- (44).Lux F Models Proposed to Explain the Electrical Conductivity of Mixtures Made of Conductive and Insulating Materials. Journal of Materials Science. 1993. 10.1007/BF00357799. [DOI] [Google Scholar]
- (45).McLachlan DS; Blaszkiewicz M; Newnham RE Electrical Resistivity of Composites. J. Am. Ceram. Soc 1990. 10.1111/j.1151-2916.1990.tb07576.x. [DOI] [Google Scholar]
- (46).Sauerbrey G Use of Crystal Oscillators for Weighing Thin Films and for Microweighing. Zeitschrift fuer Phys. 1959. [Google Scholar]
- (47).Kondo A; Murakami F; Higashitani K Circular Dichroism Studies on Conformational Changes in Protein Molecules upon Adsorption on Ultrafine Polystyrene Particles. Biotechnol. Bioeng 1992, 40 (8), 889–894. 10.1002/bit.260400804. [DOI] [PubMed] [Google Scholar]
- (48).Rodahl M; Höök F; Fredriksson C; Keller CA; Krozer A; Brzezinski P; Voinova M; Kasemo B Simultaneous Frequency and Dissipation Factor QCM Measurements of Biomolecular Adsorption and Cell Adhesion. Faraday Discuss. 1997. 10.1039/a703137h. [DOI] [PubMed] [Google Scholar]
- (49).Honbou K; Suzuki NN; Horiuchi M; Niki T; Taira T; Ariga H; Inagaki F The Crystal Structure of DJ-1, a Protein Related to Male Fertility and Parkinson’s Disease. J. Biol. Chem 2003, 278 (33), 31380–31384. 10.1074/jbc.M305878200. [DOI] [PubMed] [Google Scholar]
- (50).Bard Allen J., L. R. F Electrochemical Methods: Fundamentals and Applications, 2nd Edition; 2001. [Google Scholar]
- (51).Walters RR; Graham JF; Moore RM; Anderson DJ Protein Diffusion Coefficient Measurements by Laminar Flow Analysis: Method and Applications. Anal. Biochem 1984. 10.1016/0003-2697(84)90152-0. [DOI] [PubMed] [Google Scholar]
- (52).Brug GJ; van den Eeden ALG; Sluyters-Rehbach M; Sluyters JH The Analysis of Electrode Impedances Complicated by the Presence of a Constant Phase Element. J. Electroanal. Chem. Interfacial Electrochem 1984, 176 (1–2), 275–295. 10.1016/S0022-0728(84)80324-1. [DOI] [Google Scholar]
Associated Data
This section collects any data citations, data availability statements, or supplementary materials included in this article.


