Abstract
Slow inactivation has been described in multiple voltage-gated K+ channels and in great detail in the Drosophila Shaker channel. Structural studies have begun to facilitate a better understanding of the atomic details of this and other gating mechanisms. To date, the only voltage-gated potassium channels whose structure has been solved are KvAP (x-ray diffraction), the KV1.2-KV2.1 “paddle” chimera (x-ray diffraction and cryo-EM), KV1.2 (x-ray diffraction), and ether-à-go-go (cryo-EM); however, the structural details and mechanisms of slow inactivation in these channels are unknown or poorly characterized. Here, we present a detailed study of slow inactivation in the rat KV1.2 channel and show that it has some properties consistent with the C-type inactivation described in Shaker. We also study the effects of some mutations that are known to modulate C-type inactivation in Shaker and show that qualitative and quantitative differences exist in their functional effects, possibly underscoring subtle but important structural differences between the C-inactivated states in Shaker and KV1.2.
Introduction
Voltage-dependent potassium channels undergo several types of gating processes that limit the conductance on a time-dependent manner. Among the many gating transitions of this type is a slow inactivation process termed C-type inactivation. Although it was described 29 yr ago (Hoshi et al., 1991), this slow process is still not fully understood (Hoshi and Armstrong, 2013).
Inactivation processes in potassium channels have different functional manifestations and molecular origins (Hoshi et al., 1991; Kurata and Fedida, 2006). While rapid, ball-and-chain type inactivation is mediated by the N-terminus or β-subunits in Shaker-type channels (Hoshi et al., 1990; Rettig et al., 1994; Vergara-Jaque et al., 2019), slow inactivation is a more subtle process which likely involves conformational changes in the pore domain and the selectivity filter (De Biasi et al., 1993). Slow inactivation has been divided into C-, P-, and U-types, which might be unique or coexist in the same channel. Their different corresponding molecular mechanisms, if they exist, are not clear (Loots and Isacoff, 1998; Cordero-Morales et al., 2007; Cheng et al., 2011; Bähring et al., 2012). In this paper, we will use the term slow inactivation, which in this case might be identified with the C-type inactivation amply described in Drosophila Shaker channels with genetically removed fast inactivation (Hoshi et al., 1990; Klemic et al., 2001).
KV1.2 are mammalian Shaker-like potassium channels that possess up to 82% homology with the Drosophila Shaker gene product and have become an indispensable model for biophysical studies of potassium channels, principally because of the availability of structures determined by x-ray diffraction as well as cryo-EM (Long et al., 2005; Pau et al., 2017; Matthies et al., 2018). These structures serve as templates to interpret biophysical data arising from other voltage-gated potassium channels. As mentioned, another important model in channel biophysics is the Shaker channel, especially mutants in which fast N-type inactivation has been removed. However, no high-resolution structures of Shaker exist, and all experimental observations in Shaker are interpreted using the KV1.2 structures or computational models based on KV1.2. Recently, a structure determined by cryo-EM was obtained for the KV1.2 channel in nanodiscs (Matthies et al., 2018) and it was suggested that the structure might possibly correspond to a C-type slow-inactivated state. However, no comprehensive description of slow inactivation of KV1.2 is available, although previous work has indicated the presence of a slow inactivation process as well as feasible similarities between Shaker C-type inactivation and slow inactivation in KV1.2 (Cordero-Morales et al., 2011). Our goal in this work was to characterize the inactivation process in rat KV1.2 channels and investigate the effect of some equivalent mutants that in Shaker channels affect C-type inactivation. We found that KV1.2 channels are slower to inactivate than Shaker and that, although this might be identified with C-type inactivation, the effects of mutations and ions are sufficiently distinctive to suggest that the detailed slow inactivated conformation of KV1.2 is different from that of Shaker.
Materials and methods
Channels, mutagenesis, and oocyte injection
The rat KV1.2 channel in the pMAX plasmid was a gift from B. Roux (University of Chicago, Chicago, IL). Mutagenesis was performed by a single PCR reaction using the KOD Hot Start DNA polymerase (Novagen) and appropriate mutagenic oligonucleotides (Sigma-Aldrich). Mutants were confirmed first by restriction essays and finally by sequencing at the Molecular Biology Facility at the Instituto de Fisiologia Celular, Universidad Nacional Autónoma de México. WT KV1.2 and the generated mutants’ cDNA were linearized with PacI endonuclease. mRNA was synthetized from linearized cDNA with the T7 polymerase mMessage mMachine kit (Ambion) and resuspended in pure H2O at a concentration of 0.5–1 µg/µl.
Xenopus laevis handling was done according to National Institutes of Health standards (National Research Council, 2010). Stage VI oocytes were obtained by surgery after frogs were anesthetized with tricaine (2.2 mg/ml). Oocyte defoliculation was achieved first by mechanical separation with fine tweezers and then by enzymatic treatment with collagenase type IA (Sigma-Aldrich) at a concentration of 1.2 mg/ml in calcium-free OR2 medium for 30 min. After thorough washing in calcium-free ND96 solution for 30 min, oocytes were kept in regular ND96 solution. Healthy oocytes were microinjected with ∼40 nl of KV1.2 WT or mutant mRNA 1 d after surgery, and experiments were performed 2–6 d after injection. For patch-clamp recording, the vitelline membrane was mechanically removed with fine tweezers before the experiments.
Electrophysiology
Two-electrode voltage-clamp (TEVC)
Ionic and gating current recordings were performed using a TEVC (Warner Instruments, OC-725C). Glass microelectrodes were fabricated in a P-97 micropipette puller (Sutter Instruments) from borosilicate glass capillaries (Sutter Instruments, BF150-86-10) and had a resistance of 1–2 MΩ when filled with 3 M KCl and dipped in ND96 solution. Current was filtered at 3 kHz with an analogue filter (Frequency Devices) and sampled at 10 kHz. Ionic currents were recorded in response to voltage-clamp pulses and using a −p/4 subtraction protocol to remove linear components of the current. Currents obtained from long pulses were not subtracted.
Gating currents were recorded in TEVC with ND96 as external solution. Linear current components were subtracted using a −p/4 subtraction protocol. Gating currents were sampled at 28 kHz. 10 sweeps were averaged at each voltage. These recordings were obtained from the double mutants: W366F/V381T, W366F/V381A, and W366F/V381I. The mutants W366F/V381W and W366F/V381L did not show functional expression.
Voltage control and current recording were accomplished with the freely available program WinWCP running on a Windows XP PC (J. Dempster, University of Strathclyde, Glasgow, Scotland, UK; Dempster, 2001) and a National Instruments card (NI USB-6251). All recordings were performed in ND96 as the bath solution unless otherwise indicated in the text. For 100 mM K+ external solutions, NaCl in ND96 was reduced to 10 mM. When external TEA was proved, TEA-Cl equimolarly replaced NaCl.
Patch-clamp
Currents in the inside-out configuration of the patch-clamp were recorded with an Axopatch 200-B amplifier (Molecular Devices) and an Instrutech ITC-18 interface (HEKA Elektronik) controlled by PatchMaster software (HEKA Elektronik). Pipettes had resistance of 0.5–1 MΩ and were filled with a solution containing (in mM): 60 KCl, 60 NaCl, 3 HEPES, and 1.8 CaCl2, pH 7.4 (KOH). The bath solution contained (in mM): 130 KCl, 3 HEPES, and 1 EDTA, pH 7.4 (KOH). For nonstationary noise analysis, 50–300 current sweeps were recorded, filtering at 10 kHz and sampling at 50 kHz in response to a pulse from −90 to 100 mV with duration of 100 ms. No subtraction of linear current components was applied. The variance was calculated from the current sweeps using pairwise subtraction to reduce the influence of channel run-down or run-up (Heinemann and Conti, 1992). The variance versus mean relationship was plotted and fitted to the equation (Sigworth, 1980)
| (1) |
In this equation, σ2 is the variance of the current, i is the unitary channel current, N is the number of channels in the patch, and 〈I〉 is the current average. The channel open probability, Po, was obtained from these parameters as Po = 〈I〉/iN.
Data analysis
Analysis was performed with procedures written in-house in Igor Pro 6.0 (Wavemetrics). The conductance, G(V), at each voltage, V, was measured from steady-state ionic currents, I, as: G = I/(V − Vrev), where Vrev is the reversal potential. For inactivating currents, the peak current was measured to calculate the peak conductance. The normalized conductance was defined as G/Gmax, where Gmax is the conductance at 50 mV. G/Gmax as a function of voltage, V, was fitted to a Boltzmann-like function,
| (2) |
This equation assumes the sequential movement of four identical subunits with apparent charge movement per subunit given by zapp. The parameter Ko describes the position of the curve along the V-axis. KB is the Boltzmann constant, and T is the temperature in Kelvin. We find that this equation provides a better fit to the G-V curves than a simple Boltzmann function.
The slow ionic current decay elicited by long, 20-s pulses was fitted to the equation
| (3) |
The constant, B, is a scaling factor, Ai is the amplitude of the slow and fast components, and τi is the time constant.
Steady-state inactivation was assessed with a conventional prepulse protocol. For WT KV1.2, the prepulse had duration of 20 s and was changed from −80 to 70 mV in 10-mV increments. Then the voltage was brought to 50 mV during 300 ms. For the W366F mutant, the prepulse lasted 300 ms and was carried from −120 to 10 mV in 10-mV increments. After the prepulse, the voltage was stepped to 50 mV for 100 ms.
The current at the 50-mV pulse was normalized and plotted as a function of prepulse voltage. These data were fitted to the following equation:
| (4) |
The ON-gating currents were integrated numerically to obtain the charge movement, Qon. Qon was plotted as a function of voltage and fitted to the equation
| (5) |
This equation assumes two main components of charge movement, q and q′, with amplitudes a and b and midpoints of charge movement given by the values of and .
The voltage dependence of any given time constant was fitted to the equation
| (6) |
Here, τo is the value of the time constant at 0 mV, q is the partial charge, and V, KB, and T have the same meaning as in the previous equations.
Molecular modeling
Mutations were introduced in the KV1.2-KV2.1 paddle chimera channel (PDB accession no. 2R9R; Long et al., 2007) using the mutagenesis module in PyMol. The rotamers with fewer molecular clashes were chosen to represent the final model. Structural figures were rendered in PyMol.
Results
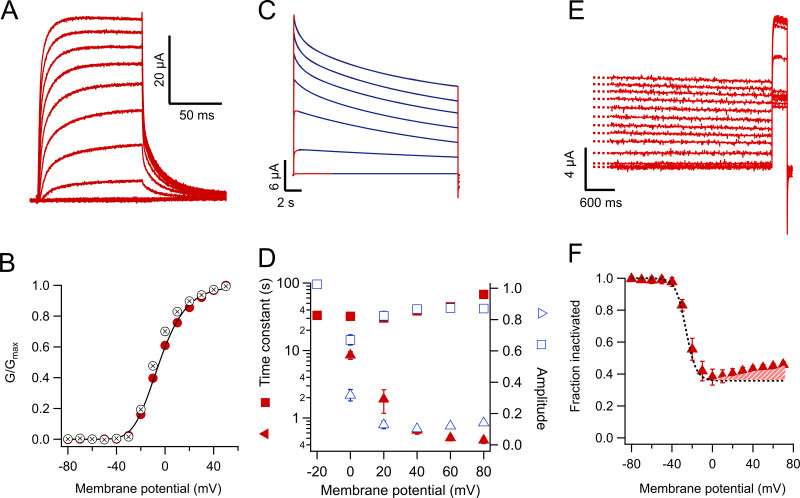
As previously shown (Roberds and Tamkun, 1991; Tao and MacKinnon, 2008; Ishida et al., 2015), KV1.2 produces steeply voltage-dependent, outward-rectifying potassium currents (Fig. 1, A and B). In the absence of coexpression with a β-subunit, these currents do not inactivate in a time scale of milliseconds; however, when long positive voltage pulses (20 s) are applied, the currents decay with a double-exponential time course with time constants of ∼1 and 40 s at voltages more positive than 20 mV, with the slow component contributing the majority of the amplitude (Fig. 1, C and D). At 40 mV and after 20 s, 49.2 ± 0.21% of the current remains (Fig. 1 F). For comparison, the slow inactivation in Shaker channels with the N-terminal inactivation particle removed is also biexponential with comparable time constants ∼4 and 24 s, but the reduction of current at the end of the pulse is more complete (Olcese et al., 1997). At steady state, the voltage dependence of inactivation, evaluated by a prepulse experiment, is very steep, with an apparent voltage dependence equivalent to ∼5 eo (Fig. 1, E and F). Steady-state slow inactivation is incomplete and nonmonotonic, becoming less prominent at potentials more positive than 0 mV. This is evidenced by the deviation of the sigmoidal fit at positive potentials (Fig. 1 F, dashed area). This behavior is reminiscent of the U-type or closed-state dependent inactivation, which has been described in other voltage-dependent potassium channels (Klemic et al., 1998).
Figure 1.
KV1.2 WT channels slow-inactivate incompletely. (A) Currents in response to short voltage-clamp pulses to 50 mV applied from a holding potential of −80 mV and lasting 100 ms. Tail currents are observed upon return to a potential of −30 mV. (B) Voltage dependence of the normalized conductance at the test potential (red circles) or the normalized size of the tail current at the beginning of the −30 mV pulse. The data are the mean and error bars are the SEM from n = 7 oocytes (conductance) or n = 15 (tails). The black curve is the fit of the conductance data to Eq. 2 with parameters Ko = 0.13, zapp = 1.77 eo. (C) Currents in response to long (20-s) pulses from −40 to 80 mV in 20-mV steps. The current slowly decays in amplitude as a result of a slow inactivation process. The decay kinetics can be fitted by a sum of two exponential functions. The fit to Eq. 3 is shown by the continuous blue lines, except the −20 mV trace, which was fitted to a single exponential. (D) Inactivation time constants are plotted as a function of voltage. The filled square symbols are the slow time constant, and the filled triangles are the fast time constant. Amplitudes are shown by empty symbols. (E) Protocol to determine the voltage dependence of steady-state inactivation at the end of a 20-s pulse. The current elicited by a 50-mV pulse and 300-ms duration after the long 20-s pulses is reduced as a consequence of accumulated inactivation. (F) Quantitation of the steady-state inactivation in an h∞-like curve. Note that inactivation is relieved at voltages more positive than 20 mV. The dashed black curve is the fit of a Boltzmann-like function to the data from −80 to 0 mV, with an apparent valence of 5 eo. The difference at positive voltages between the fit and the data emphasizes the U-type inactivation character of the process.
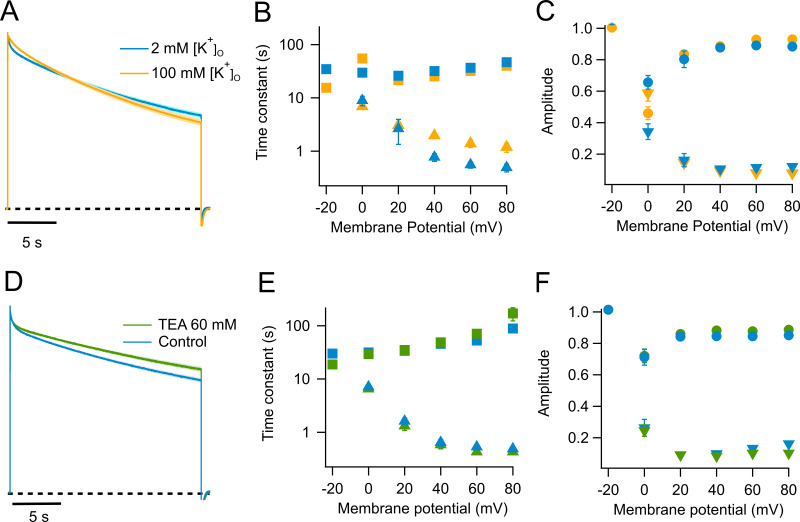
An important hallmark of C-type inactivation in other channels is its modulation by extracellular cations, in particular potassium ions. Higher potassium extracellular concentrations ([K+]o) slow down the inactivation rate in Shaker (López-Barneo et al., 1993). We find that inactivation of KV1.2 channels is also slowed down by increased [K+]o (Fig. 2 A), although the effect is not as large as in Shaker. The main effect of elevated potassium is to slow down the fast component of inactivation, from ∼0.5 to 1.4 s at 60 mV, while the slow time constant is left almost intact (Fig. 2 B). The rate of slow inactivation can also be modulated by extracellular TEA. We have used a higher concentration of extracellular TEA, since the apparent Kd for TEA block in KV1.2 is ∼500 mM (Grissmer et al., 1994), unlike what is reported in Shaker, with a Kd of 18 mM (González-Pérez et al., 2008). Addition of 60 mM TEA to the bath decelerates inactivation, mostly affecting the slow time constant. At 60 mV, it increases from ∼50 to 72 s (Fig. 2 E). This effect is quantitative and qualitatively different from the effect of 100 mM external potassium (Fig. 2, D–F). The response of KV1.2 with respect to addition of external K+ and TEA is a hallmark of C-type inactivation as seen in Shaker (Choi et al., 1991; López-Barneo et al., 1993; Molina et al., 1997; Andalib et al., 2004). To assess if this slow inactivation is similar to P/C-type slow inactivation, we investigated in KV1.2 the effects of some Shaker mutants that have helped define this type of inactivation.
Figure 2.
Effect of extracellular potassium and TEA on slow inactivation in WT KV1.2. (A) Outward currents in response to a 60-mV, 20-s pulse. The blue trace is the normalized average current from eight experiments recorded in 2 mM external K+. The yellow trace is the normalized average current from eight traces recorded in the presence of 100 mM external K+. (B) Quantitation of the effect of potassium on the time constants of inactivation. The color code is the same as in A; squares, slow time constant; triangles, fast time constant. (C) Amplitudes of the fast (inverted triangles) and slow (circles) components are plotted. (D) Effect of external TEA on the kinetics of slow inactivation. The blue trace is the normalized average current at 60 mV from seven traces in the absence of TEA and at 2 mM external potassium. The green trace is the normalized average current from seven sweeps in the presence of 60 mM external TEA also with 2 mM external potassium. (E) Effect of TEA in the slow (squares) and fast (triangles) time constants. (F) Effect of TEA on the amplitudes of the fast (inverted triangles) and slow (circles) time constants. In A and D, the light-colored shade along the current trace is the SEM. Error bars in B, C, E, and F are ± SEM.
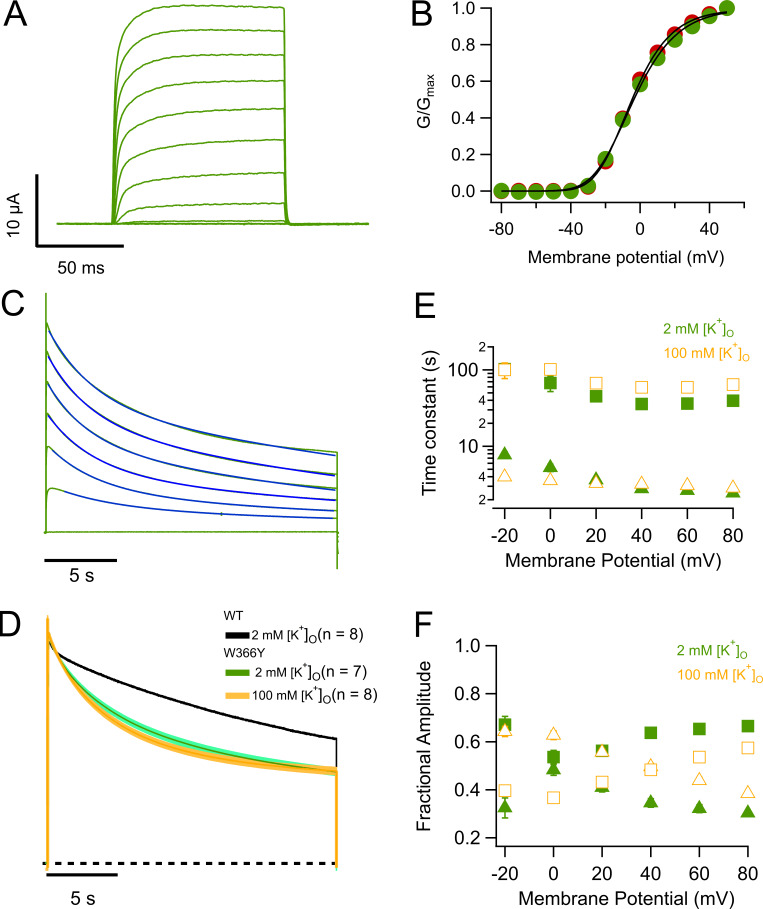
In Shaker channels, a tryptophan residue at position 434 (W434) is very important in modulating C-type inactivation (Perozo et al., 1993; Yang et al., 1997; Pless et al., 2013), and the mutation W434Y has been shown to produce channels with accelerated inactivation (Cordero-Morales et al., 2011). Surprisingly, the equivalent mutant in KV1.2, W366Y, produced channels that upon first inspection seem very similar to WT. The channels activate in a voltage-dependent fashion and over a range of voltages almost identical to that of WT (Fig. 3, A and B). Long depolarizing pulses also induce inactivation of the currents, with a double-exponential time course that is faster than in WT (Fig. 3, C and D). The inactivation process in W366Y is also sensitive to extracellular potassium, but for this mutant it becomes slightly more prominent than the effect of [K+]o = 100 mM on WT (Fig. 3 D). Interestingly, in this mutant potassium does not change the fast constant much and increases the slow time constants, also increasing the amplitude of the fast time constant and reducing the amplitude of the slow one, resulting in an overall speeding up of the decay of the current (Fig. 3, E and F).
Figure 3.
Mutation W366Y accelerates slow inactivation. (A) Ionic currents in response to 100-ms depolarizing pulses from −80 to 50 mV in 10-mV steps, from a holding potential of −80 mV. Currents are very similar to WT channels. (B) Comparison of the voltage dependence of W366Y and WT KV1.2. The normalized conductance of both channel types is plotted as a function of voltage. Red circles correspond to WT and green circles to W366Y. The continuous curve corresponds to the fit to Eq. 2 with parameters zapp = 1.77 eo, Ko = 0.135 (WT); zapp = 1.59 eo, Ko = 0.149 (W366Y). (C) Mutant channels also inactivate slowly and more completely than WT channels. Blue lines are the fit to Eq. 3. (D) High potassium speeds up inactivation. Green trace is the normalized average current at 60 mV from seven oocytes in the presence of 2 mM external K+. The yellow trace is the normalized current average from eight oocytes in 100 mM external K+. In both cases, the shaded areas represent ± SEM. The black dashed curve is the average WT current time course, also at 60 mV. (E) Voltage dependence of the time course of slow inactivation. Filled symbols are the slow and fast time constants in ND96 extracellular medium ([K+]o = 2 mM). Empty symbols are the slow and fast time constants in the presence of 100 mM extracellular potassium. Squares are the slow time constant and triangles the fast time constant. (F) Amplitudes of the two components in E. Squares are the slow time constant amplitude and triangles the fast time constant amplitude. Error bars in B, E, and F are ± SEM.
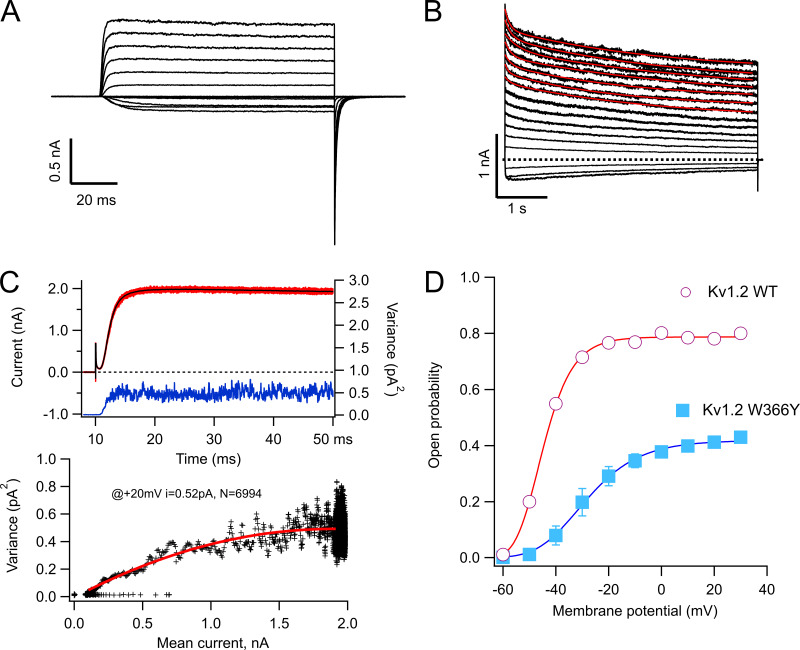
To better understand the gating behavior of this mutant, we performed patch-clamp experiments. As seen in TEVC, the ionic currents recorded from inside-out patches of W366Y in response to short depolarizations are similar to WT (Fig. 4 A). The slow inactivation elicited by longer pulses (5 s) is also present and occurs along a double-exponential time course (Fig. 4 B). With the purpose of estimating gating parameters, we performed nonstationary noise analysis experiments. We decided on the use of noise analysis over single-channel recording since the single-channel conductance of KV1.2 is small. Mean-variance analysis of these currents (Fig. 4 C) shows that the single-channel current of the mutant is reduced to 0.53 ± 0.014 pA, compared with 0.7 pA at 20 mV for WT KV1.2 (Ishida et al., 2015), and that the main effect of the mutation is to significantly reduce the open probability of the channels to near half the value of the WT (Fig. 4 D).
Figure 4.
The W366Y mutant induces a rapidly equilibrating state occurring after the open state. (A) Inside-out patch recording of potassium currents through W366Y channels. Currents were elicited by voltage pulses of 100-ms duration, from −60 to 30 mV from a holding potential of −90 mV. (B) Slow inactivation is also present in cell-free recordings and is incomplete at the end of 5-s pulses. The inside-out data show that inactivation proceeds via two exponentials, comparably to the behavior of currents obtained in TEVC (red curves are fit to a double-exponential function). (C) Nonstationary noise analysis of currents at 20 mV. In the upper panel, 100 current sweeps are shown in red with the mean current plotted in black. The blue trace is the point-by-point variance calculated from the 100 traces. The bottom panel shows the mean–variance relationship (black crosses) with the fit to Eq. 1 shown in red. The parameters of the fit are I = 0.52 pA, n = 6,994. (D) The voltage dependence of activation of WT (red circles) and W366Y (blue squares) channels. The amplitude of the tail current at the end of 100-ms pulses is plotted as a function of the voltage of the pulse and is normalized to the maximum open probability obtained from noise measurements as in C. Data are mean ± SEM. WT, n = 10; W366Y, n = 7.
Another mutation in Shaker that is known to modulate the time course of C-type inactivation is the W434F substitution, which accelerates inactivation to such an extent that channels with extremely reduced open probability and very brief openings are produced. As a consequence, when enough channel expression is achieved, only charge movement in the form of gating currents is observed, as if channels were permanently C-type inactivated (Perozo et al., 1993; Yang et al., 1997).
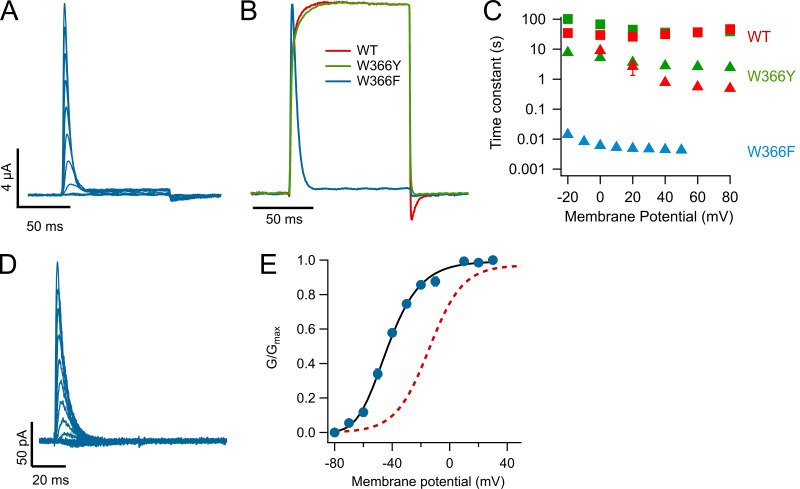
Surprisingly, mutation W366F, which is equivalent to Shaker W434F, produces only rapidly inactivating channels (Fig. 5 A). This result had been previously reported (Cordero-Morales et al., 2011). Side-by-side comparison of normalized currents of the two mutants at position 366 and WT is shown in Fig. 5 B. It is readily seen that W366F channels inactivate within milliseconds, with a time course that can be fitted with a single exponential. This time constant is 2.5 orders of magnitude faster than the fastest component of inactivation in WT or W366Y (Fig. 5 C). This fast inactivation was also observed in inside-out patch recordings (Fig. 5 D). These inside-out recordings were performed in the presence of 60 mM [K+]o. Under these conditions, the conductance activates at more negative voltages compared with the conductance in the presence of 2 mM [K+]o, also in inside-out recordings (Fig. 5 E).
Figure 5.
The W366F mutation produces channels with fast inactivation. (A) Family of currents showing fast inactivation even with short (100-ms) pulses. Depolarizing pulses stepped from −80 to 50 mV in 10-mV increments, from a holding potential of −80 mV. (B) Comparison of the time course of currents activated by a 100-ms pulse to 50 mV for WT, W366F, and W366Y channels. Currents were normalized to their maximum value. (C) Inactivation time constants for the two mutants and WT channels. The fast and slow time constants for WT (red) and W366Y (green) were obtained from currents elicited by 20-s pulses as in Figs. 1 D and 3 C. The inactivation time constant for W366F (light blue) was obtained from a fit to a single-exponential function of the decay of currents elicited by 100-ms pulses. Data are the mean from nine experiments and error bars are ± SEM. (D) Fast-inactivating currents obtained from an inside-out patch expressing W366F channels. (E) The voltage dependence of these currents is shifted to negative voltages when 60 mM extracellular potassium is used. The continuous black curve is the fit to Eq. 2 with parameters zapp = 1.75 eo, Ko = 0.0091 (n = 6). For comparison, the voltage dependence of currents in 2 mM external potassium is shown (red dotted curve).
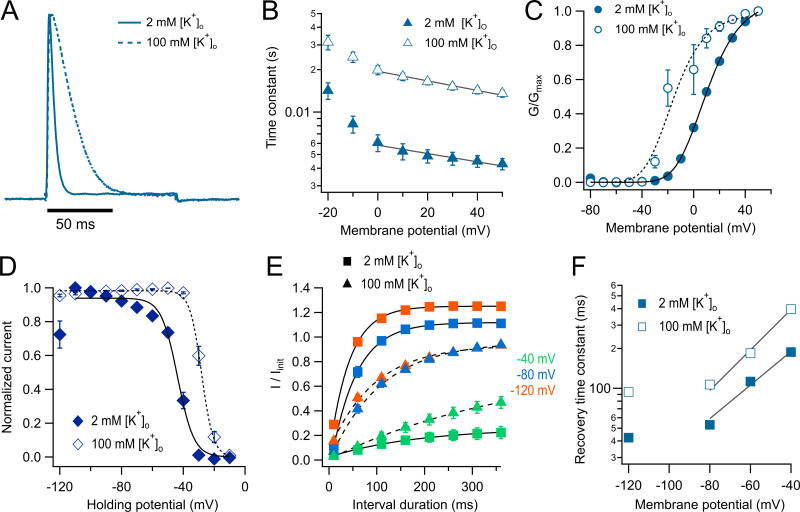
An important question is if the inactivated state that seems to be stabilized in KV1.2-W366F is the same slow-inactivated state seen in WT and W366Y. As with these channels, application of 100 mM extracellular K+ to KV1.2-W366F results in a significant slowing of the inactivation rate (Fig. 6, A and B), as reported for C-type inactivation in other potassium channels. The extent of this slowing is larger than in WT, reaching ∼3.4-fold versus 1.3-fold at positive voltages.
Figure 6.
Inactivation characteristics of the W366F mutant. (A) Current elicited by a 50-mV pulse of 100-ms duration obtained in the presence of 2 mM extracellular K+ (continuous line). The dotted line is a representative current at the same voltage in the presence of 100 mM extracellular K+. (B) The inactivation time constant obtained from a single exponential fit to currents in the presence of 2 mM [K+]o (filled symbols) or 100 mM [K+]o (hollow symbols). The black lines show an exponential fit to Eq. 6. The apparent charges in high and low external potassium are similar (−0.17 and −0.19 eo, respectively), and the value of τo is increased from 0.005 to 0.019 s by the high potassium. (C) Effect of external potassium on the voltage dependence of the conductance calculated from the peak current. Filled symbols are the normalized peak conductance in 2 mM [K+]o from n = 9 experiments, and the continuous line is the fit to Eq. 2 with parameters zapp = 1.52 eo, Ko = 0.35. Hollow symbols are the normalized peak conductance in 100 mM [K+]o. The parameters of the fit (dashed curve) are zapp = 1.64 eo, Ko = 0.068 (n = 9). (D) Steady-state inactivation. A prepulse of varying voltage from −120 to −10 mV of 300-ms duration was applied before a fixed 100-ms pulse to 50 mV. The current elicited by the 50-mV pulse was normalized and plotted as a function of prepulse voltage. The data are fitted by Eq. 4. Filled symbols are in 2 mM [K+]o and hollow symbols in 100 mM [K+]o. The parameters of the fit are 2 mM [K+]o and 100 mM [K+]o. (E) Recovery from inactivation was measured with a two-pulse protocol with pulses of 100-ms duration at 50 mV. The pulses were separated by increasing time intervals from 10 to 360 ms in 50-ms increments. The voltage of the interval between two pulses was held at −120, −80, and −40 mV. The recovery time course was fitted to a single exponential function, and the voltage dependence of the recovery was plotted in F. The experiment was done at 2 mM [K+]o (squares, n = 9) and 100 mM [K+]o (triangles, n = 9). (F) Recovery rates are shown as a function of prepulse voltage, and their voltage dependence was assessed by a fit to Eq. 6, indicating that the apparent charge of recovery is increased by 100 mM external K+ from 0.73 to 0.88 eo. Mean and SEM are plotted in pannels B, C, D, and F.
As shown in inside-out patch-clamp recordings (Fig. 5 E), in TEVC increased [K+]o also modulates the range of activation by voltage. 100 mM [K+]o shifts the midpoint of activation by −30 mV (Fig. 6 C). The antagonistic action of elevated [K+]o on inactivation is also evidenced by the effects on the voltage dependence of steady-state inactivation. High [K+]o shifts the voltage dependence of inactivation by +20 mV. Importantly, a significant proportion of channels (26%) is inactivated at −120 mV in 2 mM [K+]o. This inactivated fraction of channels at negative voltages disappears when [K+]o is brought to 100 mM (Fig. 6 D).
Recovery from inactivation is highly voltage dependent, becoming faster as the holding potential is made more negative (Fig. 6 E), and the rate of recovery is also modulated by [K+]o. However, the modulation of inactivation by external potassium is counterintuitive, since 100 mM [K+]o makes recovery slower and not faster (Fig. 6 F). In a simple model, recovery from inactivation is the backward transition from entry into inactivation. In such a situation, allosterism requires potassium to either have no effect or have the opposite effects on entry and recovery from inactivation. This result suggests that recovery from slow inactivation might occur via several pathways and might be expected if closed- and open-state inactivation coexist.
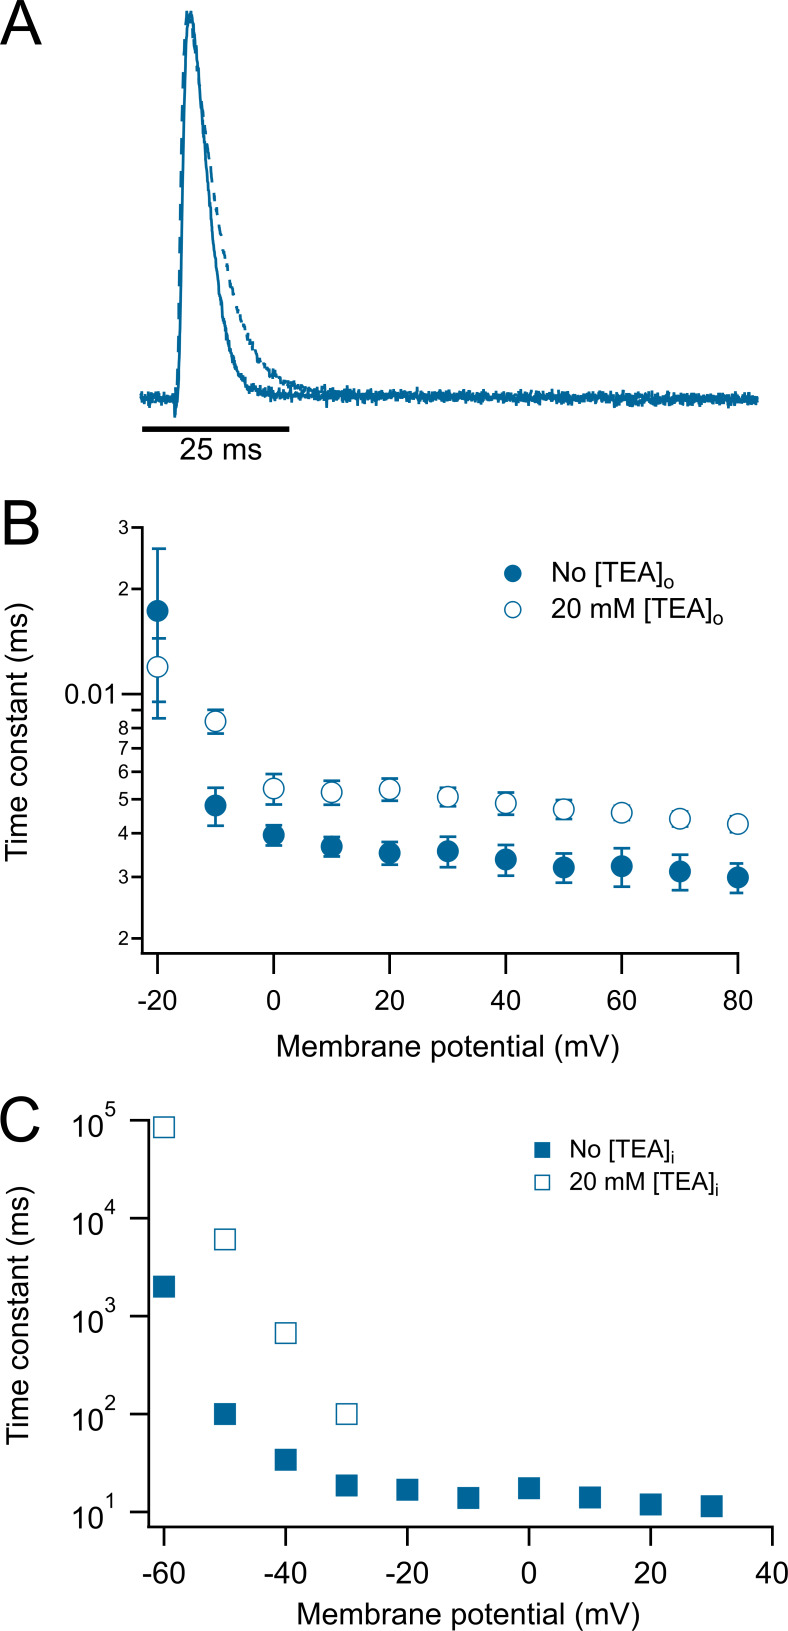
Extracellular TEA has also been used as a probe of C-type inactivation (Kurata et al., 2005; Carrillo et al., 2013). As with WT KV1.2 (Fig. 2), we applied 20 mM TEA to the bath and observed a modest but detectable slowing of the inactivation rate of KV1.2-W366F (Fig. 7, A and B), a result consistent with similar experiments in Shaker channels. Remarkably, application of intracellular TEA (20 mM) to inside-out patches also slowed down inactivation, although the effect was visible at more negative voltages than with extracellular TEA (Fig. 7 C).
Figure 7.
Extracellular and intracellular TEA slows down the inactivation kinetics of the W366F mutant. (A) Representative current traces at 60 mV in the absence (continuous trace) and presence (dashed trace) of 20 mM extracellular TEA. (B) Voltage dependence of the time constant of inactivation. External TEA data are show by hollow symbols, while control data are shown by filled symbols. (C) Effect of intracellular TEA. 20 mM intracellular TEA was applied to inside-out patches. In the presence of TEA, current inactivation is slowed down appreciably at negative voltages. Data shown in B and C are mean ± SEM.
Taken together, this set of experiments with [K+]o and [TEA]o suggest that the inactivation induced by the KV1.2-W366F mutant has characteristics compatible with it being an accelerated form of the slow inactivation present in WT channels.
Why is it that the W366F mutation in KV1.2 does not produce permanently inactivated channels as in Shaker? Several amino acid residues have been shown to be involved in modulating the rate of slow inactivation in Shaker channels. In particular, when a threonine is located at position 449 (Shaker WT), the channels inactivate in the course of seconds. Inactivation is greatly enhanced by a charged (positive or negative) amino acid or an alanine, while valine almost completely abolishes inactivation (López-Barneo et al., 1993). In KV1.2 channels, the equivalent position is V381, and when mutated to threonine, combined into the double mutant W366F/V381T (Goodchild et al., 2012) channels that only display gating currents are produced.
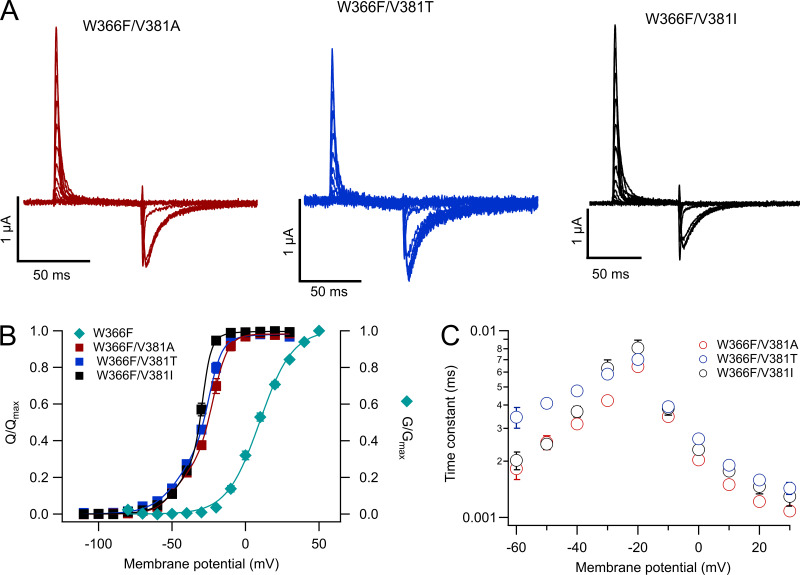
We also made the W366F/V381T double mutant, along with W366F/V381A, W366F/V381I, W366F/V381W, and W366F/V381L. Of these double mutants, only W366F/V381A, W366F/V381I, and W366F/V381T expressed functionally. These three double mutants gave rise to channels that only displayed charge movement. Gating currents were readily recorded in whole oocytes (Fig. 8 A) and showed characteristics similar to WT gating currents recorded in oocytes via patch-clamp (Ishida et al., 2015). The Q–V relationship shows that charge moves in two main components (Fig. 8 B) that occur at voltages more negative than the peak conductance of the background mutant, W366F. The kinetics of the ON-gating currents is similar between mutants, especially at positive potentials. At negative voltages, the mutant W366/V381T shows slightly slower kinetics (Fig. 8 C). The OFF-gating currents are variously contaminated by the tail currents of endogenous oocyte channels, so a comparison of on-charge versus off-charge was not performed.
Figure 8.
Mutations at V381 in the W366F background produce permanently inactivated channels. (A) Representative traces of gating currents recorded from the expressed channels indicated in each panel. Currents were elicited by voltage-clamp pulses of 60-ms duration ranging from −110 to 30 mV in 10-mV steps from a holding potential of −100 mV. (B) Normalized voltage dependence of charge movement (Q–V) of the three mutants plotted (following its color code from A) and compared with the voltage dependence of the peak-normalized conductance of the background mutation W366F (cyan rhombuses). Q–V data were fitted to Eq. 5. The number of experiments were W366F/V381A, n = 13; W366F/V381T, n = 5; and W366F/V381I, n = 9. (C) The time course of current decay of the three double mutants is plotted as a function of pulse voltage. ON-gating current decay was fitted to a single exponential to determine the time constant. Number of experiments is as in B. Data in B and C are mean ± SEM.
Discussion
Slow inactivation in potassium channels is a gating transition of functional importance. In spite of this, its fundamental mechanism remains poorly understood. This is in part because more than one form of inactivation coexists in several channels. Even the better-understood Shaker channel shows evidence of more than one way to enter an inactivated state (Ayer and Sigworth, 1997; Klemic et al., 2001). C-type inactivation (sometimes also called C/P-type; Kurata and Fedida, 2006; Bähring et al., 2012) seems to be associated with conformational changes in the selectivity filter that occur after the channel has reached the open state (Scheme 1). U-type inactivation seems to be related to conformational changes in the pore that can occur while the channel is in its closed conformation. A key consequence of closed-state inactivation is that the shape of the voltage dependence of steady-state inactivation is not a simple sigmoid, but a U-shaped function, since channels enter the inactivated state more favorably from intermediate, closed states than from the open state (Bähring and Covarrubias, 2011). These two forms of inactivation coexist in Shaker channels and constitute an often-overlooked confounding factor in inactivation studies.
(Scheme 1).

Here, we have shown that WT KV1.2 channels slow-inactivate, and this inactivation process also has mixed characteristics of C/P-type and U-type inactivation. Compared with slow inactivation in Shaker (Hoshi et al., 1991), KV1.2’s is less pronounced. This is perhaps due to the presence of a valine at position 381, which in Shaker is a threonine. Valine at the equivalent position in Shaker also produces channels with less complete and slower inactivation (López-Barneo et al., 1993). We compare some inactivation parameters between Shaker and KV1.2 in Table S1.
A simplified kinetic model can partially explain the behavior of WT and the mutations studied in this work (Scheme 1).
A model such as Scheme 1 assumes sequential charge movement and a single open state. Slow inactivation (Is) can occur only from the open state. For the W366Y channels, the rate constant κ is increased with respect to WT, leading to faster and more complete inactivation at the end of a long activating pulse. Additionally, the rate constants previous to the open state are also reduced by the mutation W366Y, since the peak open probability is reduced in this mutant.
The behavior of the W366F mutant can be explained if κ is much greater than λ, leading to a much faster and complete inactivation. This model is not unique and is likely only part of a full explanation of the mutants’ effects. Since WT KV1.2 shows evidence of U-type inactivation, this would require the existence of inactivated states accessed from closed states (Cheng et al., 2011; Bähring et al., 2012; Jamieson and Jones, 2013).
Evidence that slow inactivation in WT and the mutants is similar to C-type inactivation in Shaker is provided by the effects of external K+ and TEA (Levy and Deutsch, 1996). Both compounds slow down the time course of inactivation in WT and the W366Y and W366F mutants, which is indicative of a common mechanism.
The behavior of W366F is very interesting. These channels have a fast and complete inactivation whose time course is not very voltage dependent (0.17 eo) and becomes slower with high extracellular potassium, but not significantly different in voltage dependence (0.19 eo). However, recovery from inactivation is more voltage dependent (0.73 eo) and becomes even more so in high external potassium (0.88 eo). External potassium has a paradoxical effect on inactivation. While it slows down entry into the inactivated state and removes the steady-state inactivation present at negative voltages, it also slows down recovery from inactivation. The existence of closed-state inactivation could explain the slowing down of the recovery from inactivation in the presence of high external potassium in W366F.
The effects of extracellular TEA have been used as a probe of the conformational changes occurring in the external region of the pore during slow inactivation (Andalib et al., 2004). We found that, as in Shaker, application of external TEA slows down the transition to the inactivated state. This is indicative of similar steric and electrostatic interactions in both channels during inactivation.
It has been shown that in Shaker, intracellular TEA interferes with C-type inactivation more prominently than external TEA (González-Pérez et al., 2008), suggesting that internal TEA might hinder the U-type inactivation component while external TEA slows down C-type inactivation. Surprisingly, we found a similar behavior in W366F, where application of intracellular TEA to this mutant also slowed down the inactivation rate. Our experimental evidence suggests that the conformational changes leading to a slow-inactivated state in KV1.2 and Shaker are similar. However, the detailed effects of the mutants are not the same in these two channels.
The phenotype of W366F is remarkable in that it does not produce permanently C-type inactivated channels. It was previously demonstrated that this mutation combined with V381T, which mimics the background of the mutant W434F in Shaker, abolishes ionic current and produces channels with only gating currents (Goodchild et al., 2012).
When other amino acid residues are substituted at position V381 in the W366F background, channels with only gating currents are also produced. Of all the mutants we tried, only W366F/V381A, W366F/V381I, and W366F/V381T produced functional channels. A bulkier amino acid such as tryptophan was not tolerated, as was leucine instead of isoleucine. It seems that slow inactivation in KV1.2 and Shaker channels is only quantitatively different. KV1.2 seems less prone to slow-inactivate due to specific amino acid differences, included those studied herein. Our data suggest that slow inactivation is produced by two distinct mechanisms, grouped under the distinction of U- and P/C-type, happening around the selectivity filter. We believe that the effects of the mutants can be interpreted in terms of a mechanism that might be responsible for the initiation and establishment of the slow-inactivated state.
A sequence of events leading to slow inactivation
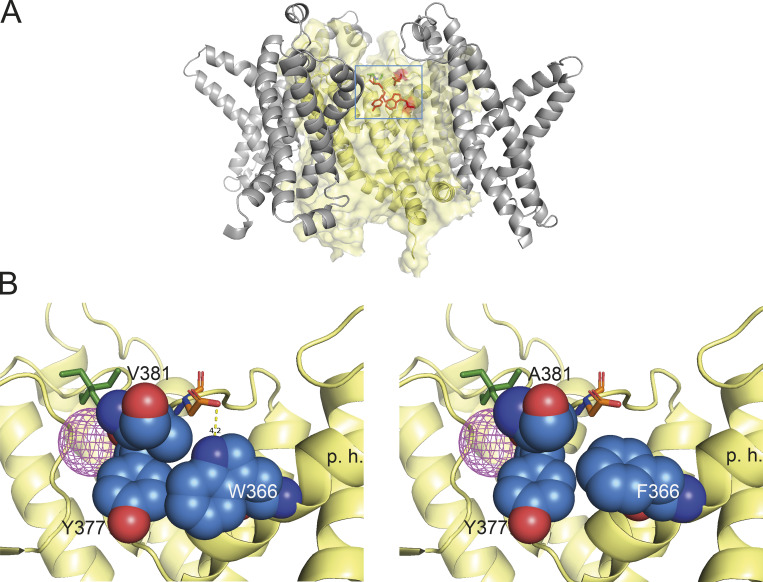
The effects of the mutants presented in this work lead us to propose a sequence of events that in conjunction constitute slow inactivation in KV1.2 channels (Fig. 9). Prolonged flux of potassium through the selectivity filter leads to a conformational change (perhaps initiated by strong electrostatic interactions) that starts at tyrosine Y377, located in the selectivity filter, and in which carbonyl oxygen forms part of the S2 potassium binding site. Rotation of this tyrosine into W366, which is initially 3–4 Å apart, will destabilize the interaction of a K+ ion with the S2 binding site in the selectivity filter. This is supported by the crystal structure of a dilated and presumably slow-inactivated selectivity filter of the KcSA channel, which features a destabilized S2 potassium-binding site (Cuello et al., 2010). Another part of the slow inactivation mechanism can be gleaned from Shaker channels. It has been shown that a hydrogen bond between W434 and D447 in the linker between selectivity filter and S5 segment (Pless et al., 2013) helps stabilize the noninactivated conformation. Neutralization of D447 leads to slow C-inactivated channels.
Figure 9.
Structural basis of modulation of inactivation by mutants at positions W366 and V381. (A) Representation of the area near the selectivity filter of the KV1.2-KV1.1 chimera, showing the residues involved in slow inactivation. The voltage-sensing domain is shown in gray ribbons and the filter domain is rendered in transparent yellow volume and ribbons. Residues W366, Y377, and V381 are shown in red. A TEA molecule is shown in green to indicate the position of the extracellular pore entrance. The blue square indicates the magnified area in B. (B) Left: Residues involved in slow inactivation near the extracellular region of the selectivity filter of the WT KV1.2-KV1.1 chimera. The spheres’ representation in colors corresponds to residues W366, V381, and Y377. Residue D379 is shown in sticks. The dotted yellow line shows the hydrogen bond between W366 and D379. Right: The double mutant W366F/V381A. The main changes in this mutant are an increased space and reduced interaction between W366F and Y377 and elimination of the hydrogen bond between W366 and D379. V381A might enhance the effects of W366F, because it should help the expansion of the space between W366F and Y377. The magenta mesh sphere is the density of a potassium ion occupying the S1 site in the selectivity filter. The green stick model is a TEA molecule occupying the S0 site. High occupancy of these two sites seems to partially antagonize slow inactivation through steric hindrance. p.h., position of the pore helix.
When a tyrosine or a phenylalanine is present at position 366 in KV1.2, not only is there more space for Y377, but also the hydrogen bond cannot be formed with D379 (equivalent to Shaker D447), so the inactivated state is favored with faster kinetics. In the double mutant W366F/V381T, this inactivated conformation will be further enhanced due to repulsive interactions between T381 and D379. The mutants W366F/V381A and W366F/V381I must produce similar end effects but through different mechanisms; the presence of A381 leaves so much empty space and no interactions with D379 that the entire molecular packing of the pore must be altered (Fig. 9 B). Similarly, I381 possibly leaves little space and pushes D379 away. The deeply inactivated behavior of the double mutant channels suggest that they could be used in structural studies as a template for the slow-inactivated state of KV1.2, possibly shedding light on the structural changes involved in the slow-inactivated states of other channels.
Overall, there are multiple inter- and intramolecular interactions leading to the slow inactivated state. The mutants that we have analyzed in KV1.2 might be involved only in the conformational changes in the external parts of the pore. If U-type inactivation is part of the slow-inactivated state, these separate conformational changes might occur in the inner pore vestibule, as has been previously suggested for Shaker channels (González-Pérez et al., 2008).
Online supplemental material
Table S1 provides the KV1.2 and Shaker inactivation time constants.
Supplementary Material
KV1.2 and Shaker inactivation time constants.
Acknowledgments
Merritt C. Maduke served as editor.
We thank Itzel Llorente from Instituto de Fisiología Celular, Universidad Nacional Autónoma de México, for technical support.
This work was financed by grants from Consejo Nacional de Ciencia y Tecnología (252644) and Dirección General de Asuntos del Personal Académico, Universidad Nacional Autónoma de México, Programa de Apoyo a Proyectos de Investigación e Innovación Tecnológica (IN209515) to L.D. Islas.
The authors declare no competing financial interests.
Author contributions: E. Suárez-Delgado carried out electrophysiology experiments and data analysis and read the manuscript. T.G. Rangel-Sandín carried out electrophysiology experiments and read the manuscript. I.G. Ishida carried out patch-clamp experiments and data analysis and contributed to making mutants. G.E. Rangel-Yescas contributed reagents, carried out molecular biology experiments, and read the paper. T. Rosenbaum conceived research and wrote and read the paper. L.D. Islas conceived research, carried out data analysis, contributed analysis programs, and wrote the paper.
References
- Andalib P., Consiglio J.F., Trapani J.G., and Korn S.J.. 2004. The external TEA binding site and C-type inactivation in voltage-gated potassium channels. Biophys. J. 87:3148–3161. 10.1529/biophysj.104.046664 [DOI] [PMC free article] [PubMed] [Google Scholar]
- Ayer R.K. Jr., and Sigworth F.J.. 1997. Enhanced closed-state inactivation in a mutant Shaker K+ channel. J. Membr. Biol. 157:215–230. 10.1007/s002329900230 [DOI] [PubMed] [Google Scholar]
- Bähring R., and Covarrubias M.. 2011. Mechanisms of closed-state inactivation in voltage-gated ion channels. J. Physiol. 589:461–479. 10.1113/jphysiol.2010.191965 [DOI] [PMC free article] [PubMed] [Google Scholar]
- Bähring R., Barghaan J., Westermeier R., and Wollberg J.. 2012. Voltage sensor inactivation in potassium channels. Front. Pharmacol. 3:100 10.3389/fphar.2012.00100 [DOI] [PMC free article] [PubMed] [Google Scholar]
- Carrillo E., Arias-Olguín I.I., Islas L.D., and Gómez-Lagunas F.. 2013. Shab K (+) channel slow inactivation: a test for U-type inactivation and a hypothesis regarding K (+) -facilitated inactivation mechanisms. Channels (Austin). 7:97–108. 10.4161/chan.23569 [DOI] [PMC free article] [PubMed] [Google Scholar]
- Cheng Y.M., Azer J., Niven C.M., Mafi P., Allard C.R., Qi J., Thouta S., and Claydon T.W.. 2011. Molecular determinants of U-type inactivation in Kv2.1 channels. Biophys. J. 101:651–661. 10.1016/j.bpj.2011.06.025 [DOI] [PMC free article] [PubMed] [Google Scholar]
- Choi K.L., Aldrich R.W., and Yellen G.. 1991. Tetraethylammonium blockade distinguishes two inactivation mechanisms in voltage-activated K+ channels. Proc. Natl. Acad. Sci. USA. 88:5092–5095. 10.1073/pnas.88.12.5092 [DOI] [PMC free article] [PubMed] [Google Scholar]
- Cordero-Morales J.F., Jogini V., Lewis A., Vásquez V., Cortes D.M., Roux B., and Perozo E.. 2007. Molecular driving forces determining potassium channel slow inactivation. Nat. Struct. Mol. Biol. 14:1062–1069. 10.1038/nsmb1309 [DOI] [PubMed] [Google Scholar]
- Cordero-Morales J.F., Jogini V., Chakrapani S., and Perozo E.. 2011. A multipoint hydrogen-bond network underlying KcsA C-type inactivation. Biophys. J. 100:2387–2393. 10.1016/j.bpj.2011.01.073 [DOI] [PMC free article] [PubMed] [Google Scholar]
- Cuello L.G., Jogini V., Cortes D.M., and Perozo E.. 2010. Structural mechanism of C-type inactivation in K(+) channels. Nature. 466:203–208. 10.1038/nature09153 [DOI] [PMC free article] [PubMed] [Google Scholar]
- De Biasi M., Hartmann H.A., Drewe J.A., Taglialatela M., Brown A.M., and Kirsch G.E.. 1993. Inactivation determined by a single site in K+ pores. Pflugers Arch. 422:354–363. 10.1007/BF00374291 [DOI] [PubMed] [Google Scholar]
- Dempster J. 2001. The Laboratory Computer. A Practical Guide for Physiologists and Neuroscientists. First edition Academic Press, London: p. 340. [Google Scholar]
- González-Pérez V., Neely A., Tapia C., González-Gutiérrez G., Contreras G., Orio P., Lagos V., Rojas G., Estévez T., Stack K., and Naranjo D.. 2008. Slow inactivation in Shaker K channels is delayed by intracellular tetraethylammonium. J. Gen. Physiol. 132:633–650. 10.1085/jgp.200810057 [DOI] [PMC free article] [PubMed] [Google Scholar]
- Goodchild S.J., Xu H., Es-Salah-Lamoureux Z., Ahern C.A., and Fedida D.. 2012. Basis for allosteric open-state stabilization of voltage-gated potassium channels by intracellular cations. J. Gen. Physiol. 140:495–511. 10.1085/jgp.201210823 [DOI] [PMC free article] [PubMed] [Google Scholar]
- Grissmer S., Nguyen A.N., Aiyar J., Hanson D.C., Mather R.J., Gutman G.A., Karmilowicz M.J., Auperin D.D., and Chandy K.G.. 1994. Pharmacological characterization of five cloned voltage-gated K+ channels, types Kv1.1, 1.2, 1.3, 1.5, and 3.1, stably expressed in mammalian cell lines. Mol. Pharmacol. 45:1227–1234. [PubMed] [Google Scholar]
- Heinemann S.H., and Conti F.. 1992. Nonstationary noise analysis and application to patch clamp recordings. Methods Enzymol. 207:131–148. [DOI] [PubMed] [Google Scholar]
- Hoshi T., and Armstrong C.M.. 2013. C-type inactivation of voltage-gated K+ channels: pore constriction or dilation? J. Gen. Physiol. 141:151–160. 10.1085/jgp.201210888 [DOI] [PMC free article] [PubMed] [Google Scholar]
- Hoshi T., Zagotta W.N., and Aldrich R.W.. 1990. Biophysical and molecular mechanisms of Shaker potassium channel inactivation. Science. 250:533–538. 10.1126/science.2122519 [DOI] [PubMed] [Google Scholar]
- Hoshi T., Zagotta W.N., and Aldrich R.W.. 1991. Two types of inactivation in Shaker K+ channels: effects of alterations in the carboxy-terminal region. Neuron. 7:547–556. 10.1016/0896-6273(91)90367-9 [DOI] [PubMed] [Google Scholar]
- Ishida I.G., Rangel-Yescas G.E., Carrasco-Zanini J., and Islas L.D.. 2015. Voltage-dependent gating and gating charge measurements in the Kv1.2 potassium channel. J. Gen. Physiol. 145:345–358. 10.1085/jgp.201411300 [DOI] [PMC free article] [PubMed] [Google Scholar]
- Jamieson Q., and Jones S.W.. 2013. Role of outer-pore residue Y380 in U-type inactivation of KV2.1 channels. J. Membr. Biol. 246:633–645. 10.1007/s00232-013-9577-0 [DOI] [PubMed] [Google Scholar]
- Klemic K.G., Kirsch G.E., and Jones S.W.. 2001. U-type inactivation of Kv3.1 and Shaker potassium channels. Biophys. J. 81:814–826. 10.1016/S0006-3495(01)75743-8 [DOI] [PMC free article] [PubMed] [Google Scholar]
- Klemic K.G., Shieh C.-C., Kirsch G.E., and Jones S.W.. 1998. Inactivation of Kv2.1 potassium channels. Biophys. J. 74:1779–1789. 10.1016/S0006-3495(98)77888-9 [DOI] [PMC free article] [PubMed] [Google Scholar]
- Kurata H.T., and Fedida D.. 2006. A structural interpretation of voltage-gated potassium channel inactivation. Prog. Biophys. Mol. Biol. 92:185–208. 10.1016/j.pbiomolbio.2005.10.001 [DOI] [PubMed] [Google Scholar]
- Kurata H.T., Doerksen K.W., Eldstrom J.R., Rezazadeh S., and Fedida D.. 2005. Separation of P/C- and U-type inactivation pathways in Kv1.5 potassium channels. J. Physiol. 568:31–46. 10.1113/jphysiol.2005.087148 [DOI] [PMC free article] [PubMed] [Google Scholar]
- Levy D.I., and Deutsch C.. 1996. Recovery from C-type inactivation is modulated by extracellular potassium. Biophys. J. 70:798–805. 10.1016/S0006-3495(96)79619-4 [DOI] [PMC free article] [PubMed] [Google Scholar]
- Long S.B., Campbell E.B., and Mackinnon R.. 2005. Crystal structure of a mammalian voltage-dependent Shaker family K+ channel. Science. 309:897–903. 10.1126/science.1116269 [DOI] [PubMed] [Google Scholar]
- Long S.B., Tao X., Campbell E.B., and MacKinnon R.. 2007. Atomic structure of a voltage-dependent K+ channel in a lipid membrane-like environment. Nature. 450:376–382. 10.1038/nature06265 [DOI] [PubMed] [Google Scholar]
- Loots E., and Isacoff E.Y.. 1998. Protein rearrangements underlying slow inactivation of the Shaker K+ channel. J. Gen. Physiol. 112:377–389. 10.1085/jgp.112.4.377 [DOI] [PMC free article] [PubMed] [Google Scholar]
- López-Barneo J., Hoshi T., Heinemann S.H., and Aldrich R.W.. 1993. Effects of external cations and mutations in the pore region on C-type inactivation of Shaker potassium channels. Receptors Channels. 1:61–71. [PubMed] [Google Scholar]
- Matthies D., Bae C., Toombes G.E.S., Fox T., Bartesaghi A., Subramaniam S., and Swartz K.J.. 2018. Single-particle cryo-EM structure of a voltage-activated potassium channel in lipid nanodiscs. eLife. 7:e37558 10.7554/eLife.37558 [DOI] [PMC free article] [PubMed] [Google Scholar]
- Molina A., Castellano A.G., and López-Barneo J.. 1997. Pore mutations in Shaker K+ channels distinguish between the sites of tetraethylammonium blockade and C-type inactivation. J. Physiol. 499:361–367. 10.1113/jphysiol.1997.sp021933 [DOI] [PMC free article] [PubMed] [Google Scholar]
- National Research Council 2010. Guide for the care and use of laboratory animals. National Academies Press, Washington, DC. [Google Scholar]
- Olcese R., Latorre R., Toro L., Bezanilla F., and Stefani E.. 1997. Correlation between charge movement and ionic current during slow inactivation in Shaker K+ channels. J. Gen. Physiol. 110:579–589. 10.1085/jgp.110.5.579 [DOI] [PMC free article] [PubMed] [Google Scholar]
- Oliva C., González V., and Naranjo D.. 2005. Slow inactivation in voltage gated potassium channels is insensitive to the binding of pore occluding peptide toxins. Biophys. J. 89:1009–1019. 10.1529/biophysj.105.060152 [DOI] [PMC free article] [PubMed] [Google Scholar]
- Pau V., Zhou Y., Ramu Y., Xu Y., and Lu Z.. 2017. Crystal structure of an inactivated mutant mammalian voltage-gated K+ channel. Nat. Struct. Mol. Biol. 24:857–865. 10.1038/nsmb.3457 [DOI] [PMC free article] [PubMed] [Google Scholar]
- Perozo E., MacKinnon R., Bezanilla F., and Stefani E.. 1993. Gating currents from a nonconducting mutant reveal open-closed conformations in Shaker K+ channels. Neuron. 11:353–358. 10.1016/0896-6273(93)90190-3 [DOI] [PubMed] [Google Scholar]
- Pless S.A., Galpin J.D., Niciforovic A.P., Kurata H.T., and Ahern C.A.. 2013. Hydrogen bonds as molecular timers for slow inactivation in voltage-gated potassium channels. eLife. 2:e01289 10.7554/eLife.01289 [DOI] [PMC free article] [PubMed] [Google Scholar]
- Rettig J., Heinemann S.H., Wunder F., Lorra C., Parcej D.N., Dolly J.O., and Pongs O.. 1994. Inactivation properties of voltage-gated K+ channels altered by presence of β-subunit. Nature. 369:289–294. 10.1038/369289a0 [DOI] [PubMed] [Google Scholar]
- Roberds S.L., and Tamkun M.M.. 1991. Cloning and tissue-specific expression of five voltage-gated potassium channel cDNAs expressed in rat heart. Proc. Natl. Acad. Sci. USA. 88:1798–1802. 10.1073/pnas.88.5.1798 [DOI] [PMC free article] [PubMed] [Google Scholar]
- Sigworth F.J. 1980. The variance of sodium current fluctuations at the node of Ranvier. J. Physiol. 307:97–129. 10.1113/jphysiol.1980.sp013426 [DOI] [PMC free article] [PubMed] [Google Scholar]
- Tao X., and MacKinnon R.. 2008. Functional analysis of Kv1.2 and paddle chimera Kv channels in planar lipid bilayers. J. Mol. Biol. 382:24–33. 10.1016/j.jmb.2008.06.085 [DOI] [PMC free article] [PubMed] [Google Scholar]
- Vergara-Jaque A., Palma-Cerda F., Lowet A.S., de la Cruz Landrau A., Poblete H., Sukharev A., Comer J., and Holmgren M.. 2019. A Structural Model of the Inactivation Gate of Voltage-Activated Potassium Channels. Biophys. J. 117:377–387. 10.1016/j.bpj.2019.06.008 [DOI] [PMC free article] [PubMed] [Google Scholar]
- Yang Y., Yan Y., and Sigworth F.J.. 1997. How does the W434F mutation block current in Shaker potassium channels? J. Gen. Physiol. 109:779–789. 10.1085/jgp.109.6.779 [DOI] [PMC free article] [PubMed] [Google Scholar]
Associated Data
This section collects any data citations, data availability statements, or supplementary materials included in this article.
Supplementary Materials
KV1.2 and Shaker inactivation time constants.


