An official website of the United States government
Here's how you know
Official websites use .gov
A
.gov website belongs to an official
government organization in the United States.
Secure .gov websites use HTTPS
A lock (
) or https:// means you've safely
connected to the .gov website. Share sensitive
information only on official, secure websites.
As a library, NLM provides access to scientific literature. Inclusion in an NLM database does not imply endorsement of, or agreement with,
the contents by NLM or the National Institutes of Health.
Learn more:
PMC Disclaimer
|
PMC Copyright Notice
. 2017 Jun 1;2017:192, Part 1.
Multicenter Ozone Study in oldEr Subjects (MOSES): Part 1. Effects of Exposure to Low Concentrations of Ozone on Respiratory and Cardiovascular Outcomes
Res Rep Health Eff Inst. 2017 Jun 1;2017:192, Part 1.
Health Effects of Low-Level Ozone Exposure in Older Volunteers
This Statement, prepared by the Health Effects Institute, summarizes a research project funded by HEI and conducted by Drs. Mark W. Frampton, Pulmonary & Critical Care, University of Rochester Medical Center, Rochester, NY; John R. Balmes, University of California–San Francisco; Philip A. Bromberg of the University of North Carolina–Chapel Hill; and Paul Stark of the New England Research Institute, Watertown, Massachusetts, and their colleagues. Research Report 192, Part 1 contains both the detailed Investigators’ Report and a Commentary on the study prepared by the Institute’s MOSES Review Panel.
Ozone has been associated with adverse health effects in children and adults. Its effects on the respiratory system are well established and include worsening of asthma symptoms (acute effects), increases in deaths and hospital admissions for respiratory illnesses such as chronic obstructive pulmonary disease and asthma (acute and chronic effects), reduced lung growth, and higher risk of developing asthma (chronic effects). More recent epidemiological studies have reported that short-term exposure to ozone is associated with adverse cardiovascular outcomes, including an increased risk of cardiovascular mortality. The effects of ozone on the respiratory system are relatively well characterized, but its effects on the cardiovascular system are not. In view of the epidemiological findings, it has been suggested that ozone may lead to adverse cardiovascular health effects at concentrations at or below the current U.S. ambient air quality standard. Thus, research is needed to investigate the cardiovascular effects of ozone, particularly at concentrations near those of present-day ambient levels.
Ozone is an oxidant gas that readily reacts with other molecules. After inhalation, ozone reacts with constituents of the lung lining fluid to generate reactive oxygen species that can cause localized oxidative stress in the lung, leading to lung irritation. With repeated exposure, oxidative stress may lead to lung injury and chronic lung disease. Ozone may have effects on the cardiovascular and other organ systems through systemic inflammation, oxidative stress, or changes in activity of the autonomic nervous system, which could lead to changes in heart rhythm, endothelial dysfunction, constriction of arteries, and blood clotting.
In 2010, HEI issued Request for Applications 10-1, Cardiovascular Effects of Exposure to Low Levels of Ozone in the Presence or Absence of Other Ambient Pollutants, to solicit responses from clinical research centers that were equipped to conduct human exposure studies, with the goal of creating a multicenter ozone study. Three centers, led by Dr. John Balmes at the University of California–San Francisco, Dr. Philip Bromberg at the University of North Carolina–Chapel Hill, and Dr. Mark Frampton at the University of Rochester Medical Center, New York, were selected to participate in the study, which was named the Multicenter Ozone Study in oldEr Subjects (MOSES). In addition, the New England Research Institute was selected through a 2010 Request for Qualifications for a Data Analysis Center to serve as the data coordinating center for the study. HEI formed a special MOSES Oversight Committee to provide input during the study design and research phases.
What This Study Adds.
Ozone exposure has been associated with acute and chronic respiratory effects, and there is some evidence of cardiovascular effects. However, it is unclear whether ozone has short-term cardiovascular effects at present-day ambient levels.
This study measured a large number of cardiovascular and respiratory endpoints in 87 healthy, older participants who were exposed to 0, 70, or 120 parts per billion ozone for 3 hours while exercising moderately.
There was no convincing evidence that ozone exposure in this large study of older, healthy adults affected the primary cardiovascular endpoints identified by the investigators. The observed lack of cardiovascular effects may not be generalizable to the overall adult population, which may include people who are less healthy and who are exposed to multiple pollutants.
The study found moderate effects on lung function and on two markers of lung injury and inflammation in these healthy, older adults (a population that had not often been studied in the past), and provides confirmation of ozone effects on the lung at concentrations similar to the current air quality standard.
APPROACH
The MOSES project was funded to study the effects of short-term exposure to ozone on the cardiovascular and respiratory systems in older participants, a population presumed to be more susceptible to its effects. The study focused on low ozone concentrations (70 and 120 parts per billion [ppb]), relevant to those observed in ambient air in the United States. The three MOSES teams, with input from HEI, developed a common protocol for exposing human volunteers to ozone. Each center planned to recruit and test about 30 participants for a total of 90. Exposures took place from mid-2012 to mid-2015. Each participant was invited to a screening visit, a training visit, and three exposure sessions (randomized at 0, 70, and 120 ppb ozone). Exposures lasted 3 hours, during which the participants exercised on a stationary bicycle, alternating 15 minutes of exercise with 15 minutes of rest. Participants stayed at a hotel the night before testing to minimize variability in exposure to ambient air pollutants and were evaluated the day before, during, and up to 22 hours after exposure.
The investigators measured a large suite of endpoints, including changes in autonomic nervous system function, heart rhythm, blood pressure, and pulmonary function, as well as markers of endothelial function, thrombosis, lung injury, and both systemic and lung inflammation (see Statement Figure). They specified in advance a key group of cardiovascular endpoints as primary; all other endpoints were secondary. Most outcomes were assessed at designated central laboratories that handled samples or electrocardiographic recordings from all three clinical centers in order to standardize outcome assessment. Study participants were also genotyped for glutathione S-transferase mu 1 (GSTM1), a gene involved in antioxidant defenses. Individuals who lack the GSTM1 gene may be at increased risk for acute health effects.
Possible pathways by which ozone may cause adverse health effects. Pathways evaluated in MOSES are shown in boldface; the number of endpoints evaluated is shown in brackets. Adapted from Investigators’ Report, Figure 1.
A statistical analysis plan was developed and power calculations performed with input from investigators at the three clinical centers and the HEI MOSES Oversight Committee. Results were analyzed by mixed-effects linear models, adjusting for the three centers and multiple time points, and presented as the difference between pre-exposure and post-exposure values. The investigators tested whether the effects of ozone on each endpoint varied by subgroups defined by sex, age, or GSTM1 status. The statistical significance threshold was set at P < 0.01 to reduce concerns over multiple comparisons.
At the request of the HEI Research Committee, the investigators measured each participant’s exposure to ozone and nitrogen dioxide using a personal sampler for 72 hours before the pre-exposure visit. They also collected air quality data for ozone, fine particulate matter, nitrogen dioxide, sulfur dioxide, and carbon monoxide from central monitors closest to each clinical center. A forthcoming report (Multicenter Ozone Study in oldEr Subjects, Part 2) will describe analyses that include the pre-exposure pollutant data, as well as several sets of sensitivity analyses conducted by the investigators.
KEY RESULTS
The three centers successfully recruited and tested 87 participants (ages 55–70 years) who completed all visits. Analyses of the primary cardiovascular endpoints showed no statistically significant effects of ozone exposure at 70 or 120 ppb on autonomic nervous system function, cardiac electrical repolarization, or cardiac arrhythmia. In addition, ozone exposure did not lead to statistically significant changes in oxidative stress or in markers of systemic inflammation, vascular function, or prothrombotic status. The only changes associated with ozone exposure seen in cardiovascular endpoints were an increase in the secondary endpoint plasma endothelin-1 (a marker of vascular function) and a decrease in nitrotyrosine (a marker of oxidative stress) after exposure to 120 ppb, but not 70 ppb, ozone.
On the other hand, the MOSES study confirmed that ozone has effects on the respiratory system even at these low concentrations, even though cardiac effects were not observed. In these older volunteers, moderate exercise during clean air exposure (0 ppb) led to an increased forced vital capacity (FVC) and forced expiratory volume in 1 second (FEV1) 15 minutes after exposure compared with pre-exposure values, and they remained significantly higher after 22 hours. However, these improvements in lung function were attenuated after ozone exposure in a dose–response manner at 70 and 120 ppb. In addition, ozone exposure at 120 ppb significantly increased the percentage of polymorphonuclear leukocytes (a marker of lung inflammation; also referred to as “neutrophils”) in sputum as well as of club cell 16 (a marker of airway epithelial cell injury) in blood 22 hours later, compared with clean air exposure. In contrast, changes in sputum concentrations of the inflammatory markers interleukin-6, interleukin-8, and tumor necrosis factor-alpha were not statistically significant. There was no evidence of statistically significant interactions between sex, age, or GSTM1 status and the observed changes in lung function, sputum polymorphonuclear leukocytes, or plasma club cell 16 after ozone exposure.
EVALUATION
In its independent review of the study, a specially convened HEI MOSES Review Panel commended the investigators for a well-designed and executed study. A key strength of the study was the double-blind crossover design with controlled exposures at three concentrations. The Review Panel also noted that the number of participants in the MOSES study was considerably larger than in previous human exposure studies conducted to date and thought the study had sufficient statistical power to detect meaningful changes in the primary outcomes. The study efficiently collected information on a comprehensive array of cardiovascular endpoints, probing a variety of potential mechanistic or pathophysiological pathways, as well as several respiratory endpoints.
The Panel agreed with the investigators’ conclusions that ozone exposure at 70 or 120 ppb for three hours did not lead to detectable changes in cardiovascular endpoints in this healthy group of older participants. Changes were observed in only two of the many cardiovascular endpoints: an increase in endothelin-1 and a decrease in nitrotyrosine. The nitrotyrosine changes were in the opposite direction of what would be hypothesized to be on the pathway to an ozone effect and remain unexplained. The Panel also agreed with the investigators’ conclusions that exposure to 70 and 120 ppb led to significant changes in lung function and two markers in the lung and blood that were consistent with ozone-induced injury to the airways. The pulmonary results in older adults are consistent with the results of other studies in younger volunteers showing lung effects after ozone exposures at concentrations resembling the current U.S. 8-hour ambient air quality standard for ozone of 70 ppb.
The Panel also agreed with the investigators that a major limitation of the study was that the participants were healthy. By design, participants were selected to have a normal body mass index and FEV1; were able to perform moderate, intermittent exercise for three hours; and were able to abstain from a specified list of medications for one week. Thus, the study sample represented an older, but very healthy, mostly Caucasian segment of the population. Additionally, the study was limited — also by design — to acute exposures to primary ozone without reaction products and without co-exposure to other pollutants common in ambient air. Therefore, the observed lack of cardiovascular effects may not be generalizable to the overall adult population, which includes people who are less healthy and who are exposed to multiple pollutants. The emerging epidemiological evidence finding associations of cardiovascular effects with exposure to ozone may reflect susceptible members of the population who are unable to participate in clinical studies.
Because there was considerable variability in outcome values among participants, the Review Panel asked the investigators to evaluate whether a subgroup existed that showed larger changes in lung function or in sputum polymorphonuclear leukocytes after ozone exposure than other subgroups and which may have also shown effects on the cardiovascular system that were not evident in the group as a whole. However, detailed statistical analyses did not find evidence of the presence of such a responder group.
CONCLUSIONS
The Multicenter Ozone Study in oldEr Subjects was a large, well-conducted study in 87 healthy adults (55–70 years old) that showed the following important results: (1) there was no convincing evidence that a 3-hour exposure to 70 or 120 ppb ozone with moderate exercise affected cardiovascular endpoints in these healthy older adults; (2) short-term exposures at these low ozone concentrations did produce moderate pulmonary effects, showing results similar to previous studies in younger adults; and (3) no responder subgroup could be identified in which ozone elicited cardiovascular effects that were not evident in the group as a whole. The MOSES Review Panel agreed with the main findings of the study and commended the investigator teams for the high quality of the data and analyses. The respiratory effects observed after ozone exposure are consistent with the results of other studies showing such effects at current ambient ozone concentrations. Because the volunteers in this study were healthy, the results may not be generalizable to the overall adult population.
Res Rep Health Eff Inst. 2017 Jun 1;2017:192, Part 1.
Multicenter Ozone Study in oldEr Subjects (MOSES): Part 1. Effects of Exposure to Low Concentrations of Ozone on Respiratory and Cardiovascular Outcomes
1University of Rochester Medical Center, Rochester, New York
2University of California at San Francisco
3University of North Carolina at Chapel Hill
4New England Research Institute, Watertown, Massachusetts
5Health Effects Institute, Boston, Massachusetts
This Investigators’ Report is one part of Health Effects Institute Research Report 192, which also includes a Commentary by the MOSES Review Panel and an HEI Statement about the research project. Correspondence concerning the Investigators’ Report may be addressed to Dr. Mark W. Frampton, Pulmonary & Critical Care, University of Rochester Medical Center, 601 Elmwood Ave., Box 692, Rochester, NY 14642-8692; e-mail: mark_frampton@urmc.rochester.edu.
Although this document was produced with partial funding by the United States Environmental Protection Agency under Assistance Award CR–83467701 to the Health Effects Institute, it has not been subjected to the Agency’s peer and administrative review and therefore may not necessarily reflect the views of the Agency, and no official endorsement by it should be inferred. The contents of this document also have not been reviewed by private party institutions, including those that support the Health Effects Institute; therefore, it may not reflect the views or policies of these parties, and no endorsement by them should be inferred.
Exposure to air pollution is a well-established risk factor for cardiovascular morbidity and mortality. Most of the evidence supporting an association between air pollution and adverse cardiovascular effects involves exposure to particulate matter (PM**). To date, little attention has been paid to acute cardiovascular responses to ozone, in part due to the notion that ozone causes primarily local effects on lung function, which are the basis for the current ozone National Ambient Air Quality Standards (NAAQS). There is evidence from a few epidemiological studies of adverse health effects of chronic exposure to ambient ozone, including increased risk of mortality from cardiovascular disease. However, in contrast to the well-established association between ambient ozone and various nonfatal adverse respiratory effects, the observational evidence for impacts of acute (previous few days) increases in ambient ozone levels on total cardiovascular mortality and morbidity is mixed.
Ozone is a prototypic oxidant gas that reacts with constituents of the respiratory tract lining fluid to generate reactive oxygen species (ROS) that can overwhelm antioxidant defenses and cause local oxidative stress. Pathways by which ozone could cause cardiovascular dysfunction include alterations in autonomic balance, systemic inflammation, and oxidative stress. These initial responses could lead ultimately to arrhythmias, endothelial dysfunction, acute arterial vasoconstriction, and procoagulant activity. Individuals with impaired antioxidant defenses, such as those with the null variant of glutathione S-transferase mu 1 (GSTM1), may be at increased risk for acute health effects.
The Multicenter Ozone Study in oldEr Subjects (MOSES) was a controlled human exposure study designed to evaluate whether short-term exposure of older, healthy individuals to ambient levels of ozone induces acute cardiovascular responses. The study was designed to test the a priori hypothesis that short-term exposure to ambient levels of ozone would induce acute cardiovascular responses through the following mechanisms: autonomic imbalance, systemic inflammation, and development of a prothrombotic vascular state. We also postulated a priori the confirmatory hypothesis that exposure to ozone would induce airway inflammation, lung injury, and lung function decrements. Finally, we postulated the secondary hypotheses that ozone-induced acute cardiovascular responses would be associated with:
increased systemic oxidative stress and lung effects, and
the GSTM1-null genotype.
METHODS
The study was conducted at three clinical centers with a separate Data Coordinating and Analysis Center (DCAC) using a common protocol. All procedures were approved by the institutional review boards (IRBs) of the participating centers. Healthy volunteers 55 to 70 years of age were recruited. Consented participants who successfully completed the screening and training sessions were enrolled in the study. All three clinical centers adhered to common standard operating procedures (SOPs) and used common tracking and data forms. Each subject was scheduled to participate in a total of 11 visits: screening visit, training visit, and three sets of exposure visits, each consisting of the preexposure day, the exposure day, and the post-exposure day. The subjects spent the night in a nearby hotel the night of the pre-exposure day.
On exposure days, the subjects were exposed for three hours in random order to 0 ppb ozone (clean air), 70 ppb ozone, and 120 ppm ozone, alternating 15 minutes of moderate exercise with 15 minutes of rest. A suite of cardiovascular and pulmonary endpoints was measured on the day before, the day of, and up to 22 hours after, each exposure. The endpoints included: (1) electrocardiographic changes (continuous Holter monitoring: heart rate variability [HRV], repolarization, and arrhythmia); (2) markers of inflammation and oxidative stress (C-reactive protein [CRP], interleukin-6 [IL-6], 8-isoprostane, nitrotyrosine, and P-selectin); (3) vascular function measures (blood pressure [BP], flow-mediated dilatation [FMD] of the brachial artery, and endothelin-1 [ET-1]; (4) venous blood markers of platelet activation, thrombosis, and microparticle-associated tissue factor activity (MP-TFA); (5) pulmonary function (spirometry); (6) markers of airway epithelial cell injury (increases in plasma club cell protein 16 [CC16] and sputum total protein); and (7) markers of lung inflammation in sputum (polymorphonuclear leukocytes [PMN], IL-6, interleukin-8 [IL-8], and tumor necrosis factor-alpha [TNF-α]). Sputum was collected only at 22 hours after exposure.
The analyses of the continuous electrocardiographic monitoring, the brachial artery ultrasound (BAU) images, and the blood and sputum samples were carried out by core laboratories. The results of all analyses were submitted directly to the DCAC.
The variables analyzed in the statistical models were represented as changes from pre-exposure to post-exposure (post-exposure minus pre-exposure). Mixed-effect linear models were used to evaluate the impact of exposure to ozone on the prespecified primary and secondary continuous outcomes. Site and time (when multiple measurements were taken) were controlled for in the models. Three separate interaction models were constructed for each outcome: ozone concentration by subject sex; ozone concentration by subject age; and ozone concentration by subject GSTM1 status (null or sufficient). Because of the issue of multiple comparisons, the statistical significance threshold was set a priori at P < 0.01.
RESULTS
Subject recruitment started in June 2012, and the first subject was randomized on July 25, 2012. Subject recruitment ended on December 31, 2014, and testing of all subjects was completed by April 30, 2015. A total of 87 subjects completed all three exposures. The mean age was 59.9 ± 4.5 years, 60% of the subjects were female, 88% were white, and 57% were GSTM1 null. Mean baseline body mass index (BMI), BP, cholesterol (total and low-density lipoprotein), and lung function were all within the normal range.
We found no significant effects of ozone exposure on any of the primary or secondary endpoints for autonomic function, repolarization, ST segment change, or arrhythmia. Ozone exposure also did not cause significant changes in the primary endpoints for systemic inflammation (CRP) and vascular function (systolic blood pressure [SBP] and FMD) or secondary endpoints for systemic inflammation and oxidative stress (IL-6, P-selectin, and 8-isoprostane). Ozone did cause changes in two secondary endpoints: a significant increase in plasma ET-1 (P = 0.008) and a marginally significant decrease in nitrotyrosine (P = 0.017). Lastly, ozone exposure did not affect the primary prothrombotic endpoints (MP-TFA and monocyte–platelet conjugate count) or any secondary markers of prothrombotic vascular status (platelet activation, circulating microparticles [MPs], von Willebrand factor [vWF], or fibrinogen.)
Although our hypothesis focused on possible acute cardiovascular effects of exposure to low levels of ozone, we recognized that the initial effects of inhaled ozone involve the lower airways. Therefore, we looked for: (a) changes in lung function, which are known to occur during exposure to ozone and are maximal at the end of exposure; and (b) markers of airway injury and inflammation. We found an increase in forced vital capacity (FVC) and forced expiratory volume in 1 second (FEV1) after exposure to 0 ppb ozone, likely due to the effects of exercise. The FEV1 increased significantly 15 minutes after 0 ppb exposure (85 mL; 95% confidence interval [CI], 64 to 106; P < 0.001), and remained significantly increased from pre-exposure at 22 hours (45 mL; 95% CI, 26 to 64; P < 0.001). The increase in FVC followed a similar pattern. The increase in FEV1 and FVC were attenuated in a dose–response manner by exposure to 70 and 120 ppb ozone. We also observed a significant ozone-induced increase in the percentage of sputum PMN 22 hours after exposure at 120 ppb compared to 0 ppb exposure (P = 0.003). Plasma CC16 also increased significantly after exposure to 120 ppb (P < 0.001). Sputum IL-6, IL-8, and TNF-α concentrations were not significantly different after ozone exposure. We found no significant interactions with sex, age, or GSTM1 status regarding the effect of ozone on lung function, percentage of sputum PMN, or plasma CC16.
CONCLUSIONS
In this multicenter clinical study of older healthy subjects, ozone exposure caused concentration-related reductions in lung function and presented evidence for airway inflammation and injury. However, there was no convincing evidence for effects on cardiovascular function. Blood levels of the potent vasoconstrictor, ET-1, increased with ozone exposure (with marginal statistical significance), but there were no effects on BP, FMD, or other markers of vascular function. Blood levels of nitrotyrosine decreased with ozone exposure, the opposite of our hypothesis. Our study does not support acute cardiovascular effects of low-level ozone exposure in healthy older subjects. Inclusion of only healthy older individuals is a major limitation, which may affect the generalizability of our findings. We cannot exclude the possibility of effects with higher ozone exposure concentrations or more prolonged exposure, or the possibility that subjects with underlying vascular disease, such as hypertension or diabetes, would show effects under these conditions.
INTRODUCTION
Exposure to air pollution is a well-established risk factor for cardiovascular morbidity and mortality. Most of the evidence supporting an association between air pollution and adverse cardiovascular effects involves exposure to PM, but recently increased attention has been paid to the potential cardiovascular toxicity of ozone because several epidemiological studies have shown an association between exposure to ozone and mortality (U.S. Environmental Protection Agency [U.S. EPA] 2013).
Tropospheric ozone is a ubiquitous air pollutant that is formed when nitrogen oxides and volatile organic compounds react in the atmosphere in the presence of sunlight. It is one of six pollutants for which the U.S. EPA sets a NAAQS to protect public health with an adequate margin of safety, as required by the Clean Air Act. The current ozone NAAQS, 70 ppb averaged over 8 hours, was promulgated in October 2015 (U.S. EPA 2015).
The new 70 ppb standard is based on an expanded body of clinical and epidemiological studies, which are reviewed in the U.S. EPA’s Integrated Science Assessment (U.S. EPA 2013). The main drivers of the standard are the respiratory effects observed in epidemiological studies and in environmental chamber exposure studies at concentrations as low as 70 ppb (Schelegle et al. 2009) and 60 ppb (Adams 2006; Kim et al. 2011). These effects include acute decrements in pulmonary function as well as lung inflammation, respiratory symptoms, and respiratory mortality and morbidity. The U.S. EPA also noted that animal toxicological and controlled exposure studies “provide initial biological plausibility for the consistently positive associations observed in epidemiologic studies of short-term O3 exposure and cardiovascular mortality,” and concluded that “overall, the body of evidence indicates that there is likely to be a causal relationship between short-term exposures to O3 and cardiovascular effects, including cardiovascular mortality.” The relevant literature is summarized below, followed by a discussion of the possible mechanisms by which ozone (O3) may affect the cardiovascular system.
OZONE AND ACUTE CARDIOVASCULAR EFFECTS
In contrast to the well-established association between ambient ozone and various nonfatal adverse respiratory effects, the observational evidence for impacts of acute (previous few days) increases in ambient ozone levels on total cardiovascular mortality and morbidity is mixed. In a study using the National Morbidity, Mortality, and Air Pollution Study (NMMAPS) data set, which covered approximately 100 U.S. cities, Bell and colleagues (2004) reported a 0.64% increase in the risk of cardiovascular and respiratory mortality (95% CI, 0.31% to 0.98%) associated with each 10-ppb increase in the previous week’s ozone concentration. Sensitivity analyses of the NMMAPS data showed that the results were sensitive to modelling choices and data selection (Smith et al. 2009). However, Bravo and colleagues (2015) reported no such acute association between increased ozone concentrations and cardiovascular mortality in the population of São Paolo, Brazil. Others have reported increased risks of cardiovascular and/or cerebrovascular hospital and emergency room admissions associated with increased ozone concentrations in the previous few days (Ballester et al. 2006; Chan et al. 2006; Chang et al. 2005; Halonen et al. 2009; Lee et al. 2003; Rodopoulou et al. 2014; Szyszkowicz 2008), while others have not (Barnett et al. 2006; Corea et al. 2012; Franck et al. 2014; Fung et al. 2005; Sarnat et al. 2015; Symons et al. 2006; Tolbert et al. 2007; Zanobetti and Schwartz 2006). Most of these studies examined associations between health outcomes and multiple pollutants.
With regard to specific cardiovascular and cerebrovascular outcomes, some but not all studies have reported associations between acute changes in ambient ozone concentrations and myocardial infarction (Mustafic et al. 2012), heart failure (Shah et al. 2013), stroke (Shah et al. 2015), and ventricular and atrial arrhythmias (Link et al. 2013; Metzger et al. 2007; Rich et al. 2004; Rich et al. 2005, 2006a,b; Vedal et al. 2004). In a meta-analysis of ambient air pollutants and triggering of myocardial infarction, Mustafic and colleagues (2012) reported an increased risk of myocardial infarction associated with PM2.5 (PM with an aerodynamic diameter ≤2.5 μm), nitrogen dioxide (NO2), sulfur dioxide (SO2), and carbon monoxide (CO), but not ozone (relative risk [RR] = 1.003; 95% CI, 0.997 to 1.010), while a meta-analysis by Shah and colleagues (2013) similarly reported an increased risk of heart failure hospitalizations associated with increased concentrations of SO2, NO2, CO, and PM2.5, but not ozone (RR = 1.0046; 95% CI, 0.9990 to 1.0102). In contrast, in a meta-analysis of stroke hospital admissions, Shah and colleagues (2015) reported an increased risk of stroke hospitalizations associated with increased concentrations of ozone, SO2, NO2, PM2.5, and PM10 in the previous 3 days, with the weakest association being with ozone (RR = 1.001; 95% CI, 1.000 to 1.002). However, these effect estimates are all similar in size, with interpretations appearing to differ only by statistical significance, perhaps reflecting the number of studies used in each meta-analysis. Thus, taken together, the metaanalyses appear to support a very small increased risk of acute cardiovascular events associated with increased ozone concentrations in the previous few days.
Many of these epidemiological studies are limited by common problems of small sample size and likely exposure misclassification, resulting in reduced statistical power and bias toward the null. Controlled exposure studies at levels relevant to low ambient concentrations are needed to explore the mechanistic basis for the associations observed in epidemiological studies between short-term exposures to ozone and acute cardiovascular disease outcomes and to identify markers of effect that would be useful in future observational (e.g., panel) studies. Controlled exposure approaches focusing on older adults might be especially useful, because aging increases the risk of cardiovascular disease and may alter acute cardiovascular responses to inhaled ozone. That said, it is also important to note that the results of controlled human exposure studies may shed little light on health effects related to chronic exposures.
Only a few controlled-exposure studies have examined acute cardiovascular responses to ozone exposure. Gong and colleagues measured cardiovascular physiological parameters in 6 healthy and 10 hypertensive volunteers exposed to 300 ppb ozone for three hours with intermittent exercise (Gong et al. 1998). Ozone appeared to increase the heart rate (HR)–BP product (a measure of myocardial workload) and impair pulmonary gas exchange, but the study was limited by a small sample size and failure to randomize the exposure sequence. Brook and colleagues (2002) found brachial artery vasoconstriction, but no change in FMD, in healthy adults after two hours of exposure to a mixture of 150 μg/m3 concentrated ambient fine particles and 120 ppb ozone. Brook and colleagues (2009) later evaluated the cardiovascular effects of a 2-hour 120 ppb ozone exposure in healthy volunteers at rest, as part of a larger study comparing the effects of ozone and PM. Ozone exposure was not associated with any changes in HRV, BP, CRP and other markers of systemic inflammation, or vascular function.
More recently, two clinical studies (Arjomandi et al. 2015; Devlin et al. 2012) in young healthy subjects, at ozone concentrations sufficient to elicit changes in pulmonary function (100 ppb for 4 hours and 300 ppb for 2 hours, respectively, with intermittent exercise), found effects on frequency-domain HRV (decreases in high frequency [HF] power band 0.15–0.40 Hz]) and increased systemic inflammation. However, in 36 healthy men Barath and colleagues (2013) found no effects on HRV of 300 ppb ozone for 75 minutes, with intermittent exercise. They actually observed an ozone-induced increase in forearm vascular responsiveness to acetylcholine. Frampton and colleagues (2015) found no effects of 3-hour exposures to 100 and 200 ppb ozone, with intermittent exercise, on measures of systemic and pulmonary vascular function, impedance cardiography, blood MPs, or blood platelet activation. Thus, findings from clinical studies on the cardiovascular effects of ozone are inconsistent, and there are no studies focusing on effects in older subjects.
Studies in rodents have provided some evidence for acute effects of ozone on markers of cardiovascular function and systemic stress responses. Most studies used exposure concentrations of approximately 400–500 ppb. While these concentrations substantially exceed ambient concentrations, rodents are known to be relatively resistant to ozone respiratory effects, in part because of effective nasal scrubbing. Chuang and colleagues (2009) found that, in 6-week old C57Bl/6 mice, 500 ppb ozone exposure for eight hours increased heart rate about 6%, without changes in BP. Consecutive daily exposures for 5 days increased mean and diastolic BP as well as heart rate. The nitrite + nitrate content of aortic tissue was reduced with both 1 and 5 days of exposure, perhaps due to a reduction in eNOS protein level. In general however, single exposures produced fewer significant effects than five consecutive daily exposures. Interestingly, 8-isoprostane levels were not increased in either lung or aortic tissue after a single exposure, but both were increased after 5-day exposures.
Hamade and colleagues (2008) examined cardiac effects in three strains of mice following acute ozone (~600 ppb) and PM (fine mode carbon black) exposures. Among their various exposure protocols, the sequence of two hours of ozone followed by three hours of carbon black had the largest effect on HRV (in the time domain but not the frequency domain), and on heart rate — although heart rate in this study decreased rather than increased as reported by Chuang and colleagues (2009). The two C3H mouse strains (HeJ and OuJ) reacted similarly, but the C57Bl/6J strain was relatively nonreactive. Hamade and colleagues (2010) went on to examine age-related effects of these exposure protocols and suggest that “… age considerably attenuates physiologic responses to O3 … exposures.”
Other studies have suggested that higher concentrations and/or repeated exposures are required to induce cardiovascular responses in rats. For example, rats showed an increase in plasma ET-1 immediately after exposure to 800, but not 400 ppb, ozone for four hours (Thomson et al. 2005). Kodavanti and colleagues (2011) found increases in mRNA expression in the aorta (but not in cardiac ventricular tissue) of biomarkers of oxidative stress, thrombosis, and vascular function after exposure to 380 ppb ozone 5 hours/day for 16 weeks, but fewer effects after exposure to 500 ppb ozone 5 hours/day for 2 days.
Since ozone has been shown to activate transient receptor potential (TRP)A1 cation channels on nociceptive non-myelinated vagal C fibers in the airways (Taylor-Clark and Undem 2010), a role for ozone-induced autonomic nervous system synaptic reflexes in altering cardiac electrophysiology (as well as causing involuntary inhibition of full inspiration) is generally accepted. Gackiere and colleagues (2011) provided evidence in rats that stimulation of airway receptors by ozone exposure activates stress-responsive regions in the brain stem via the vagus nerve. More recent studies in rats support the existence of a neurohormonal systemic stress response to ozone involving “activation of the sympathetic nervous system and the hypothalamic–pituitary–adrenal axis” (Kodavanti 2016).
The findings in these (and other) rodent exposures to ozone are difficult to extrapolate to humans. Thus, in 14 healthy, younger volunteers exposed to 250 ppb ozone and to clean air for three hours with exercise, Tank and colleagues (2011) failed to find evidence for sympathetic activation at rest the morning after exposure. Nevertheless, the recent report of Miller and colleagues (2016) suggests that ozone-exposed volunteers may acutely develop increased circulating stress hormones and lipid metabolites. Even if acute ozone exposure does stimulate a systemic stress response in humans, the cardiovascular consequences have not been defined.
OZONE MECHANISMS OF ACTION
Ozone is an ROS, but unlike other ROS, it is not generated by cell metabolism and must be inhaled to have lung and systemic effects. Despite its low aqueous solubility, about 80% of ozone inhaled by humans undergoes irreversible chemical reaction with a variety of substrates and cells present at the airway surface. Some of the ozone-reactive substances on the airway surface (e.g., urate, ascorbate) act as scavengers (Behndig et al. 2009). However, ozonation of abundant unsaturated lipids present in airway surface liquid as well as cell membranes (e.g., cholesterol and cholesteryl esters [Iuliano 2011] and phospholipid-bound unsaturated fatty acids) gives rise to biologically active, pro-inflammatory intermediates (Almstrand et al. 2014; Hamilton et al. 1998; Pryor et al. 1995). These products (e.g., aldehydes [Frampton et al. 1999] and lipid hydroperoxides) are more stable than ozone and can cross cell membranes (Girotti 2008). Other stable products of nonenzymatic lipid oxidation by ozone, such as F2-isoprostane, can be measured in the blood as quantitative biomarkers (Morrow and Roberts 1996) but are also biologically active (Comporti et al. 2008; Janssen et al. 2005). In California college students, increased plasma levels of F2-isoprostane were associated with both 4-hour controlled exposures to 200 ppb ozone and ambient ozone concentrations in the weeks preceding the ozone exposure (Chen et al. 2007). Thus, although the initial biologically active reaction products of inhaled ozone result from nonenzymatic oxidation of unsaturated lipids in the airway surface, subsequent events extend the effects to the airway wall and outside of the lung via endogenous mechanisms. These events include migration of blood-borne PMN and mononuclear cells to the airway surface, where they can be sampled noninvasively in induced sputum. The inflammatory cells produce ROS such as superoxide anion, hydrogen peroxide, and hypohalous acids. These inflammatory changes generally peak several hours after ozone inhalation and then gradually regress over the next 18 hours.
The arachidonate ozonization products, 4-HO-nonenal and 4-oxo-nonenal, are potent electrophiles that can activate the cation channel function of the transient receptor potential ankyrin 1 (TRPA1) receptors abundantly expressed on subepithelial nociceptive vagal C-fibers (Taylor-Clark et al. 2008; Taylor-Clark and Undem 2010). The activation of these sensorimotor unmyelinated nerve fibers is the likely cause of the involuntary inhibition of inspiration that is principally responsible for the acute spirometric decrements found in ozone-exposed humans (Hazucha et al. 1989; Passannante et al. 1998). These neural impulses might be responsible for reflex cardiac effects, such as those discussed above, by modulating the activity of the autonomic systems that control HRV (Verrier and Tan 2009).
We postulated that initially localized nonenzymatic reactions of inhaled ozone with lipid substrates on airway surfaces generate a variety of reactive chemicals and result in widespread activation of multiple cellular elements in the tissue. Mediators released from activated cells (e.g., vWf from endothelial cells and inflammatory mediators from innate immune cells) enter the circulation and may cause activation of blood elements, notably platelets, and increase the production of acute phase reactants such as CRP. Activated endothelial and blood cells also generate and release membrane-enclosed vesicles (e.g., MPs), which contain a variety of biologically active intracellular molecules. Such vesicles may serve an endocrine-like function by adhering to other cells and transferring their contents (e.g., MP-associated tissue factor). These systemic changes could result in prothrombotic effects and impairment of vascular dilation (Brook et al. 2010). In addition, direct activation of the pulmonary sensory C-fibers can affect the balance between the sympathetic and parasympathetic control of the heart (Perez et al. 2015).
Given that ozone exposure generates substantial oxidative stress, individuals with impaired antioxidant defenses may be at increased risk for acute health effects. Soluble cytosolic glutathione S-transferases (GST), which belong to a supergene family with multiple classes, might be involved in detoxification of post-exposure inflammation-related oxidants or in the resolution of inflammation. The GST Mu 1 gene, which codes the GSTM1 enzyme (reviewed by Wu et al. 2012), is particularly noteworthy because about half the Caucasian population is genetically null for this enzyme. Several observational studies in asthmatic children in Mexico City (Romieu et al. 2004) and in healthy cyclists in Italy (Bergamaschi et al. 2001; Corradi et al. 2002) suggest that GSTM1-null status confers susceptibility to the respiratory effects of ozone, particularly in NAD(P)H:quinone oxidoreductase (NQO1)-sufficient individuals. A controlled human exposure study has shown an increase in the late inflammatory response in GSTM1-null subjects (Alexis et al. 2009, 2013). Because a prolonged inflammatory response would increase oxidative stress, it is plausible that the GSTM1-null state might contribute to cardiovascular changes after ozone exposure. However, studies on the role of GSTM1 on susceptibility to cardiovascular effects are few. A recent controlled ozone exposure study (Frampton et al. 2015) in young healthy volunteers did not support a role of GSTM1 in eliciting cardiac and vascular function effects.
Figure 1 illustrates a number of the potential mechanisms whereby acute ozone inhalation may cause adverse cardiovascular health effects. A similar scheme has been proposed by Srebot and colleagues (2009). The evidence for these mechanisms and for the connection between effects on the pulmonary and the cardiovascular system comes in large part from the literature on PM (Brook et al. 2010; Franchini and Mannucci 2011; Newby et al. 2015; Watkins et al. 2013). Both PM and ozone (and other oxidant gases) are hypothesized to act through lung oxidative stress and inflammation and through a direct action on the autonomic nervous system via receptor-mediated autonomic reflexes in the lung (Brook et al. 2010).
Hypothesized mechanisms of action of ozone. Shaded boxes contain primary (bolded) and secondary outcomes measured in the MOSES study. HF = high frequency power; LF = low frequency power; PMN = polymorphonuclear leukocytes; RMSSD = root mean square of successive differences in normal-to-normal sinus beat intervals; SDNN = standard deviation of normal-to-normal sinus beat intervals.
HEI’s MOSES project grew out of a 2010 Request for Applications aimed at elucidating mechanisms by which short-term exposure to near-ambient concentrations of ozone might cause acute adverse cardiovascular effects in older adults. MOSES was a controlled human exposure study in which we exposed a relatively large number of healthy older adults, who may be more susceptible to air pollution-induced health effects than are younger adults (Shumake et al. 2013), to two levels of ozone (70 ppb and 120 ppb) and to filtered air without ozone. The study was designed to test several a priori hypotheses that are described below.
HYPOTHESES AND SPECIFIC AIM
We hypothesized a priori that short-term exposure to ambient levels of ozone would induce acute cardiovascular responses through the following mechanisms: autonomic imbalance, systemic inflammation, and development of a prothrombotic vascular state. We also postulated the confirmatory hypothesis that exposure to ozone would induce airway inflammation, lung injury, and lung function decrements. Finally, we postulated the secondary hypotheses that ozone-induced acute cardiovascular responses would be associated with (a) increased systemic oxidative stress and lung effects and (b) the GSTM1-null genotype. To test these hypotheses, we designed a controlled exposure study of healthy older volunteers with the specific aim of examining whether short-term exposure to ozone induces:
autonomic imbalance (HRV), repolarization abnormalities (T-wave amplitude), and evidence of myocardial ischemia (ST segment in V5);
systemic inflammation (CRP) and vascular dysfunction (BP, FMD);
development of a prothrombotic vascular state (MP-TFA, monocyte–platelet conjugate count);
lung function decrements (spirometry), airway inflammation (sputum PMN), systemic oxidative stress (8-isoprostane), and lung injury (CC16); and
increased acute cardiovascular effects in subjects with the GSTM1-null genotype.
METHODS
OVERVIEW
MOSES was a controlled exposure study of the acute cardiovascular effects of ozone in healthy nonsmoking adults (ages 55 to 70 years). The subjects were randomly exposed to clean air (0 ppb ozone), 70 ppb ozone, and 120 ppb ozone for 3 hours while alternately exercising and resting for 15 minutes. These concentrations are in the range of ambient exposures.
ORGANIZATION OF THE STUDY
The subject exposures were conducted in three clinical centers: University of Rochester Medical Center (URMC), University of North Carolina (UNC), and the University of California at San Francisco (UCSF). The New England Research Institute (NERI) served as the DCAC. Selection of the three clinical teams was based upon their responses to HEI Request for Application 10-1, 2010. Selection of the DCAC was based on responses to a Request for Qualification. The overall MOSES organizational structure is provided in Sidebar 1.
SIDEBAR 1. MOSES ORGANIZATIONAL STRUCTURE.
The HEI Research Committee had the overall responsibility for oversight during the planning and the conduct of the study. Maria Costantini, Principal Scientist, was the Project Officer. In addition, three separate groups of scientists coordinated the conduct of the work, provided guidance, monitored the data collection, and addressed issues related to subject safety. Their roles are described below and are also outlined in the MOSES Common Protocol (Additional Materials 1, available on the HEI website). The overall structure is shown in the figure.
Steering Committee The Steering Committee was composed of the principal investigators and co-principal investigators of the four centers and the Project Officer. The Steering Committee developed the common protocol, SOPs, and all needed forms; reviewed reports of adverse events and protocol violations; and prepared the final report.
Oversight Committee The Oversight Committee consisted of experts in relevant areas and provided advice to the Steering Committee during the planning and conduct of the study. The Committee was composed of the following experts:
Mark Utell, University of Rochester (pulmonologist)
Howard Rockette, University of Pittsburgh (statistician)
Petros Koutrakis, Harvard T.H. Chan School of Public Health (exposure)
Arshed Quyyumi, Emory University (cardiologist)
Data Monitoring Board The Data Monitoring Board (DMB) was composed of biostatisticians, a clinician appointed by the HEI Research Committee, and HEI staff. The DMB had regular conference calls (every 4–5 months) during the conduct of the study (up to June 2015) with representatives of the Data Coordinating and Analysis Center (New England Research Institute team) to monitor the development and implementation of the data analysis plan, overall quality of the data, and subject safety (through review of data on adverse events). Members of the DMB are listed:
David Christiani, HEI Research Committee and Harvard University (clinician)
Richard Smith, HEI Research Committee and University of North Carolina at Chapel Hill (biostatistician)
Howard Rockette, MOSES Oversight Committee and University of Pittsburgh (biostatistician)
Maria Costantini, MOSES Project Officer
Rashid Shaikh, HEI Director of Science
Core laboratories were contracted separately for the analyses of specific outcomes for all three clinical centers. The list of the centers and core laboratories is provided in Sidebar 2. Investigators at the three clinical centers, the core laboratories, and the DCAC participated in the development of the MOSES common protocol, questionnaires, check lists, data forms, and SOPs.
SIDEBAR 2. LIST OF MOSES CENTERS, CORE LABORATORIES, AND COMMERCIAL LABORATORIES.
CLINICAL RESEARCH CENTERS
University of California at San Francisco, San Francisco, CA
John Balmes and Mehrdad Arjomandi
University of North Carolina at Chapel Hill, Chapel Hill, NC
Philip Bromberg and Milan Hazucha
University of Rochester Medical Center, Rochester, NY
Mark Frampton and David Rich
DATA COORDINATING AND ANALYSIS CENTER
New England Research Institute, Watertown, MA
Anne Stoddard (until June 2014); Eric Gerstenberger (July 2014 to December 2014);
Paul Stark (January 2015 to August 2016); and Nicholas Dagincourt (September 2016 to present)
CORE LABORATORIES
Brachial Artery Ultrasound
Peter Ganz, University of California at San Francisco, San Francisco, CA
GSTM1 Genotype
Neil Alexis, University of North Carolina at Chapel Hill, Chapel Hill, NC
Holter (ECG)
Wojciech Zareba, University of Rochester Medical Center, Rochester, NY
Markers of Platelet Activation and Circulating Microparticles
Mark Frampton, University of Rochester Medical Center, Rochester, NY
Sputum Inflammatory Markers
Neil Alexis, University of North Carolina at Chapel Hill, Chapel Hill, NC
Tissue Factor Associated with Microparticles
Nigel Mackman, University of North Carolina at Chapel Hill, Chapel Hill, NC
COMMERCIAL LABORATORIES
Blood Chemistry and Cotinine Screening
LabCorp Clinical Trials, Durham, NC
Soluble Plasma Markers
AssayGate, Ijamsville, MD
Personal Exposure Sampler O3 and NO2 Concentrations
RTI International, Research Triangle Park, NC
Written, informed consent (as well as HIPAA consent and biological specimen repository consent) was obtained from all subjects at each clinical center. The study was approved by the IRB at each center and by the U.S. EPA Human Subjects Research Review Official. A Certificate of Confidentiality was obtained from the U.S. Department of Health and Human Services.
Subject recruitment started on July 1, 2012, and ended on December 31, 2014. The first exposure was conducted on July 26, 2012, at URMC; August 2, 2012, at UNC; and August 21, 2012, at UCSF. Testing of all subjects was completed by April 30, 2015.
EXPERIMENTAL PROTOCOL
Subject Recruitment
Recruitment strategies were developed by each center using local posting, advertising, and word-of-mouth contact. Inclusion and exclusion criteria are listed below:
Inclusion
Nonsmoking males and females of all ethnic backgrounds, ≥55 and ≤70 years of age.
Normal spirometry (FEV1 and FVC ≥75% of predicted and FEV1/FVC ≥0.65). Predicted values were based on the NHANES III data set with adjustments for African Americans and Hispanics, but not for Asians.
Ability to complete the training exercise regimen chosen to induce an inspired ventilation rate of 13.6 to 15.5 L/min/m2 body surface area (BSA) ATP (ambient temperature and pressure), which is equivalent to 15–17 L/min/m2 BTPS (body temperature and pressure, saturated with water vapor) without exceeding 80% of predicted maximal HR.
Normal baseline 12-lead resting electrocardiogram (ECG), and absence of significant ST segment depression while performing the 15-minute required level of exercise targeted for the exposure period.
Ability to avoid the medications and supplements listed in the Medication List for Phone Screen for one week before the exposure. The list is in Section 7, Table 1, of the common protocol (Additional Materials 1, available on the HEI website).
Including but not limited to, as ascertained by the physicians: Subjects with chronic cardiovascular (such as ischemic heart disease) or respiratory (such as asthma or chronic obstructive pulmonary disease) disease; diabetes, or other organ or system dysfunction; cerebrovascular disease; active psychiatric disorders that would interfere with the subject’s ability to understand and participate in the study. Subjects who have tested positive for a disease that affects the immune system (such as HIV, lymphoma, leukemia) or current drug or alcohol abuse (defined as having more than three drinks per day or being unable to abstain from alcohol for three days).
Subjects with atopy or allergic rhinitis were not excluded as long as they did not require regular treatment with antihistamines or systemic steroids.
Ever-smokers (smoked tobacco or marijuana during the last five years, or with history of >10 pack-years for tobacco or >1 joint year for marijuana, or living with a smoker who smokes inside the house).
Subject having plasma cotinine level >3 ng/mL.
BMI >35 and <18 (35 is the lower limit for class 2 obesity).
Hypertension (defined as BP >140 systolic or >90 diastolic) or on antihypertension medications other than diuretics.
Pregnancy or nursing (breastfeeding).
On the following medications: prednisone, statins, beta-blockers, anticoagulants, current systemic estrogen therapy, tamoxifen. Subjects were not asked to discontinue needed prescription medications for the purpose of this study. Use of other medications was considered on an individual basis (see common protocol in Section 7, Additional Materials 1.1).
Subjects taking aspirin or phosphodiesterase-5 inhibitors must have been willing to abstain from these medications during the week preceding each exposure (see common protocol Section 7).
Current occupational exposures to high levels of vapors, dust, gases, or fumes.
Potential participants were screened using the Initial Phone Screening Questionnaire (Additional Materials 3, available on the HEI website) after giving verbal consent. Eligible participants then visited the laboratory or Clinical Research Center (CRC) for screening and training on two separate days. Written, informed consent was obtained at the beginning of the screening visit before any of the procedures were performed. At this point a subject was considered enrolled in the study. Each subject was scheduled to participate in 11 visits, which are described below.
The study followed the MOSES Common Protocol and the MOSES Manual of Operations (Additional Materials 1). After the start of the exposures, some changes to the protocol were made, which can be found in Additional Materials 1 (additions shown in red; deletions crossed out). The most significant change was elimination of the nitroglycerin-mediated portion of the brachial artery dilation procedure in December 2012, because of adverse events associated with nitroglycerin administration. The Subject Packet of forms needed during the subject’s visits (such as questionnaires, checklists and data forms) is shown in Additional Materials 3.
Screening and Training (Visits 1 and 2)
During the screening visit (visit 1) the subject completed the Health and Home Screening Questionnaire to obtain information on demographics, home environment, alcohol use, smoking history, and medical history (including history of allergies, use of medications and vitamin supplements, and diet). Subsequently, an evaluation was performed by a study physician that comprised a review of the medical history and a physical examination with particular attention to cardiovascular and respiratory health status. Women not yet postmenopausal underwent urine pregnancy testing. Screening tests were resting 12-lead ECG, spirometry, plasma cotinine (a marker of exposure to tobacco smoke), total and differential blood counts, metabolic profile, and lipid profile.
The training visit (visit 2) determined whether the subject was able to maintain exercise at a level sufficient to achieve the pre-set target minute ventilation (VE) of 15–17 L/min/m2 BSA, BTPS. Exercise was performed on a treadmill or a stationary bicycle for two 15-minute periods separated by 15 minutes of rest, with monitoring of VE twice during each exercise session. Subjects were considered to have met the inclusion criterion if they did not exceed the maximum HR (80% of predicted maximum) and had no evidence for cardiac ischemia or arrhythmias on continuous cardiac monitoring during exercise.
A subject was deemed eligible and was enrolled in the study when the baseline vital signs were within the pre-established parameters, exercise was completed successfully without ECG abnormalities, all inclusion and exclusion criteria had been met, and blood analysis results were within acceptable limits.
Enrolled subjects were given a Personal Exposure Sampler (PES) to take home with instructions to wear the PES near the breathing zone for three days prior to the pre-exposure visit. They were also given the Activity Diary to complete during that period (Additional Materials 3). Personal exposure data and activity diary entries are not included in this report.
Exposure Visits (Visits 3–11)
Seven days prior to each exposure session the subject was contacted by either phone or email and asked about changes in health or medication use and medication restrictions. Subjects were not studied within six weeks of a respiratory infection. The subject was also reminded to abstain from caffeinated beverages (e.g., coffee, tea, energy drinks, and sodas) and alcoholic beverages starting with lunch on the day before the exposure through the post-exposure day.
Each exposure session consisted of three consecutive days as shown in Table 1. There was a minimum 2-week period between the exposure sessions. The total duration of subject participation, from the screening visit to the final visit, typically varied between 3 and 6 months but could be as long as 12 months. The order of sessions was randomly assigned to the subject. Both the subject and most study personnel were blinded to the nature of the exposure.
Pre-Exposure Day
The subject arrived at the laboratory or CRC between 11:30 am and 12:00 noon, ate a low-fat lunch (25%–30% fat), and answered the Pre-Exposure Health Questionnaire. Women not yet postmenopausal underwent urine pregnancy testing. The following procedures were subsequently carried out: measurement of vital signs, venous blood draw (up to 30 mL), and BAU. A box dinner was provided. The subject spent the night in a nonsmoking room at a nearby hotel. The subjects were transported to and from the hotel by a hotel van or a taxi.
Exposure Day
The subject arrived at the laboratory or CRC between 7:00 am and 7:30 am. A regular breakfast was provided. The procedures were carried out in the following order: BP and other vital signs were measured, the subject completed the Symptom Questionnaire, the Holter monitor leads were attached, HRV was recorded, and spirometry was performed. The Holter ECG recording continued for 24 hours.
The exposure started between 8:00 am and 8:45 am and lasted three hours, with intermittent exercise. Most previous controlled exposure studies of ozone have used exercise to increase the inhaled dose of ozone while keeping the exposure duration manageable. The subject started with a 15-minute exercise period at the workload determined during the training visit, followed by alternating 15-minute rest and exercise periods for the duration of exposure.
VE was measured for two minutes twice during the first exercise period and once during the second, fourth, and sixth exercise periods; the exercise workload was adjusted as needed to achieve the targeted VE of 15 to 17 L/min/m2 BSA, BTPS without exceeding 80% of predicted maximum HR. BP was measured during a rest period 5 minutes before the third and fifth exercise periods. HR was continuously monitored and recorded during each VE measurement period. During the final rest period, 10 minutes before the end of exposure, the subject filled out the symptom questionnaire.
Immediately after exposure, the vital signs, HRV, and spirometry were measured sequentially, and a low-fat lunch was provided. Approximately three hours after the end of the exposure, the following procedures were carried out in order: HRV, venous blood draw, BAU, symptom questionnaire, and vital signs. The subject went home wearing the Holter monitor at approximately 4:00–4:30 pm.
Post-Exposure Day
The subject arrived at the laboratory or CRC at approximately 8:00 am. No breakfast was provided. However, the subject was allowed to have had breakfast if eaten at least two hours before sputum induction in order to avoid contamination of the sputum specimen. The following procedures were carried out: vital signs, symptom questionnaire, HRV, venous blood draw and spirometry/sputum induction. The ECG recorder was removed, and the subject left the laboratory or CRC at approximately 10:30 am. Figure 2 shows the flow of measurements during the 3-day visits. Table 2 lists all the procedures during the three visits. More details can be found in Additional Materials 1.
Measurements during 3-day visits for 3 sessions. Each session used a different level of ozone (O3) exposure (0, 70, or 120 ppb). The order of sessions was randomly assigned to each subject.
d Measured for 72 hours, starting 3 days before exposure. PES = personal exposure sampler.
e Measured only during exercise periods.
f Heart rate variability during 5-min rest periods (from Holter).
g Brachial artery ultrasound.
OUTCOMES MEASURED
The MOSES outcomes were selected based on the hypothesized mechanisms of action illustrated in Figure 1 and the specific study hypotheses. For each potential mechanistic pathway for acute cardiovascular effects we identified at least one primary outcome and several secondary outcomes. Primary outcomes for each mechanistic pathway were selected based on either previous evidence in the literature that this outcome was affected by ozone exposure (e.g., HRV) or clinical relevance (e.g., ST segment changes, BP, CRP, and FMD). The secondary outcomes were intended to help in interpreting the results of the primary outcomes by strengthening the coherence of the findings.
The list of all the primary and secondary outcomes assessed in MOSES is provided in Sidebar 3 and in Table 3, which includes the times of measurements. The primary outcomes are bolded. A complete list of all outcomes and endpoints assessed during the study can be found in the Appendix to the Statistical Analysis Plan (Additional Materials 5.) All outcomes were measured both before and after each exposure with the exception of sputum outcomes, which were measured only after exposure. For simplicity in the remainder of this report, 4-hour and 22-hour will be used to denote data collected between 3 and 4.5 hours and between 21 and 22.5 hours after exposure, respectively.
SIDEBAR 3. PRIMARY AND SECONDARY OUTCOMES.
This list shows all the primary and secondary outcomes assessed in MOSES. The primary outcomes are bolded.
Markers of autonomic balance (heart rate variability [HRV]), cardiac arrhythmia, and repolarization from the ECG (Holter) recordings (averaged over 5 minutes or 24 hours)
Heart rate (HR) and HRV parameters
HF (high frequency power, 0.15–0.40 Hz), LF (low frequency power, 0.04–0.15 Hz), the LF/HF ratio, HR (calculated from the normal-to-normal sinus beat intervals [NN]), SDNN (standard deviation of the NN intervals), RMSSD (root mean square of successive differences in the NN intervals): 5-minute averages
RMSSD, HR, SDNN, HF, LF: 24-hour averages
Repolarization changes:
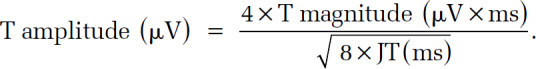
T-wave amplitude: 5-minute and 24-hour averages
QTc interval: 5-minute averages
ST-segment changes, ST in leads II, V2, and V5: 5-minute and 24-hour averages
Arrhythmia: ventricular ectopy (VE) and supraventricular ectopy (SE): 24-hour total
Markers of systemic inflammation, oxidative stress, and vascular function
Blood pressure (systolic and diastolic)
Flow-mediated dilatation (FMD), reactive hyperemic velocity-time integral (VTI), and brachial artery diameter (BAD)
C-reactive protein (CRP)
8-Isoprostane
Nitrotyrosine
Interleukin-6 (IL-6)
Endothelin-1 (ET-1)
P-selectin
Blood and plasma markers of prothrombotic vascular state
Sputum polymorphonuclear leukocytes (PMN) as % of total nonepithelial cells and as count/mg sputum
Sputum soluble markers: IL-6, interleukin-8 (IL-8), tumor necrosis factor-α (TNF-α), and total protein
Plasma: club cell protein 16 (CC16)
Spirometric parameters of pulmonary function: forced expiratory volume in 1 second (FEV1), forced vital capacity (FVC), FEV1/FVC, and forced expiratory flow between 25% and 75% of FEV (FEF25–75).
Symptoms (from symptom questionnaire): Symptoms assessed include headache, phlegm/sputum production, eye irritation, cough, wheezing/whistling in chest, fast heart beat or pounding heart, irregular heartbeat, skipped beats. For a complete list see Additional Materials 3 (Subject Packet). The symptom questionnaire was administered before the exposure, at the end of exposure, and 4 and 21 hours after the exposure. The severity of symptoms was evaluated on a 5-point Likert scale of 0 (none) to 4 (severe).
Table 3.
MOSES Primary and Secondary Outcomes and Time of Measurements
b VE and SE were averaged throughout the 3-hour exposure.
Specific methods are summarized below. All SOPs are provided in Additional Materials 2, available on the HEI website.
EXPOSURE GENERATION AND CHARACTERIZATION
The exposures took place in ventilated, climate-controlled chambers at each of the clinical centers. The chamber characteristics and the SOPs for generating and measuring ozone were site-specific. The chamber characteristics and performance parameters are described below and summarized in Table 4.
Table 4.
Chamber Characteristics and Performance Parameters by Center
URMC
UNC
UCSF
Ozone accuracy vs audit
2.5% low
1% low
1% low
Control of ozone concentrations
Manual
Automatic, via feedback from analyzers
Manual
Ozone stability (SD) at 70 ppb
± 4 ppb
± 0 ppb
± 2 ppb second audit
Temp accuracy vs audit
0.4°C low
0.3°C low
2.7°C low
Temp stability (SD) at 21.1°C
± 0.05°C
± 0.0°C
± 0.1°C
RH accuracy vs audit
4.9% RH low
Exact agreement
9% RH high
RH stability (SD) at 40%
± 0.6% RH
± 0.2% RH
± 2.3% RH
Ozone concentration in filtered air
~5 ppb
0 ppb
0 ppb
Chamber interior
Conventional drywall
Stainless steel
Stainless steel
Chamber size
57 m3
82 m3
14 m3
Chamber air flow rate
14.4 m3/min
56.6 m3/min
13.6 m3/min
Chamber air exchange rate
15/hr
41/hr
58/hr
Ozone quality control calibrations
5-Point calibration against transfer standard prior to each exposure
6-Point calibration against transfer standard prior to each exposure
Collocated measurements with transfer standard during exposure
Ozone transfer standard certification frequency
Quarterly
Quarterly
Biannual
Ozone dispersion verification
At beginning of study
Quarterly
At beginning of study
Particle number concentration
Yes
Only during quarterly tests of homogeneity of ozone concentrations within the chamber
The URMC exposure chamber is a 6.6 meters × 2.4 meters × 3.6 meters (57 m3) enclosure constructed of conventional drywall, with windowed doors located on one side, facing the ante room. Air enters the chamber through four ceiling vents. The air is exhausted via three wall vents near the chamber floor. The exhaust flow rate is set slightly higher than the supply, creating a slight negative pressure to prevent leakage of pollutants from the chamber to the ante room.
The UNC chamber floor is approximately 5.8 meters × 4.7 meters with a height of approximately 3 meters at the sides (approximately 82 m3). A conical ceiling adds additional volume to the chamber. The chamber walls are made of insulated stainless steel panels with Teflon gaskets between the panels. Air enters the chamber from the top of the chamber cone and goes out through vents in the floor.
The UCSF exposure chamber is a 2.44 meters × 2.44 meters × 2.44 meters (14 m3) stainless steel enclosure with windows located on two sides facing the exposure laboratory. Air enters the chamber through a circular vent at the center of the ceiling. The air is exhausted from the chamber via two wall vents near the floor, located diagonally from each other. The exhaust system is equipped with a fan that maintains an exhaust flow rate (approximately 13.6 m3/min) that is slightly higher than the supply flow rate (approximately 13 m3/min), thus assuring that pollutants do not leak from the chamber to the ante room.
Exposure Generation
All three centers generated ozone by silent electric arc-discharge of a flow from a gas cylinder containing breathing-quality (USP grade) oxygen. UCSF employed a water-cooled model T-408 ozone generator (Polymetrics, Inc., San Jose, CA). UNC (U.S. EPA Human Studies Facility) employed a Fischer, model 502 ozone generator (Meckenheim/Bonn, Germany; later as Innovatec, GmbH, Rheinbach, Germany). URMC employed a water-cooled Orec model V5-0 Ozone Generator (Ozone Research Equipment Co., Akron, OH).
The dilution air entering the exposure chamber was purified by passing it through a Purafil, a charcoal, and a HEPA filter. The effluent from the ozone generator was mixed with the filtered air immediately before entering the chamber. The ozone output was controlled by varying the voltage of the generator and adjusting the flow rate. Temperature and relative humidity (RH) were targeted to be at approximately 22°C and 40%, respectively. The ozone analyzers and the ozone generation were started 45 minutes (UCSF and UNC) or 30 minutes (URMC) before the beginning of each exposure.
Exposure Monitoring
The concentration of ozone breathed by the subject was monitored continuously during the exposure. Particle number concentration was measured routinely during each exposure at URMC and UCSF. At UNC it was measured only during quarterly quality assurance (QA)/quality control (QC) checks in the absence of the subject. The center-specific procedures are summarized below.
URMC utilized two ozone analyzers, a Thermo model 49i (Thermo Fisher Scientific, Franklin, MA) to measure the chamber ozone concentrations during exposures and an API 703E (Teledyne, San Diego, CA) as an ozone transfer standard for calibration. The latter instrument was verified semi-annually using a transfer standard operated by the New York Department of Environmental Conservation. Performance checks of the chamber ozone analyzer were conducted biweekly using the API transfer standard. A condensation particle counter (TSI, model 3022A, Shoreview MN), with a particle size range of 7 nm up to 3 μm in diameter, was operated in the chamber during the exposures.
UNC utilized three ozone analyzers. Two Thermo 49i analyzers continuously recorded chamber concentrations; one of the analyzers was used for controlling concentrations within the chamber, and the other served as the primary means of recording the chamber concentrations. A Thermo 49iPS was used as the dedicated transfer standard for the chamber. It was used for the multipoint calibrations that were conducted before and after each exposure. This transfer standard was certified quarterly against an external transfer standard that is traceable to a U.S. EPA Standard Reference Photometer. A condensation particle counter (TSI, model 3775) with a particle size range of 4 nm up to 3 μm in diameter was operated in the chamber during periodic QA audits.
UCSF utilized two recently serviced analyzers provided to UCSF by the California Air Resources Board: a Thermo model 49c, and an API model 400E. The Thermo 49c was used as the primary analyzer to measure the chamber ozone concentrations. The API 400E was certified by the Bay Area Air Quality Management District as a transfer standard. The procedure for the calibration of the ozone analyzer was different from procedures used at the other two centers. While UCSF utilized a certified transfer standard, it was not equipped with a calibration system that could provide test atmospheres of ozone. The center followed the recommendations of the HEI QA Officer by operating both the primary ozone analyzer and the transfer standard during all exposures, to assure agreement. Values from the two analyzers were then compared on a daily basis. Significant deviations between the two analyzers indicated possible problems with one of the analyzers that had to be addressed before continuing with measurements. A TSI P-TRAK ultrafine particle counter model 8525 (Shoreview, MN) with a particle size range of 20 nm up to 1 μm in diameter was operated routinely in the chamber during the subject exposures starting in September 2013.
QA audits of the chambers’ operation verified the comparability of the ozone measurements made in the three chambers under actual test conditions.
MEASUREMENT OF PERSONAL EXPOSURE TO OZONE AND NO2
Personal Exposure Sampler
Personal exposure to ozone and NO2 during the ~72 hours preceding the pre-exposure visit was measured using a PES. PES components were obtained from Ogawa & Company (Pompano Beach, FL) and assembled at each center. The shelf-life of the filters used to collect the two pollutants is limited to approximately one year. Therefore, care was taken to track the dates the filters were received, the dates PESes were assembled and distributed to a subject, and the dates the filters were shipped to the analytic lab. The PES consisted of a small plastic reusable cylinder with two diffusion end-caps containing a glass fiber filter coated with nitrite-based solution for collecting ozone and a cellulose fiber filter coated with triethanolamine for collecting NO2. Assembled samplers were stored in an airtight brown vial in a resealable bag at 4°C before use. Blank samplers were prepared together with the field samplers and stored together.
At the end of the training visit and each post-exposure visit, the subject was given a PES and time–activity diary to take home, with written instructions on how and when to use each (i.e., in the 72 hours before the next scheduled clinic visit). The subject was instructed to store the PES in the refrigerator and start wearing it at noon of the third day before the pre-exposure visit. The subject filled out the time–activity diary for each day he/she was wearing the PES. When the subject arrived at the laboratory or CRC, the PES was removed from the subject’s clothing and disassembled; the two filters were placed in individual shipping vials and stored in the refrigerator. The storage vial containing a sampler to be used as a blank was kept closed at room temperature for three days to simulate the temperature for the active samplers while in use. The exposed and blank filters were refrigerated for up to three months before shipping. Each shipped batch of exposed filters included at least one blank.
The exposed and corresponding blank filters were shipped in batches to Research Triangle Institute, Research Triangle Park, NC, for analysis. For the analyses, the Research Triangle Institute used the default temperature of 25°C and 70% RH. The results of the analyses were then transmitted electronically to the DCAC.
Personal Exposure Sampler Filter Analyses
Both NO2- and ozone-exposed filters were extracted in distilled water for at least four hours before analyses by ion chromatography. Ion chromatography calibration standards were prepared using serial dilutions of National Institute of Standards and Technology traceable stock standards. Duplicate and spike analyses were conducted at a rate of at least 1 per batch of 25 samples. The lowest detectable range for NO2 was 2.3 ppb in a 24-hour period and 0.77 in a 72-hour period. The lowest detectable range for ozone was 2.7 ppb in a 24-hour period and 0.9 ppb in a 72-hour period.
RETRIEVAL OF AIR QUALITY AND OTHER ENVIRONMENTAL DATA
Hourly averages of temperature, RH, ozone, PM2.5, NO2, SO2, and CO were obtained for the following monitoring stations:
New York State Department of Environmental Conservation monitoring station N-28, at Yarmouth Road, Rochester, NY (Aerometric Information Retrieval System #360551007).
U.S. EPA air monitoring station at Alexander Drive, Durham, NC (near the U.S. EPA Research Triangle Park campus, NC). This is a research site and the data are not reported to the U.S. EPA Air Quality System, but the site is operated with the same protocols and QA procedures required for sites operated by state and local air monitoring agencies.
Bay Area Air Quality Management District monitoring station at Arkansas Street, San Francisco, CA (ARB code 90306; Aerometric Information Retrieval System #060750005).
For each pollutant, as well as for temperature and RH, we calculated means for the entire study period (July 1, 2012, through April 30, 2015).
HEALTH OUTCOME MEASUREMENTS
Vital Signs — Blood Pressure and Heart Rate
BP and HR were measured with an automatic device during screening and training, and at the following times with each exposure session: the day before and 30 minutes before the exposure, and immediately, 4.5 hours, and 21 hours after the end of the exposure. The measurement taken 30 minutes before the start of the exposure was used as the baseline. In addition, HR was measured during exposure at the end of each of the six exposure exercise periods; BP was measured during the second and the fourth exposure rest periods.
Vital signs were taken in a quiet room, after the subject was seated, breathing quietly, with the legs uncrossed, the back supported, and the relaxed right arm resting on a firm surface at heart level for five minutes. Subjects at UCSF sat with legs uncrossed on a gurney with or without back support and with feet resting on a foot stool or on the gurney. Except for measurements during exposure, BP and HR were measured in triplicate, each separated by a minute of rest. The average of the second and third diastolic and systolic BP and HR measurements were entered in the DCAC data entry system. For the two measurements during exposure, BP was measured once and not repeated.
During the screening visit, if the first BP measurement was outside of study limits (upper exclusionary limit 140/90, lower safety limit 90/50) the measurement was repeated up to two more times at 3-minute intervals at rest. The first BP measurement that was within the study limits (and corresponding HR measurement) was entered in the data management system. If none of the BP measurements were between the study limits, the subject was excluded.
Minute Ventilation Measurement
VE during training and exposure sessions was measured at various time intervals as outlined in the common protocol and SOPs 4 and 5 (Additional Materials 1 and 2) using a mouthpiece pneumotachograph assembly. Each clinical center followed the respective SOP for data acquisition. The duration of each VE measurement period was 3–5 minutes with the last minute used to calculate the average VE. The VE at UNC was measured with a non-heated pneumotachograph under ATP conditions during inspiration. The volume was subsequently converted to BTPS. At UCSF and URMC the ventilation was measured during the expiratory phase under BTPS conditions with a heated pneumotachograph. The data were adjusted for body surface area and reported as L/min/m2 BSA, BTPS.
ECG Monitoring
Ambulatory ECG monitoring was obtained using 12-lead Holter recorders (Mortara H12+ Holter recorder; Mortara Instruments, Inc., Milwaukee, WI). At the beginning of each recording and at specific intervals, subjects reclined in a dark, quiet room for 10 minutes so the data would be acquired without the influences of activity or changes in body position. For each prespecified pre- or post-exposure period of 10-minute resting recording, a 5-minute segment was selected starting from minute 6 to 10, for detailed analysis.
These periods provided data for:
15 minutes before exposure,
3-hour exposure period,
10 minutes after the end of the exposure,
3 hours after the end of the exposure, and
21.5 hours after the end of exposure.
After the completion of each 24-hour recording the Holter card was shipped for analysis to the ECG Core Laboratory at the Heart Research Follow-up Program at the University of Rochester Medical Center, Rochester, NY.
ECG Analyses (Holter Core Lab)
Recordings stored on the Holter cards were uploaded to the Mortara H-Scribe System (Mortara Instruments Inc., Milwaukee, WI) and first analyzed automatically by a commercial Holter analysis program identifying beats by QRS morphology. After this automatic annotation, trained technicians annotated recordings manually using standard procedures to correct mislabeled or missed beats and recognized artifacts. After completion of these analyses, the recordings were considered to be annotated. The overall Holter report on the annotated recording indicated duration of the recording, presence of arrhythmias including ventricular premature beats (VPBs: singles, couplets, and runs of at least 3 VPBs) and supraventricular premature beats (SVPBs: couplets and runs of at least 3 SVPBs). The annotated recordings served to further process the data for HRV and repolarization parameters.
The recording and parts thereof for which averages were calculated are listed below. Those marked with an * were analyzed for the preselected cardiac outcomes (described in the next sections: HRV Analyses and Repolarization Analyses), as follows:
15 minutes before exposure (the last 5 minutes of 10 minutes supine)*,
during exposure exercise 6 (minutes 6 to 10),
10 minutes after exposure (the last 5 minutes of 10 minutes supine)*,
3 hours after exposure (the last 5 minutes of 10 minutes supine)*,
night time (5 minutes 2:00–2:05 AM),
21.5 hours after exposure (the last 5 minutes of 10 minutes supine)*,
night hours (midnight–4 AM), and
during entire 24-hr recording*.
HRV Analyses
NN intervals (interval in milliseconds [ms] between successive normal-to-normal beats) were exported from the annotated Holter output file to a custom-made HRV analysis program. We measured the following time-domain HRV parameters: HR in beats/min (using the formula 60,000/NN); standard deviation of normal-to-normal sinus beat intervals (SDNN); and root mean square of successive differences in normal-to-normal sinus beat intervals (RMSSD).
Frequency-domain HRV parameters were analyzed using fast Fourier transformation (Malik and Camm 1995) with the following parameters computed: HF, low frequency (LF) power band (0.04–0.15 Hz), and the LF/HF ratio. Based on a study by Bigger and colleagues (1992), filtering criteria eliminated two R-R intervals (the interval between R-waves) after premature ventricular or atrial beats. We did not apply preprocessing filtering to eliminate extreme values. As a post-processing approach, we evaluated outliers and determined whether the values were valid or not based on intralaboratory ranges developed during a prior study (Schneider et al. 2010).
Repolarization Analyses
The Super ECG Program (Mortara Instruments Inc., Milwaukee, WI) was used to analyze repolarization parameters. Repolarization duration was analyzed using the QT interval duration measured automatically from an eigenvector lead and corrected for HR (QTc) using the Bazett formula (Bazett 1920). (The eigenvector lead is mathematically constructed based on principal component analysis of ECGs acquired using the standard lead system.) The median value for the 5-minute segments was reported. T-wave magnitude was measured using the Super ECG Program algorithm computing the amplitude between the J-wave (QRS end) and the end of T-wave, therefore encompassing ST segment and T-wave changes. This parameter better reflects overall ST–T-wave morphology in comparison to the traditional T-wave amplitude. For the purpose of comparing our reported values to the more standard T-wave amplitude, we mathematically converted the values of T-wave magnitude to the T-wave amplitude using the following formula:
This T-wave amplitude parameter again reflects the average amplitude for the interval between the J-point and the end of the T-wave. We also measured ST segment changes in ECG leads II, V2, and V5, reported as median values. Traditionally, ST segment changes are evaluated in Holter recordings using measurements of ST depression ≥1 mm (100 μV) lasting for at least one minute. However, current Holter technology allows us to determine microvolt-level ST segment changes similarly to prior studies.
Arrhythmia results were reported as number of ventricular ectopic (VE) and supraventricular ectopic (SE) beats in a given period. The prematurity of ectopic beats was set at 25%. We analyzed VE and SE beats over the entire 24-hour recording period and also over the 3-hour exposure period and reported the frequency of VE and SE single beats and VE and SE beats that occurred in a succession of two (couplet) or more than two (run).
Brachial Artery Ultrasound
For QA purposes, at each study site prior to starting the study, ultrasound technicians were trained in BAU methodology. These technicians completed BAU FMD image acquisition on at least 10 healthy subjects, which met quality criteria established by the core laboratory. Written, informed consent was obtained from subjects participating in these preliminary FMD procedures. These subjects did not participate in the subsequent ozone exposures.
For the main study, images were obtained the day before and four hours after the end of each of the three exposures (for a total of six measurements per subject) using standardized procedures. Subjects were given a low-fat lunch (25%–30%) on the day of the procedure.
Baseline brachial artery diameter (BAD), FMD, and velocity-time integral (VTI) were measured after 15 minutes of supine rest in a dark, quiet room. BAD was acquired using high-resolution B-mode ultrasound, and VTI was acquired using high-resolution Doppler ultrasound. BAD was measured over three consecutive cardiac cycles. Two baseline measurements were taken. Baseline VTI was measured from R-wave to R-wave over three consecutive cardiac cycles. After acquiring these baseline images, a BP cuff was placed on the forearm and inflated to ≥ 200 mm Hg for five minutes. Reactive hyperemic VTI was measured after cuff release during the first three full cardiac cycles. FMD diameter was acquired at 30, 45, 60, 75, 90, 105, and 120 seconds after cuff deflation, at the end-diastole of three cardiac cycles for each time point. Ultrasound images were sent to the BAU Core Laboratory for analysis. For more details see SOP 31, Additional Materials 2.
BAU Analyses (BAU Core Lab)
All ultrasound images were analyzed by the same expert sonographer utilizing edge detection software produced by Medical Imaging Applications LLC (Coralville, Iowa). Results were entered directly in the DCAC data management system. For more details see SOP 32, Additional Materials 2.
BAD (mm) was calculated as the average of the two baseline measurements, each consisting of the average of measurements at three cardiac cycles.
VTI (cm) is a measure of microvascular function that provides additional information about cardiovascular disease risk beyond FMD (Anderson et al. 2011). Both baseline and post-cuff deflation were calculated as the average of the measurements at three cardiac cycles. The Doppler signal after cuff release yielded the hyperemic VTI (a measure of the peak flow through the artery after cuff deflation), which is expressed as the distance the blood has traveled adjusted for HR (cm). For consistency, if fewer than three VTI cycles were captured due to technical difficulty with the scan, the same ordinal cycles were utilized for analysis across all six studies for a given subject (e.g., first and second, first only, third only).
FMD is expressed as the percentage change in artery diameter and was calculated for each of the time points using the following equation:
The highest (%) FMD within 30–120 seconds was used in the analyses.
BAU Quality Rating
Because the technical quality of brachial artery studies is variable, the BAU Core Laboratory developed a list of objective metrics to judge the technical quality of each MOSES study at each individual time point before the data were unblinded. Three levels were defined: excellent, adequate, and poor (for more details see SOP 32, Additional Materials 2). The statistical analyses were conducted using all of the data and again after the images rated poor were excluded.
Phlebotomy
Blood was obtained from the antecubital vein of the arm not used for BAU or BP measurements. In situ platelet and endothelial activation were minimized by a short tourniquet time, minimizing trauma at needle entry, and discarding the first 5 mL of blood. Subjects with difficult venous access were excluded. The following tubes were collected:
A sodium citrate tube whose content was split into two tubes, one for immediate flow cytometry analysis (platelet activation) and one frozen for MP-TFA analysis.
A sodium citrate tube frozen for soluble markers analysis.
A sodium citrate tube whose content was split into three tubes for archiving (including GSTM1 analysis).
An EDTA tube for complete blood count.
Blood was collected on the day before exposure, and at 3.5 hours and 22 hours after the end of each exposure for a total of 9 measurements.
Plasma samples for this assay were analyzed as previously described (Khorana et al. 2008; Wang et al. 2009). Briefly, MPs were isolated from plasma by adding 1 mL calcium-free HEPES buffer to each 200 μL sample and pelleting at 20,000g for 15 minutes at 4°C. The pellet was rewashed, resuspended in the same buffer, and well mixed. The MP-TFA assay depends on adding calcium in the presence of activated human factor VII (FVIIa) (Enzyme Research Lab). The TF-FVIIa complex plus Ca++ activates added factor X (FX) (Enzyme Research Lab). The resulting FXa is then assayed colorimetrically (absorbance at 405 nm) in the MP pellet suspension along with suitable controls and standards in a 96-well plate with Pefachrome FXa 8595 (Pentapharm #085-27, Aesch, Switzerland) (Wang et al. 2009). An essential control in this system — the determination of TF-independent FXa generation — involves first neutralizing TF with antihuman TF antibody (HTF-1) (Becton-Dickinson Biosciences #550252, San Jose, CA). Two plasma samples, in duplicate, were analyzed for each subject time point. The data are reported as the average of the two measurements.
Platelet Activation and Circulating Microparticles
We measured blood platelet activation and circulating MPs using immunofluorescence and flow cytometry, with modifications of methods previously reported (Stewart et al. 2010). The flow cytometry analyses were conducted at each clinical center within one hour of the blood draw, on 18-color LSRII flow cytometers (Becton Dickinson Biosciences, San Jose, CA), using the following laser options: blue 488, 515/20 nm band pass; red 633, 620/20 nm band pass; and green 532, 575/25 nm band pass. Standardized beads were run simultaneously with the subject samples for sizing (SORP-NIST sizing beads, obtained by special order from Becton Dickinson), event counting (AccuCount Beads, ACBP-20-10, obtained by special order from Spherotech, Lake Forest, IL), and fluorescence intensity (Rainbow Beads, RCP-60-5, Spherotech). Platelets and MPs were characterized both unstimulated and primed with thrombin receptor activator peptide-6 (H-8365, Bachem Americas Inc., Torrance, CA), at a concentration just below that causing detectable activation using our methods (2.34 μM). Table 5 lists the measured marker ligands. Measurements included both counts of positive events and mean fluorescence intensity of the event population. Data were collected in list mode and sent to the Flow Core Laboratory for analysis when each subject’s exposures were completed.
Table 5.
Markers of Platelet Activation and Circulating Microparticles
Analysis of Platelet Activation and Circulating Microparticles (Flow Core Lab)
When each subject had completed all three exposures, list-mode data were sent to the Flow Core Laboratory for analysis using FloJo software (TreeStar, Ashland, OR). Platelets and monocyte–platelet conjugates were analyzed using a method adapted from Li and colleagues (1999). MPs were identified using the sizing beads and surface markers of the cells of origin (Jimenez et al. 2005). Before starting the study, the analysis protocols and procedures were developed and validated using a series of pilot blood samples from healthy volunteers at each study site, with analysis at the Flow Core Laboratory, to assure consistent results among the study sites. All data were analyzed at the Flow Core Laboratory by the same individual. A second technician performed duplicate analyses using the same methods on complete data from three subjects, one from each site, to confirm that results were not operator dependent.
Peripheral Blood Biomarkers
We measured the following markers in plasma: CRP, IL-6, 8-isoprostane, nitrotyrosine, fibrinogen, ET-1, vWF, and CC16. Plasma samples were shipped to the AssayGate commercial laboratory for analysis. The specific assays used are described below. The laboratory utilized custom-designed antibody kits that are proprietary. The limit of detection (LOD) of each assay was defined as the value calculated from the standard curve at the point lying 2 standard deviations above the mean background media fluorescence intensity for 10 replicates. The LODs are reported in Appendix A, available on the HEI website.
Luminex Bead-Based Multiplex Immunoassay
This assay was used to measure CRP, fibrinogen, vWF, IL-6, and P-selectin. The multiplex assay methodology is based upon the Luminex xMAP technology (Austin, TX), which is capable of performing a variety of immunoassays on the surface of fluorescent-coated beads. Briefly, multiple analytes in a single aliquot of plasma are determined quantitatively and simultaneously with the Bio-Plex 200 Bead Reader System. Microbeads are dyed with differing concentrations of two fluorophores to generate distinct bead sets. Each bead set is coated with capture antibody specific for one analyte. The captured analyte is detected using a biotinylated detection antibody and streptavidin-phycoerythrin. The bead analyzer is a dual laser, flow-based, sorting and detection platform. One laser is bead-specific and determines which analyte is being detected. The other laser determines the magnitude of the phycoerythrin-derived signal, which is in direct proportion to the amount of analyte bound. Protein concentrations of samples are determined by a 5-parameter logistic regression algorithm with analysis of the median fluorescence intensity readings of an 8-point protein standard curve. This regression provides a larger range of quantitation than standard linear regression analysis. Once a regression equation is derived, the fluorescence intensity values of the standards are treated as unknowns, and the concentration of each standard is calculated. A ratio of the calculated value to the expected value of this standard is determined. A ratio between 70% and 130% for each of the standards indicates a good fit. Dilution was performed for samples falling outside the range of the standard curves. Samples were tested in duplicate. Positive controls with known analyte concentrations and negative controls on each bead plate allowed for assay QA.
This assay was used for CC16, ET-1, and nitrotyrosine. Samples, calibrators, and controls are added to wells coated with monoclonal antibody specific to the target marker. After an incubation step, the target in the samples binds to the monoclonal antibody on the well. After a wash step with an ELISA Washer (BioTek: ELx 405), antitarget antibody HRP conjugate is incubated in wells and binds to the target. Unbound target and HRP conjugate are washed off with buffer. Upon the addition of the substrate, the intensity of color detected with an ELISA plate reader (Molecular Device SpectraMax Plus 384, Sunnyvale, CA) is proportional to the concentration of target in the samples. A 4-parameter standard curve is prepared relating color intensity to the concentration of the target on each plate. Positive and negative controls on a plate allow for assay QA.
Competitive ELISA
This assay was used for 8-isoprostane. A constant concentration of 8-isoprostane-acetylcholinesterase (AChE) conjugate (8-isoprostane tracer) and varying concentrations of 8-isoprostane in unlabeled standard or samples compete for a limited number of 8-isoprostane-specific rabbit antiserum binding sites. Therefore, the concentration of the 8-isoprostane tracer specifically bound to the antiserum is inversely proportional to the 8-isoprostane concentrations of the standards or samples in the well. This rabbit antiserum-8-isoprostane (either free or tracer) complex binds to the monoclonal mouse antirabbit IgG antibody coated to the well. After washing away the unbound components, Ellman reagent (which contains substrate to AChE) is added to the well. The enzymatic reaction generates a yellow color that can be measured at 412 nm. The intensity of this yellow color is proportional to the amount of 8-isoprostane tracer bound to the well, which is inversely proportional to the amount of free 8-isoprostane in the sample or standard. The 8-isoprostane concentrations of samples are determined by a 4-parameter logistic regression algorithm with analysis of the median optical intensity readings of an 8-isoprostane standard curve. Positive and negative controls on each plate allow for assay QA.
Spirometry
Pulmonary function was assessed by spirometry. According to the study’s common protocol, spirometry was one of the qualifying tests administered during the screening visit and then to assess the response to the exposure atmosphere of those who were enrolled in the study. The outcomes of interest were FVC, FEV1, FEV1/FVC, and FEF25–75 (i.e., forced expiratory flow between 25% and 75% of FVC) corrected for BTPS. Spirometry was measured 10 minutes before the exposure, then 20 minutes and 22 hours after the end of each exposure, for a total of 9 measurements per individual.
The spirometers were calibrated weekly. Each institution followed the common SOP for spirometry except for the instrument operation section, which was site-specific. All three institutions used a dry seal spirometer: URMC used a KoKo PFT Spirometer (Nspirehealth, Longmont, CO); UNC used VIASYS 10.2-L model 1022 interfaced to a computer (SensorMedics; Palm Springs, CA); and UCSF employed an S&M Instrument, PDS Instrumentation (Louisville, CA).
Briefly, with the subject seated and wearing a nose clip, at least three technically acceptable trials were acquired at each measurement session. The results from each session were recorded in the MOSES Spirometry Data Form and entered in the DCAC data management system. For data analyses, the values for the outcomes of interest were selected from the acceptable trials according to the American Thoracic Society/European Respiratory Society performance criteria (Miller et al. 2005). Specifically, the largest FVC and FEV1 (all measurements corrected to BTPS) were selected and reported, even if they came from different trials. Other variables came from the acceptable trials with the largest sum of FVC and FEV1.
Sputum Biomarkers
Sputum was obtained 22.5 hours after the end of each exposure, for a total of three measurements. A detailed description of the procedure and the analytic methods has been provided previously (Alexis et al. 2000, 2001) and can be found in SOP 7 (Sputum Induction, Processing and Sample Shipping and Analysis, in Additional Materials 2).
Sputum Induction
In brief, following measurement of a baseline FEV1, subjects inhaled 3%, 4%, and 5% hypertonic saline from an ultrasonic nebulizer (Devilbiss UltraNeb 99 Nebulizer or NOUVAG UltraNeb 2000 Nebulizer) for three 7-minute inhalation periods, respectively. At the end of each 7-minute inhalation period, subjects performed a 3-step cleansing procedure (gargle with water, scrape the back of the throat, blow the nose) prior to coughing up secretions from the airways. Care was taken to avoid scraping the back of the throat during all cough attempts, and salt water and saliva were expectorated into a separate waste cup to avoid contamination and dilution of the expectorated sample. The FEV1 was checked after each inhalation period prior to advancing to the next inhalation period with the next saline concentration. During the procedure, the sample was kept on ice. If the FEV1 did not fall more than 10% from the baseline FEV1, the subject proceeded to the next inhalation period using the next highest saline concentration. At the completion of the induction procedure, the sample was processed in the laboratory without delay, and the subject was monitored until his/her FEV1 returned to within 10% of baseline.
Sputum Processing
Shortly after collection, sputum sample characteristics were recorded in terms of color, consistency, presence of visible plugs and salivary content. The sample was weighed, and plug selection was then performed. The plug sample was weighed, and a volume of 0.1% dithiothreitol equal to four times the plug weight (mg) was added. The sample was agitated for 15 minutes and incubated for 5 minutes in an equal volume of Dulbecco phosphate-buffered saline. After filtration with a 48–52 micron mesh filter, the filtrate was centrifuged (500g for 10 minutes), and 3–6 aliquots of the supernatant were stored at –70°C for future soluble markers analyses. Total cell counts and cell viability were assessed on the sputum cell pellet, and cytospin slides were generated and stained (Hema 3 stain kit) for differential leukocyte count analysis. Sputum samples considered acceptable for processing had a minimum of 75 mg of selected plug material, cell viability greater than 50%, and squamous epithelial cells less than 40%. Sputum supernatants and cytospin slides were stored frozen and shipped to the Sputum Core Laboratory at UNC in batches for analysis.
Sputum supernatants were analyzed for IL-6, IL-8, TNF-α, and cluster of differentiation 40 ligand (CD40L) by immunoassay using the Meso-Scale Discovery (Rockville, Maryland)/MSD platform as previously published (Frey et al. 2012) and for total protein by the Coomassie Plus (Bradford) Protein Assay.
Differential leukocyte analysis was performed on Hema 3-stained slides. A minimum of two independent readers assessed each slide and operated with a between-reader acceptance criterion of 10% for all major cell types present (PMN, macrophages, monocytes, eosinophils). A third reader was used to achieve the 10% agreement criteria (with either reader 1 or 2) should this not be met initially with the first two readers. If agreement could not be reached with a third reader, the slide was disqualified. A minimum of 500 cells were counted on all slides, and differential percentages were based on total cell counts that did not include squamous epithelial cells.
DATA MANAGEMENT
Each clinical center developed a data management plan describing the team’s organization, QA/QC responsibilities and procedures, data type and file format, data acquisition and transfer, coding of missing data, and data access, storage, and archiving.
The DCAC also developed a data management plan that described the data management services provided by NERI. These included the development and programming of case report forms (CRFs); database design, maintenance, and security; site training and support in the electronic data capture (EDC) system; monitoring of data collection; and data cleaning with resolution of discrepancies through a query process. The complete DCAC data management plan is provided in Additional Materials 4, available on the HEI website.
Description of the EDC System
At the beginning of the study, NERI’s proprietary data management system, ADEPT, was used for EDC purposes. However, all NERI studies were transitioned to eCOS (eClinicalOS, Merge Healthcare, Research Triangle Park, North Carolina) in 2013; all existing MOSES data were transferred to eCOS in June 2013. After that point, all prospective data were captured in eCOS, which is a fully integrated product suite that can be used in a manner that is compliant with FDA requirements and HIPAA and EU Privacy regulations.
Data were downloaded on a daily basis and stored in the NERI data repository. The repository resides on a secure network drive and contains secure folders. Access to the repository is restricted to a specific user list (data managers and statisticians); each center needed to provide the user list to the network staff to request access.
Study Conduct Workflow
Site coordinators at the three participating study sites completed information on electronic CRFs. Information entered into the EDC system was identified by subject ID number; no names of subjects were entered.
Each clinical research center was shipped specimen labels with the appropriate subject ID. Shipping instructions for blood and sputum samples, PES filters, BAU tapes, and Holter cards were provided to sites and also maintained at NERI. When sample batches were ready for shipment, a chain of custody was initiated. NERI prepared a manifest for review, and the sites would proofread it and provide a tracking number for the shipment. Shipping information was collected in the EDC.
The EDC system remained the central location of data entry and tracking throughout the study. Initial screening questionnaires, randomization, and pre-, mid-, and post-exposure visit information, patient measurements, and laboratory data were all managed through this system. Data from each clinical center, including blood cell counts, VE, spirometry, BP, HR (and other vital signs), and sputum plug weight, were entered into CRFs electronically.
Results of analyses conducted by the core and contract laboratories were sent to NERI in Excel workbooks or other formats. Depending on the laboratories, results were received on a monthly, quarterly or as-available basis. NERI performed initial review of the data, and the results were combined into data tables in SAS (SAS Institute, Cary, NC).
QUALITY ASSURANCE PROCEDURES
The study adhered to HEI QA/QC procedures. The procedures include the following components: (1) a common study protocol; (2) common SOPs; (3) qualified personnel; (4) record keeping procedures; (5) documented data management procedures; and (6) QC procedures for all data collected.
The common protocol defined the study’s objectives, criteria for inclusion and exclusion, experimental procedures and methodologies, analysis plan, and safety guidelines. Specifically, it included:
Rationale for the study and hypotheses to be tested,
Subject selection procedures, including inclusion and exclusion criteria,
Procedures for obtaining informed consent,
Description of all experimental procedures during each visit to the CRC and requirements for the subjects in the day preceding each visit,
Description of all outcomes and the time of their measurements,
Guidelines for the ozone concentrations and environmental parameters in the exposure chamber,
Data safety monitoring,
Randomization procedures and data analysis plan,
Safety precautions to be employed, and
Assessment of the possible risks involved in breathing ozone and in the procedures administered.
The common protocol (Additional Materials 1) was developed by the three CRC investigators in consultation with the MOSES Oversight Committee, and it was approved by the HEI Research Committee and the respective IRBs. The protocol was amended as often as necessary to accommodate changes to the experimental design. All amendments were approved by all HEI investigators and their IRBs before becoming effective, and these approvals were documented in writing by the MOSES Project Officer. Major changes to the protocol were approved by the Research Committee and are included in Additional Materials 1 (additions shown in red; deletions crossed out).
The plan for data analyses was developed by the DCAC in collaboration with the principal and co-principal investigators of the CRCs through periodic conference calls and face-to-face meetings and in consultations with the Research Committee. The final plan was approved by the Research Committee.
Common SOPs were developed and approved by the MOSES investigators for all procedures with the exception of the chamber exposure-related SOPs, which were center-specific. All SOPs were updated as needed and signed by the principal investigators. Revised SOPs were uniquely identified and dated. A meeting of the three clinical coordinators, the Data Manager, the MOSES QA Officer, and the MOSES Project Officer was held before the start of recruitment to go over the entire time line of all the procedures to be performed during each visit to ensure consistency in following the protocol.
The clinical coordinators were trained in the sputum induction procedure by the lead investigator of the Sputum Core Laboratory. The sonographers who were to perform the BAU were trained by the personnel of the BAU Core Laboratory. The majority of the samples collected at the clinical centers were analyzed by core laboratories to reduce intercenter variability. These laboratories adhered to their internal SOPs and QA/QC procedures.
Deviations from the protocol and the SOPs were documented and reported electronically to the DCAC using a specially designed form. Important deviations from the protocol are included in Additional Materials 7, available on the HEI website.
Written records documented all aspects of the research effort at the clinical centers. This includes the use of standardized checklists, data forms, and notebooks. All entries were made in indelible ink, and then dated and signed or initialed by the individual making the entry.
All four centers developed a data management plan describing the procedures to be used to assure the integrity of the data collected. These include standardized forms for data collection and reporting, and procedures for data validation, storage, back-up, and transfer. The data management plan also described internal QA/QC audit procedures for reviewing the data acquisition, tracking, and entry into the MOSES data management system. The principal investigator of each clinical center designated a study QA/QC officer who reviewed all data to verify their completeness and accuracy and to ensure that the data were accurately recorded from the source onto data forms and into the MOSES data management system. Adverse events and overall data quality were monitored periodically by the Monitoring Board.
In addition, HEI appointed an independent MOSES QA Officer to verify the degree of adherence to the MOSES protocol and SOPs and the quality of the data during onsite QA audits at the three clinical centers and the core laboratories. The scope of these audits is described below.
QA AUDITS AT THE CLINICAL CENTERS BEFORE THE START OF SUBJECT RECRUITMENT
The goal of this prestudy audit was to evaluate each ozone chamber system to verify that adequate SOPs for ozone generation and characterization were in place and to ensure the comparability of the ozone measurements made in the three chambers under test conditions. Thus, these audits included assessment of the following:
accuracy of the ozone analyzers,
stability of the ozone generation and measurement systems, temperature, and RH in the chamber over a 1–3 hour period,
traceability of the ozone transfer standard at each study center to a Standard Reference Photometer, per U.S. EPA protocols, and
evaluation of operational and calibration procedures at each center to ensure accuracy and repeatability over the entire study period, and consistency within the study.
The centers started subject recruitment after sign-off from the MOSES QA Officer that the audit requirements had been met.
QA AUDITS AT THE CLINICAL RESEARCH CENTERS DURING THE CONDUCT OF THE STUDY
Two audits were conducted by the MOSES QA Officer after subject recruitment started, one during year 1 when subject testing was in progress and one after the subjects’ testing had been completed (final audit).
The audits focused on (1) monitoring compliance with study procedures during a complete exposure session for one subject, including pre-exposure, exposure, and post-exposure visits (year 1 audit only); (2) reviewing IRB documentation and compliance with inclusion and exclusion criteria; (3) reviewing chamber operations (including calibration and transfer standard procedures and collected chamber data); and (4) reviewing data collection and management, and comparing hardcopy records and forms against database files for four or five randomly selected subjects (for a total of nine subjects over the two audits).
After each audit the MOSES QA Officer prepared a Business Confidential report of the audit. The report detailed the nature of the audit, significant findings, and any requirements for corrective action(s). The audit report was provided to the HEI Director of Science and the MOSES Project Officer for transmission to and discussion with the principal investigator. The principal investigator was required to respond in writing to HEI. If corrective action(s) was required, the principal investigator ensured that such action(s) was taken and documented in a response letter to HEI. Where errors in data records were found, most were corrected during the QA audit.
AUDIT OF THE MOSES FINAL REPORT AT THE DATA COORDINATING AND ANALYSIS CENTER
An audit of the MOSES final report and the codes and codebook for the statistical analyses was conducted to verify that the data reported could be tracked back to the database and the results were reproducible. The QA statement related to this audit is provided in this report.
STATISTICAL METHODS AND DATA ANALYSES
POWER CALCULATIONS
The power calculations were conducted in November 2011, before the study started, and then again in January 2014 using the data from the first 27 MOSES subjects. The calculations are based on a simplification of the model in which we compare the mean change between pre-exposure and four hours post-exposure in an outcome measure in adjacent exposure groups (0 ppb vs. 70 ppb and 70 ppb vs. 120 ppb). To account for the fact that there are two comparisons for each outcome measure, we used a two-sided 2.5% significance level (α = 0.025) and 90% power (1 – β = 0.90).
We have estimated the minimum difference to be detected between two adjacent exposure levels (effect size) for four outcome measures, assuming two sample sizes and four combinations of the within-subject correlation of the pre- and post-exposure measures (r) and the correlation of difference between two adjacent ozone concentrations (r′). The calculations did not determine the power to test for interactions.
At the time of the 2011 power calculations, the designation of primary outcomes was still being discussed, and we selected four outcomes for which data were available in the literature that could be used for the calculations. The four outcome measures selected were:
endothelial function (FMD),
cardiac function (HRV and SDNN),
repolarization (QTc), and
prothrombotic marker (vWF antigen).
For the 2014 calculations we used all the primary outcomes.
Table 6 shows the 2011 power calculations for each outcome, including the minimum difference between two exposures to be detected as statistically significant at the 2.5% significance level, with 90% power for two sample sizes and four combinations of within-person correlation of the measures. The results are summarized below. The complete results of the 2011 and 2014 calculations can be found in Additional Materials 5, available on the HEI website.
Table 6.
Results of 2011 Power Calculations (for Standardized Effect Size)
Variable
Correlation Between Pre-Exposure and Post-Exposure (r)
FMD was measured the day before the exposure and four hours after exposure. The outcome is the difference between exposures in the change between pre- and post-exposure. If r is 0.8 and r′ is 0.2, then a sample with 90 participants (30 per site) provides 90% power to detect a difference in change between exposures of 1.12%. If the sample size is 54 participants (18 per site), then the difference in change between the two exposure groups would need to be 1.45% or greater to have the same power.
In the 2014 power calculations for FMD (the only common outcome between the sets of calculations) using the SD and r (= 0.58) determined from MOSES data (and assuming r = r′), a sample size of 90 provides 90% power to detect a difference in change between exposures of 0.74%.
Cardiac Function
QTc and SDNN were measured by ECG using a 24-hour Holter monitor. The QTc and SDNN values immediately pre-exposure and four hours post-exposure were compared. The outcome is the difference between exposure levels in the mean change in each measure between pre- and post-exposure.
For QTc, if r is 0.8 and r′ is 0.2, then a sample with 90 participants (30 per site) provides 90% power to detect a difference in QTc change between exposures of 6.2 ms. If the sample size is 54 participants (18 per site), then the difference in change between the two exposure groups would need to be 8.1 ms or greater to have the same power.
For SDNN, if r is 0.8 and r′ is 0.2, then a sample with 90 participants (30 per site) provides 90% power to detect a difference in SDNN change between exposures of 8.4 ms. If the sample size was 54 participants (18 per site), then the difference in change between the two exposure groups would need to be 11.0 ms or greater to have the same power.
Prothrombotic Marker
vWF antigen was measured in venous blood sampled the day before and at two times after the exposure. The values before exposure and 3.5 hours post-exposure were compared. The outcome is the difference between exposure levels in the mean change in vWF between pre- and post-exposure. For vWF power calculations we used SD = 12.
If r is 0.8 and r′ is 0.2, then a sample with 90 participants (30 per site) provides 90% power to detect a difference in change between exposures of 3.6 ng/mL. If the sample size was 54 participants (18 per site), then the difference in change between the two exposure groups would need to be 4.7 ng/mL or greater to have the same power.
STATISTICAL ANALYSIS
The statistical analyses were conducted according to the Statistical Analysis Plan approved by the HEI Research Committee. As we started to conduct the analyses, a few modifications to the plan were made and described in the Addendum to the Statistical Analysis Plan (see Statistical Analysis Plan in Additional Materials 5).
Initially, raw data were assessed for outlying values. Any value that was not within ±2 SDs of the mean was returned to the data source for verification. All suspect values were either verified or corrected. Outcomes were then calculated by subtracting the pre-exposure value from each post-exposure value, when outcomes were measured before and after exposure. When outcomes were only measured one time per exposure, these values were analyzed. Outcomes were first assessed for normality using the Kolmogorov-Smirnov (KS) test. Optimal power transformations were considered that would maximize the normality of the data according to the KS test. Ultimately the natural log transformation (with the addition of 0.001 to 0 values) was chosen for outcome variables that were non-normal, based on KS tests and assessment of histograms. The reason that 0.001 was added rather than 0.1 or 0.5 is because the measurement accuracy for these outcomes was between one and two decimal places. Further, adding 0.1 or 0.5 would have changed the rank order of the data for some of the outcomes as some observations were less than 0.1. These variables were summarized by medians and interquartile ranges. Variables that were normally distributed were summarized using means and SDs.
The first test that was performed was to assess whether the treatment assignment randomization resulted in balanced exposure groups. Age, BMI, SBP, and diastolic blood pressure (DBP) were assessed using a one-way analysis of variance (ANOVA), where the independent variable was an indicator variable for the randomization order.
Mixed-effect linear models accounting for repeated measures, with a random subject effect and a covariance structure, were used to evaluate the impact of exposure to ozone on the prespecified primary and secondary outcomes. The covariance structure assigned is the standard variance component matrix where a distinct variance component is assigned to each effect for the matrix. Ozone was treated as a categorical (3-level) variable in all regression models. Site and time (when multiple measurements were taken) were controlled for in the models.
The main effects model for this design is:
where y is the change in the outcome measure (post-exposure minus pre-exposure) for subject i at center j at ozone concentration k at time t, μ is the intercept, τ is the effect of ozone concentration k, α is the effect of center j, β is the effect of subject i in center j, θ is the effect of time t, and ε is the independent and identically distributed Gaussian random errors. In the tables of the model’s results presented in the Results section we report the P values from the model Type III sum of squares (Type III SS), which tests for the main effect after other main effects and interactions, and the mixed model effect estimates (and confidence interval) at each ozone exposure.
When there was a statistically significant effect of ozone on an outcome, the ozone by time interaction was assessed to determine whether the ozone effect was consistent across the post-exposure times. The interaction model for this design is:
where y is the change in the outcome measure (post-exposure minus pre-exposure) for subject i at center j at ozone concentration k at time t, μ is the intercept, τ is the effect of ozone concentration k, α is the effect of center j, β is the effect of subject i in center j, θ is the effect of time t, τθ is the interaction effect of treatment k at time t, and ε is the independent and identically distributed Gaussian random errors.
Three analogous interaction models were fit with the inclusion of (1) the main effect for subject’s sex and the interaction between sex and ozone concentration; (2) the main effect for subject’s age and the interaction between age and ozone concentration; and (3) the main effect for subject’s GSTM1 status (null or sufficient) and the interaction between GSTM1 status and ozone concentration. Age was treated as a continuous value and centered by subtracting the subject’s age from the mean age for the cohort (60.2 yr). Thus a negative effect estimate in the interaction model with age should be interpreted to mean that an increase in the outcome from pre- to post-exposure is associated with an increase in age when comparing 70 and 120 ppb versus 0 ppb. We did not test whether there was an effect of age, sex, or GSTM1 status independent of ozone concentration on any of the outcomes evaluated.
For FEV1 and FVC we used a t test to calculate the significance of the change from pre- to post-exposure at 0 ppb ozone.
Scatter plots were used to illustrate the degree of correlation between specified variables. A post-hoc analysis was performed to further examine possible relationships between ozone effects on respiratory variables (FEV1 and PMN % in sputum) and on the primary cardiovascular outcomes. For FEV1, subjects were divided into two groups: > median and ≤ median change from pre-exposure in FEV1 15 minutes after 120 ppb ozone exposure. For PMN %, the two groups were > median and ≤ median PMN % in sputum after 120 ppb ozone exposure. The main effects models described above were run separately on these subject subgroups for all of the primary cardiovascular outcomes.
In order to compare the effects of ozone concentration on symptoms, the Fisher exact test was used to analyze the Symptom Questionnaire data since the mixed models were not converging.
Analyses were performed using SAS, version 9.3 or later (SAS Institute, Cary, NC) and R version 3.2.2 or later (The R Foundation for Statistical Computing).
This study involved a large number of comparisons, and we addressed this with two approaches. First, after discussion with the Research Committee we used α = 0.01 as a reasonably conservative threshold for statistical significance. Effect estimates with P values greater than 0.01 and less than 0.05 were considered marginally significant. Second, we prespecified a limited number of outcomes within each physiological response pathway as primary (total of 10 primary variables). Results were then interpreted within the context of coherence among related variables, and plausibility. Significant changes in secondary variables were to be considered hypothesis-generating but not definitive, unless there were changes consistent with effects on the primary outcome variable(s) for that response pathway. In that case the secondary variable was considered supportive of the findings for the primary variable(s).
MISSING DATA
Analyses were performed on the N = 87 subjects who completed all three ozone exposures out of the N = 94 subjects who were randomized. For outcomes that were assessed multiple times post-exposure, a subject needed to have a pre-exposure value and at least one post-exposure value to be included in the analysis for that outcome. As we can see from Appendix A, the missingness ranged from 0% missing for BP to 41% missing for sputum PMN count, because of the inability of several subjects to generate sufficient sputum for analysis.
RESULTS
SUBJECT RECRUITMENT
Never-smoking, physically active male and female English-speaking volunteers of all ethnic backgrounds were recruited from the general population for this IRB-approved study.
At URMC 451 individuals contacted the coordinator to request information about the study and were sent a study summary document approved by the IRB. Of those individuals, 74 called the coordinator to request an initial phone screening, and of these, 56 attended screening visits and were enrolled. Of these, 23 subjects failed screening and were withdrawn. One subject completed two exposures, and 32 completed all three exposures.
At UNC 269 individuals responded to the advertisement, and 253 responded to the initial phone screening. Subsequently, 189 were found to be ineligible based on responses to the phone questionnaire or did not attend the scheduled screening session. The remaining 64 individuals enrolled in the study. Of these, 30 failed the screening sessions, 2 withdrew from the study prior to any exposures, 2 were withdrawn after being randomized for safety concerns, 1 completed two exposures, and 29 completed all three exposures.
At UCSF 342 individuals responded to the advertisement, and 267 responded to the initial phone screening. Of these, 218 were determined to be ineligible. The remaining 49 individuals were sent study documents, were scheduled for screening visit 1, and were consented. Of these, 22 were deemed ineligible or withdrew from the study. One subject completed two exposures, and 26 completed all three exposures.
In total 87 subjects completed all three exposures, and 3 subjects completed two exposures. Two of the women were premenopausal. A summary of the number of subjects at the various stages of recruitment and enrollment is provided in Table 7.
Table 7.
Summary of Subject Recruitment and Testing by Center
Table 8 summarizes the number of adverse events overall and by center for all subjects who completed all three exposures (N = 87). Overall 39 adverse events occurred in 20 subjects; 12 subjects had 1 event, 6 subjects had 3 events, 1 subject had 4 events, and 1 subject had 5 events. The grading of events can be found in the MOSES common protocol in Additional Materials 1.
Table 8.
Number of Adverse Events for Subjects Completing All 3 Exposures by Center
Adverse events were generally mild or moderate, with the most common being headache, which was attributed to caffeine withdrawal. Tylenol was offered to the subject when those events occurred. The most serious events were eight adverse events in two participants (one of grade 3) associated with nitroglycerin administration in the fall of 2012, which resulted in the decision to discontinue nitroglycerin administration for the measurement of flow-independent FMD. The only other grade 3 event was associated with hip and groin pain, but this was not related to any procedures. The list and the description of all adverse events by grade and by center can be found in Additional Materials 6, available on the HEI website.
DEVIATIONS FROM THE PROTOCOL AND SOPS
Table 9 summarizes the protocol deviations by clinical site. There were a total of 43 protocol deviations, and 30 subjects who completed all three exposures had at least one protocol violation. The four subjects who did not meet all the inclusion and exclusion criteria had smoked one joint of marijuana per day for more than one year. These subjects were identified during the final QA audit and were included in the analyses. Deviations are provided in Additional Materials 7. None of the protocol deviations were deemed to have a significant impact on the outcomes measured.
Table 9.
Protocol Deviations for Subjects Completing all 3 Exposures by Center (N = 87)
URMC
UNC
UCSF
Number of subjects who had at least 1 protocol deviation
12
7
11
Total protocol deviations
18
7
18
Study procedures/assessments performed prior to consent
0
0
0
Obtained consent with outdated/expired consent document
0
0
0
Enrolled subject who did not meet all inclusion/exclusion criteria
3
0
1
Performed study procedure not approved by IRB
0
0
0
Enrolled subject after IRB approval expired
0
0
0
Failed to report adverse event to IRB or sponsor
0
0
0
Failed to follow randomized ozone dosing amount
0
0
0
Failed to perform study procedure as outlined in protocol
The characteristics of the 87 subjects who completed all three exposures and were included in the analyses are shown in Table 10. Of those, 52 (60%) were women and 35 were men. UNC had the highest percentage of women (69%) and UCSF had the lowest (46%). The mean (±SD) age of the subjects was 59.9 (4.5) years. The majority of subjects (88%) identified themselves as white, with African American being the next most common with 5 (6%). Overall, 50 (57%) of the subjects were GSTM1 null, and the prevalence was consistent across the three centers. DBP differed significantly across the centers, with URMC having the lowest and UNC the highest.
aP values for categorical variables were calculated using Fisher Exact tests; P value for continuous variables were calculated using ANOVA.
b LDL calc = calculated low-density lipoprotein.
EXPOSURE CONDITIONS AND MINUTE VENTILATION DURING EXPOSURE
Exposure Conditions
Table 11 presents the exposure conditions of the environmental chambers, overall and by center. The ozone concentrations in the chambers were very close to the target values at all three centers. The technology at UNC was such that these target values were obtained almost exactly. The overall mean (±SD) temperature for all exposures was 22.3 (0.7)°C, compared to the target of 22°C, and the mean (±SD) relative humidity was 41.4 (3.0)%, compared to the target of 40%. The RH at URMC was slightly higher than the other two sites. At UNC the chamber temperature and RH were computer-controlled so that the chamber environment was maintained precisely at target values. The particle count at UNC is substantially higher than at the other two sites since it includes condensation particles down to 4 nm versus 7 nm at URMC and 20 nm at UCSF.
b Particle count was measured using a condensation particle counter with a size range of 7 nm to 3 μm.
c Variations in the mean and confidence interval disappear once the values are reduced to one decimal place.
d Particle count was measured during quarterly QA/QC of the chamber using a condensation particle counter with a size range of 4 nm to 3 μm. The subject was not in the chamber; however, personnel periodically entered the chamber during the QA/QC activities.
e Particle count was measured using a P-TRAK counter with a size range of 20 nm to 1 μm.
f Measurement of particle count started on September 4, 2013.
Minute Ventilation During Exposure
Minute Ventilation During Exercise Decreased During Ozone Exposure.
Mean VE remained within the target value of 15–17 L/min/m2 BSA (BTPS). The average 0 ppb VE across the three sites was 16.6 L/min/m2. During 70 ppb ozone exposure, compared with 0 ppb, VE decreased by 0.53 L/min/m2 BSA (95% CI, –0.87 to –0.20; P = 0.002). During 120 ppb, compared with 0 ppb, VE decreased by 0.60 L/min/m2 BSA (95% CI, –0.94 to –0.27; P < 0.001, data not shown). We found no interactions with sex, age or GSTM1 status. Distribution statistics are in Appendix A.
EFFECTS OF OZONE ON HEALTH OUTCOMES
The following sections describe the results of the mixed-effect linear models used to evaluate the impact of exposure to ozone on the prespecified primary and secondary continuous outcomes. Descriptive statistics for all primary and secondary outcomes across all exposures are shown in Appendix A. Results of the regression models without and with interaction for all the outcomes are presented in Appendices B and C, available on the HEI website.
Effects of Ozone on Cardiac Function
The distribution of each outcome as measured at preexposure, and 15-minute, 4-hour, and 22-hour post-exposure is shown in Table 12. Endpoints that were not normally distributed (24-hr-average RMSSD; 24-hr-average HF; 24-hr-average LF) were log transformed for all subsequent analyses.
Table 12.
Descriptive Statistics of Primary and Secondary Autonomic Function and Repolarization Outcomes
We found no significant effects of ozone exposure on autonomic function. We analyzed both time- and frequency-domain measures of heart rate variability (HRV) on the 24-hour Holter recording, as indicators of changes in cardiac autonomic function. The outcomes were averaged over distinct 5-minute rest periods and over the entire 24-hour period. Primary markers of HRV measured as 5-minute averages are HF and LF; secondary markers are RMSSD, SDNN, and HR. The primary outcome measured as a 24-hour average is RMSSD; the secondary outcomes are HF, LF, SDNN, and HR. There were no statistically significant changes from pre- to post-exposure for any primary or secondary measure of autonomic function among the three ozone exposures (0 ppb, 70 ppb, and 120 ppb) (Table 13). Although not statistically significant, we did observe similar patterns of response for HF, LF, and RMSSD at different times after exposure, when analyzing the 5-minute data (P = 0.067, P = 0.109, and 0.116, respectively). There was an immediate increase in RMSSD 15 minutes after exposure, which was strongest for the 120 ppb ozone exposure (Figure 3). However, this increase was much smaller or not present at the 4-hour and 22-hour post-exposures. Although less distinct, changes in HF and LF showed similar patterns. Consistent with this, small nonsignificant but ozone concentration-related decreases in HR also occurred 15 minutes and 4 hours after exposure.
Table 13.
Main Analyses: Ozone Effects on Autonomic Function
Effect of ozone on HF, LF, RMSSD, and HR (5 min averages). Changes from pre-exposure in (A) HF, (B) LF, (C) RMSSD, and (D) HR, for exposures to 0, 70, and 120 ppb ozone at 15 min, 4 hr, and 22 hr post-exposure. Pre-exposure mean and SD values are shown as an insert. The whiskers represent 95% CIs.
Independent of ozone exposure level, we observed significantly faster 5-minute-average HRs (3.1 beats/min; 95% CI, 1.1 to 5.1; P = 0.003) and marginally significantly decreased levels of natural logarithm (Ln) LF 24-hour average (–0.403; 95% CI, –0.732 to –0.074; P = 0.017) in females compared to males (Appendix Tables B.1.16f and B.1.15f, respectively).
We found no convincing evidence for interactions between ozone exposure and age, sex, or GSTM1 status for any primary or secondary marker of autonomic function. There was a statistically significant interaction between age and ozone exposure on the Ln of 24-hour-average RMSSD, a primary outcome (P = 0.008; Appendix Table B.1.4c), but without a concentration–response relationship. The individual comparisons between 70 and 0 ppb and between 120 and 0 ppb were not significant, and were in opposing directions (Appendix Table B.1.4d).
There was a marginally significant interaction between ozone exposure and age for 24-hour-average Ln LF, a secondary outcome (P = 0.028) (Appendix Table B.1.15c). However, each 1-year increase in age was associated with a marginally significant increase from pre- to post-exposure in Ln LF when comparing 70 ppb to 0 ppb ozone (–0.02 Ln of ms2; 95% CI, –0.03 to 0.00; P = 0.020), but not when comparing 120 ppb to 0 ppb ozone (0.00 Ln of ms2; 95% CI, –0.01 to 0.01; P = 0.956) (Appendix Table B.1.15d).
We also observed marginally significant interactions between ozone and GSTM1 for HR (based on 5-minute averages of the NN interval, P = 0.012) (Appendix Table B.1.16g). Heart rate decreased in GSTM1-sufficient subjects relative to GSTM1-null subjects after exposure to 120 ppb ozone compared to 0 ppb ozone (–2.5 beats/minute; 95% CI, –4.3 to –0.7; P = 0.006), but not after exposure to 70 ppb ozone relative to 0 ppb ozone (–0.3 beats/minute; 95% CI, –2.1 to 1.4; P = 0.700) (Appendix Table B.1.16h).
We also examined changes in 5-minute averages of ECG outcomes of autonomic function (primary: HF and LF; secondary: RMSSD, SDNN, and HR from pre-exposure to exposure exercise 6, excluding other portions of the exposure session). Exercise session 6 was the last exercise session during each exposure. As shown in Table 12, values of HF, LF, RMSSD, and SDNN were substantially lower, and the LF/HF ratio and HR substantially higher, during exercise 6 than during the pre-exposure and three post-exposure time periods for all exposures, independent of ozone concentration. Consistent with our analysis of the post-exposure 5-minute periods, there were no statistically significant ozone effects on the 5-minute averages during exercise 6 for either of the HRV primary outcomes: HF (P = 0.390) and LF (P = 0.549) (Table 14). We saw no significant or marginally significant changes in the secondary outcomes either (all P values >0.05). See Appendix C.1.
Table 14.
Main Analysis: Ozone Effects on Autonomic and Repolarization Outcomes During Exposure Exercise 6
b Change from pre- to during-exposure (exercise 6) for each ozone concentration, compared to change from pre- to post-exposure at 0 ppb.
Repolarization
We found no significant effects of ozone exposure on any electrocardiographic index of repolarization. Changes in cardiac repolarization were assessed using 5-minute and 24-hour averages of T-wave amplitude (primary outcome), QTc (secondary outcome), and ST segment changes. We measured ST segment changes in three ECG leads: V5 (primary outcome), and II and V2 (secondary outcomes). There were no statistically significant ozone-related changes from pre- to post-exposure for any repolarization marker (Table 15 and Figure 4). The overall effect of ozone exposure on 24-hour-average ST segment change measured in V2 was marginally significant (P = 0.019). Compared to 0 ppb ozone, 120 ppb ozone caused a small increase (4.7 μV, 95% CI, 1.0 to 8.5; P = 0.013), while 70 ppb ozone exposure caused no change (0.1 μV; 95% CI, –3.6 to 3.8; P = 0.943) (Table 15 and Appendix Table B.1.22b). However, we observed no such effects of ozone on 24-hour-average ST segment changes measured in leads V5 or II.
Effect of ozone on T-wave amplitude, QTc, ST segment lead V5, and ST segment lead V2 (5 min averages). Changes from pre-exposure in (A) T-wave amplitude, (B) QTc, (C) ST segment in lead V5, and (D) ST segment in lead V2 for exposures to 0, 70, and 120 ppb ozone 15 min, 4 hr, and 22 hr post-exposure. Pre-exposure mean and SD values are shown as an insert. The whiskers represent 95% CIs. (Continues next page)
We did not find any statistically significant interactions between ozone exposure and age for any biomarker of repolarization.
Independent of ozone exposure level, we observed a marginally significant difference by sex in 5-minute T-wave amplitude (P = 0.011), a significant difference in 24-hour T-wave amplitude (P < 0.001), a marginally significant difference in 5-minute average QTc (P = 0.039), and a significant difference in 24-hour ST segment change in V5 (P < 0.001), with T-wave amplitude and ST in V5 decreasing, and QTc increasing, in women relative to men (Appendix Tables B.1.5e, B.1.6e, B.1.18e, and B.1.8e, respectively).
In addition, we observed marginally significant interactions between sex and ozone exposure for 5-minute average QTc (P = 0.034) (Appendix Table B.1.18e). Ozone caused a larger decrease in 5-minute QTc from pre- to post-exposure in females compared to males when exposed to 70 ppb compared to 0 ppb ozone (–4.2 ms; 95% CI, –7.4 to –1.0; P = 0.010) but not when comparing 120 ppb to 0 ppb ozone exposure (–2.7 ms; 95% CI, –5.9 to 0.5; P = 0.101) (Appendix Table B.1.18f), but not for either 5-minute (P = 0.70) or 24-hour-average T-wave amplitude (P = 0.05). There was no significant ozone–sex interaction for either 5-minute (P = 0.70) or 24-hour-average T-wave amplitude (P = 0.05) (Appendix Tables B.1.5e and B.1.6e).
We did observe a statistically significant interaction between ozone exposure and GSTM1 status for 5-minute-average QTc (P = 0.009), a secondary outcome. In GSTM1-sufficient relative to GSTM1-null subjects, QTc decreased after exposure to 120 relative to 0 ppb exposure (–5.1 ms; 95% CI, –8.3 to –1.8; P = 0.002), but not after exposure to 70 relative to 0 ppb ozone (–2.2 ms; 95% CI, –5.4 to 0.9; P = 0.167). (See Appendix Tables B.1.18h and B.1.18i.) However, the interactions between ozone exposure and GSTM1 status for 5-minute-average and 24-hour-average T-wave amplitude, both primary outcomes, were not significant (P = 0.060 and P = 0.594 respectively). (See Appendix Tables B.1.5g and B.1.6g.)
We also examined changes in 5-minute averages of ECG outcomes of repolarization from pre-exposure to exposure exercise 6 (primary: T-wave amplitude and ST in V5; secondary: QTc, ST in II, and ST in V2). As shown in Table 12, values of ST in V5, ST in lead II, and ST in V2 were substantially lower during exercise 6 than during the pre-exposure and three post-exposure time periods for all three ozone exposures. In contrast, QTc and T-wave amplitude values during exercise 6 were similar to measures made during both the pre- and post-exposure periods. Consistent with our analysis of the post-exposure 5-minute periods, there were no statistically significant ozone effects on any of the repolarization markers during exercise 6 (Table 14). For more details on these analyses, see Appendix C.1.
Arrhythmia
We found no statistically significant effect of ozone exposure on ventricular or supraventricular arrhythmia. We quantified ventricular ectopy and supraventricular ectopy in each 24-hour Holter recording, including single premature beats, couplets, and runs. There were no differences among ozone exposures in the percentage of VE and SE singles and VE and SE couplets or runs (Table 16). In addition, the distribution of VE and SE singles, couplets, and runs (for subjects with at least one single, or one couplet or run) was very similar for each ozone exposure level (Table 17).
Table 16.
Number and Percent of Subjects With any VE and SE Singles and With Any Couplets or Runs by Ozone Concentration
a Raw data can be found in Appendices B.1 and C.1 (available on the HEI website). N = number of subjects.
In our mixed model analyses (Table 18), there was a marginally significant association between ozone exposure and the odds ratios (OR) of VE couplets or runs when comparing the 70 ppb and 0 ppb exposures (OR = 2.51; 95% CI, 1.03 to 6.07; P = 0.042) but not when comparing the 120 ppb and 0 ppb ozone exposures (OR = 1.71; 95% CI, 0.69 to 4.26; P = 0.243). Further, there was no clear concentration–response relationship as the largest OR was for the 70 ppb exposure rather than the 120 ppb exposure. Similarly, there was no association between ozone exposure and the odds of SE couplets or runs, either when comparing the 70 ppb and 0 ppb ozone exposures (OR = 1.11; 95% CI, 0.55 to 2.23; P = 0.777) or when comparing the 120 ppb and 0 ppb exposures (OR = 0.61; 95% CI, 0.30 to 1.21; P = 0.158). We did not evaluate interactions between ozone and age, sex, and GSTM1 on the odds of VE or SE, because of the small number of VE and SE events in this healthy study population. These results do not support effects of ozone exposure on VE or SE. For more details on the results of the statistical analyses, see Appendix B, sections 23 and 24.
Table 18.
Relative Odds (and 95% Confidence Interval) of a VE or SE Couplet or Run Associated With 70 ppb and 120 ppb Ozone Exposures, Compared to 0 ppb Ozone Exposure
Similarly, we counted the number of single VE and SE beats and the number of VE and SE couplets or runs during the 3-hour exposure periods. The percentages of ECG recordings with at least 1 VE single beat, at least 1 SE single beat, at least 1 VE couplet or run, and at least 1 SE couplet or run were similar across the three ozone exposures (0 ppb, 70 ppb, 120 ppb) (Table 16). However, the number of recordings with at least 1 VE or SE couplet or run was small for all ozone exposures. Further, among those with any single ectopic beats on their recording, the number of VE and SE events was similar across ozone exposures (Table 17). The mixed model analyses of couplets and runs did not show any effect of ozone (Table 18), consistent with the results of the 24-hour analyses.
Effects of Ozone on Systemic Inflammation, Oxidative Stress, and Vascular Function
Systemic Inflammation and Oxidative Stress
Ozone caused no change in plasma CRP, IL-6, 8-isoprostane, or P-selectin. We measured CRP (primary outcome) and IL-6, markers of systemic inflammation that have been associated with risk of adverse cardiovascular outcomes; 8-isoprostane, a marker of lipid peroxidation that has been used as a marker of oxidative stress; and P-selectin, an adhesion molecule that is a marker of endothelial cell activation, at three time points, the day prior to exposure and 4 hours and 22 hours after exposure. The descriptive statistics are shown in Table 19, and the model’s results are shown in Table 20. The distribution of values for CRP is skewed (see Table 21 and Figure 5). In linear regression analysis, there were no statistically significant associations of ozone with any of these biomarkers, and no interactions with sex, age, or GSTM1 status. For details on the results of the statistical analyses see Appendix B.2. In a sensitivity analysis, there were no significant ozone effects on CRP when subjects with baseline CRP values above the median were excluded (see Appendix Table B.2.3).
Table 19.
Descriptive Statistics of Primary and Secondary Inflammatory and Vascular Outcomes
Distribution of CRP values obtained the day before exposure. (A) Raw data; (B) Ln-transformed data.
Ozone caused a decrease in plasma nitrotyrosine after 120 ppb, but not after 70 ppb exposure. We measured nitrotyrosine (secondary outcome), a metabolite of nitric oxide (NO) and a marker of oxidative stress, at three time points: the day prior to exposure and 4 hours and 22 hours after exposure. In linear regression analysis, ozone effects on nitrotyrosine were marginally statistically significant (P = 0.016) (Table 20). While there was no change in nitrotyrosine after 70 ppb at either time point, there was a statistically significant decrease after 120 ppb (P = 0.005, Figure 6, panel A). We found no significant interaction of ozone with sex, age, or GSTM1 status. (See Appendix B.2.10.).
Effect of ozone on ET-1 and nitrotyrosine. Changes from pre-exposure in (A) ET-1 and (B) nitrotyrosine for exposures to 0, 70, and 120 ppb ozone at 4 hr and 22 hr post-exposure. Pre-exposure mean and SD values are shown as an insert. The whiskers represent 95% CIs.
Vascular Function
Ozone caused no change in blood pressure. We measured systolic BP (primary outcome) and diastolic BP on the day before exposure, 30 minutes pre-exposure, twice during exposure rest periods, and at 15 minutes, 4 hours, and 22 hours after exposure. The descriptive statistics for these and the other vascular function variables are shown in Table 19, and the results are shown in Table 20. There were changes in both SBP and DBP over time, independent of ozone exposure, with DBP increasing during and 15 minutes after exposure and SBP increasing 4 hours after exposure (Figure 7). However, in linear regression analysis, we observed no statistically significant effects of ozone on either SBP or DBP (Table 20), and there were no significant interactions with sex, age, or GSTM1 status (see Appendix B.2.2 and B.2.6).
Effect of ozone on SBP. Changes from pre-exposure in SBP for exposures to 0, 70, and 120 ppb ozone at rest periods 2 and 4 during exposure and at 4 hr and 22 hr post-exposure. Pre-exposure mean and SD values are shown as an insert. The whiskers represent 95% CIs.
Ozone caused no change in brachial artery ultrasound parameters. Flow-mediated dilatation (primary outcome) was measured the day prior to exposure and four hours post-exposure. While there was a slight increase in FMD after all three exposures (Table 19), no statistically significant difference was observed due to ozone. In linear regression analysis (Table 20), we found no interaction with sex, age, or GSTM1 status (Appendix B.2.4). In sensitivity analyses, exclusion of FMD measurements judged to have lower image quality did not change the results. Ozone exposure did not significantly alter FMD when subjects with poorer baseline vascular function (FMD ≤5%) were excluded. Further, FMD was unaffected when subjects were stratified by baseline CRP (see Appendix B.2.4).
Two additional secondary measures of vascular function obtained during BAU sessions — brachial artery diameter and velocity time integral — were unaffected by ozone. BAD increased 0.08 mm in women relative to men after exposure (95% CI, 0.02 to 0.14; P = 0.013), independent of ozone (Appendix Table B.2.8f). We observed no statistically significant interaction of changes in BAD with sex, age, or GSTM1 status (Appendix B.2.8). For VTI there was a marginally significant interaction with age (P = 0.044). For each year of increasing age, and relative to air exposure, VTI increased 1.3 cm after 70 ppb (P = 0.021) and 1.2 cm after 120 ppb ozone (P = 0.049) (Appendix Table B.2.7c and d). There was no significant interaction with either sex or GSTM1 status (see Appendix Tables B.2.7 and B.2.8).
Ozone increased plasma endothelin-1 after 120 ppb, but not after 70 ppb exposure. We measured ET-1 (secondary outcome), a potent vasoconstrictor produced by endothelial cells, at three time points: the day prior to exposure and 4 hours and 22 hours after exposure. The changes from pre- to post-exposure over time are shown in Figure 6, panel B. In linear regression analysis, ozone effects on ET-1 were statistically significant (P = 0.008) (Table 20). While there was no change in ET-1 after 70 ppb at either time point, there was a marginally statistically significant increase after 120 ppb compared with 0 ppb (P = 0.028, Appendix Table B.2.12b). We found no statistically significant interactions of ozone with sex, age, or GSTM1 genotype (Appendix B.2.12).
Effects of Ozone on Prothrombotic Vascular Status
Ozone exposure did not increase platelet activation. We used flow cytometry to measure several markers of platelet activation at three time points: the day prior to exposure and approximately 4 hours and 22 hours after exposure. Monocyte–platelet conjugates, formed when activated platelets adhere to monocytes, is the primary outcome. We hypothesized that ozone exposure would increase markers of platelet activation. The descriptive statistics are shown in Table 22, and the model results are shown in Table 23. There were no significant ozone effects on any of the markers of platelet activation. We found a marginally significant interaction between ozone and age for monocyte–platelet conjugates (P = 0.013), with monocyte–platelet conjugate count decreasing with increasing age after 70 ppb ozone exposure. There was a marginally significant interaction with GSTM1 (P = 0.049): monocyte–platelet conjugate count increased after 70 ppb but not 120 ppb ozone exposure in sufficient relative to GSTM1-null subjects (Appendix Table B.3.3g). There were no significant interactions with sex or GSTM1 status. See Appendix B.3.3.
Table 22.
Descriptive Statistics of Primary and Secondary Prothrombotic Vascular Outcomes
b Change from pre- to post-exposure for each ozone concentration, compared to change from pre- to post-exposure at 0 ppb.
Ozone exposure did not affect circulating microparticles. MPs originate from plasma membranes of injured or activated platelets, endothelial cells, leukocytes, and red blood cells. They are considered to be prothrombotic, and may express tissue factor (TF). We used a novel approach to quantitate MP-TFA (primary outcome) from isolated MP, and used flow cytometry to determine counts of MP from platelets (CD42b+), MP from activated platelets (CD42b+ and CD62P+), and MP expressing TF (CD142+) or CD40L. There were no significant ozone effects on MP. MP expressing CD40L showed a significant ozone–sex interaction (P < 0.001), with decreases in females relative to males after 120 ppb ozone relative to air exposure (Figure 8 and Appendix Table B.3.11e and f). There were no significant age or GSTM1 interactions for these outcomes. (See Appendix B.3.11.)
Effect of ozone on CD40 ligand MP count by sex. Changes from pre-exposure across 0, 70, and 120 ppb exposure sessions at 4 hr and 22 hr post-exposure in females and males.
Ozone exposure did not alter plasma concentrations of vWF or fibrinogen (secondary outcomes). vWF is released from injured or activated endothelial cells and from platelets, and is considered a marker of endothelial perturbation. Fibrinogen is a coagulation factor and also a marker of systemic inflammation. There were no main ozone effects on vWF. We observed a marginally significant ozone–age interaction (P = 0.018). For every 1-year increase in age, exposure to 120 ppb ozone resulted in an increase of 1,382 ng/mL in vWF (95% CI, –2,512 to –252; P = 0.017). See Appendix Table B.3.5c and d.
Fibrinogen decreased with 70 ppb ozone (–157 μg/mL) and increased with 120 ppb ozone (317 μg/mL) relative to air exposure, with marginal statistical significance (P = 0.048) (Appendix Table B.3.6a). Relative to GSTM1-null subjects, fibrinogen decreased 575 μg/mL (95% CI: –1,144 to –6; P = 0.048) from pre- to post-exposure in GSTM1-sufficient subjects, independent of ozone exposure (Appendix Table B.3.6h). However, there was no interaction between ozone and GSTM1 status (P = 0.11), and there were no significant age or sex interactions. (See Appendix B.3.6.)
Effects of Ozone on Lung Function, Airway Inflammation, and Lung Injury
Although our hypothesis focused on possible acute cardiovascular effects of the inhalation of low levels of ozone, we recognize that the initial effects of ozone inhalation involve the lower airways, and that any cardiovascular effects would be generated by mediators, or impulses, released from airway cells. Therefore, we looked for changes in lung function, which are known to occur during ozone inhalation and are maximal at the end of exposure; for cellular evidence and mediators of airway inflammation in induced sputum obtained 22 hours after exposure; and for evidence of airway epithelial cell injury (increases in plasma CC16 and sputum total protein). Because these outcomes addressed secondary hypotheses they were considered secondary. The descriptive statistics are shown in Table 24, and the model’s results are shown in Table 25. Results of the statistical analyses can be found in Appendix B.4.
Table 24.
Descriptive Statistics of Lung Function, Airway Injury, and Airway Inflammation
a Change from pre- to post-exposure for each ozone concentration, compared to change from pre- to post-exposure at 0 ppb, unless otherwise indicated.
b Measured immediately before the exposure and 15 minutes and 22 hours post-exposure.
c Measured in plasma on the day before exposure and 4 and 22 hours post-exposure.
d Measured in sputum 22 hours post-exposure.
e Single post-exposure measurement, change from 0 ppb.
FEV1 and FVC increased after exposure to 0 ppb; ozone attenuated this increase. The FEV1 increased significantly 15 minutes after 0 ppb exposure (t test: by 85 mL; 95% CI, 64 to 106; P < 0.001), and remained significantly increased from pre-exposure at 22 hours (by 45 mL; 95% CI, 26 to 64; P < 0.001). The increase in FVC followed a similar pattern, with a statistically significant increase at 15 minutes (by 73 mL; 95% CI, 45 to 101; P < 0.001), which became marginally significant 22 hours after exposure (by 25 mL; 95% CI, 4 to 47; P = 0.023).
Ozone exposure attenuated these increases in FEV1 (P = 0.003) and FVC (P = 0.011) in a concentration–response pattern (Table 25 and Figures 9 A and B). The largest increases followed 0 ppb (clean air) exposure, with smaller increases at 70 ppb and minimal, if any, increases at 120 ppb. There was no significant ozone-by-time interaction (FEV1, P = 0.589; FVC, P = 0.628; Appendix B.4 Tables B.4.9i and B.4.10i, respectively), reflecting a persistent ozone effect at 22 hours after exposure. The ozone effects on FEV1 and FVC did not differ by site, age, sex, or GSTM1 status. (See Appendix B.4, sections 9 and 10.)
Effect of ozone on FEV1 and FVC. Changes from pre-exposure in (A) FEV1 and (B) FVC for exposures to 0, 70, and 120 ppb ozone at 15 min and 22 hr post-exposure. Pre-exposure mean and SD values are shown as an insert. The whiskers represent 95% CIs.
There is no suggestion of a subgroup with larger ozone responses. The distribution of individual changes in FEV1 15 minutes after 0 ppb and 120 ppb ozone are shown in Figure 10. The distribution curve after 120 ppb is slightly, but rather uniformly, shifted left compared with 0 ppb ozone exposure.
Distribution of changes in FEV1 at 0 and 120 ppb ozone. Distribution of 15 min post- to pre-exposure change in FEV1 at (A) 0 ppb and (B) 120 ppb ozone.
We found no significant ozone effect on either FEV1/FVC or FEF25–75 (Table 25 and Appendix B.4, sections 11 and 12).
Ozone increased sputum PMN 22 hours after exposure. The sputum PMN % increased with ozone concentration (Figure 11), with marginal statistical significance (P = 0.012, Table 25). PMN % increased 8.2 percentage points (95% CI; 2.8 to 13.5) after 120 ppb compared to 0 ppb ozone (P = 0.003) (Appendix Table 25 and B.4.6b). The values of the sputum markers were highly skewed (see Table 26). Therefore we also ran the model using the natural logarithm (Ln) of the values. The results are shown in Table 27 (and in Appendix B.4). PMN count (Ln value) also showed a positive but nonsignificant association with increasing ozone concentration (Appendix B.4.7). The sputum total protein, IL-6, IL-8, and TNF-α Ln values were unaffected by ozone. We found no interactions with sex, age, or GSTM1 status. (See Appendix B.4, sections 2–4.)
Effect of ozone on sputum PMN. (A) PMN percentage and (B) PMN count Ln values for exposures to 0, 70, and 120 ppb at 22 hr post-exposure. The whiskers represent 95% CIs.
a Single post-exposure measurement, change from 0 ppb.
Ozone increased plasma CC16 4 hours after exposure. Plasma CC16 increased with increasing ozone concentrations (P < 0.001; see Table 25) with the greatest effect 4 hours after exposure to 120 ppb (Figure 12). CC16 levels 22 hours after exposure increased relative to pre-exposure, but with no ozone effect. The ozone–time interaction was significant (P < 0.001; see Table B.4.8j). We found no interaction with age, sex, or GSTM1 status (Appendix B.4, section 8). There was no significant relationship between maximum change in CC16 and PMN% after 120 ppb ozone (see Appendix D).
Effect of ozone on plasma CC16. Changes from pre-exposure for exposures to 0, 70, and 120 ppb ozone at 4 hr and 22 hr post-exposure. Baseline mean and SD values are shown as an insert. The whiskers represent 95% CIs.
There were no significant associations among ozone-induced changes in lung function, airway inflammation, airway injury, or HF HRV. There were no significant relationships between maximum changes in FEV1 and PMN %, between CC16 and PMN %, between FEV1 and CC16, between FEV1 and HF, or between CC16 and HF, after 120 ppb ozone. Scatter plots are shown in Appendix D, Section 2, available on the HEI website. To further examine possible relationships between ozone effects on the respiratory outcomes (FEV1 and PMN %) and cardiovascular outcomes, and to look for responder subgroups, subjects were divided into two groups based on the median response to 120 ppb ozone for each of these two respiratory variables, and separate linear regression models were run on each group for all primary cardiovascular outcomes. Table 28 provides descriptive data for the groups. The complete results of these analyses can be found in Appendix D.
Table 28.
Subgroups Showing FEV1 and PMN Responses after Exposure to 120 ppb Ozone
a FEV1 measured at 15 min pre- and post 120 ppb exposure. Median change in FEV1: 0.055 L.
b PMN measured at 22 hr post 120 ppb vs. 0 ppb exposure. Median change in PMN %: 57.4.
Only one primary cardiovascular outcome approached statistical significance in these subgroup analyses: monocyte–platelet conjugate count for the group with ≤ median change in FEV1 (P = 0.03). The monocyte–platelet conjugate count decreased by –12.0 after 70 ppb relative to 0 ppb ozone exposure (P = 0.007), and by –5.5 after 120 ppb relative to 0 ppb (P = 0.20) (Appendix Table D.3.2w). The absence of a concentration response, the marginal significance, and the absence of changes in other cardiovascular outcomes makes this likely to be a random observation.
Site Differences
We found significant differences by study site for nine of the health outcomes. Three of these outcomes were primary (T-wave amplitude, 5 min; ST in lead V5, 5 min; SBP) and six were secondary (SDNN, 24 hr; ST in lead V2, 24 hr; ST in lead II, 5 min; QTc, 5 min; VE singles 100 or more; and DBP). None of these outcomes showed significant ozone effects. No single site stood out as differing from the others across these variables.
Effects of Ozone on Symptoms
Ozone exposures did not significantly affect any symptoms recorded by questionnaire. Some symptoms, such as fatigue, nasal congestion, and headache, increased slightly over the course of the exposures, but these changes were independent of ozone concentration.
ANALYSES OF PES AND AMBIENT AIR QUALITY MEASUREMENTS
Shown in Table 29 are the distributions of the personal ozone and NO2 concentrations in the 72 hours before each pre-exposure visit, by clinical center. Personal ozone concentrations were similar across the centers. Personal NO2 concentrations differed by center, with medians ranging from 12.0 ppb for UCSF subjects, to 7.2 ppb for URMC subjects, to 3.0 ppb for UNC subjects.
Table 29.
Distributions of PES Measurements in the 72 Hours Before the Pre-Exposure Visit, by Centera,b
a Includes data from all subjects who completed all three exposures and had a least one PES.
b Analyses are preliminary and further data cleaning and checks will be done in future analyses.
c Statistics were calculated based on the blank-corrected data. O3 = ozone.
We also obtained ambient hourly ozone, NO2, CO, SO2, and PM2.5 concentrations, as well as temperature and RH measurements for the entire study period in each MOSES clinical center (Table 30). Median ambient ozone concentrations were generally higher at the UNC (28.1 ppb) and URMC monitoring sites (27.0 ppb) compared to the UCSF site (22.8 ppb). However, median ambient NO2 and CO concentrations were substantially higher at the UCSF monitoring site (NO2: 8.9 ppb; CO: 3.4 ppm) than the UNC site (NO2: 4.1 ppb; CO: 0.2 ppm) and the URMC site (NO2: 5.1 ppb; CO: 0.2 ppm). Although not substantially different across sites, median hourly ambient PM2.5 concentrations were highest at the UNC site (7.8 μg/m3), followed by the UCSF site (7.0 μg/m3) and the URMC site (6.2 μg/m3).
Table 30.
Distributions of Hourly Ambient Pollutant Measurements, Temperature, and Humidity During the Study Period, by Centera
a The averaging period for USCF and UNC was from July 1, 2012, through April 30, 2015. For URMC it was from July 1, 2012 through February 28, 2015 (when subject testing was completed). The data in this table are not final and need to be cleaned and validated.
b O3 = ozone.
c NO2 was not measured directly and was calculated as all oxides of nitrogen (NOy) – NO.
d Not measured.
These personal pollution exposure and ambient pollution data are preliminary, and these distributions may change after complete data cleaning and analysis. Updated results will be presented in a separate final report, MOSES Part 2. That report will summarize our assessments of whether these PES and ambient pollutant concentrations predict pre- to post-exposure outcome changes, independent of the controlled ozone exposures, whether they predict pre-exposure outcome levels, and whether they modify controlled ozone exposure effects on these outcomes.
DISCUSSION
The MOSES study is a randomized controlled exposure study in which the experimental design was consistent across the three centers. We tested the hypothesis that short-term exposure of healthy older adults to ambient levels of ozone would induce acute cardiovascular responses through the following mechanisms: autonomic imbalance, systemic inflammation leading to endothelial dysfunction, and development of a prothrombotic vascular state. Because aging affects these pathways, we postulated that ozone effects would be more likely to occur in older than younger participants, even though ozone effects on lung function decline with increasing age. Primary outcomes were identified for each of these potential mechanistic pathways (HRV parameters, BP, FMD, CRP, MP-TFA, and monocyte–platelet conjugate count). We also postulated that ozone-induced acute cardiovascular responses would be associated with increased systemic oxidative stress, airway inflammation, lung injury, and lung function decrements and that the GSTM1-null genotype would modify these responses to ozone exposure. In this panel of 55- to 70-year-old healthy volunteers, we did not expect to see substantial decrements in lung function given the relatively low exposure concentrations and minute ventilation during exercise, and prior evidence that ozone lung function effects decline with increasing age. However, we did observe a small but statistically significant effect of ozone on pulmonary function, airway inflammation, and airway injury. In contrast, we found little evidence for acute cardiovascular effects. We consider the findings in more detail below, beginning with the pulmonary findings.
LUNG FUNCTION, AIRWAY INFLAMMATION, AND LUNG INJURY
We observed that spirometric lung function increased after 0 ppb ozone exposure with intermittent exercise. The immediate post-exposure FEV1 increased from pre-exposure by 85 mL (+3.0%) and the FVC by 73 mL (+1.9%). The increases persisted 22 hours after exposure (FVC +0.8% and FEV1 +1.4%). Some previous air pollution clinical studies in healthy subjects have described such lung function increases (Adams 2006; Drechsler-Parks et al. 1987; Gong et al. 1997), but others have not (Arjomandi et al. 2015; Drechsler-Parks et al. 1990; Reisenauer et al. 1988). It is unclear why exposure to 0 ppb ozone (clean air) increased spirometric lung function in our study as well as in some prior studies. We speculate that several plausible mechanisms may be involved in the increase in spirometric parameters after intermittent exercise in clean air. Healthy airways are almost fully dilated at rest. Brief exercise, as in our study, reduces vagal activity leading to maximal bronchodilation. Concomitant release of catecholamines and possibly other mediators such as leukotrienes will sustain the airways relaxation (Gotshall 2006). In addition, increased tidal volume during exercise and/or diurnal variation in skeletal muscle performance (chest wall) likely contribute to post-exercise increases in FEV1 and FVC. The smaller but still significant increases 22 hours after exposure suggest that some of these mechanisms remain active for this duration.
In our study, ozone exposure reduced the increases in lung function seen 15 minutes after 0 ppb exposure, in a concentration-dependent fashion. This response pattern, albeit waning, persisted and remained statistically significant 22 hours after exposure.
During the late 1980s and early 1990s several laboratories reported the results of studies of elderly subjects exposed to ozone using substantially higher ozone concentrations than in our study. The age of the healthy volunteers ranged from 51–89 years, with exposure durations lasting from one hour with continuous exercise to four hours with intermittent exercise at moderate ventilation rates (20–29 L/min). Ozone concentrations spanned 240 ppb to 450 ppb (Bedi et al. 1988, 1989; Drechsler-Parks et al. 1987, 1989, 1990; Gong et al. 1997; Reisenauer et al. 1988). Exposures to 450 ppb ozone for two hours with intermittent exercise (Drechsler-Parks et al. 1987) elicited statistically significant decrements in spirometric variables (FVC –5.3%, FEV1 –5.6%). The mean response was driven by a few high-responders. In the Gong and colleagues (1997) study of healthy older men, an ozone exposure dose roughly equivalent to that of Drechsler-Parks and colleagues (1987), 240 ppb for four hours with intermittent exercise reduced mean FEV1, albeit nonsignificantly, by 1.9%. One-hour exposure via mouthpiece to 200 and 300 ppb ozone with moderate intermittent exercise (~1/4 of the inhaled dose used in Drechsler-Parks et al. 1987) did not produce any significant spirometric effects (Reisenauer et al. 1988).
In our study we exposed 55- to 70-year-old healthy volunteers to 0, 70, and 120 ppb ozone for three hours with intermittent exercise (ventilation rate ~33 L/min). Our approximate inhaled dose (ozone concentration [ppm] × duration of exposure [min] × VE [L/min]) for the 120 ppb exposure was about one-third of the inhaled dose in the study by Drechsler-Parks and colleagues (1987), which exposed subjects to 450 ppb for two hours, or in Gong and colleagues (1997), using 240 ppb for four hours with comparable ventilation rates. Although the inhaled ozone dose was lower in our study than most prior studies, our sample size was more than four-fold larger than any of the above-referenced studies, and thus had substantially more power to detect small differences.
It has been well documented that acute exposure to ozone initiates an involuntary reflex inhibition of inspiration (Hazucha et al. 1989; Passannante et al. 1998). This reflex response is triggered by direct stimulation by ozone of sensory vagal afferents, such as rapidly adapting receptors and bronchial C-fibers (the majority of vagal afferents). More recent evidence suggests that oxidative products (including those generated by ozone) also activate vagal bronchopulmonary C-fibers via opening of TRPA1 and transient receptor potential vanilloid 1 (TRPV1) cation channels (Taylor-Clark and Undem 2011). Furthermore, activation of sensory airway afferents in animal models causes changes in lung mechanics and bronchoconstriction (Coleridge et al. 1993; Schelegle et al. 1993). We did not find evidence for bronchoconstriction in this study; there were no significant effects on FEV1/FVC or FEF25–75.
The mean VE during exposure exercise sessions significantly decreased in an ozone concentration-dependent fashion, even though VE was maintained within the target range of 15–17 L (BTPS)/minute/m2 body surface area by manually adjusting the exercise load. During 0 ppb exposure, VE approximated 17 L/minute/m2 BSA, while during ozone exposures, it decreased toward 15 L/minute/m2 BSA. The reasons for this are unknown; possibly ozone exposure caused small reductions in tidal volume during exercise that were not completely compensated by increases in respiratory rate. This small (less than 4%) decrease in VE between 0 and 120 ppb ozone is considered insufficient to affect ozone dosing or other outcomes in this study.
Previous controlled human exposure studies have documented that inhalation of high ambient levels of ozone results in airway neutrophilia (Aris et al. 1993; Frampton et al. 1997; Seltzer et al. 1986), which is detectable in induced sputum (Alexis et al. 2009, 2013; Fry et al. 2012, 2014; Hernandez et al. 2012; Kim et al. 2011). Airway neutrophilic inflammatory responses to ozone have been reported using sputum, after exposures to concentrations as low as 60 ppb, corresponding to inhaled doses of ≅ 700 ppm-L (Kim et al. 2011). In comparison, our study used a concentration and inhaled dose of ozone as low as 70 ppb and ~220 ppm-L, respectively. We found that ozone inhalation, even at these low levels, causes neutrophilic influx into airways as indicated by the significant increase in the percentage of PMN and the near-significant increase in absolute count of PMN in induced sputum.
Previous studies have also documented that inhalation of high levels of ozone causes increases in the airway proinflammatory cytokines IL-8, IL-6, IL-1β, and TNF-α (Alexis et al. 2009, 2013; Balmes et al. 1997; Fry et al. 2012), which may be accountable in part for the ozone-induced influx of PMN into airways (Williams et al. 2007). We did not find significant ozone effects on sputum IL-6, IL-8, or TNF-α after ozone exposure. Possible explanations for this discrepancy may be the lower inhaled dose of ozone and the older age of the subjects in our study (55–70 versus 19–35 years of age). It is also possible that our sputum collection at 22 hours after exposure missed the increase in levels of these cytokines, which would be expected to peak prior to the maximum cellular inflammatory response.
Club cell secretory anti-inflammatory protein released by club cells in the epithelium of respiratory bronchioles has been found to be a suitable biomarker of lung epithelial injury and permeability. We observed an ozone concentration-dependent CC16 increase 4 hours after exposure, which was no longer significant 22 hours after exposure. We found no significant relationship between ozone effects on FEV1 and CC16 blood levels. A prior clinical study (Blomberg et al. 2003) observed significant increases in circulating CC16 at 2 and 6 hours after exposure to 200 ppb ozone for 2 hours with intermittent exercise. They also found no relationship with lung function effects. Bergamaschi and colleagues (2001) found increases in blood CC16 in cyclists after 2 hours of exposure to ambient ozone >80 ppb while cycling, but also reported a strong correlation between lung function (FEV1) and CC16 changes. The increase in CC16 suggests that injury to small airways has occurred and that epithelial integrity may have been compromised, and it is consistent with the finding of increased airway inflammation. We demonstrate these effects for the first time in older subjects at relatively low exposure concentrations.
We did not find significant ozone interactions with age, sex, or GSTM1 status for any of the respiratory outcomes. It has been repeatedly demonstrated that healthy older individuals are less responsive to ozone-induced lung function effects than are healthy young individuals (Bedi et al. 1989; Drechsler-Parks et al. 1987; Hazucha et al. 2003). The pathophysiological mechanisms involved in the loss of responsiveness to ozone with increasing age are unclear. It has been speculated that the upper airway receptors in older adults are less responsive to irritants such as ozone (Bedi et al. 1988). In our study, with a narrow age range of 55–70 years, there were no significant interactions between ozone effects and age.
Several previous studies in younger adults have explored the influence of GSTM1 gene deletion on pulmonary functional and inflammatory responses to ozone. In a field study of cyclists (Bergamaschi et al. 2001), those with GSTM1-null and NQO1 wild-type genotype seemed to be more susceptible to ozone-induced airway inflammation and lung function decrements than individuals with other NQO1 and GSTM1 combinations. A previous study in young healthy adults (Alexis et al. 2009) reported persistent increases in ozone-induced sputum PMN 24 hours after exposure in GSTM1-null, but not in GSTM1-sufficient, subjects. The peak ozone concentration was 400 ppb with an inhaled dose of ~984 ppm-L. However, post-exposure changes in lung function of subjects exposed to 100 ppb ozone for two hours with intermittent exercise were not related to GSTM1 status (Corradi et al. 2002). Even exposures of young healthy individuals as high as 400 ppb for two hours, with intermittent exercise at 30–40 L/minute, failed to find an influence of GSTM1 status on ozone-induced changes in spirometric lung function (Alexis et al. 2009). A recent clinical study (Frampton et al. 2015) of 24 young healthy volunteers (12 GSTM1-null and 12 GSTM1-sufficient) exposed to 0, 100, and 200 ppb ozone for three hours with intermittent exercise, in a protocol very similar to ours, reported ozone effects on lung function that were not associated with GSTM1 status. No GSTM1 interaction was found in a separate study with lower ozone levels (60 ppb and ~697 ppm-L) (Kim et al. 2011). At the levels examined in our study in older adults, we did not find any association between either ozone-induced change in lung function or sputum neutrophilia and the GSTM1-null genotype.
We conclude that 120 ppb ozone exposure in older subjects, under the conditions of this study, causes small but statistically significant reductions in lung function (manifested as attenuation of the increases observed after 0 ppb), airway inflammation, and airway epithelial injury. Although effects of 70 ppb were not statistically significant, effects on FEV1, sputum PMN, and plasma CC16 all showed concentration–response relationships. The persistence of significant ozone lung function effects to 22 hours after exposure is a surprising observation, and raises a question of whether ozone airway effects persist longer in older than in younger subjects.
ELECTROCARDIOGRAPHIC PARAMETERS
There was no significant ozone effect on any ECG outcome measure. We did observe a marginally significant (P = 0.046) increase in mean HF (by 545.3 ms2; 95% CI 9.1 to 1,081.4), immediately after exposure to 120 ppb ozone compared to 0 ppb ozone, reflecting parasympathetic input in the frequency domain. The mean LF (reflecting largely sympathetic input) was also increased after 120 ppb ozone, although not significantly (by 150.8 ms2; 95% CI, –27.0 to 328.5; P = 0.096). The LF/HF ratio was stable at all three post-exposure time points irrespective of the level of ozone exposure. SDNN, a measure of autonomic effect in the time domain, was also unaffected by ozone exposure level. However, at 15 minutes and 4 hours after exposure to 120 ppb ozone, the 5-minute average HR was about 1 beat/minute slower than the control. (Pre-exposure HR values were identical for all three exposures.) This might suggest an increase in vagal tone at the two earlier time points, but not at 22 hours. This early decrease in HR seems to be driven by the GSTM1-sufficient individuals, in which the 120 ppb exposure caused a 2.5 beats/minute reduction in HR (95% CI, –4.3 to –0.7; P = 0.006). During exercise session 6, all HRV measures were substantially lower and the LF/HF ratio substantially higher than pre- and post-exposure periods. Since this pattern was observed across all exposure levels, this likely reflects increased sympathetic tone due to exercise.
Other studies have examined HRV responses to controlled ozone exposures, with inconsistent findings. An earlier report of exposure to 120 ppb compared to 0 ppb ozone for two hours at rest found no effect on any metric of HRV (Sivagangabalan et al. 2011). However, since that study involved exposures at rest and our study had intermittent exercise, the cumulative inhaled dose of ozone in the two studies was markedly different. For example, the cumulative inhaled ozone dose in the Sivagangabalan and colleagues (2011) study was certainly lower even than that of our 70 ppb exposure. Using an ozone exposure level which was similar to ours (target of 120 ppb), but at rest, Fakhri and colleagues (2009) reported a borderline significant 467 ms2 (P = 0.051) increase in HF. This was similar in size to the 545 ms2 increase in HF we observed. Further, although Barath and colleagues (2013) found no statistically significant effect of a 300 ppb ozone exposure for 75 minutes, with exercise, on any metric of HRV, normalized HF increased from 13 to 24 ms2 two hours after exposure to the same 300 ppb ozone, which was greater than the increase from pre-exposure to 2-hour post-exposure to clean air (P = 0.07). On the other hand, Arjomandi and colleagues (2015) reported a significant increase in mean normalized LF (and a reciprocal decrease in mean normalized HF) 20 hours after exposure, based on regression modeling of combined data from 4-hour exposures to 0 ppb, 100 ppb, and 200 ppb ozone in 26 young nonsmokers, 10 of whom had mild asthma. In that study, the major difference in HRV parameters among the three exposures may have been regression to the mean, caused by differences in the pre-exposure baselines (e.g., normalized LF — 0 ppb: 54.4; 100 ppb: 49.1; 200 ppb: 46.6) rather than the post-exposure measures (e.g., normalized LF 24 hours post-exposure — 0 ppb: 51.5; 100 ppb: 52.0; 200 ppb: 51.6). There was very little difference in the pre- versus immediate post-exposure values of SDNN for any of the exposures. In an earlier study (Devlin et al. 2012), healthy young nonsmokers were exposed to 300 ppb ozone for two hours with intermittent moderate exercise. They reported a 41% decrease in HF one hour after ozone exposure (pre-exposure: 3,132 ms2; 1 hour after: 2,897 ms2). But LF also fell substantially immediately after ozone exposure (–36%), so that their reported mean LF/HF ratio values post-exposure were similar for air and ozone. Together, these studies do not provide clear evidence of an ozone-provoked increase in autonomic sympathetic tone. The ozone-provoked ST segment change in lead V2 averaged over 24 hours was marginally significant (P = 0.019), driven by the 120 ppb exposure (4.7 μV; 95% CI, 1.0 to 8.5; P = 0.013). This 4.7 μV increase in mean ST in lead V2 (24-hour average) represents a 6% increase from the 0 ppb exposure. However, 70 ppb ozone provoked no increase, no similar change was seen in lead II or in lead V5 after ozone exposure, and no significant changes in 5-minute-average ST segment height estimates were observed in any of these leads. Furthermore, the 4.7 μV change is well below the threshold considered clinically significant on the ECG (100 μV). Therefore the 6% increase in the height of the ST segment (24-hour average) after 120 ppb ozone exposure in lead V2 likely represents an isolated finding and should not be considered indicative of myocardial ischemia.
There were ozone-independent significant differences between men and women in pre- to post-exposure changes in several cardiac outcomes. These included faster 5-minute average heart rates in females, lower levels of 24-hour-average LF in males, longer 5-minute average QTc in females, and lower 24-hour average T-wave amplitude in females. The existence of such differences between adult men and women has previously been studied by multiple investigators (Abhishekh et al. 2013; Kappus et al. 2015; Smetana and Malik 2013). In our study of 55- to 70-year-old volunteers, all the women were postmenopausal. Sex differences are thought to emerge during adolescence and are thought to reflect testosterone effects on ion channels (Vicente et al. 2014). Aging may diminish the sex differences, decreasing HR and shortening QTc in women. It should be kept in mind that our analyses compared changes from pre- to post-exposure; we did not directly examine sex-based differences independent of exposure.
The limited age range of the MOSES participants would decrease the likelihood of detecting age-related effects of ozone, as already indicated for the lung function responses. We found age–ozone interactions for Ln RMSSD (24-hour average) and Ln LF (24-hour average).
These are considered isolated findings; there were no consistent or convincing age-related ozone effects.
As noted above for lung function, Frampton and colleagues (2015) studied 12 GSTM1-null and 12 GSTM1-sufficient healthy young adults exposed to air, 100 ppb ozone, and 200 ppb ozone with intermittent, moderate exercise for three hours. Those investigators found no effect modification by GSTM1 status (null versus sufficient) of ozone-induced changes in a broad range of vascular indicators, despite clear spirometric decrements provoked by 200 ppb ozone in both groups. Electrocardiographic assessments such as HRV were not performed.
In the MOSES study, in which 50 of 87 participants were GSTM1 null, we noted several possible effects of GSTM1 status on the response to ozone. After exposure to 120 ppb relative to 0 ppb ozone, 5-minute HR in GSTM1-sufficient subjects had a 2.5 beat/minute decrease relative to GSTM1-null subjects. This might suggest a relative increase in parasympathetic tone for GSTM1-sufficient subjects, but no GSTM1 effect modification was seen for the LF/HF ratio. We noted also a significant interaction between ozone exposure and GSTM1 status for 5-minute average QTc, with decreasing QTc in GSTM1-sufficient subjects relative to GSTM1-null subjects, after exposure to 120 ppb relative to 0 ppb ozone (–5.1 ms; 95% CI, –8.3 to –1.8; P = 0.002). In summary, we found very limited evidence of effect modification of electrophysiological endpoint responses to ozone exposure by GSTM1 genotype.
The absence of ozone exposure-related increases in ventricular or supraventricular ectopy or in repolarization changes in both the 5-minute and 24-hour Holter recordings is important given the reported associations between increased ambient ozone concentrations and acute cardiac events, including out-of-hospital sudden death, reported in some epidemiology studies (Raza et al. 2014; Rosenthal et al. 2013; Teng et al. 2014). However, as suggested in a recent review (Langrish et al. 2014), controlled ozone exposure studies and epidemiology studies are often not in agreement. Associations with ambient ozone have been reported less frequently than have associations with ambient PM. However, controlled ozone or PM exposure studies of volunteers (some with known coronary artery disease) have also failed to find increased arrhythmias.
SYSTEMIC INFLAMMATION AND OXIDATIVE STRESS
Chronic inflammation has been implicated in the pathogenesis of atherosclerosis, and CRP is the inflammatory biomarker that has been most consistently associated with cardiovascular disease risk (Buckley et al. 2009). It is an acute-phase protein that is produced in the liver in response to pro-inflammatory cytokines, in particular IL-6. It is considered a nonspecific marker of inflammation, and the mechanism by which CRP contributes to cardiovascular disease risk is unknown.
Several controlled human exposure studies have documented that inhaled ozone at high ambient concentrations can cause airway inflammation characterized by increased PMN and cytokine levels in bronchoalveolar lavage or sputum (Devlin et al. 1991; Kim et al. 2011). It is reasonable to suspect that ozone-induced lung inflammation might spill over into the systemic circulation, and some data exist to support this concept. A study of baseline levels of serum IL-6 among 45 participants in controlled human exposure studies in relation to ambient pollutant concentrations in Toronto reported a positive association between IL-6 and ozone, with the strongest association using a 4-day moving average (~30 ppb) in the summer (Thompson et al. 2010). Serum CRP increased in two recent controlled human exposure studies in which the ozone concentration ranged from 100–300 ppb (Arjomandi et al. 2015; Devlin et al. 2012). CRP increased after exposure to 200 ppb, but not 100 ppb, in the study by Arjomandi and colleagues, and only relatively late (18–24 hrs) after exposure in both studies. The mean pre-exposure levels of CRP in the MOSES study were higher than that reported in those two studies (2.7–3.1 mg/L versus 0.6–0.7 mg/L), likely reflecting the older age of our subjects. A sensitivity analysis using only subjects whose pre-exposure values were below the median of 1.5 mg/L did not change the results (see Sensitivity Analysis, Appendix B.2.3).
Oxidative stress represents an imbalance between the formation of ROS in a tissue and that tissue’s antioxidant capacity to detoxify the reactive intermediates. Oxidative stress has been implicated in the pathogenesis of atherosclerosis and has been suggested as a risk factor for adverse cardiovascular outcomes (Schnabel and Blankenberg 2007). Ozone is a prototypic oxidant gas that can increase oxidative stress in the lung. There are both epidemiological and controlled human exposure data to support increased systemic oxidative stress after ozone exposure (Chen et al. 2007; Chuang et al. 2007). 8-Isoprostane, a product of lipid peroxidation, has been used as a marker of oxidative stress in previous studies (Morrow 2006; Patrignani and Tacconelli 2005).
Nitrotyrosine is a product of tyrosine nitration mediated by reactive nitrogen species such as peroxynitrite anion and NO. Oxidative stress increases the production of superoxide (O2–) and NO, forming peroxynitrite, a destructive free radical oxidant. Peroxynitrite is capable of oxidizing lipoproteins and nitrating tyrosine residues in proteins. Nitrotyrosine is much easier to measure than peroxynitrite and as such is used as a marker of NO-dependent, reactive nitrogen species-induced nitrative stress. To our knowledge, MOSES is the first controlled human exposure study of ozone to measure nitrotyrosine. In a mouse model, an increase in nitrotyrosine residues in the lung after ozone exposure was shown to be an inducible NO synthase (NOSII)-dependent response (Laskin et al. 2001).
Based on these data, we hypothesized that ozone exposure would increase serum levels of IL-6, CRP, 8-isoprostane, and nitrotyrosine. Our results showed no evidence of an effect of ozone at either 70 or 120 ppb on IL-6, CRP, or 8-isoprostane; surprisingly, nitrotyrosine levels decreased with 120 ppb ozone. We can only speculate about the reason for this unexpected finding, but it may be due to ozone-induced upregulation of antioxidants that could quench reactive nitrative stress. There is some plausibility to this explanation, because in one animal study the combination of ozone and PM2.5 caused less nitrotyrosine generation than did PM2.5 exposure alone (Kumarathasan et al. 2015). In addition, a provocation study of patients with suspected vasospastic angina pectoris (VSAP) provided some interesting results relevant to our finding. In patients who were found to have VSAP, serum nitrotyrosine increased with intracoronary acetylcholine provocation, but in those who did not have VSAP, serum nitrotyrosine decreased (Tanabe et al. 2014). Since MOSES subjects were screened to not have active coronary artery disease, the decrease in nitrotyrosine we observed is consistent with the results of this study. Our finding of a reduction in nitrotyrosine in response to 120 ppb ozone, and its possible mechanisms and significance, will require additional studies.
A potential reason for the difference between MOSES results and those of previous controlled human exposure studies is that MOSES subjects were 55–70 years of age, while previous studies recruited young adults. Another potential reason is the higher inhaled dose of ozone to which the young adult subjects were exposed in previous studies. It is also possible that ozone oxidative stress effects occurred earlier than the 4-hour post-exposure measurements and were missed. However, this time point was selected based on the significant increase reported by Chen and colleagues (2007) after exposure of young adults to 200 ppb over four hours with intermittent exercise. Nonetheless, given that we measured only two biomarkers of oxidative stress, in plasma only (measurement in urine or exhaled breath condensate are alternative approaches), we cannot exclude the possibility of ozone-induced systemic oxidative stress in exercising older subjects.
VASCULAR FUNCTION
Elevated blood pressure is an established risk factor for cardiovascular disease (Lloyd-Jones et al. 2010). Epidemiological studies of the association between ambient ozone concentrations and BP have shown conflicting results (Cakmak et al. 2011; Chen et al. 2012; Chuang et al. 2011; Hoffmann et al. 2012). Controlled human exposure studies have mostly reported negative results regarding the effect of short-term exposures to ozone on systolic and diastolic BP (Barath et al. 2013; Brook et al. 2009; Frampton et al. 2015). We also found no ozone-induced changes in BP.
Endothelial dysfunction can be defined as an imbalance in the relative contribution of endothelium-derived relaxing and contracting factors and is posited to be an important mechanism by which atherosclerosis leads to adverse cardiovascular outcomes (Lerman and Zeiher 2005). Exposures to active and secondhand tobacco smoke and PM2.5 have been linked to endothelial dysfunction (Frey et al. 2012; Krishnan et al. 2012; Messner and Bernhard 2014). Research on the effect of ozone on endothelial function is limited. Brachial artery flow-mediated dilatation is a noninvasive test of nitric oxide-dependent vasodilation that is an established metric of overall vascular endothelial health, as well as an independent predictor of cardiovascular disease (Flammer et al. 2012). Brook and colleagues (2002) showed that coexposure of healthy volunteers to concentrated ambient particles and ozone caused brachial artery vasoconstriction, without significant change in FMD, but in a later study this same group reported that ozone alone did not have this effect (Brook et al. 2009). However, a more recent panel study in subjects with type-2 diabetes mellitus did report an association between ambient ozone concentrations and FMD (Lanzinger et al. 2014). We found no effect of ozone on brachial artery diameter or FMD at either 70 or 120 ppb. Because nitroglycerin-mediated vasodilation was not evaluated in our protocol, we could not distinguish between effects on the endothelium versus smooth muscle function. Since we found no overall effect of ozone on FMD, this is a moot point.
Endothelin-1 is a potent vasoconstrictor peptide originally isolated from endothelial cells that is now known to be produced by multiple cell types when stimulated and has been linked to air pollution exposure (Bossard et al. 2015; Calderón-Garcidueñas et al. 2007; Yu et al. 2015). To our knowledge, ET-1 has not been previously evaluated as an outcome in a controlled human exposure study of ozone. Based on previous reports of the biological effects induced by ET-1, including vasoconstriction, pro-inflammatory responses, mitogenesis, cell proliferation, stimulation of free radical formation, and platelet activation (Bohm and Pernow 2007), we hypothesized that ozone exposure would increase ET-1. While we found no change in ET-1 after 70 ppb at either 4 or 22 hours after exposure, we did observe a significant overall ozone effect on ET-1 (P = 0.008) with a marginally statistically significant increase after 120 ppb (P = 0.028). ET-1 has important interactions with NO and is involved in the development of endothelial dysfunction. Increased production of ET-1 and its receptors may contribute to the pathogenesis of atherosclerosis (Pernow et al. 2012).
PROTHROMBOTIC VASCULAR STATUS
Increased propensity for vascular thrombosis has been posited as one of the pathways by which exposure to air pollution leads to adverse cardiovascular events. We found no convincing evidence for ozone effects on platelet activation, circulating microparticles, or MP-TFA. We did find a significant ozone–sex interaction for CD40L+ MP, which decreased in females and increased in males after ozone exposure, relative to air exposure (P < 0.001, Figure 8). None of the other thrombosis markers supported an ozone effect or interaction, so we conclude there is no effect at these exposure levels in this population.
A few other clinical studies have examined ozone effects on markers of coagulation or thrombosis, with variable results. Frampton and colleagues (2015) exposed younger, healthy subjects to 0, 100, and 200 ppb ozone for three hours, with intermittent exercise. There were no significant effects on platelets or circulating MPs four hours after exposure, using methods similar to those in the present study. Devlin and colleagues (2012) exposed healthy subjects to 0 and 300 ppb for two hours with intermittent exercise. They found no effects on plasma levels of vWF or D-dimer. Plasminogen levels increased 24 hours after air exposure but decreased after ozone exposure. There was a statistically significant increase in tissue plasminogen activator (tPA) and a significant reduction in plasma activator inhibitor-1, the primary inhibitor of tPA, 24 hours after ozone exposure, relative to air. These findings indicate possible activation of fibrinolysis after ozone exposure, which is opposite of the hypothesized prothrombotic effect.
Arjomandi and colleagues (2015) found no effects of exposure to 100 and 200 ppb ozone on fibrinogen, plasminogen activator inhibitor-1 (PAI-1), prothrombin time, partial thromboplastin time, or platelet count. Similarly, Barath and colleagues (2013) found no effects of exposure to 300 ppb ozone for 75 minutes, with intermittent exercise, on tPA or PAI-1 after infusion of bradykinin, two and six hours after exposure to ozone.
A recent clinical study examined the effect of varying temperature on the effects of ozone exposure (Kahle et al. 2015). Healthy volunteers were exposed to 0 and 300 ppb ozone for two hours with intermittent exercise, at two different ambient temperatures. At 22°C, PAI-1 decreased 52%, plasminogen decreased 12%, and D-dimer increased 18%. In contrast, at 32.5°C, PAI-1 increased 45%, and plasminogen increased 28%. D-dimer decreased 12.5%. This suggested that the fibrinolytic pathway is impaired after ozone exposure at the lower temperature and activated at the higher temperature.
A few panel studies have examined the effects of ozone exposure on propensity for thrombosis, but the findings are also mixed. Strak and colleagues (2013) obtained blood from young healthy volunteers at five different locations with varying pollutant concentrations. Intrinsic thrombin generation was associated with increased exposures to NO2, nitrates, and sulfates, but not to ozone. In 76 young, healthy subjects in Taiwan, increased ozone exposure was associated with increased fibrinogen and PAI-1, which held up in 2-pollutant models (Chuang et al. 2007).
Liao and colleagues (2005) examined data from the Atherosclerosis Risk in Communities study that included 10,208 middle-aged people; they found ozone exposure was associated with increases in fibrinogen and vWF levels, with greater effects in people with diabetes and cardiovascular disease.
A recent weight-of-evidence review (Goodman et al. 2015) described evidence from clinical studies for small increases in markers of inflammation and oxidative stress, but no consistent effects on blood coagulation in either clinical or epidemiological studies.
STRENGTHS AND LIMITATIONS
This multicenter study has a number of strengths. It is one of the largest controlled human exposure studies of ozone to be conducted to date, providing greater statistical power than previous studies. The study was designed to comprehensively evaluate the major pathways by which air pollutants may contribute to acute cardiovascular toxicity. While the primary goal was to assess the acute cardiovascular toxicity of ozone in older individuals, we also were able to study acute respiratory effects, including airway inflammation and epithelial injury, which had not previously been evaluated in such individuals. Another strength is the careful adherence to protocols that was achieved across the three study centers. In addition, the statistical analysis tested only a priori hypotheses and used a strict criterion for statistical significance (P < 0.01) to address the issue of multiple comparisons.
This study was deliberately designed to assess the acute cardiovascular effects of exposure to ambient levels of ozone in healthy older individuals, and this design engenders unavoidable limitations. We cannot generalize our lack of cardiovascular findings to populations exposed to higher concentrations. We cannot exclude the possibility of cardiovascular effects of chronic or repeated exposures, or effects delayed longer than 22 hours after exposure. Moreover, the study was designed to test the effects of ozone under controlled laboratory conditions in the absence of other pollutants. It is possible that other pollutants in ambient air could generate secondary reaction products, or in some other way exert synergistic, potentiating, or attenuating cardiovascular effects in combination with ozone.
The chamber ozone exposure levels of 120 ppb and 70 ppb used in MOSES were similar to ambient ozone levels occurring at the study centers in Chapel Hill (North Carolina), Rochester (New York), and San Francisco (California) on some days during the study periods (Table 30), and personal ozone exposures measured in the 72 hours before the pre-exposure visit (Table 29). Thus, it is possible that ambient ozone and other pollutant exposures experienced by the study subjects before and during the study may have independently affected the study biomarkers, and/or modified, blunted, or lessened any biomarker responses to the controlled ozone exposures. These questions will be examined in separate analyses that are already ongoing and will be published in a separate report.
By design, we restricted participation to older, healthy subjects, who were physically fit enough to complete the exercise regimen. Thus our subjects cannot be considered representative of the general population, or of all people in this age range. People with pre-existing cardiovascular or pulmonary disease may differ in their responses to ozone exposure. The choice to study older subjects was based on the hypothesis that these individuals would be most at risk for acute cardiovascular effects of ozone. This may not be the case, however. Younger individuals are known to be more responsive to the effects of ozone on lung function, and they also may be more responsive with regard to cardiovascular parameters.
IMPLICATIONS OF FINDINGS
This is the first multicenter controlled air pollution study and the first to focus on cardiovascular outcomes in older subjects. Older people are considered to have increased susceptibility to the health effects of air pollution. We examined markers of several mechanistic pathways contributing to cardiovascular disease, including cardiac autonomic control, repolarization, and arrhythmia, as well as markers of systemic inflammation, vascular function, oxidative stress, and propensity for thrombosis. The overall absence of significant cardiovascular effects was generally robust and consistent. Therefore, our study does not provide toxicological support or mechanistic plausibility for the recent epidemiological findings of ambient ozone-associated increases in cardiovascular mortality and morbidity. However, our findings do not exclude the possibility of ozone-related cardiovascular effects via mechanisms not examined in this study.
This study included measures to avoid ozone secondary reaction products during the exposures and was limited to the effects of pure ozone, without other pollutants. It is possible that associations between ozone exposure and cardiovascular effects observed in some recent epidemiological studies reflect effects of reactions or interactions between ozone and other air pollutants. Our second set of planned separate analyses, which are ongoing, will address this research question.
We did find subtle but consistent evidence for respiratory effects, despite the relatively low inhaled dose of ozone and the older ages of our subjects. Prior studies have found that ozone effects on lung function decrease with increasing age, yet we found relative reductions in FEV1, showing that older subjects do not completely lose sensitivity to the effects of ozone on lung function. Ozone-related effects on FEV1 were still present 22 hours after exposure, raising the question of whether respiratory effects after ozone inhalation take longer to resolve with increasing age. We also found evidence for airway inflammation and airway injury after 120 ppb exposure. These relatively small effects are not clinically important for healthy people, but raise concern for those with underlying respiratory or cardiovascular disease.
SUMMARY AND CONCLUSIONS
In this multicenter clinical study of older healthy subjects, ozone exposure caused concentration-related limitations in lung function and evidence for airway inflammation and injury. However, there was no convincing evidence for effects on cardiovascular function or systemic inflammation. Blood levels of the potent vasoconstrictor endothelin-1 increased with ozone exposure, with marginal statistical significance, but there were no effects on blood pressure, flow-mediated dilatation, or other markers of vascular function. Blood levels of nitrotyrosine decreased with ozone exposure, the opposite of our hypothesis. Our study does not support acute cardiovascular effects of low-level ozone exposure in healthy older subjects. We cannot exclude the possibility of effects with higher ozone exposure concentrations or more prolonged exposure, or the possibility that subjects with underlying vascular disease, such as hypertension or diabetes, would show effects under these conditions.
ACKNOWLEDGMENTS
Many individuals made significant contributions to this study. In particular we would like to acknowledge Patty Arsenault (MOSES Data Manager at NERI from the protocol development phase of the study through March 2014) who contributed to the development of data forms, programmed the ADEPT management system, trained the clinical coordinators in the use of ADEPT and subsequently the eCOS data management system, and helped in countless other ways. We also would like to acknowledge Anne Stoddard, the MOSES statistician at NERI through December 2014, who led the development of the plan for data analysis.
We would like to recognize the effort and dedication of the three clinical centers coordinators — Hofer Wong at UCSF, Martha Almond at UNC, and Erika Little and David Chalupa at URMC — and of the Core Laboratory Coordinators — Claire Mills at UCSF, A. Phillip Owens III and Heather Wells at UNC, and Patty Severski and Pamela Vargo at URMC. We also recognize the contribution of the NERI staff, including Katelyn Nelson, Nancy Gee, Christiana Toomey, and Ashley Wilkinson (former and current Data Managers).
Finally, we would like to thank the members of the MOSES Oversight Committee (listed in Sidebar 1), in particular Mark Utell and Howard Rockette, who provided technical advice during the development of the protocol and occasionally during the course of the study, and the members of HEI Research Committee and the Data Monitoring Board (listed in Sidebar 1) for their continued involvement, support, and helpful feedback.
We thank the members of the MOSES Review Panel for their critical comments on the report.
Footnotes
** A list of abbreviations and other terms appears at the end of this volume.
HEI QUALITY ASSURANCE STATEMENT
The conduct of this study was subjected to independent audits by Mr. David Bush of T&B Systems, Inc., Valencia, CA. Mr. Bush is an expert in quality assurance for air quality monitoring studies and data management. The audits included several on-site reviews of study activities for conformance to the study protocol and operating procedures. The dates of the audits are listed below, along with a brief summary of each audit effort.
February–July 2012
Mr. David Gemmill of Quality Assurance Consulting, Inc., Temecula, CA, assisted with on-site audits at the three study centers. The audit concentrated on evaluating the chamber system and operations at each center, focusing on ozone measurements and data traceability. The audit included performance checks of each center’s ozone and environmental measurement systems against a certified audit standard. While all ozone performance checks were good, recommendations were made to assure data traceability at all centers.
July–November 2013
Mr. Uday Patel, Regulatory Affairs Certified, Atlanta, GA, assisted with on-site audits at the three study centers during active collection of data during subject testing. The audit concentrated on operations during subject exposure, including compliance to MOSES protocols, and chamber operations. Exposure personnel were shadowed over a three-day period, following a complete exposure session for one subject, including pre-exposure, exposure, and post-exposure visits. A review of the data collection process and data collected to-date was conducted. System audits of the Flow, Holter, Sputum, and BAU Core Laboratories were also conducted, as these were at the same locations as the test centers. Several data points were traced through the entire data processing sequence to verify the integrity of the database. Compliance with IRB procedures was also reviewed during this audit. Recommendations resulting from the audit primarily concerned slight deviations from protocol, assuring the comparability of data between the three centers.
March–June 2015
On-site audits were conducted at the three study centers, with Ms. Patti Arsenault of Cytel, Inc., Cambridge, MA, assisting with the audit at UNC. The audit concentrated on each center’s data management activities. Data points were traced to original sources to verify the integrity of the database. Chamber measurements, quality control data, and documentation were reviewed, as was the completeness of subject review and consent forms and all adverse events reported during the study. Recommendations resulting from the audit primarily concentrated on observations to further assure the comparability of data between the three centers.
November 2016
Dr. David Wright of Westat, Inc., Rockville, MD, assisted in an audit of the study final report. The audit consisted of a general overall review of the report from a data quality assurance perspective. This included verification that the technical descriptions were consistent with observations and findings obtained during previous study audits. In addition, the study statistical results were reviewed, including a review of the code for the statistical models and the codebooks associated with the data packages. Consistency between appendices, tables, figures, and report text was verified. Recommendations were made for clarifying some statistical results.
April–May 2017
The revised final report was reviewed to verify that issues identified during the November 2016 audit had been addressed. All issues were addressed by the authors.
Written reports of each inspection were provided to the HEI project manager, who transmitted the findings to the Principal Investigators. These quality assurance audits demonstrated that the study was conducted by an experienced team with a high concern for data quality. Study personnel were very responsive to audit recommendations, providing formal responses that adequately addressed all issues. The report appears to be an accurate representation of the study.
Mark W. Frampton received his M.D. from New York University School of Medicine in 1973 and then trained in internal medicine at Buffalo General Hospital, New York. He is a pulmonologist and professor emeritus in the Division of Pulmonary and Critical Care Medicine, Department of Medicine at the University of Rochester Medical Center, New York. His primary research interest has been the health effects of air pollution, and he has led numerous human clinical studies examining the cardiopulmonary health effects of short-term air pollutant exposure in healthy subjects, as well as subjects with asthma and type 2 diabetes.
John R. Balmes received his M.D. degree from Mount Sinai School of Medicine in 1976. After internal medicine training at Mount Sinai and pulmonary subspecialty, occupational medicine, and research training at Yale, he joined the faculty of University of Southern California in 1982. He joined the faculty at UCSF in 1986 and is currently professor and division chief of occupational and environmental medicine at San Francisco General Hospital (SFGH). His major academic activities include his research laboratory, several collaborative epidemiological research projects, and direction of the clinical occupational and environmental medicine division at SFGH. Balmes’s laboratory, the Human Exposure Laboratory, has been studying the respiratory health effects of various air pollutants for the past 27 years.
Phil A. Bromberg received his M.D. from Harvard Medical School in 1953 and held fellowships at Mt. Sinai Hospital, New York, and at Harvard Medical School, Boston. In 1971 he was appointed professor of medicine and director of the Division of Pulmonary Diseases, Department of Medicine, Ohio State University, Columbus. In 1975 Bromberg became director of the Division of Pulmonary Diseases and professor of medicine in the Department of Medicine, University of North Carolina–Chapel Hill. He is currently scientific director of the Center for Environmental Medicine, Asthma and Lung Biology, UNC–Chapel Hill. Bromberg is a pulmonary physician and inhalation toxicologist with long experience with controlled exposures of human subjects to ozone, including mechanistic studies of lung function changes.
Paul Stark received both his M.S. in biostatistics (1996) and his Sc.D. in environmental health sciences (2002) from Harvard University. He was the Director of Biostatistics and Epidemiology at NERI until August 2016. He is currently Director of Biodata Sciences at Clinlogix. Prior to joining NERI, he worked as a biostatistician at the Massachusetts General Hospital in the Cancer Center and at Tufts Medical Center in the Institute for Clinical Research, both in Boston. He was also a professor and the director of statistics at the Tufts University School of Dental Medicine for more than a decade. His areas of interest include designing, implementing, and analyzing data from multicenter clinical trials and epidemiological studies.
Mehrdad Arjomandi received his bachelor’s degree in molecular biology from the University of California–San Diego in 1991 and his M.D. degree from Stanford University School of Medicine in 1996. He completed his residency in internal medicine at University of California–Los Angeles (UCLA) Medical Center (1999) and his fellowship in pulmonary and critical care medicine at University of California–San Francisco (UCSF) (2003). Arjomandi is currently associate professor of Medicine in the Division of Pulmonary, Critical Care, Allergy, Immunology, and Sleep Medicine at UCSF with a joint appointment at San Francisco Veterans Affairs Medical Center. He is Associate Director of the UCSF Human Exposure Laboratory at San Francisco General Hospital, and an investigator at the UCSF Center for Tobacco Control Research and Education. His major research interest is the study of the physiological and inflammatory mechanisms of airway remodeling in various exposure–response models such as ozone-induced oxidative injury, allergic airway inflammation, and wood or tobacco smoke-induced airway injury.
Milan J. Hazucha received his M.D. from Comenius University, Bratislava, Slovak Republic in 1962 and his Ph.D. from McGill University, Montreal, Canada, in 1974. He is a research professor of medicine in the Department of Medicine, School of Medicine, and a senior research scientist at the Center for Environmental Medicine, Asthma and Lung Biology, UNC–Chapel Hill. The primary area of his research has been the health effects of air pollutants on healthy and at-risk populations such as children, asthmatics, and individuals with chronic lung disease. The studies have focused on elucidation of physiological mechanisms induced by short-term and prolonged controlled laboratory exposures of volunteers to ozone, SO2, NO2, CO, and PM.
David Rich received a Sc.D. in Epidemiology and Environmental Health from the Harvard T.H. Chan School of Public Health in 2004, and was a postdoctoral fellow at both Harvard and the Division of Aging at Brigham and Women’s Hospital from 2004 to 2005. He was an assistant professor at the University of Medicine and Dentistry of New Jersey School of Public Health (now the Rutgers School of Public Health) and the Environmental and Occupational Health Sciences Institute from 2005 to 2010. He is an environmental epidemiologist and an associate professor in the Division of Epidemiology, Department of Public Health Sciences and the Department of Environmental Medicine at the University of Rochester School of Medicine and Dentistry in Rochester, New York. Rich’s primary research interests include the cardiopulmonary and reproductive health effects of exposure to air pollution and other environmental toxicants.
Danielle Hollenbeck-Pringle received her M.P.H. with a concentration in biostatistics from Boston University School of Public Health in 2014. Previously, she worked as a research assistant for Boston University School of Public Health and as a research coordinator for Boston University School of Dental Medicine. She is currently a statistician for NERI. Her research interests include health disparities, urban environmental health, and multicenter randomized control trials.
Nicholas Dagincourt received his M.S. in biostatistics from the Tulane University School of Public Health in 2012. He is currently a doctoral candidate in biostatistics at Tulane University and has been working as a statistician at NERI for five years. His research interests include cardiovascular heath, environmental health, and multicenter randomized control trials.
Maria G. Costantini received a Ph.D. in biological sciences from the University of Milan, Italy, in 1976. After graduating she conducted research on the mechanisms of cell replication and the physiological response to polycyclic aromatic hydrocarbons at the University of Milan, the National Cancer Institute in Bethesda, Maryland, and the Massachusetts Institute of Technology in Cambridge, Massachusetts. She is currently a principal scientist at the Health Effects Institute where she has conducted literature reviews and overseen research programs on fuels and fuel additives (such as diesel, methanol, and methyl tertiary butyl ether), particulate matter, and ozone. Her primary research interests include assessment of exposure and elucidation of the mechanisms of action of air pollutants.
Core Laboratories’ Lead Investigators
Neil Alexis received a Ph.D. in environmental medicine from the University of Toronto, Canada, in 1997 and did postdoctoral research training at the UNC–Chapel Hill’s U.S. EPA Human Studies Facility. He is currently a professor in the Department of Pediatrics, UNC–Chapel Hill, and is director of the Applied Immunobiology Laboratory and principal investigator of the Human Sample Biorepository at the UNC Center for Environmental Medicine, Asthma and Lung Biology. His research interests focus on examining the health effects of air pollution in individuals with preexisting airways disease and investigating the underlying pathophysiological mechanisms of airways diseases. He has focused in particular on the inflammatory and innate immune response in the airways and on the use of induced sputum as a primary sampling tool for measuring cellular, biochemical, and genetic outcomes in the airways of human subjects.
Peter Ganz received his M.D. from Harvard Medical School in Cambridge, Massachusetts. He completed his residency in cardiology at the Massachusetts General Hospital and cardiovascular fellowship at the Brigham and Women’s Hospital, both in Boston, Massachusetts. He spent 25 years directing research in the Cardiac Catheterization Laboratories at the Brigham and Women’s Hospital and Harvard Medical School, prior to arriving at UCSF in 2008. He is chief of cardiology and the director of the Center of Excellence in Vascular Research at the San Francisco General Hospital. He is the Maurice Eliaser Distinguished Professor of Medicine at UCSF. Ganz has been a pioneer and a leader in translational vascular research focusing on understanding key elements of human atherosclerosis, including the pathobiology of the human endothelium, the biology of vascular NO, systemic and vascular inflammatory responses, and atherosclerotic plaque instability.
Wojciech Zareba received both his M.D. and Ph.D. in cardiology from the Medical University of Lodz, Poland. Currently he is a cardiologist and professor in the Division of Cardiology, Department of Medicine, and director of the Heart Follow-up Program at the University of Rochester School of Medicine and Dentistry in Rochester, New York. Dr. Zareba has directed analyses of ECG recordings for studies examining associations between markers of HRV, repolarization, and other parameters and increased air pollutant concentrations, working with researchers at both the University of Rochester and Helmholtz Zentrum München, Germany. He has served as the principal investigator of a number of large clinical trials testing the clinical effectiveness and safety of implantable cardiac devices, as well as on several grants on risk stratification of cardiac death, clinical usefulness, and prognostic significance of ECG parameters.
REFERENCES
Abhishekh HA, Nisarga P, Kisan R, Meghana A, Chandran S, Trichur R, et al.
2013.
Influence of age and gender on autonomic regulation of heart. J Clin Monit Comput
27: 259–264. [DOI] [PubMed] [Google Scholar]
Adams WC.
2006.
Comparison of chamber 6.6-h exposures to 0.04-0.08 PPM ozone via square-wave and triangular profiles on pulmonary responses. Inhal Toxicol
18:127–136. [DOI] [PubMed] [Google Scholar]
Alexis NE, Hu SC, Zeman K, Alter T, Bennett WD.
2001.
Induced sputum derives from the central airways: confirmation using a radiolabeled aerosol bolus delivery technique. Am J Respir Crit Care Med
164:1964–1970. [DOI] [PubMed] [Google Scholar]
Alexis NE, Lay JC, Zhou H, Kim CS, Hernandez ML, Kehrl H, et al.
2013.
The glutathione-S-transferase mu 1 (GSTM1) null genotype and increased neutrophil response to low-level ozone (0.06 ppm). J Allergy Clin Immunol
131:610–612. [DOI] [PMC free article] [PubMed] [Google Scholar]
Alexis N, Soukup J, Ghio A, Becker S.
2000.
Sputum phagocytes from healthy individuals are functional and activated: a flow cytometric comparison with cells in bronchoalveolar lavage and peripheral blood. Clin Immunol
97:21–32. [DOI] [PubMed] [Google Scholar]
Alexis NE, Zhou H, Lay JC, Harris B, Hernandez ML, Lu TS, et al.
2009.
The glutathione-S-transferase mu 1 null genotype modulates ozone-induced airway inflammation in human subjects. J Allergy Clin Immunol
124:1222–1228.e5. [DOI] [PMC free article] [PubMed] [Google Scholar]
Almstrand A-C, Voelker D, Murphy RC.
2014.
Identification of oxidized phospholipids in bronchoalveolar lavage exposed to low ozone levels using multivariate analysis. Anal Biochem
474:50–58. [DOI] [PMC free article] [PubMed] [Google Scholar]
Anderson TJ, Charbonneau F, Title LM, Buithieu J, Rose MS, Conradson H, et al.
2011.
Microvascular function predicts cardiovascular events in primary prevention: long-term results from the Firefighters and Their Endothelium (FATE) study. Circulation
123:163–169. [DOI] [PubMed] [Google Scholar]
Aris RM, Christian D, Hearne PQ, Kerr K, Finkbeiner WE, Balmes JR.
1993.
Ozone-induced airway inflammation in human subjects as determined by airway lavage and biopsy. Am Rev Respir Dis
148:1363–1372. [DOI] [PubMed] [Google Scholar]
Arjomandi M, Wong H, Donde A, Frelinger J, Dalton S, Ching W, et al.
2015.
Exposure to medium and high ambient levels of ozone causes adverse systemic inflammatory and cardiac autonomic effects. Am J Physiol Heart Circ Physiol
308:H1499–1509. [DOI] [PMC free article] [PubMed] [Google Scholar]
Ballester F, Rodriguez P, Iniguez C, Saez M, Daponte A, Galan I, et al.
2006.
Air pollution and cardiovascular admissions association in Spain: results within the EMECAS project. J Epidemiol Comm Health
60:328–336. [DOI] [PMC free article] [PubMed] [Google Scholar]
Balmes JR, Aris RM, Chen LL, Scannell C, Tager IB, Finkbeiner W, et al.
1997.
Effects of ozone on normal and potentially sensitive human subjects. Part I: Airway inflammation and responsiveness to ozone in normal and asthmatic subjects. Res Rep Health Eff Inst
78:1–37; discussion 81–99. [PubMed] [Google Scholar]
Barath S, Langrish JP, Lundback M, Bosson JA, Goudie C, Newby DE, et al.
2013.
Short-term exposure to ozone does not impair vascular function or affect heart rate variability in healthy young men. Toxicol Sci
135:292–299. [DOI] [PMC free article] [PubMed] [Google Scholar]
Barnett AG, Williams GM, Schwartz J, Best TL, Neller AH, Petroeschevsky AL, et al.
2006.
The effects of air pollution on hospitalizations for cardiovascular disease in elderly people in Australian and New Zealand cities. Environ Health Perspect
114:1018–1023. [DOI] [PMC free article] [PubMed] [Google Scholar]
Bazett HC.
1920.
An analysis of time relations of electrocardiograms. Heart
7:353–367. [Google Scholar]
Bedi JF, Horvath SM, Drechsler-Parks DM.
1988.
Reproducibility of the pulmonary function response of older men and women to a 2-hour ozone exposure. J Air Pollut Control Assoc
38:1016–1019. [DOI] [PubMed] [Google Scholar]
Bedi JF, Horvath SM, Drechsler-Parks DM.
1989.
Adaptation by older individuals repeatedly exposed to 0.45 parts per million ozone for two hours. J Air Pollut Control Assoc
39:194–199. [DOI] [PubMed] [Google Scholar]
Behndig AF, Blomberg A, Helleday R, Duggan ST, Kelly FJ, Mudway IS.
2009.
Antioxidant responses to acute ozone challenge in the healthy human airway. Inhal Toxicol
21:933–942. [DOI] [PubMed] [Google Scholar]
Bell ML, McDermott A, Zeger SL, Samet JM, Dominici F.
2004.
Ozone and short-term mortality in 95 U.S. urban communities, 1987–2000. JAMA
292:2372–2378. [DOI] [PMC free article] [PubMed] [Google Scholar]
Bergamaschi E, De Palma G, Mozzoni P, Vanni S, Vettori MV, Broeckaert F, et al.
2001.
Polymorphism of quinonemetabolizing enzymes and susceptibility to ozone-induced acute effects. Am J Respir Crit Care Med
163: 1426–1431. [DOI] [PubMed] [Google Scholar]
Bigger JT, Fleiss JL, Jr, Rolnitzky LM, Steinman RC.
1992.
Stability over time of heart period variability in patients with previous myocardial infarction and ventricular arrhythmias. The CAPS and ESVEM investigators. Am J Cardiol
69(8):718–723. [DOI] [PubMed] [Google Scholar]
Blomberg A, Mudway I, Svensson M, Hagenbjork-Gustafsson A, Thomasson L, Helleday R, et al.
2003.
Clara cell protein as a biomarker for ozone-induced lung injury in humans. Eur Respir J
22:883–888. [DOI] [PubMed] [Google Scholar]
Bohm F, Pernow J.
2007.
The importance of endothelin-1 for vascular dysfunction in cardiovascular disease. Cardiovasc Res
76:8–18. [DOI] [PubMed] [Google Scholar]
Bossard M, Pumpol K, van der Lely S, Aeschbacher S, Schoen T, Krisai P, et al.
2015.
Plasma endothelin-1 and cardiovascular risk among young and healthy adults. Atherosclerosis
239:186–191. [DOI] [PubMed] [Google Scholar]
Bravo MA, Son J, de Freitas CU, Gouveia N, Bell ML.
2015.
Air pollution and mortality in Sao Paulo, Brazil: Effects of multiple pollutants and analysis of susceptible populations. J Expo Sci Environ Epidemiol
26(2):150–161. doi: 10.1038/jes.2014.90. [DOI] [PubMed] [Google Scholar]
Brook RD, Brook JR, Urch B, Vincent R, Rajagopalan S, Silverman F.
2002.
Inhalation of fine particulate air pollution and ozone causes acute arterial vasoconstriction in healthy adults. Circulation
105:1534–1536. [DOI] [PubMed] [Google Scholar]
Brook RD, Rajagopalan S, Pope CA, 3rd, Brook JR, Bhatnagar A, Diez-Roux AV, et al.
2010.
Particulate matter air pollution and cardiovascular disease: An update to the scientific statement from the American Heart Association. Circulation
121:2331–2378. [DOI] [PubMed] [Google Scholar]
Brook RD, Urch B, Dvonch JT, Bard RL, Speck M, Keeler G, et al.
2009.
Insights into the mechanisms and mediators of the effects of air pollution exposure on blood pressure and vascular function in healthy humans. Hypertension
54:659–667. [DOI] [PMC free article] [PubMed] [Google Scholar]
Buckley DI, Fu R, Freeman M, Rogers K, Helfand M.
2009.
C-reactive protein as a risk factor for coronary heart disease: a systematic review and meta-analyses for the U.S. Preventive Services Task Force. Ann Intern Med
151:483–495. [DOI] [PubMed] [Google Scholar]
Cakmak S, Dales R, Leech J, Liu L.
2011.
The influence of air pollution on cardiovascular and pulmonary function and exercise capacity: Canadian Health Measures Survey (CHMS). Environ Res
111:1309–1312. [DOI] [PubMed] [Google Scholar]
Calderón-Garcidueñas L, Vincent R, Mora-Tiscareño A, Franco-Lira M, Henríquez-Roldán C, Barragán-Mejía G, et al.
2007.
Elevated plasma endothelin-1 and pulmonary arterial pressure in children exposed to air pollution. Environ Health Perspect
115:1248–1253. [DOI] [PMC free article] [PubMed] [Google Scholar]
Chan CC, Chuang KJ, Chien LC, Chen WJ, Chang WT.
2006.
Urban air pollution and emergency admissions for cerebrovascular diseases in Taipei, Taiwan. Eur Heart J
27:1238–1244. [DOI] [PubMed] [Google Scholar]
Chang CC, Tsai SS, Ho SC, Yang CY.
2005.
Air pollution and hospital admissions for cardiovascular disease in Taipei, Taiwan. Environ Res
98:114–119. [DOI] [PubMed] [Google Scholar]
Chen C, Arjomandi M, Balmes J, Tager I, Holland N.
2007.
Effects of chronic and acute ozone exposure on lipid peroxidation and antioxidant capacity in healthy young adults. Environ Health Perspect
115:1732–1737. [DOI] [PMC free article] [PubMed] [Google Scholar]
Chen SY, Su TC, Lin YL, Chan CC.
2012.
Short-term effects of air pollution on pulse pressure among nonsmoking adults. Epidemiology
23:341–348. [DOI] [PubMed] [Google Scholar]
Chuang GC, Yang Z, Westbrook DG, Pompilius M, Ballinger CA, White CR, et al.
2009.
Pulmonary ozone exposure induces vascular dysfunction, mitochondrial damage, and atherogenesis. Amer J Physio Lung Cell Mole Physiol
297:L209–216. [DOI] [PMC free article] [PubMed] [Google Scholar]
Chuang KJ, Chan CC, Su TC, Lee CT, Tang CS.
2007.
The effect of urban air pollution on inflammation, oxidative stress, coagulation, and autonomic dysfunction in young adults. Am J Respir Crit Care Med
176:370–376. [DOI] [PubMed] [Google Scholar]
Chuang KJ, Yan YH, Chiu SY, Cheng TJ.
2011.
Long-term air pollution exposure and risk factors for cardiovascular diseases among the elderly in Taiwan. Occup Environ Med
68:64–68. [DOI] [PubMed] [Google Scholar]
Coleridge JC, Coleridge HM, Schelegle ES, Green JF.
1993.
Acute inhalation of ozone stimulates bronchial C-fibers and rapidly adapting receptors in dogs. J Appl Physiol (1985)
74:2345–2352. [DOI] [PubMed] [Google Scholar]
Comporti M, Signorini C, Arezzini B, Vecchio D, Monaco B, Gardi C.
2008.
F2-isoprostanes are not just markers of oxidative stress. Free Radic Biol Med
44:247–256. [DOI] [PubMed] [Google Scholar]
Corea F, Silvestrelli G, Baccarelli A, Giua A, Previdi P, Siliprandi G, et al.
2012.
Airborne pollutants and lacunar stroke: a case cross-over analysis on stroke unit admissions. Neurol Int
4:e11. [DOI] [PMC free article] [PubMed] [Google Scholar]
Corradi M, Alinovi R, Goldoni M, Vettori M, Folesani G, Mozzoni P, et al.
2002.
Biomarkers of oxidative stress after controlled human exposure to ozone. Toxicol Lett
134:219–225. [DOI] [PubMed] [Google Scholar]
Devlin RB, Duncan KE, Jardim M, Schmitt MT, Rappold AG, Diaz-Sanchez D.
2012.
Controlled exposure of healthy young volunteers to ozone causes cardiovascular effects. Circulation
126:104–111. [DOI] [PubMed] [Google Scholar]
Devlin RB, McDonnell WF, Mann R, Becker S, House DE, Schreinemachers D, et al.
1991.
Exposure of humans to ambient levels of ozone for 6.6 hours causes cellular and biochemical changes in the lung. Am J Respir Cell Mol Biol
4:72–81. [DOI] [PubMed] [Google Scholar]
Drechsler-Parks DM, Bedi JF, Horvath SM.
1987.
Pulmonary function responses of older men and women to ozone exposure. Exp Gerontol
22:91–101. [DOI] [PubMed] [Google Scholar]
Drechsler-Parks DM, Bedi JF, Horvath SM.
1989.
Pulmonary function responses of young and older adults to mixtures of O3, NO2 and PAN. Toxicol Ind Health
5:505–517. [DOI] [PubMed] [Google Scholar]
Drechsler-Parks DM, Horvath SM, Bedi JF.
1990.
The “effective dose” concept in older adults exposed to ozone. Exp Gerontol
25:107–115. [DOI] [PubMed] [Google Scholar]
Fakhri AA, Ilic LM, Wellenius GA, Urch B, Silverman F, Gold DR, et al.
2009.
Autonomic effects of controlled fine particulate exposure in young healthy adults: effect modification by ozone. Environ Health Perspect
117:1287–1292. [DOI] [PMC free article] [PubMed] [Google Scholar]
Flammer AJ, Anderson T, Celermajer DS, Creager MA, Deanfield J, Ganz P, et al.
2012.
The assessment of endothelial function: from research into clinical practice. Circulation
126:753–767. [DOI] [PMC free article] [PubMed] [Google Scholar]
Frampton MW, Balmes JR, Bromberg PA, Stark P, Arjomandi M, Hazucha MJ, et al.
2017.
Dataset for HEI Research Report 192, Part 1. Multicenter Ozone Study in oldEr Subjects (MOSES): Part 1. Effects of Exposure to Low to Low Concentrations of Ozone on Respiratory and Cardiovascular Outcomes. Boston, MA: Health Effects Institute;
Available: https://dataverse.harvard.edu/dataverse/moses. [PMC free article] [PubMed] [Google Scholar]
Frampton MW, Morrow PE, Torres A, Voter KZ, Whitin JC, Cox C, et al.
1997.
Effects of ozone on normal and potentially sensitive human subjects. Part II: Airway inflammation and responsiveness to ozone in nonsmokers and smokers. Res Rep Health Eff Inst
78:39–72; discussion 81–99. [PubMed] [Google Scholar]
Frampton MW, Pietropaoli A, Dentler M, Chalupa D, Little EL, Stewart J, et al.
2015.
Cardiovascular effects of ozone in healthy subjects with and without deletion of glutathione-S-transferase M1. Inhal Toxicol
27:113–119. [DOI] [PMC free article] [PubMed] [Google Scholar]
Frampton MW, Pryor WA, Cueto R, Cox C, Morrow PE, Utell MJ.
1999.
Ozone exposure increases aldehydes in epithelial lining fluid in human lung. Am J Respir Crit Care Med
159:1134–1137. [DOI] [PubMed] [Google Scholar]
Franchini M, Mannucci PM.
2011.
Thrombogenicity and cardiovascular effects of ambient air pollution. Blood
118:2405–2412. [DOI] [PubMed] [Google Scholar]
Franck U, Leitte AM, Suppan P.
2014.
Multiple exposures to airborne pollutants and hospital admissions due to diseases of the circulatory system in Santiago de Chile. Sci Total Environ
468–469:746–756. [DOI] [PubMed] [Google Scholar]
Frey PF, Ganz P, Hsue PY, Benowitz NL, Glantz SA, Balmes JR, et al.
2012.
The exposure-dependent effects of aged secondhand smoke on endothelial function. J Am Coll Cardiol
59:1908–1913. [DOI] [PubMed] [Google Scholar]
Fry RC, Rager JE, Bauer R, Sebastian E, Peden DB, Jaspers I, et al.
2014.
Air toxics and epigenetic effects: ozone altered microRNAs in the sputum of human subjects. Am J Physiol Lung Cell Mol Physiol
306:L1129–1137. [DOI] [PMC free article] [PubMed] [Google Scholar]
Fry RC, Rager JE, Zhou H, Zou B, Brickey JW, Ting J, et al.
2012.
Individuals with increased inflammatory response to ozone demonstrate muted signaling of immune cell trafficking pathways. Respir Res
13:89. [DOI] [PMC free article] [PubMed] [Google Scholar]
Fung KY, Luginaah I, Gorey KM, Webster G.
2005.
Air pollution and daily hospital admissions for cardiovascular diseases in Windsor, Ontario. Can J Public Health
96:29–33. [DOI] [PMC free article] [PubMed] [Google Scholar]
Gackiere F, Saliba L, Baude A, Bosler O, Strube C.
2011.
Ozone inhalation activates stress-responsive regions of the CNS. J Neurochem
117(6):961–972. [DOI] [PubMed] [Google Scholar]
Girotti AW.
2008.
Translocation as a means of disseminating lipid hydroperoxide-induced oxidative damage and effector action. Free Radic Biol Med
44:956–968. [DOI] [PMC free article] [PubMed] [Google Scholar]
Gong H, Jr, Shamoo DA, Anderson KR, Linn WS.
1997.
Responses of older men with and without chronic obstructive pulmonary disease to prolonged ozone exposure. Arch Environ Health
52:18–25. [DOI] [PubMed] [Google Scholar]
Gong H, Jr, Wong R, Sarma RJ, Linn WS, Sullivan ED, Shamoo DA, et al.
1998.
Cardiovascular effects of ozone exposure in human volunteers. Am J Respir Crit Care Med
158:538–546. [DOI] [PubMed] [Google Scholar]
Goodman JE, Prueitt RL, Sax SN, Pizzurro DM, Lynch HN, Zu K, et al.
2015.
Ozone exposure and systemic biomarkers: Evaluation of evidence for adverse cardiovascular health impacts. Crit Rev Toxicol
45:412–452. [DOI] [PubMed] [Google Scholar]
Gotshall RW.
2006.
Airway response during exercise and hyperpnoea in non-asthmatic and asthmatic individuals. Sports Med
36:513–527. [DOI] [PubMed] [Google Scholar]
Halonen JI, Lanki T, Yli-Tuomi T, Tiittanen P, Kulmala M, Pekkanen
2009.
Particulate air pollution and acute cardiorespiratory hospital admissions and mortality among the elderly. Epidemiology
20:143–153. [DOI] [PubMed] [Google Scholar]
Hamade AK, Misra V, Rabold R, Tankersley CG.
2010.
Age-related changes in cardiac and respiratory adaptation to acute ozone and carbon black exposures: interstrain variation in mice. Inhal Toxicol 22 Suppl
2:84–94. [DOI] [PubMed] [Google Scholar]
Hamade AK, Rabold R, Tankersley CG.
2008.
Adverse cardiovascular effects with acute particulate matter and ozone exposures: Interstrain variation in mice. Environ Health Perspect
116:1033–1039. [DOI] [PMC free article] [PubMed] [Google Scholar]
Hamilton RF, Jr, Li L, Eschenbacher WL, Szweda L, Holian A.
1998.
Potential involvement of 4-hydroxynonenal in the response of human lung cells to ozone. Am J Physiol
274:L8–16. [DOI] [PubMed] [Google Scholar]
Hazucha MJ, Bates DV, Bromberg PA.
1989.
Mechanism of action of ozone on the human lung. J Appl Physiol (1985)
67:1535–1541. [DOI] [PubMed] [Google Scholar]
Hazucha MJ, Folinsbee LJ, Bromberg PA.
2003.
Distribution and reproducibility of spirometric response to ozone by gender and age. J Appl Physiol (1985)
95:1917–1925. [DOI] [PubMed] [Google Scholar]
Hernandez M, Brickey WJ, Alexis NE, Fry RC, Rager JE, Zhou B, et al.
2012.
Airway cells from atopic asthmatic patients exposed to ozone display an enhanced innate immune gene profile. J Allergy Clin Immunol
129:259–261.e1–2. [DOI] [PMC free article] [PubMed] [Google Scholar]
Hoffmann B, Luttmann-Gibson H, Cohen A, Zanobetti A, de Souza C, Foley C, et al.
2012.
Opposing effects of particle pollution, ozone, and ambient temperature on arterial blood pressure. Environ Health Perspect
120:241–246. [DOI] [PMC free article] [PubMed] [Google Scholar]
Iuliano L.
2011.
Pathways of cholesterol oxidation via non-enzymatic mechanisms. Chem Phys Lipids
164:457–468. [DOI] [PubMed] [Google Scholar]
Janssen LJ, Catalli A, Helli P.
2005.
The pulmonary biology of isoprostanes. Antioxid Redox Signal
7:244–255. [DOI] [PubMed] [Google Scholar]
Kahle JJ, Neas LM, Devlin RB, Case MW, Schmitt MT, Madden MC, et al.
2015.
Interaction effects of temperature and ozone on lung function and markers of systemic inflammation, coagulation, and fibrinolysis: a crossover study of healthy young volunteers. Environ Health Perspect
123:310–316. [DOI] [PMC free article] [PubMed] [Google Scholar]
Kappus RM, Ranadive SM, Yan H, Lane-Cordova AD, Cook MD, Sun P, et al.
2015.
Sex differences in autonomic function following maximal exercise. Biol Sex Differ
6:28. [DOI] [PMC free article] [PubMed] [Google Scholar]
Khorana AA, Francis CW, Menzies KE, Wang JG, Hyrien O, Hathcock J, et al.
2008.
Plasma tissue factor may be predictive of venous thromboembolism in pancreatic cancer. J Thromb Haemost
6:1983–1985. [DOI] [PMC free article] [PubMed] [Google Scholar]
Kim CS, Alexis NE, Rappold AG, Kehrl H, Hazucha MJ, Lay JC, et al.
2011.
Lung function and inflammatory responses in healthy young adults exposed to 0.06 ppm ozone for 6.6 hours. Am J Respir Crit Care Med
183:1215–1221. [DOI] [PMC free article] [PubMed] [Google Scholar]
Kodavanti UP, Thomas R, Ledbetter AD, Schladweiler MC, Shannahan JH, Wallenborn JG, et al.
2011.
Vascular and cardiac impairments in rats inhaling ozone and diesel exhaust particles. Environ Health Perspect
119(3):312–318. [DOI] [PMC free article] [PubMed] [Google Scholar]
Kodavanti UP.
2016.
Stretching the stress boundary: Linking air pollution health effects to a neurohormonal stress response. Biochim Biophys Acta
1860(12):2880–2890. [DOI] [PubMed] [Google Scholar]
Krishnan RM, Adar SD, Szpiro AA, Jorgensen NW, Van Hee VC, Barr RG, et al.
2012.
Vascular responses to long-and short-term exposure to fine particulate matter: MESA Air (Multi-Ethnic Study of Atherosclerosis and Air Pollution). J Am Coll Cardiol
60:2158–2166. [DOI] [PMC free article] [PubMed] [Google Scholar]
Kumarathasan P, Blais E, Saravanamuthu A, Bielecki A, Mukherjee B, Bjarnason S, et al.
2015.
Nitrative stress, oxidative stress and plasma endothelin levels after inhalation of particulate matter and ozone. Part Fibre Toxicol
12:28. [DOI] [PMC free article] [PubMed] [Google Scholar]
Langrish JP, Watts SJ, Hunter AJ, Shah AS, Bosson JA, Unosson J, et al.
2014.
Controlled exposures to air pollutants and risk of cardiac arrhythmia. Environ Health Perspect
122:747–753. [DOI] [PMC free article] [PubMed] [Google Scholar]
Lanzinger S, Breitner S, Neas L, Cascio W, Diaz-Sanchez D, Hinderliter A, et al.
2014.
The impact of decreases in air temperature and increases in ozone on markers of endothelial function in individuals having type-2 diabetes. Environ Res
134:331–338. [DOI] [PubMed] [Google Scholar]
Laskin DL, Fakhrzadeh L, Laskin JD.
2001.
Nitric oxide and peroxynitrite in ozone-induced lung injury. Adv Exp Med Biol
500:183–190. [DOI] [PubMed] [Google Scholar]
Lee JT, Kim H, Cho YS, Hong YC, Ha EH, Park H.
2003.
Air pollution and hospital admissions for ischemic heart diseases among individuals 64+ years of age residing in Seoul, Korea. Arch Environ Health
58:617–623. [DOI] [PubMed] [Google Scholar]
Li N, Goodall AH, Hjemdahl P.
1999.
Efficient flow cytometric assay for platelet-leukocyte aggregates in whole blood using fluorescence signal triggering. Cytometry
35:154–161. [DOI] [PubMed] [Google Scholar]
Liao D, Heiss G, Chinchilli VM, Duan Y, Folsom AR, Lin HM, et al.
2005.
Association of criteria pollutants with plasma hemostatic/inflammatory markers: a population-based study. J Expo Anal Environ Epidemiol
15:319–328. [DOI] [PubMed] [Google Scholar]
Link MS, Luttmann-Gibson H, Schwartz J, Mittleman MA, Wessler B, Gold DR, et al.
2013.
Acute exposure to air pollution triggers atrial fibrillation. J Am Coll Cardiol
62:816–825. [DOI] [PMC free article] [PubMed] [Google Scholar]
Lloyd-Jones DM, Hong Y, Labarthe D, Mozaffarian D, Appel LJ, Van Horn L, et al.
2010.
Defining and setting national goals for cardiovascular health promotion and disease reduction: the American Heart Association's strategic Impact Goal through 2020 and beyond. Circulation
121:586–613. [DOI] [PubMed] [Google Scholar]
Malik M, Camm AJ.
1995.
Heart Rate Variability. Boston, MA:Wiley Blackwell, 1–543. [Google Scholar]
Messner B, Bernhard D.
2014.
Smoking and cardiovascular disease: mechanisms of endothelial dysfunction and early atherogenesis. Arterioscler Thromb Vasc Biol
34:509–515. [DOI] [PubMed] [Google Scholar]
Metzger KB, Klein M, Flanders WD, Peel JL, Mulholland JA, Langberg JJ, et al.
2007.
Ambient air pollution and cardiac arrhythmias in patients with implantable defibrillators. Epidemiology
18:585–592. [DOI] [PubMed] [Google Scholar]
Miller DB, Ghio AJ, Karoly ED, Bell LN, Snow SJ, Madden MC, et al.
2016.
Ozone Exposure Increases Circulating Stress Hormones and Lipid Metabolites in Humans. American journal of respiratory and critical care medicine
193(12):1382–1391. [DOI] [PMC free article] [PubMed] [Google Scholar]
Miller MR, Hankinson J, Brusasco V, Burgos F, Casaburi R, Coates A, et al.
2005.
Standardisation of spirometry. Eur Respir J
26:319–338. [DOI] [PubMed] [Google Scholar]
Morrow JD.
2006.
The isoprostanes — unique products of arachidonate peroxidation: their role as mediators of oxidant stress. Curr Pharm Des
12:895–902. [DOI] [PubMed] [Google Scholar]
Morrow JD, Roberts LJ., 2nd
1996.
The isoprostanes. Current knowledge and directions for future research. Biochem Pharmacol
51:1–9. [DOI] [PubMed] [Google Scholar]
Mustafic H, Jabre P, Caussin C, Murad MH, Escolano S, Tafflet M, et al.
2012.
Main air pollutants and myocardial infarction: a systematic review and meta-analysis. JAMA
307:713–721. [DOI] [PubMed] [Google Scholar]
Newby DE, Mannucci PM, Tell GS, Baccarelli AA, Brook RD, Donaldson K, et al.
2015.
Expert position paper on air pollution and cardiovascular disease. Eur Heart J
36:83–93b. [DOI] [PMC free article] [PubMed] [Google Scholar]
Passannante AN, Hazucha MJ, Bromberg PA, Seal E, Folinsbee L, Koch G.
1998.
Nociceptive mechanisms modulate ozone-induced human lung function decrements. J Appl Physiol (1985)
85:1863–1870. [DOI] [PubMed] [Google Scholar]
Patrignani P, Tacconelli S.
2005.
Isoprostanes and other markers of peroxidation in atherosclerosis. Biomarkers 10 Suppl
1:S24–29. [DOI] [PubMed] [Google Scholar]
Perez CM, Hazari MS, Farraj AK.
2015.
Role of autonomic reflex arcs in cardiovascular responses to air pollution exposure. Cardiovasc Toxicol
15:69–78. [DOI] [PMC free article] [PubMed] [Google Scholar]
Pernow J, Shemyakin A, Bohm F.
2012.
New perspectives on endothelin-1 in atherosclerosis and diabetes mellitus. Life Sci
91:507–516. [DOI] [PubMed] [Google Scholar]
Pryor WA, Squadrito GL, Friedman M.
1995.
The cascade mechanism to explain ozone toxicity: the role of lipid ozonation products. Free Radic Biol Med
19:935–941. [DOI] [PubMed] [Google Scholar]
Raza A, Bellander T, Bero-Bedada G, Dahlquist M, Hollenberg J, Jonsson M, et al.
2014.
Short-term effects of air pollution on out-of-hospital cardiac arrest in Stockholm. Eur Heart J
35:861–868. [DOI] [PubMed] [Google Scholar]
Reisenauer CS, Koenig JQ, McManus MS, Smith MS, Kusic G, Pierson WE.
1988.
Pulmonary response to ozone exposures in healthy individuals aged 55 years or greater. J Air Pollut Control Assoc
38:51–55. [DOI] [PubMed] [Google Scholar]
Rich DQ, Kim MH, Turner JR, Mittleman MA, Schwartz J, Catalano PJ, et al.
2006a.
Association of ventricular arrhythmias detected by implantable cardioverter defibrillator and ambient air pollutants in the St. Louis, Missouri, metropolitan area. Occup Environ Med
63:591–596. [DOI] [PMC free article] [PubMed] [Google Scholar]
Rich DQ, Mittleman MA, Link MS, Schwartz J, Luttmann-Gibson H, Catalano PJ, et al.
2006b.
Increased risk of paroxysmal atrial fibrillation episodes associated with acute increases in ambient air pollution. Environ Health Perspect
114:120–123. [DOI] [PMC free article] [PubMed] [Google Scholar]
Rich DQ, Schwartz J, Mittleman MA, Link M, Luttmann-Gibson H, Catalano PJ, et al.
2005.
Association of short-term ambient air pollution concentrations and ventricular arrhythmias. Am J Epidemiol
161:1123–1132. [DOI] [PubMed] [Google Scholar]
Rich KE, Petkau J, Vedal S, Brauer M.
2004.
A case-crossover analysis of particulate air pollution and cardiac arrhythmia in patients with implantable cardioverter defibrillators. Inhal Toxicol
16:363–372. [DOI] [PubMed] [Google Scholar]
Rodopoulou S, Chalbot MC, Samoli E, Dubois DW, San Filippo BD, Kavouras IG.
2014.
Air pollution and hospital emergency room and admissions for cardiovascular and respiratory diseases in Dona Ana County, New Mexico. Environ Res
129:39–46. [DOI] [PubMed] [Google Scholar]
Romieu I, Sienra-Monge JJ, Ramirez-Aguilar M, Moreno-Macias H, Reyes-Ruiz NI, Estela del Rio-Navarro B, et al.
2004.
Genetic polymorphism of GSTM1 and antioxidant supplementation influence lung function in relation to ozone exposure in asthmatic children in Mexico City. Thorax
59:8–10. [PMC free article] [PubMed] [Google Scholar]
Rosenthal FS, Kuisma M, Lanki T, Hussein T, Boyd J, Halonen JI, et al.
2013.
Association of ozone and particulate air pollution with out-of-hospital cardiac arrest in Helsinki, Finland: evidence for two different etiologies. J Expo Sci Environ Epidemiol
23:281–288. [DOI] [PubMed] [Google Scholar]
Sarnat SE, Winquist A, Schauer JJ, Turner JR, Sarnat JA.
2015.
Fine particulate matter components and emergency department visits for cardiovascular and respiratory diseases in the St. Louis, Missouri-Illinois, metropolitan area. Environ Health Perspect
123:437–444. [DOI] [PMC free article] [PubMed] [Google Scholar]
Schelegle ES, Carl ML, Coleridge HM, Coleridge JC, Green JF.
1993.
Contribution of vagal afferents to respiratory reflexes evoked by acute inhalation of ozone in dogs. J Appl Physiol (1985)
74:2338–2344. [DOI] [PubMed] [Google Scholar]
Schelegle ES, Morales CA, Walby WF, Marion S, Allen RP.
2009.
6.6-hour inhalation of ozone concentrations from 60 to 87 parts per billion in healthy humans. Am J Respir Crit Care Med
180:265–272. [DOI] [PubMed] [Google Scholar]
Schnabel R, Blankenberg S.
2007.
Oxidative stress in cardiovascular disease: successful translation from bench to bedside?
Circulation
116:1338–1340. [DOI] [PubMed] [Google Scholar]
Schneider A, Hampel R, Ibald-Mulli A, Zareba W, Schmidt G, Schneider R, et al.
2010.
Changes in deceleration capacity of heart rate and heart rate variability induced by ambient air pollution in individuals with coronary artery disease. Part Fibre Toxicol
7:29. [DOI] [PMC free article] [PubMed] [Google Scholar]
Seltzer J, Bigby BG, Stulbarg M, Holtzman MJ, Nadel JA, Ueki IF, et al.
1986.
O3-induced change in bronchial reactivity to methacholine and airway inflammation in humans. J Appl Physiol (1985)
60:1321–1326. [DOI] [PubMed] [Google Scholar]
Shah AS, Langrish JP, Nair H, McAllister DA, Hunter AL, Donaldson K, et al.
2013.
Global association of air pollution and heart failure: a systematic review and meta-analysis. Lancet
382:1039–1048. [DOI] [PMC free article] [PubMed] [Google Scholar]
Shah AS, Lee KK, McAllister DA, Hunter A, Nair H, Whiteley W, et al.
2015.
Short term exposure to air pollution and stroke: systematic review and meta-analysis. BMJ
350:h1295. [DOI] [PMC free article] [PubMed] [Google Scholar]
Shumake KL, Sacks JD, Lee JS, Johns DO.
2013.
Susceptibility of older adults to health effects induced by ambient air pollutants regulated by the European Union and the United States. Aging Clin Exp Res
25:3–8. [DOI] [PubMed] [Google Scholar]
Sivagangabalan G, Spears D, Masse S, Urch B, Brook RD, Silverman F, et al.
2011.
The effect of air pollution on spatial dispersion of myocardial repolarization in healthy human volunteers. J Am Coll Cardiol
57:198–206. [DOI] [PubMed] [Google Scholar]
Smetana P, Malik M.
2013.
Sex differences in cardiac autonomic regulation and in repolarisation electrocardiography. Pflugers Arch
465:699–717. [DOI] [PubMed] [Google Scholar]
Smith RL, Xu B, Switzer P.
2009.
Reassessing the relationship between ozone and short-term mortality in U.S. urban communities. Inhal Toxicol
29:37–61. [DOI] [PubMed] [Google Scholar]
Stewart JC, Chalupa DC, Devlin RB, Frasier LM, Huang LS, Little EL, et al.
2010.
Vascular effects of ultrafine particles in persons with type 2 diabetes. Environ Health Perspect
118:1692–1698. [DOI] [PMC free article] [PubMed] [Google Scholar]
Strak M, Hoek G, Steenhof M, Kilinc E, Godri KJ, Gosens I, et al.
2013.
Components of ambient air pollution affect thrombin generation in healthy humans: the RAPTES project. Occup Environ Med
70:332–340. [DOI] [PubMed] [Google Scholar]
Symons JM, Wang L, Guallar E, Howell E, Dominici F, Schwab M, et al.
2006.
A case-crossover study of fine particulate matter air pollution and onset of congestive heart failure symptom exacerbation leading to hospitalization. Am J Epidemiol
164:421–433. [DOI] [PubMed] [Google Scholar]
Szyszkowicz M.
2008.
Ambient air pollution and daily emergency department visits for ischemic stroke in Edmonton, Canada. Int J Occup Med Environ Health
21:295–300. [DOI] [PubMed] [Google Scholar]
Tanabe K, Kawai Y, Kitayama M, Akao H, Ishida R, Motoyama A, et al.
2014.
Increased levels of the oxidative stress marker, nitrotyrosine in patients with provocation test-induced coronary vasospasm. J Cardiol
64:86–90. [DOI] [PubMed] [Google Scholar]
Tank J, Biller H, Heusser K, Holz O, Diedrich A, Framke T, et al.
2011.
Effect of acute ozone induced airway inflammation on human sympathetic nerve traffic: a randomized, placebo controlled, crossover study. PloS one
6(4):e18737. [DOI] [PMC free article] [PubMed] [Google Scholar]
Taylor-Clark TE, McAlexander MA, Nassenstein C, Shear-down SA, Wilson S, Thornton J, et al.
2008.
Relative contributions of TRPA1 and TRPV1 channels in the activation of vagal bronchopulmonary C-fibres by the endogenous autacoid 4-oxononenal. J Physiol
586:3447–3459. [DOI] [PMC free article] [PubMed] [Google Scholar]
Taylor-Clark TE, Undem BJ.
2010.
Ozone activates airway nerves via the selective stimulation of TRPA1 ion channels. J Physiol
588:423–433. [DOI] [PMC free article] [PubMed] [Google Scholar]
Teng TH, Williams TA, Bremner A, Tohira H, Franklin P, Tonkin A, et al.
2014.
A systematic review of air pollution and incidence of out-of-hospital cardiac arrest. J Epidemiol Community Health
68:37–43. [DOI] [PubMed] [Google Scholar]
Thompson AM, Zanobetti A, Silverman F, Schwartz J, Coull B, Urch B, et al.
2010.
Baseline repeated measures from controlled human exposure studies: associations between ambient air pollution exposure and the systemic inflammatory biomarkers IL-6 and fibrinogen. Environ Health Perspect
118:120–124. [DOI] [PMC free article] [PubMed] [Google Scholar]
Thomson E, Kumarathasan P, Goegan P, Aubin RA, Vincent R.
2005.
Differential regulation of the lung endothelin system by urban particulate matter and ozone. Toxicol Sci
88:103–113. [DOI] [PubMed] [Google Scholar]
Tolbert PE, Klein M, Peel JL, Sarnat SE, Sarnat JA.
2007.
Multipollutant modeling issues in a study of ambient air quality and emergency department visits in Atlanta. J Expo Sci Environ Epidemiol 17 Suppl
2:S29–35. [DOI] [PubMed] [Google Scholar]
U.S. Environmental Protection Agency. 2013.
Final Report: Integrated Science Assessment of Ozone and Related Photochemical Oxidants. EPA/600/R-10/076F. U.S. Environmental Protection Agency, Washington, DC:
Available: https://cfpub.epa.gov/ncea/isa/recordisplay.cfm?deid=247492. [Google Scholar]
U.S. Environmental Protection Agency. 2015.
National Ambient Air Quality Standard for Ozone; Final Rule. 40 CFR, Parts 50, 51, 52, 53, and 58. Federal Register
80(206):65292–65468. [Google Scholar]
Vedal S, Rich K, Brauer M, White R, Petkau J.
2004.
Air pollution and cardiac arrhythmias in patients with implantable cardioverter defibrillators. Inhal Toxicol
16:353–362. [DOI] [PubMed] [Google Scholar]
Vicente J, Johannesen L, Galeotti L, Strauss DG.
2014.
Mechanisms of sex and age differences in ventricular repolarization in humans. Am Heart J
168:749–756. [DOI] [PubMed] [Google Scholar]
Wang JG, Manly D, Kirchhofer D, Pawlinski R, Mackman N.
2009.
Levels of microparticle tissue factor activity correlate with coagulation activation in endotoxemic mice. J Thromb Haemost
7:1092–1098. [DOI] [PMC free article] [PubMed] [Google Scholar]
Watkins A, Danilewitz M, Kusha M, Masse S, Urch B, Quadros K, et al.
2013.
Air pollution and arrhythmic risk: the smog is yet to clear. Can J Cardio
29:734–741. [DOI] [PubMed] [Google Scholar]
Williams AS, Leung SY, Nath P, Khorasani NM, Bhavsar P, Issa R, et al.
2007.
Role of TLR2, TLR4, and MyD88 in murine ozone-induced airway hyperresponsiveness and neutrophilia. J Appl Physiol (1985)
103:1189–1195. [DOI] [PubMed] [Google Scholar]
Wu W, Peden D, Diaz-Sanchez D.
2012.
Role of GSTM1 in resistance to lung inflammation. Free Radic Biol Med
53:721–729. [DOI] [PMC free article] [PubMed] [Google Scholar]
Yu AP, Tam BT, Yau WY, Chan KS, Yu SS, Chung TL, et al.
2015.
Association of endothelin-1 and matrix metallopeptidase-9 with metabolic syndrome in middle-aged and older adults. Diabetol Metab Syndr
7:111. [DOI] [PMC free article] [PubMed] [Google Scholar]
Zanobetti A, Schwartz J.
2006.
Air pollution and emergency admissions in Boston, MA. J Epidemiol Comm Health
60:890–895. [DOI] [PMC free article] [PubMed] [Google Scholar]
Res Rep Health Eff Inst.
Commentary by HEI MOSES Review Panel
Research Report 192, Multicenter Ozone Study in oldEr Subjects (MOSES): Part 1. Effects of Exposure to Low Concentrations of Ozone on Respiratory and Cardiovascular Outcomes, M.W. Frampton, John R. Balmes, Philip A. Bromberg, Paul Stark, et al.
Drs. Mark Frampton, John Balmes, Philip Bromberg, and Paul Stark’s 4-year study, “Multicenter Ozone Study in Elderly Subjects (MOSES),” began in July 2011. Total expenditures were $5,521,858. A draft Investigators’ Report was received for review in March 2016. A revised report, received in August 2016, was accepted for publication in March 2017. During the review process, the HEI MOSES Review Panel and the investigators had the opportunity to exchange comments and to clarify issues in both the Investigators’ Report and the Review Panel’s Commentary. (As one of the principal investigators of the MOSES report, Dr. Frampton, a member of the HEI Review Committee, was not involved in its evaluation by the MOSES Review Panel.)
This document has not been reviewed by public or private party institutions, including those that support the Health Effects Institute; therefore, it may not reflect the views of these parties, and no endorsements by them should be inferred.
Ozone is a reactive oxidant formed, in the presence of sunlight, through complex photochemical reactions among pollutants emitted from anthropogenic and natural sources. Although ozone in the stratosphere protects the planet from harmful ultraviolet radiation, human exposure to increased levels of ozone at ground level produces adverse health effects. Ozone is one of the six criteria pollutants regulated by the U.S. Environmental Protection Agency (U.S. EPA*) under the Clean Air Act. The effects of ozone exposure on the human respiratory system are well established and include exacerbation of asthma and increases in hospital admissions and death from respiratory illnesses, such as chronic obstructive pulmonary disease (COPD) and asthma (U.S. EPA 2013). Recent data from the State of Global Air 2017 (HEI 2017) show that ozone is globally ranked 33rd in the list of risk factors contributing to deaths from all causes, mostly due to deaths from chronic respiratory diseases. On the other hand, the effects of ozone exposure on the cardiovascular system are not as well characterized, and research in this area has produced inconsistent results (U.S. EPA 2013). It is plausible that ozone could cause cardiovascular dysfunction by mechanisms such as systemic inflammation, oxidative stress, and alterations in autonomic balance, and these effects can lead to endothelial dysfunction, acute arterial vasoconstriction, arrhythmias, and procoagulant activity. These issues point to the importance of research to fill the gap in our understanding of the cardiovascular effects of ozone, particularly at near ambient concentrations.
In February 2010, HEI issued Request for Applications (RFA) 10-1, Cardiovascular Effects of Exposure to Low Levels of Ozone in the Presence or Absence of Other Ambient Pollutants, for research on the effects of ozone alone and in combination with other pollutants on the human cardiovascular system to fill an important knowledge gap. The RFA focused on ozone levels close to the U.S. National Ambient Air Quality Standard (NAAQS), currently at 70 parts per billion (ppb). The RFA specified that the participants in these studies should be healthy men and women 55 to 70 years old. They should be exposed in a laboratory chamber at near ambient levels of ozone for two to three hours, with intermittent exercise. The outcome measures should focus primarily on cardiovascular effects; in addition, indicators of pulmonary function, inflammation, and oxidative stress were of interest as secondary endpoints.
The RFA stated that the studies selected for funding should include volunteers exposed to ozone at concentrations between 60 and 100 ppb in a controlled laboratory setting. To increase the number of subjects and for geographical diversity, the HEI Research Committee intended to manage the studies as a multicenter study: multiple research centers would conduct the exposures using a common protocol and standard operating procedures and would develop a common plan for data analysis.
In response to RFA 10-1, three centers were selected to participate in the multicenter study. The teams were led by Dr. John Balmes at the University of California–San Francisco (UCSF), Dr. Philip Bromberg at the University of North Carolina–Chapel Hill (UNC), and Dr. Mark Frampton at the University of Rochester Medical Center (URMC), New York. The investigators named the study “Multicenter Ozone Study in Elderly Subjects” (MOSES). (Because the study included people that were on average younger than 65 years old, which is the lower limit for the definition of elderly, the study name was later changed to “Multicenter Ozone Study in oldEr Subjects.”) In 2010, HEI also issued a Request for Qualifications for a Data Analysis Center, seeking a well-qualified statistical data analysis center to develop the plan for analysis and to manage and analyze the data collected in the multicenter ozone exposure study. The New England Research Institute was selected to serve as the data coordinating center for the study. HEI formed a special MOSES Oversight Committee to provide input during the development of the study protocol and the standard operating procedures. The HEI Research Committee provided input while the study was ongoing. In addition, a MOSES Data Monitoring Board was formed to ensure data quality and participant safety during the study.
This Commentary provides the HEI MOSES Review Panel’s evaluation of the study. It is intended to aid the sponsors of HEI and the public by highlighting both the strengths and limitations of the study and by placing the Investigators’ Report into scientific and regulatory perspective.
SCIENTIFIC AND REGULATORY BACKGROUND
OZONE CHEMISTRY AND AMBIENT CONCENTRATIONS
Ozone is not emitted directly from combustion sources but is formed by chemical reactions of precursors such as nitrogen oxides (NOx) and volatile organic compounds (VOCs) in the presence of sunlight. Sources of ozone precursors are both manmade and natural. Sources of NOx include motor vehicles, power plants, and wild fires. VOCs sources include motor vehicles, paints and solvents, wild fires, and vegetation (e.g., plants emit VOCs such as pinene and isoprene). Modeling of ozone concentrations in the atmosphere needs to take into account the emissions of those precursors, atmospheric chemistry, meteorology, and transport.
People across the globe are exposed to varying amounts of ozone in the air they breathe. Background levels of ozone, mainly of natural origin, are estimated to be in the range of 20–35 ppb and may be increased by intercontinental transport of anthropogenic pollution (U.S. EPA 2013). For regulatory purposes, ozone concentrations are generally monitored and reported during the warmer months when ozone levels are highest due to increased solar radiation. Depending on location, the warm season during which states are required to report ozone concentrations varies from March through November (for southern states) to June through September (for northern states). In the United States, the median warm-season 8-hr daily maximum ozone concentration reported for 2009 was 40 ppb (maximum value, 128 ppb) across 1,141 monitors nationwide. Depending on the level of urbanization and various local factors, some counties exceed an annual average of 60 ppb (U.S. EPA 2013).
HEI’s State of Global Air 2017 report and website present estimates of recent ozone levels across the world. The estimates are developed using a chemical transport model, in order to provide consistent estimates across time and full global coverage, including for areas lacking monitors. Note that the values are calculated as average concentrations (of 8-hr daily maximum values) during the warm season (which varies by location) and as population-weighted averages — meaning that concentrations in urban areas were given more weight than concentrations in rural areas where fewer people live. Seasonal population-weighted ozone concentrations for 2015 were estimated to be relatively high in the United States (67 ppb, down from 70 ppb in 2000), China (65 ppb, up from 59 ppb in 2000), India (76 ppb, up from 65 ppb in 2000), and some countries of western and central sub-Saharan Africa, the Middle East, and South Asia, with levels in some countries exceeding 100 ppb (Cohen et al. 2017; HEI 2017). Estimated global trends show an approximate 7% increase from 1990 (57 ppb) to 2015 (61 ppb). Among the 10 most populous countries, the largest increases (of 14% to 25%) were estimated for India, Bangladesh, Pakistan, China, and Brazil. The United States and the European Union have experienced small declines in ozone concentrations since 1990 (5% and 2%, respectively), but certain U.S. states and E.U. countries remain at higher levels, for example, Italy at 74 ppb in 2015 (down from 79 ppb in 2000) (HEI 2017). Thus, large sections of the global population continue to be exposed to unhealthy levels of ozone.
Because of the increasing evidence of the harmful effects of ozone to both humans (discussed below) and crops at lower and lower levels, ozone standards have been revised several times since they were first promulgated. Commentary Table 1 provides an overview of the historical and current U.S. NAAQS for ozone (which are enforced under the U.S. Clean Air Act) and the current World Health Organization (WHO) Air Quality Guidelines (which are provided as guidance to countries and do not have the force of standards). Due to continued emissions of precursors, background concentrations from natural sources, and regional transport, many locations have trouble meeting the standards or guidelines.
Commentary Table 1.
History of Ozone Standards and Guidelines
Indicator
Year
Averaging Time
Level
Form
National Ambient Air Quality Standards (U.S. EPA)a
Total photochemical oxidants
1971
1 hr
80 ppb
Not to be exceeded more than one hour per year
Ozone
1979
1 hr
120 ppb
Expected number of days per calendar year, with maximum hourly average concentration greater than 120 ppb, should be ≤1
Ozone
1997
8 hr
80 ppb
Annual fourth-highest daily maximum 8-hr concentration, averaged over 3 years
Ozone
2008
8 hr
75 ppb
Annual fourth-highest daily maximum 8-hr concentration, averaged over 3 years
Ozone
2015
8 hr
70 ppb
Annual fourth-highest daily maximum 8-hr concentration, averaged over 3 years
Ozone is known to have both short-term and long-term effects on human health, with the strongest evidence for respiratory effects and some evidence for effects on the cardiovascular and other organ systems. In determining whether ozone exposure is causally related to certain health outcomes, scientists consider evidence from human epidemiology studies and controlled human exposure studies; they also consider results from animal research to support the findings in humans and strengthen knowledge about mechanistic pathways.
Below we provide a summary of data linking ozone exposure to health, specifically its effects on the respiratory and cardiovascular systems. The goal is to provide a brief overview of evidence available at the time the MOSES study started, as described in detail in the U.S. EPA’s Integrated Science Assessment for Ozone and Related Photochemical Oxidants (U.S. EPA 2013), with some key additional evidence that has become available since then.
Respiratory Effects
On a global basis, the estimated percentage of deaths linked to ozone (specifically from COPD) has increased from approximately 5% in 1990 to 8% in 2015 (Cohen et al 2017; HEI 2017). Much of that increase occurred in India, while the number of deaths linked to ozone in China remained about the same. The number of deaths attributed to ozone in the United States in 2015 was 11,600, mostly related to deaths from COPD. The number of disability-adjusted life-years — a measure of lost productivity due to illness or missed days at school or work and due to premature death — was 155,730 for the United States in 2015, mostly related to asthma (Cohen et al. 2017; HEI 2017). With rising global temperatures, average and peak concentrations of ozone may well increase, with potentially important consequences for human health (Atkinson et al. 2016; Chang et al. 2010; Fann et al. 2015; Karlsson et al. 2017). Time-series epidemiological studies have shown associations of short-term exposure to ozone and daily deaths (Ito et al. 2005; Peng et al. 2013). Long-term exposure to ozone has been associated with increased mortality among Medicare enrollees who had previously been hospitalized because of COPD (Zanobetti and Schwartz 2011). However, associations between long-term exposure to ozone and deaths from all causes in cohort studies remain inconclusive (Atkinson et al. 2016; Turner et al. 2016).
It is well known that ozone adversely affects the lungs. People with asthma, a condition characterized by chronic airway inflammation, are considered particularly sensitive to the effects of ozone exposure. Acute exposure to ozone in people with allergic asthma results in increased numbers of eosinophils in the airways (e.g., Peden et al 1997; Vagaggini et al 2002). Long-term effects of ozone exposure include increased health effects in sensitive populations, such as in people with asthma, and possible associations with new-onset asthma in some populations. Studies in non-human primates have shown that ozone exposure during gestation or infancy may contribute to irreversible morphological changes in the lung, which may lead to functional changes (Fanucchi et al. 2006). These results suggest the plausibility of chronic, irreversible effects of ozone in children with asthma. Whether long-term ozone exposure contributes to deficits in lung function growth in children remains inconclusive (U.S. EPA 2013).
Short-term effects of ozone exposure include shortness of breath, exacerbation of asthma symptoms and greater medication use, and increases in respiratory-related hospital admissions and emergency department visits related to asthma. The most recent survey of ozone health effects conducted by the U.S. EPA states that “there is adequate evidence for asthmatics to be [considered] an at-risk population based on the substantial, consistent evidence among controlled human exposure studies and coherence from epidemiological and toxicological studies” (U.S. EPA 2013).
Some of the most convincing evidence of the short-term effects of acute ozone exposure has been provided by human controlled-exposure studies, primarily conducted in healthy young adults. Many such studies have established that short-term exposure to low concentrations of ozone — close to the current NAAQS of 70 ppb — with intermittent exercise decreases lung function (measured as forced vital capacity [FVC] and forced expiratory volume in 1 second [FEV1]) and increases airway hyperreactivity and airway inflammatory responses (Adams 2006; Balmes et al. 1996; Kim et al. 2011; Schelegle et al. 2009; Torres et al. 1997; U.S. EPA 2013). Healthy young adults exposed to 80 ppb ozone for 6.6 hours showed increased airway neutrophils, monocytes, and dendritic cells and promotion of antigen-presenting cell phenotypes 18 hours following exposure (Alexis et al. 2010). Exposure of healthy volunteers to an even lower concentration of 60 ppb ozone for 6.6 hours with intermittent exercise showed a decreased mean FEV1 following ozone exposure and a large increase in the percentage of neutrophils in induced sputum (Kim et al. 2011). The degree of decreased lung function varies substantially among individuals exposed to the same level of ozone (Ultman et al. 2004), suggesting that some subgroups of the population may be particularly susceptible. Some studies have found that ozone effects in older adults were smaller than those observed in younger people (e.g., Drechsler-Parks 1995). Earlier studies (Balmes et al. 1996; Torres et al. 1997) established that the lung function and pulmonary inflammatory responses to ozone were independent of each other. The mechanisms by which ozone induces all these acute effects in humans were reviewed recently (Bromberg 2016).
After inhalation, ozone reacts with constituents of the respiratory tract lining fluid to generate reactive oxygen species that can overwhelm antioxidant defenses and cause localized oxidative stress in the respiratory tract. Ozone’s high reactivity makes it unlikely that it penetrates far beyond the fluid that lines the lung’s epithelial cell layer. Its harmful effects are thought to be mediated by products of its reactions with constituents of the lining fluid and the epithelial cell membrane (Pryor 1992) that may travel beyond the lung to produce effects elsewhere in the body.
Cardiovascular Effects
Although there is convincing evidence of ozone effects on respiratory deaths and illnesses, evidence for cardiovascular outcomes has been sparser and less consistent. It remains difficult to disentangle the cardiovascular effects of ozone from those of other air pollutants, especially particulate matter (PM), which has been shown to have strong associations with cardiovascular deaths and illnesses. However, some recent studies suggest that long-term ozone exposure may be associated with cardiovascular deaths in the general population (Cakmak et al. 2016; Turner et al. 2016) and in older individuals who had a history of congestive heart failure or myocardial infarction (Zanobetti and Schwartz 2011). In a large cohort of African American women, chronic exposure to higher ozone levels was associated with an increase in hypertension incidence (Coogan et al. 2017) and with type 2 diabetes (Jerrett et al. 2017).
A limited number of studies in volunteers (exposed to 23 to 43 ppb ozone for 2 or 3 hours) and populations exposed to varying concentrations of ambient ozone have provided some evidence that ozone exposure is associated with increases in blood pressure and markers in blood, such as cholesterol, fasting glucose, glycated hemoglobin (HbA1c), neutrophils (a marker of inflammation), and 8-isoprostane (a marker of lipid peroxidation); however, no associations were found with fibrinogen (a marker of blood clotting), C-reactive protein (a marker of systemic inflammation that is predictive of cardiovascular disease risk), triglycerides, or interleukin-6 (Chen et al. 2007; Chuang et al. 2011; Forbes et al. 2009).
A number of experimental studies in animals investigated whether longer-term exposure to ozone has effects on the cardiovascular system, with a recent focus on development of atherosclerosis and metabolic diseases. Evidence of atherosclerosis in the aorta has been shown in hyperlipidemic mice exposed to 500 ppb ozone for 8 weeks (Chuang et al. 2009). Mice that were prone to obesity and diabetes showed changes in insulin and leptin in blood, and inflammatory changes in adipose tissue after exposure to 500 ppb ozone for 3 weeks (Zhong et al. 2016). Rats exposed to 400 ppb ozone for 16 weeks showed changes in lipid markers and markers of oxidative stress, blood clotting, and vasoconstriction (Kodavanti et al. 2011), providing some clues to possible pathways involved; these effects were also shown to occur in a panel of human volunteers exposed to 300 ppm ozone for 2 hours (Miller et al. 2016).
Epidemiological studies have found positive associations between short-term ozone exposure and deaths from all causes, in particular during the warm season (when ozone levels are typically higher than in the cold season), and have found that these associations are independent of coexposure to PM (U.S. EPA 2013). However, epidemiological evidence of associations between short-term ozone exposure and cardiovascular outcomes is sparse. Peel and colleagues (2007) reported increased emergency department visits for adverse cardiovascular events associated with ozone among persons with COPD, although Metzger and colleagues (2004) did not find such an association. A recent study reported that short-term exposure to ozone was associated with increased mortality in people who had been hospitalized previously for acute myocardial infarction (Bero Bedada et al. 2016). A recent review of panel studies concluded that effects of short-term ozone exposure on heart rate variability remained inconclusive (Buteau and Goldberg 2016).
The strongest evidence for short-term effects of ozone exposure on cardiovascular outcomes has been provided by animal studies, with more limited evidence from panel studies in volunteers. Short-term ozone studies in animals have reported changes in heart rate, heart rate variability, arrhythmias, and vascular reactivity; some of these effects overlap with those observed after long-term ozone exposure (U.S. EPA 2013). Not all evidence is straightforward, however; for example, both increases and decreases in heart rate have been observed. Possible pathways include systemic oxidative stress and changes in the autonomic nervous system that are triggered by inflammation in the lung.
Experimental studies in young adult volunteers exposed to moderately high levels of ozone (115 and 300 ppb) have shown changes in heart rate variability (a marker of autonomic nervous system activity) — although one study showed an increase and another a decrease (Devlin et al. 2012; Fakhri et al. 2009) — and changes in various inflammatory and vascular biomarkers, such as interleukin-8, interleukin 1β, tumor necrosis factor-alpha (TNF-α), C-reactive protein, plasminogen, plasminogen activator inhibitor-1, and tissue-type plasminogen activator (Devlin et al. 2012). The changes in plasminogen markers indicate possible involvement of fibrinolytic pathways (i.e., breaking down of fibrin in blood clots). However, an earlier study failed to find cardiovascular effects in healthy or hypertensive adult volunteers exposed to 300 ppb ozone (Gong et al. 1998). Studies that reported a change in blood pressure after exposure to ozone in combination with concentrated ambient particles failed to show an effect for ozone alone in adult volunteers (Fakhri et al. 2009; Sivagangabalan et al. 2011). Healthy adult volunteers exposed to 150 μg/m3 concentrated ambient PM or 120 ppb ozone showed effects on a high-density lipoprotein oxidant index (a measure of antioxidant/anti-inflammatory capacity) after PM exposure — but not after ozone exposure (Ramanathan et al. 2016). Thus, the evidence of cardiovascular effects in humans at low concentrations remains mixed.
Summary of Evidence
In its 2013 Integrated Science Assessment for Ozone and Related Photochemical Oxidants, the U.S. EPA summarized the effects of ozone exposure on respiratory and cardiovascular outcomes as follows:
Short-Term Exposures
“The recent evidence integrated across toxicological, controlled human exposure, and epidemiological studies, along with the total body of evidence evaluated in previous AQCDs [Air Quality Criteria Documents], is sufficient to conclude that there is a causal relationship between short-term ozone exposure and respiratory effects.” In addition, there “is likely to be a causal relationship between relevant short-term exposures to ozone and cardiovascular effects,” and there “is likely to be a causal relationship between relevant short-term exposures to ozone and total mortality” (U.S. EPA 2013).
Long-Term Exposure
“[T]he recent epidemiological studies of respiratory health effects … combined with toxicological studies in rodents and nonhuman primates, provide biologically plausible evidence that there is likely to be a causal relationship between long-term exposure to ozone and respiratory effects.” In addition, “the generally limited body of evidence is suggestive of a causal relationship between long-term exposures to ozone and cardiovascular effects,” and the evidence “is suggestive of a causal relationship between long-term ozone exposures and total mortality” (U.S. EPA 2013).
However, as noted earlier, others have judged the evidence regarding the associations between long-term exposure to ozone and deaths from all causes in cohort studies to be inconclusive (Atkinson et al. 2016; Turner et al. 2016).
Given the varying results summarized here, there was a clear need for a study that would investigate cardiovascular effects of short-term ozone exposures to near ambient concentrations. The following section, “Technical Evaluation,” summarizes the study approach and key results followed by an evaluation of the study’s strengths and limitations as assessed by the HEI MOSES Review Panel in its independent review of the study.
TECHNICAL EVALUATION
SPECIFIC AIMS
The MOSES project evaluated the effects of short-term exposure to ozone on the cardiovascular and respiratory systems in older participants. The study focused on 70 and 120 ppb ozone, concentrations similar to those observed in ambient air in many areas of the United States. The study focused on older participants because they were thought to be more susceptible to ozone-induced cardiovascular effects than younger subjects.
The primary hypothesis was that short-term exposure to near-ambient levels of ozone would induce acute cardiovascular responses through the following mechanisms: autonomic imbalance, systemic inflammation, and development of a prothrombotic vascular state. A confirmatory hypothesis was that exposure to ozone would induce airway inflammation, lung injury, and decreased lung function. Secondary hypotheses were that ozone-induced acute cardiovascular responses would be associated with (a) increased systemic oxidative stress and airway inflammation and (b) absence of the glutathione S-transferase mu 1 (GSTM1) gene (see Commentary Sidebar 1).
COMMENTARY SIDEBAR 1. ABOUT GSTM1 POLYMORPHISMS.
Glutathione S-transferase mu 1 (GSTM1) is involved in antioxidant defenses; therefore, individuals who lack the GSTM1 gene (called GSTM1-null) may be at increased risk for acute health effects. This gene encodes an enzyme that functions in the detoxification of compounds, including carcinogens, therapeutic drugs, environmental toxins, and products of oxidative stress. Detoxification occurs by conjugating the toxic compound to glutathione. The genes encoding the enzyme are known to be highly polymorphic, meaning that many different forms exist, some of which may have less functionality. These genetic variations can change an individual’s susceptibility to toxic compounds as well as affect the toxicity and efficacy of certain drugs. Null mutations of GSTM1 have been linked with an increase in a number of cancers, likely due to an increased susceptibility to environmental toxins and carcinogens. Numerous studies have implicated such genotypic variations in asthma, atherosclerosis, allergies, and other inflammatory diseases.
STUDY DESIGN
There are multiple pathways by which ozone may lead to cardiovascular dysfunction, including systemic inflammation, oxidative stress, or changes in activity of the autonomic nervous system. Such changes can ultimately lead to arrhythmias, endothelial dysfunction, acute arterial vasoconstriction, and procoagulant activity. Researchers have access to bioassays to measure a large number of cardiovascular and cardiometabolic markers. Each of the hypothesized mechanistic pathways has its own set of related markers, which may or may not be predictive of, or ultimately lead to, cardiovascular disease. Results of these biological assays are taken as markers of specific subclinical physiological changes and should not necessarily be directly interpreted as an adverse health effect (Thurston et al. 2017).
In designing the MOSES study, the investigators selected a large panel of markers to assess various early changes on the pathway to possible cardiovascular or respiratory disease. They focused on markers that have been measured in other human exposure and panel studies and have been previously shown to change after exposure to air pollutants. Commentary Sidebars 2 and 3 provide more information on the parameters measured in MOSES.
COMMENTARY SIDEBAR 2. ANALYZING AN ELECTROCARDIOGRAM.
An electrocardiogram (ECG) measures the aggregate electrical potential of cells in the heart through several leads that are placed across a person’s chest. Using a portable Holter monitor, a continuous ECG can be recorded for several days. The ECG trace shows peaks and troughs that reflect the activity of the heart’s nodes, which send electrical signals to initiate contraction of the atria and ventricles. The different waves are marked “P” through “U” by convention (see Sidebar Figure). The P-wave signals depolarization as it travels from the sinoatrial node through the atria of the heart. The subsequent QRS complex represents the time required for depolarization (electrical inactivation) of the ventricles, which triggers their contraction. The T-wave signals electrical recovery of the heart cells (repolarization). Sometimes a small U-wave, which represents the last remnants of ventricular repolarization, may be seen following the T-wave (not shown).
ECG traces are analyzed using computer programs that detect the onset, offset, and amplitude of the wave forms and also track abnormal sinus waves. An experienced physician or technician verifies the information by looking at individual traces. Heart rate (HR)* is calculated based on the interval between adjacent R-wave peaks (R-R). Only normal-to-normal (NN) heart beats are included in the analyses. However, the ECG trace will also show irregular heartbeats. An ectopic rhythm is an irregular heart rhythm due to a premature heartbeat, recorded as a ventricular ectopic beat (VE) or a supraventricular ectopic beat (SE). In the MOSES study, ECG parameters were averaged over 5 minutes and/or 24 hours.
Schematic representation of an ECG curve with identification of specific waves and intervals. (“SinusRhythmLabels” created by Agateller [Anthony Atkielski], converted to svg by atom.-en:Image:Sinus-RhythmLabels.png. Licensed under public domain via Wikimedia Commons:
Heart rate variability (HRV) is the conventionally accepted term to describe the considerable long- and short-term fluctuations in heart rate that occur in normal people. A substantial body of evidence indicates that reduced HRV is associated with cardiac mortality after myocardial infarction. HRV data provide insight into the autonomic control of the heart. The most established HRV parameters, and the simplest to obtain, are in the frequency domain: for example ultra-low and very low frequency (ULF and VLF), low frequency (LF), and high frequency (HF), as well as the LF/HF ratio. These parameters are derived using standard statistical methods to quantify short- and long-term fluctuations in heart rate. ULF and VLF components occur less often than 3 per minute and are thought to be reflective of thermoregulation. LF components occur approximately 6 per minute and are related to baroreflex, a homeostatic mechanism for maintaining blood pressure. LF is generally believed to reflect a combination of sympathetic nervous system influences on the heart and baroreceptor reflex sensitivity. HF components occur at a rate equal to respiratory rate — between 9 and 24 breaths per minute. HF is generally considered a marker of parasympathetic nervous system influence on the heart. The LF/HF ratio has been proposed as an index of the balance between the regulatory influences of the sympathetic and parasympathetic nervous systems. Other HRV measures are the standard deviation of normal-to-normal sinus beat intervals (SDNN), a marker of total HRV, and the root mean square of successive differences in normal-to-normal sinus beat intervals (RMSSD), generally considered a marker of parasympathetic nervous system influence on the heart. RMSSD is typically correlated with HF.
Analyzing ECG Wave Forms
In addition to heart rate and HRV, other parameters commonly analyzed are the PR and ST segments, the QRS complex, and the QT interval. They reflect the condition of the myocardium (heart muscle). The length of the PR segment represents the time it takes for an electrical impulse to travel from the heart’s sinoatrial node, where the normal electrical impulses of the heart are initiated, to the ventricles. The QRS complex represents the time required for electrical activation of the ventricles. Both the width and the shape of the QRS complex can provide clinical insights into cardiac pathophysiology. The QT interval captures the time for both ventricular depolarization and repolarization; it represents the time between earliest ventricular depolarization and latest ventricular repolarization. Prolongation of the QT interval has been associated with an increased risk for ventricular arrhythmias in a variety of cardiac conditions. The QT interval is influenced by the heart rate; thus the QT interval corrected for heart rate (QTc) is often used to make comparisons between individuals. The ST segment starts at the end of the QRS complex and ends at the beginning of the T-wave; it coincides with the plateau of the action potential. The ST segment is important in the diagnosis of ventricular ischemia and hypoxia, because under those conditions, the ST segment can become either depressed or elevated. Elevation of the ST segment indicates early repolarization. The T-wave represents repolarization of the ventricles. T-wave amplitude, duration, and morphology can provide useful insights into cardiac pathophysiology.
* Underlined parameters were measured in the MOSES study. Parameters in bold font were primary markers.
COMMENTARY SIDEBAR 3. MARKERS OF VASCULAR FUNCTION AND SYSTEMIC INFLAMMATION.
Vascular dysfunction can be an early sign on the pathway to cardiovascular disease. An obvious marker of vascular function is blood pressure, the pressure of circulating blood on the walls of blood vessels. It is usually expressed in terms of the systolic blood pressure (SBP)*, the maximum during one heartbeat, over diastolic blood pressure (DBP), the minimum in between two heart beats. Another marker of vascular function is flow-mediated dilatation (FMD) of the brachial artery. Vascular function assessed by FMD correlates with the severity and extent of coronary atherosclerosis. This is a relatively new, noninvasive test of vascular function using ultrasound to measure arterial diameter in the forearm. A blood pressure cuff is placed on the arm and inflated; release of the cuff after 5 minutes causes the artery to widen (dilate). Parameters reported are FMD, reactive hyperemic velocity-time integral (VTI), and brachial artery diameter (BAD). VTI is a measure of microvascular function that provides additional information about cardiovascular disease risk beyond FMD. An additional marker of vascular function measured in the MOSES study was endothelin 1 (ET-1), a potent vasoconstrictor produced by vascular endothelial cells.
The investigators also measured a number of markers of systemic inflammation in blood, because chronic inflammation has been implicated in the development of atherosclerosis. They measured C-reactive protein (CRP), an acute-phase protein that has been associated with cardiovascular disease risk; interleukin-6, a pro-inflammatory cytokine; 8-isoprostane, a marker of lipid peroxidation and oxidative stress; P-selectin, an adhesion molecule that plays an essential role in the initial recruitment of white blood cells to the site of injury during inflammation; and nitrotyrosine, a marker of cell damage, inflammation, and nitric oxide production (oxidative stress).
Markers of Blood Clotting
Increased blood coagulation (blood clotting) may increase risk for a heart attack by causing thrombus (clot) formation on an atherosclerotic plaque (area of blood vessel with a thickened wall in individuals with coronary artery disease). Blood viscosity is largely determined by concentrations of fibrinogen, a factor involved in blood coagulation. Pulmonary inflammation leads to rapid increases in levels of fibrinogen, a so-called acute phase reactant, which is released into the circulation as part of the inflammatory response. Thus, fibrinogen plays a role in tissue inflammation and repair as well as blood coagulation. Coagulation, a complex process to repair injured tissue, consists of a sequence of vascular constriction, blood platelet activation and aggregation, formation of a fibrin clot, and finally clot lysis after tissue repair. There are many markers in the coagulation pathway. In the MOSES study, the investigators evaluated the development of a prothrombotic vascular state by measuring microparticle-associated tissue factor activity (MP–TFA), monocyte—platelet conjugates, and several markers of platelet activation including measurements of microparticles (MPs). Monocyte–platelet conjugates (platelets and white blood cells that stick together) are implicated in systemic inflammation and possibly cardiac inflammation. MPs originate from plasma membranes of injured or activated platelets, endothelial cells, leukocytes, and red blood cells and are considered to be prothrombotic. The MOSES investigators used several assays to determine MPs originating from various origins. They also measured von Willebrand factor (vWF), which is important in platelet adhesion to wound sites. Increased plasma levels of vWF in a large number of cardiovascular, neoplastic, and connective tissue diseases are presumed to arise from adverse changes to the endothelium, and may contribute to an increased risk of thrombosis.
Lung Function and Lung Inflammation
Lung function tests are performed using a pneumotachograph interfaced with a computer. During the test, participants are asked to blow into a tube that records air pressure and speed of air flow. Based on those data, the investigators can determine a number of parameters of lung function, including forced vital capacity (FVC), forced expiratory volume in 1 second (FEV1), FEV1/FVC ratio, and forced expiratory flow between 25% and 75% of FVC (FEF25–75). FEV1 measures how much air a person can exhale during a forced exhalation, in this case during the first second of exhaling. FVC records the total volume exhaled during the forced exhalation after a maximum possible inhalation. Decreases in these parameters are an indication of reduced lung function but can be transient. In the MOSES study, the investigators also recorded minute ventilation — a measure of the volume of air inhaled and exhaled during one minute, which reflects both rapidity of breathing and lung volume — to determine the inhaled dose of ozone; it was used to adjust the exercise workload to achieve a target value for minute ventilation.
The investigators also measured markers of lung inflammation and injury to the lung epithelium (cells lining the airways). They collected sputum (a mixture of saliva and mucus coughed up from the respiratory tract) from the participants and measured polymorphonuclear (PMN) leukocytes, a group of immune cells that includes neutrophils, eosinophils, and basophils, that are characterized by granules with enzymes that are released during infections, allergic reactions, and asthma; interleukin-6; interleukin-8; tumor necrosis factor-alpha (TNF-α); and CD40 ligand, proteins involved in inflammation. The investigators also measured markers of airway epithelial cell injury: club cell protein 16 (CC16) in blood and total protein in sputum.
* Underlined parameters were measured in the MOSES study. Parameters in bold font were primary markers.
Common Protocol
The three MOSES teams, with input from HEI staff, the HEI MOSES Oversight Committee, and the HEI Research Committee, developed a common protocol, common standard operating procedures, and a data analysis plan for the study. Each center planned to recruit and test about 30 participants for a total of 90. Participants were between 55 and 70 years old and were healthy. Prospective participants were interviewed by phone, and eligible participants were invited to a screening visit where basic health information was collected and informed consent was obtained.
A subsequent training visit served to determine whether participants could perform moderate exercise without showing cardiorespiratory problems.
Participants who were healthy nonsmokers, had normal lung function and normal electrocardiogram (ECG) results, were able to complete the exercise regimen, and were able to abstain from a specified list of medications for one week before each exposure session were included in the study. They were then invited to complete three exposure sessions (randomized at 0, 70, and 120 ppb ozone) with a minimum of two weeks between exposure sessions. Exposures lasted 3 hours, during which the participants exercised on a stationary bicycle or tread mill, alternating 15 minutes of exercise with 15 minutes of rest. Each exposure session included three visits to the clinical center: on the pre-exposure day, the exposure day, and the post-exposure day. Participants stayed in a nonsmoking hotel room the night before the exposure day to minimize variability in exposure to ambient air pollutants. Eighty-seven participants completed all test sessions.
The three investigator teams measured a large suite of endpoints before, during, and up to 22 hours after exposure, including changes in heart rate, heart rate dynamics, blood pressure, pulmonary function, and markers of endothelial function, thrombosis, lung injury, and both systemic and lung inflammation (see Commentary Figure). They prespecified a key group of cardiovascular endpoints as primary endpoints and considered all other endpoints as secondary. Most outcomes were assessed at designated central core laboratories that handled samples, electrocardiographic recordings, or ultrasound images from all three clinical centers in order to standardize the outcome assessments. Study participants were also genotyped for GSTM1 variants. All data were submitted to the Data Coordinating and Analysis Center at the New England Research Institute, where the statistical analyses were conducted. A Data Monitoring Board was set up to monitor the conduct of the study, subject safety, and the implementation of the data analysis plan.
Possible pathways by which ozone may cause adverse health effects. Pathways evaluated in MOSES are shown in boldface; the number of endpoints evaluated is shown in brackets. Adapted from Investigators’ Report, Figure 1.
METHODS
Ozone Generation and Measurement
All three centers used a silent electric arc device to generate ozone. The centers at UNC and URMC used United States Pharmacopoeia grade oxygen (at least 99.0%). The center at UCSF used 5% oxygen mixed with helium. The outdoor air supply to the chamber was filtered using Purafil, charcoal, and HEPA filters. The air exchange rates were set at 58 per hour at UCSF, 40 per hour at UNC, and 14 per hour at URMC. All three centers carefully monitored ozone concentrations, temperature, and humidity. The centers at URMC and UCSF also monitored ultrafine particles during the three exposure sessions. UNC measured ultrafine particles during quarterly quality assurance audits without participants present. The lower cut-off for particle size was different among the instruments used: 7 nm at URMC, 20 nm at UCSF, and 4 nm at UNC.
Exposure chambers were cleaned between subject exposures by wiping down surfaces and ventilating with filtered air. Because the exposure chamber at UCSF was also occasionally used for environmental tobacco smoke (ETS) exposures as part of a different study, that team followed a more elaborate cleaning procedure after an ETS exposure session. All exposed surfaces were wiped with either a terry cloth mop or cloth soaked in 70% ethanol, followed by one hour of ventilation. Subsequently, the chamber was heated overnight with a portable electric heater in the chamber set to its maximum temperature, and then ventilated for an additional two days. This protocol was implemented in November 2013.
Personal exposure to ozone and nitrogen dioxide (NO2) was measured using a personal sampler for about 72 hours preceding the pre-exposure visit. Participants were also asked to fill out an activity diary during that time. In addition, air quality and meteorological data were collected from central monitoring stations close to each of the three centers. Analyses using the personal exposure and ambient data were pending at the time this Commentary was written and will be presented in a forthcoming report (Multicenter Ozone Study in oldEr Subjects, Part 2).
Visits and Procedures
Table 2 of the Investigators’ Report provides an overview of the information collected during screening and training visits and the three exposure sessions. The screening visit included the filling out of consent forms and a home and health questionnaire, blood work, measurement of vital signs (heart rate and blood pressure), physical exam, 12-lead ECG, and measurement of lung function by spirometry. The training visit included an ECG, measurement of vital signs, and minute ventilation during rest and during two 15-minute exercise periods. Participants completed a phone questionnaire 8 or 9 days before the exposure session.
Commentary Table 2.
Overview of Procedures Performed on the Days Before, During, and After Exposurea
Procedure
Pre-Exposure Visits
Exposure Visit
Post-Exposure Visit
3 Days Before
2 Days Before
1 Day Before
Before Exposure
During Exposure
After Exposure
1 Day After
Laboratory ozone exposure
X
Personal exposure monitoring (ambient ozone and NO2)
a Three separate sessions were held in which participants were exposed to 0, 70, and 120 ppb ozone (in randomized order) for 3 hours while exercising intermittently (for a total of 9 visits).
A pre-exposure visit was scheduled on the afternoon of the day before exposure and included a physical exam, health questionnaire, measurement of vital signs, blood draw, and a brachial artery ultrasound to measure flow-mediated dilatation (FMD, a measure of endothelial function). Participants stayed overnight in a nonsmoking hotel room to reduce variability in exposure to ambient air pollutants. On the exposure day, a symptom questionnaire was filled out, and vital signs were taken before, during, and after exposure; a Holter monitor was placed to continuously measure ECG parameters; spirometry was performed to measure lung function before and after exposure; minute ventilation was measured during exposure; and a blood draw and a brachial artery ultrasound were done after exposure. Participants went home at the end of the day wearing the Holter monitor. Participants returned on the day after exposure for a physical exam, measurement of vital signs, a symptom questionnaire, a blood draw, lung function testing, and collection of a sputum sample. At predetermined times before and after exposure, the subject rested in a supine position in a dark room for 10 minutes to obtain ECG data that were used to calculate 5-minute averages. The study was conducted in a blinded fashion; that is, the participants and most study personnel were not aware of the exposure condition.* A summary of the exposure sessions is provided in Commentary Table 2.
Health Endpoints
A summary list of endpoints is provided below. A complete list of health endpoints and when they were measured can be found in Table 3 of the Investigators’ Report. Forty-one cardiovascular endpoints were measured, of which 12 markers were designated as primary markers. Please refer to Commentary Sidebars 1 and 2 for background information and abbreviations.
Commentary Table 3.
Overview of Ozone Effects in MOSES
Endpoint Category
How They Were Measured
How Many Were Measured
How Many Changed after Ozone Exposure
Indication of Ozone Effect
Cardiovascular
Heart rate
Electrocardiogram
21
None
No
Endothelial function
Flow-mediated dilatation, vital signs, blood
6
1 (ET-1 increase at 120 ppb, P = 0.008)
Yes
Systemic inflammation or oxidative stress
Blood
5
1 (nitrotyrosine decrease at 120 ppb, P = 0.016)
No
Prothrombotic status
Blood
9
None
No
Summary: Two of 41 cardiovascular endpoints changed after ozone exposure at 120 ppb; one change was in the opposite direction of what was expected. None of the primary endpoints changed. No convincing evidence of cardiovascular effects at 70 or 120 ppb.
Respiratory
Lung function
Spirometry
4
2 (exercise-induced increases in FEV1 and FVC at 0 ppb, which were attenuated at 70 and 120 ppb)
Yes
Lung injury or inflammation
Blood, sputum
8
2 (CC16 increase at 120 ppb, P < 0.001, and leukocyte increase at 120 ppb, P = 0.003)
Yes
Summary: Four of 12 respiratory endpoints showed an effect in the expected direction. Results indicate adverse effects of ozone on lung function at 70 and 120 ppb, and on lung injury and inflammation at 120 ppb.
CC16 = club cell protein 16; ET-1 = endothelin-1; FEV1 = forced expiratory volume in 1 second; FVC = forced vital capacity.
Electrocardiographic activity measured continuously for 24 hours with a Holter monitor: arrhythmia, heart rate (HR), heart rate variability (HRV) (primary markers: 5-min averages of high frequency [HF] and low frequency [LF] and 24-hr average of root mean square of successive differences in normal-to-normal sinus beat intervals [RMSSD]), repolarization (primary markers: 5-min and 24-hr average of T-wave amplitude), and ST segment (primary markers: 5-min and 24-hr average of ST in V5).
Markers of vascular function: blood pressure (primary marker: systolic blood pressure [SBP]), flow-mediated dilatation (FMD) of the brachial artery (primary marker), and the blood marker endothelin-1 (ET-1).
Markers of inflammation and oxidative stress in blood: C-reactive protein (primary marker), interleukin-6, 8-isoprostane, P-selectin, and nitrotyrosine.
Markers of prothrombotic changes (primary markers: microparticle-associated tissue factor activity [MP-TFA] and monocyte–platelet conjugate count).
In addition, 12 respiratory endpoints were included. All respiratory markers were designated as secondary markers.
Pulmonary function measured by spirometry: forced vital capacity (FVC), forced expiratory flow between 25% and 75% of FVC (FEF25–75), forced expiratory volume in 1 second (FEV1), and FEV1/FVC ratio.
Markers of airway epithelial cell injury: club cell protein 16 (CC16) in blood and total protein in sputum.
Markers of lung inflammation in sputum: polymorphonuclear leukocytes (PMN, also referred to as neutrophils), interleukin-6, interleukin-8, TNF-α, and CD40 ligand.
The investigators also assessed respiratory and other symptoms by questionnaire, and measured minute ventilation (by a mouthpiece pneumotachograph) during the exposure to ensure that the target values were achieved. Vitals signs (heart rate and blood pressure) were measured before, during, and after exposure. The vital sign blood pressure data were analyzed as a primary endpoint. Vital sign heart rate was not used in the data analyses; instead the investigators used heart rate determined from the ECG.
All ECG data were analyzed centrally at the URMC core laboratory. All brachial artery ultrasounds were performed at each site by qualified and trained personnel, and the images were analyzed at the UCSF core laboratory. Blood samples were collected from the arm not used for blood pressure or ultrasound measurements and shipped to a commercial laboratory for analysis of soluble markers. Measurement of platelet activation and circulating microparticles was conducted at each clinical center since it requires fresh blood; the data were analyzed at the URMC core laboratory.
Pulmonary function was measured using spirometry at each clinical center following a common protocol. Sputum was collected only once, at 22 hours after exposure, and processed at each center. Markers of pulmonary inflammation in sputum cells and supernatant were analyzed at the UNC core laboratory.
Statistical Analyses
A statistical analysis plan was developed with input from investigators at the three clinical centers and the HEI MOSES Oversight Committee. Because of lack of data on inter- and intra-individual variability of key primary endpoints for this population of subjects, a preliminary power calculation was done before the study started (in 2011) to determine the power of a study with 90 versus 54 participants to detect small changes in health outcomes, focusing on FMD, two ECG measures, and one prothrombotic marker, using data from the literature. The power calculation was repeated with the nine primary outcomes when data for 27 participants became available (in 2014).
All statistical analyses were done at the New England Research Institute according to a data analysis plan approved by the HEI Research Committee. First, data were assessed for outliers and verified at the source if they looked suspicious. Results were then calculated as the difference between pre-exposure and post-exposure values and assessed for normality. For outcomes that were not normally distributed, a natural log transformation was performed. Effects of ozone exposure on primary and secondary health outcomes were analyzed using mixed-effects linear models accounting for repeated measures (at multiple time points) at the three clinical centers. The investigators tested three interaction models: ozone by sex, by age, or by GSTM1 status. The statistical significance threshold was set at P < 0.01 to reduce concerns for multiple comparisons.
The investigators measured each participant’s exposure to ozone and NO2 using a personal sampler for 72 hours before the pre-exposure visit. They also collected air quality data for ozone, fine PM, NO2, sulfur dioxide, and carbon monoxide from central monitors close to each clinical center. A forthcoming report (Multicenter Ozone Study in oldEr Subjects, Part 2) will describe analyses that include the pre-exposure pollutant data, as well as several sets of sensitivity analyses conducted by the investigators.
To ensure participant safety and data quality, the MOSES study included a Data Monitoring Board, a data management plan, and strict quality assurance/quality control procedures with external auditors. The three clinical centers and the Data Coordinating and Analysis Center obtained appropriate approvals from their respective Institutional Review Boards.
SUMMARY OF RESULTS
The three centers successfully recruited and tested 87 participants (ages 55–70 years) who completed all exposure visits between July 2012 and April 2015. Sixty percent of participants were women, 88 percent were white, and 57 percent were lacking the GSTM1 gene. In 20 subjects, 39 mild-to-moderate adverse events were recorded, mostly headache attributed to caffeine withdrawal. Some participants reported nasal congestion or fatigue. None of these symptoms were found to be related to ozone exposure. None of the participants withdrew from the study because of adverse events related to ozone exposure.
Target ozone concentrations were met at all three clinical centers. Ultrafine particle counts in the exposure chamber were higher at UNC than the other centers, but it should be noted that the instrument at UNC counted particles as small as 4 nm compared with 7 nm at URMC and 20 nm at UCSF, and would therefore be expected to yield higher counts. Minute ventilation during ozone exposure was within the target range and was slightly lower (16.0 L/min/m2) than during filtered air exposures (16.6 L/min/m2).
Analyses of the primary cardiovascular endpoints found no statistically significant changes following ozone exposure at 70 or 120 ppb on autonomic nervous system function, cardiac electrical repolarization, or cardiac arrhythmia. In addition, ozone exposure did not lead to statistically significant changes in oxidative stress or in markers of systemic inflammation, vascular function, or prothrombotic status. The only changes associated with ozone exposure seen in cardiovascular endpoints were an increase in the secondary endpoint plasma endothelin-1 (a marker of vascular function) and a decrease in nitrotyrosine (a marker of oxidative stress) after exposure to 120 ppb, but not 70 ppb, ozone.
On the other hand, the MOSES study confirmed in these older healthy subjects that ozone has effects on the respiratory system even at these near ambient concentrations. Moderate exercise during clean air exposure (0 ppb) led to increased FVC and FEV1 15 minutes after exposure compared with pre-exposure values, and they remained statistically significantly higher after 22 hours. These improvements in lung function were attenuated after ozone exposure at 70 and 120 ppb. In addition, ozone exposure in a dose–response manner at 120 ppb significantly increased the percentage of PMN leukocytes (a marker of lung inflammation) in sputum as well as of CC16 (a marker of airway epithelial cell injury) in blood 22 hours later, compared with 0 ppb. In contrast, changes in sputum concentrations of the inflammatory markers interleukin-6, interleukin-8, and TNF-α were not statistically significant. There was no evidence of statistically significant interactions between sex, age, or GSTM1 status and the observed changes in lung function, sputum leukocytes, or plasma CC16 after ozone exposure.
There were some differences among centers in average personal exposures to ozone and NO2 of participants during the three days before the exposure visits. Specifically, average personal exposures to ozone and NO2 were lower at UNC than at UCSF or URMC. There were also some differences in ambient concentrations of air pollutants measured at central air quality monitors. For example, ambient NO2 and carbon monoxide levels (measured at central monitoring sites and averaged over the entire study period) were higher at UCSF than at the other two centers. Whether these differences in ambient and personal exposures may have affected the results reported here is under further investigation and will be featured in a forthcoming report (Multicenter Ozone Study in oldEr Subjects, Part 2).
EVALUATION BY THE HEI MOSES REVIEW PANEL
In its independent review of the study, the HEI MOSES Review Panel commended the investigators for a well-designed and executed study conducted at three centers, using a standardized protocol and standard operating procedures. A key strength of the study was the crossover design with controlled exposures at three concentrations (0, 70, and 120 ppb) with the participants and most study personnel unaware of the exposure condition. The Panel also noted that the number of participants in the MOSES study was considerably larger than in previous human exposure studies conducted to date and thought the study had sufficient statistical power to detect meaningful changes in the primary outcomes.
The study efficiently collected information on a comprehensive array of cardiovascular endpoints, probing a variety of potential mechanistic or pathophysiological pathways, as well as several respiratory endpoints.
The Panel agreed with the investigators’ conclusions that 3-hour ozone exposure at 70 or 120 ppb did not lead to statistically significant changes in cardiovascular endpoints in this healthy group of older participants undergoing moderate exercise. Changes were observed in only two of the many cardiovascular endpoints: an increase in endothelin-1 and a decrease in nitrotyrosine following 3-hour exposure to 120 ppb ozone. Neither of these endpoints was prespecified as a primary outcome. The nitrotyrosine changes were in the opposite direction of what would be hypothesized to be on the pathway to an ozone effect and remain unexplained; there were no changes in markers of systemic inflammation. These results lend confidence to the negative cardiovascular results.
The Panel also agreed with the investigators’ conclusions that exposure to ozone led to measurable changes in lung function (at 70 and 120 ppb); observed changes in two markers in the blood (CC16) and lung (leukocytes) at 120 ppb were consistent with ozone-induced injury to the airway epithelium followed by airway inflammation. These results support the conclusion that decrements in lung function can be observed at ozone concentrations resembling the current U.S. 8-hour NAAQS of 70 ppb, even though cardiovascular effects were not evident in this study.
An overview of the main findings is presented in Commentary Table 3. Below, we discuss strengths and limitations of different aspects of the study.
Strengths of the Study
As described in a recent review (National Academies 2017), controlled human-inhalation exposure studies have a unique role in providing evidence of adverse effects of air pollutants. The National Academy of Sciences committee concluded “that controlled human-inhalation exposure studies have provided unique information that cannot be obtained from animal inhalation studies or from studies of people engaged in their normal daily activities (that is, through epidemiologic studies).” The MOSES report adds important evidence of health effects at relatively low concentrations to the already quite extensive literature of ozone effects in humans.
The Review Panel noted that this was a well-planned and executed study. The three teams of investigators developed a strong collaboration and adhered consistently to the common protocol that was agreed upon at the start. The crossover study design, with controlled exposures to clean air and two ozone concentrations at environmentally relevant levels, was an excellent approach to the study questions. The study was more or less modeled after a clinical trial with primary and secondary outcomes. Because the number of participants was larger than in other human exposure studies, the Panel agreed that it had provided adequate power for testing the primary outcomes, although power was likely less adequate for detecting interactions. The statistical analyses were well designed and executed.
Ozone generation and exposure atmosphere measurements were appropriate, and the choice of 70 ppb (the current NAAQS) and 120 ppb ozone was well justified. The investigators selected a comprehensive array of cardiovascular endpoints useful for assessing a variety of potential mechanistic pathways. That so many mechanistic hypotheses were evaluated in a single study is viewed as a key strength of the study. Selecting a common data center and using core laboratories to analyze samples centrally contributed to the quality of the study. Using experienced groups to analyze and interpret results of ECG and brachial artery ultrasound measurements is also recognized as another strength of the study.
To measure pulmonary function, the investigators used standardized protocols following well-accepted standard operating procedures. The increase in lung function observed in response to exercise with clean air has been observed before (e.g., Gong et al.1997) although other studies have not found such an effect (e.g., Arjomandi et al. 2015). The Panel agreed with the authors that this was most likely an exercise-related effect, possibly also due to diurnal variation. The study confirms pulmonary effects of exposure to 70 ppb ozone and a well-documented increase of PMN leukocytes in sputum after exposure.
Ozone Exposure Conditions
The ozone generation, calibration, and monitoring procedures used at the three centers were sufficient to achieve and maintain the targeted exposure conditions. Importantly, none of the teams used air as the feed gas for the ozone generator, which would have resulted in generation of NOx. At each site, the filtration of outdoor supply air — to mix with the generated ozone in the chambers — was adequate. The air exchange rates at all three chambers were relatively high. As a consequence, the subjects were exposed primarily to freshly generated ozone and only minimally to products of ozone-initiated chemical byproducts. With participants present in the chamber, ozone may react with squalene and unsaturated fatty acids present in skin oil or terpenoids present in personal care products (Wisthaler and Weschler 2010). However, the high exchange rates would have removed any gas-phase compounds that may have been formed.
The use of an exposure alarm, configured to warn the operator if concentration deviated by ±5% or to shut down the ozone generator if the concentration exceeded 10% of the target concentration, was a good practice. Ultrafine particle concentrations in the chambers were typically less than 500 particles/cm3. The low particle number concentrations are further evidence of minimal exposure to products of ozone-initiated chemistry. This did not seem to be the case. Similarly, NOx concentrations were very low, confirming minimal NOx production by the arc generator.
The chamber-cleaning procedure adopted by UCSF when switching from ETS exposures to ozone exposures appeared to be adequate to remove ozone reactive compounds, derived from ETS, from the chamber walls. Additionally, the high rate at which this chamber was ventilated (58 exchanges per hour, at high temperature) during the cleaning procedure translated to very little buildup of reaction products in the chamber air even if ozone reactions with surface contaminants did produce gas-phase products. Therefore, the shared use of this chamber for both ETS exposures and ozone exposures is unlikely to have affected the outcomes of the ozone exposure experiments.
Prior Exposure to Ambient Air Pollutants
The study included a one-night hotel stay before the exposure session to minimize variation in exposure to ambient air pollutants for an individual over time and across individuals. The investigators stated that a longer stay would have been preferable but would be inconvenient to participants and too costly. While sympathetic to these concerns, the Review Panel noted that a one-night hotel stay may not have sufficiently eliminated the effects of daily exposure to background concentrations of ozone and other pollutants, because acute effects of air pollution have been shown to occur with a lag time of up to three days (Schwartz 2000). Thus, the forthcoming analyses to evaluate participants’ exposure during the three days leading up to the exposures are important.
It should be noted that exposures were — by design — to primary ozone, without reaction products, as discussed above. In the real world, exposures to ozone occur in the presence of particles and gases and their chemical reaction products. Further research is needed to know whether interaction with other air pollutants might lead to enhanced effects that were not evident with exposure to primary ozone. A number of human exposure studies have evaluated coexposures to ozone and PM and have found mixed results. For example, Fakhri and colleagues (2009) reported heart rate variability changes after exposure to PM or to ozone, but not after a combination of PM and ozone. On the other hand, that study found a change in blood pressure after exposure to a combination of PM and ozone, but not after exposure to either PM or ozone alone. Other studies have reported changes in heart rate variability (Power et al. 2008), cardiac repolarization (Sivagangabalan et al. 2011), blood pressure (Urch et al. 2005), or vasoconstriction (Brook et al. 2002) following exposure to a combination of PM and ozone, compared with filtered air exposures in human volunteers.
Susceptible Populations
By design, participants were selected to have a normal body mass index and FEV1; were able to perform moderate, intermittent exercise for three hours; and were excluded if they were unable to stop taking specified medications before and during the exposure sessions. While it is understandable that these criteria were employed to address safety and ethical considerations, it is possible that these inclusion and exclusion requirements pushed the age of participants to the lower end of the range for which the study was aiming (the mean age was approximately 60 years). The investigators acknowledged that an important limitation of the study was that the participants were very healthy for their age group (and were also predominantly white). As a result, they represented a rather small segment of the general middle-age or older population. Although the study did not find evidence for cardiovascular effects of short-term ozone exposure in this group, it does not shed light on whether low levels of ozone exposure are a cardiovascular health risk for less healthy seniors, which is an open research question. The emerging epidemiological evidence finding associations of cardiovascular effects with exposure to ozone may reflect susceptible members of the population who are unable to participate in clinical studies. The Review Panel agreed with the investigators that performing controlled-exposure studies in potentially susceptible individuals may entail unacceptable risk and noted that the participant selection criteria for MOSES were appropriate.
Because there was considerable variability in outcome values among participants, the Review Panel asked the investigators to conduct additional analyses to evaluate whether there may have been a subgroup that showed much larger changes in lung function or in sputum neutrophils after ozone exposure than the group on average. If such “responders to ozone exposure” existed, it would be worthwhile to explore whether this subgroup might show effects on the cardiovascular system that were not evident in the group as a whole. In response to the Panel’s request, the investigators performed the suggested additional analyses and reported that detailed additional statistical analyses did not find evidence for such a high-responder subgroup for cardiovascular effects.
Statistical Analyses and Study Power
In this study, more than 50 outcomes were analyzed, with repeated measurements per participant for each of the three exposure concentrations, and multiple endpoints derived that were closely related (e.g., a number of heart rate variability measures derived from the ECG waveforms). Thus, a large number of endpoints were analyzed, which raises concerns about potential false positive associations due to the high number of statistical tests performed — that is, the possibility of finding a statistically significant change in a few endpoints due to chance alone. The Review Panel noted that a Bonferroni approach to correct for multiple comparisons (wherein the critical P value [α] is divided by the number of comparisons being made) could have been performed for the 13 primary endpoints, but this approach is recognized as being too conservative. Instead of using a Bonferroni correction, the investigators chose a different approach: to set α at a level of P < 0.01 instead of the usual P < 0.05. This approach also reduces the possibility of finding statistically significant effects that may have occurred by chance.
To strengthen the interpretation of results, the investigators were looking for concordance in the cardiovascular outcomes to indicate that similar effects were happening in multiple measures of cardiovascular function. However, there were only two statistically significant cardiovascular findings (for the secondary endpoints endothelin-1 and nitrotyrosine), and one of them (nitrotyrosine, which was marginally significant) was in the opposite direction of what was expected. The fact that there were concordant findings for respiratory outcomes, and that those effects were larger at 120 ppb than at 70 ppb ozone, strengthens the overall conclusion that there were respiratory, but no cardiovascular, effects observed in this group of participants.
The investigators found some statistically significant differences in cardiovascular parameters when comparing males versus females and among the three clinical centers, but these differences were not related to ozone concentrations. Sex differences in levels of certain biomarkers are known to occur. The center differences were not consistent across the cardiovascular endpoints for which such differences were found and were thus not considered to be a concern. The fact that center differences were seen, however, provides confidence that it was possible to see small differences in cardiovascular outcomes in the study population, and thus strengthens the observation that no cardiovascular effects were seen after short-term exposure to ozone.
Health Endpoints Included in the Study
The Review Panel noted that the investigators evaluated a large set of markers of cardiovascular and respiratory physiology, informing a number of potential mechanistic pathways that have been implicated in the effects of air pollutants on the human body. It is always possible to argue about the choice of markers and whether a specific marker was not covered in the study. For example, 8-isoprostane was selected as the only marker of lipid peroxidation, whereas there are several other possible choices to measure the lipid peroxidation pathway. However, science is rapidly evolving, and new markers are constantly emerging that were not measured previously. The Review Panel thought that the set of markers evaluated in the MOSES study was appropriate.
The pulmonary changes observed with ozone exposure in the current study confirm and expand earlier findings in human exposure studies. Specifically, previous studies have shown changes in pulmonary function and neutrophils after short-term (4 to 6.5 hours) exposure to 60 to 220 ppb ozone (Alexis et al. 2010; Balmes et al. 1996; Kim et al. 2011; Torres et al. 1997). The fact that the current study did not find cardiovascular effects of short-term ozone exposure is in contrast with some earlier studies in volunteers that reported changes in heart rate variability and a range of inflammatory and vascular biomarkers after exposure to higher levels of 114 to 300 ppb ozone for 2 hours (Devlin et al. 2012; Fakhri et al. 2009); however, some other studies also failed to detect effects on blood pressure after exposure to 114 to 300 ppb ozone for 2 or 3 hours (Fakhri et al. 2009; Gong et al. 1998, Ramanathan et al. 2016, Sivagangabalan et al. 2011). The reasons for differences in these findings are not clear. However, the Panel agreed with the MOSES team that a 3-hour exposure to ozone did not lead to cardiovascular effects at 70 or 120 ppb in healthy older volunteers in the current study.
The recent National Academy of Sciences review of the evidence provided by human controlled-exposure studies conducted by the U.S. EPA concluded that those studies involving short-term exposures to ozone (O3) “have contributed to clarification of exposure–response relationships and have been of critical importance for the NAAQS. … Those studies have provided … a basis for U.S. EPA’s decision to move from a 1-hour to an 8-hour averaging time for the O3 NAAQS level (concentration), and demonstrations of the importance of considering susceptibility factors and variability among individuals in human physiologic responses (such as changes in lung function) and biologic responses (such as increases in biomarkers of pulmonary inflammation) to exposure to ozone and other oxidant pollutants” (National Academies 2017). The MOSES study has now provided additional important information about respiratory and cardiovascular effects at near-ambient concentrations that contributes to the scientific knowledge base.
CONCLUSION
The Multicenter Ozone Study in oldEr Subjects was a large, well-conducted study in 87 healthy adults (55–70 years old) that showed the following important results: (1) there was no convincing evidence that a 3-hour exposure to near ambient concentrations of 70 or 120 ppb ozone with moderate exercise resulted in statistically significant changes in cardiovascular endpoints in these healthy older adults; (2) short-term exposures at these relatively low ozone concentrations did lead to moderate pulmonary effects, consistent with previous studies, which were conducted primarily in younger adults; and (3) no “responder” subgroup could be identified in which ozone elicited cardiovascular effects that were not evident in the group as a whole.
The MOSES Review Panel agreed with the main findings of the study and commended the investigator teams for the high quality of the data and analyses. The study provides convincing evidence of a lack of cardiovascular effects following short-term exposure to ozone at these levels, in this healthy group of older participants. Several limitations of the study should also be noted. Specifically, the study was conducted — by design — in very healthy older adults (average age about 60), which represent a small segment of the general population. Additionally, the study was limited — also by design — to acute exposures to primary ozone without reaction products and without coexposure to other pollutants common in ambient air. Therefore, the observed lack of cardiovascular effects may not be generalizable to the general adult population, which includes people who are less healthy and who are exposed to multiple pollutants.
The respiratory effects observed after ozone exposure support the conclusion that such effects can be seen in the general population at the current NAAQS of 70 ppb ozone, even in the absence of cardiovascular effects.
ACKNOWLEDGMENTS
The HEI Review Committee thanks the MOSES Review Panel and external reviewer Dr. Charles Wechsler for their help in evaluating the scientific merit of the Investigators’ Report. The Committee is also grateful to the MOSES Oversight Committee for their input during the study-design phase, to Maria Costantini and the HEI Research Committee for their oversight of the study, to the MOSES Data Monitoring Board for their role in ensuring data quality and participant safety, to Annemoon van Erp for her assistance in preparing its Commentary, to Carol Moyer and Hilary Selby Polk for science editing of the Investigators’ Report and Commentary, and to Hope Green, Fred Howe, and Ruth Shaw for their roles in publishing this Research Report.
Footnotes
* A list of abbreviations and other terms appears at the end of this volume.
* At one center the clinical coordinator was aware of the exposure condition. At the other two centers the study was fully double-blind.
REFERENCES
Adams WC.
2006.
Comparison of chamber 6.6-h exposures to 0.04–0.08 ppm ozone via square-wave and triangular profiles on pulmonary responses. Inhal Toxicol
18(2):127–136. [DOI] [PubMed] [Google Scholar]
Alexis NE, Lay JC, Hazucha M, Harris B, Hernandez ML, Bromberg PA, et al.
2010.
Low-level ozone exposure induces airways inflammation and modifies cell surface phenotypes in healthy humans. Inhal Toxicol
22:593–600. [DOI] [PMC free article] [PubMed] [Google Scholar]
Arjomandi M, Wong H, Donde A, Frelinger J, Dalton S, Ching W, et al.
2015.
Exposure to medium and high ambient levels of ozone causes adverse systemic inflammatory and cardiac autonomic effects. Am J Physiol Heart Circ Physiol
308:H1499–1509. [DOI] [PMC free article] [PubMed] [Google Scholar]
Atkinson RW, Butland BK, Dimitroulopoulou C, Heal MR, Stedman JR, Carslaw N, et al.
2016.
Long-term exposure to ambient ozone and mortality: a quantitative systematic review and meta-analysis of evidence from cohort studies. BMJ Open
6(2):e009493; doi:10.1136/bmjopen-2015-009493 [Online 23 February 2016]. [DOI] [PMC free article] [PubMed] [Google Scholar]
Balmes JR, Chen LL, Scannell C, Tager I, Christian D, Hearne PQ, et al.
1996.
Ozone-induced decrements in FEV1 and FVC do not correlate with measures of inflammation. Am J Respir Crit Care Med
153(3):904–909. [DOI] [PubMed] [Google Scholar]
Bero Bedada G, Raza A, Forsberg B, Lind T, Ljungman P, Pershagen G, et al.
2016.
Short-term exposure to ozone and mortality in subjects with and without previous cardiovascular disease. Epidemiology
27(5):663–669. [DOI] [PubMed] [Google Scholar]
Bromberg PA.
2016.
Mechanisms of the acute effects of inhaled ozone in humans. Biochim Biophys Acta.
1860(12):2771–2781; doi:10.1016/j.bbagen.2016.07.015 [Online 21 July 2016]. [DOI] [PubMed] [Google Scholar]
Brook RD, Brook JR, Urch B, Vincent R, Rajagopalan S, Silverman F.
2002.
Inhalation of fine particulate air pollution and ozone causes acute arterial vasoconstriction in healthy adults. Circulation
105(13):1534–1536. [DOI] [PubMed] [Google Scholar]
Buteau S, Goldberg MS.
2016.
A structured review of panel studies used to investigate associations between ambient air pollution and heart rate variability. Environ Res
148:207–247; doi:10.1016/j.envres.2016.03.013 [Online 14 April 2016]. [DOI] [PubMed] [Google Scholar]
Cakmak S, Hebbern C, Vanos J, Crouse DL, Burnett R.
2016.
Ozone exposure and cardiovascular-related mortality in the Canadian Census Health and Environment Cohort (CAN-CHEC) by spatial synoptic classification zone. Environ Pollut
214:589–599; doi:10.1016/j.envpol .2016.04.067 [Online 29 April 2016]. [DOI] [PubMed] [Google Scholar]
Chang HH, Zhou J, Fuentes M.
2010.
Impact of climate change on ambient ozone level and mortality in southeastern United States. Int J Environ Res Public Health
7(7):2866–2880; doi:10.3390/ijerph7072866 [Online 14 July 2010]. [DOI] [PMC free article] [PubMed] [Google Scholar]
Chen C, Arjomandi M, Balmes J, Tager I, Holland N.
2007.
Effects of chronic and acute ozone exposure on lipid peroxidation and antioxidant capacity in healthy young adults. Environ Health Perspect
115(12):1732–1737. [DOI] [PMC free article] [PubMed] [Google Scholar]
Chuang GC, Yang Z, Westbrook DG, Pompilius M, Ballinger CA, White CR, et al.
2009.
Pulmonary ozone exposure induces vascular dysfunction, mitochondrial damage, and atherogenesis. Am J Physiol Lung Cell Mol Physiol
297(2):L209–216; doi:10.1152/ajplung.00102.2009 [Online 24 April 2009]. [DOI] [PMC free article] [PubMed] [Google Scholar]
Chuang KJ, Yan YH, Chiu SY, Cheng TJ.
2011.
Long-term air pollution exposure and risk factors for cardiovascular diseases among the elderly in Taiwan. Occup Environ Med
68(1):64–68; doi:10.1136/oem.2009.052704 [Online 10 September 2010]. [DOI] [PubMed] [Google Scholar]
Cohen AJ, Brauer M, Burnett R, Anderson HR, Frostad J, Estep K, et al.
Estimates and 25-year trends of the global burden of disease attributable to ambient air pollution: an analysis of data from the Global Burden of Diseases Study 2015. Lancet
389 (10082):1907–1918. doi:10.1016/S0140-6736(17)30505-6 [Online 10 April 2017]. [DOI] [PMC free article] [PubMed] [Google Scholar]
Coogan PF, White LF, Yu J, Brook RD, Burnett RT, Marshall JD, et al.
2017.
Long-term exposure to NO2 and ozone and hypertension incidence in the Black Women’s Health Study. Am J Hypertens
30(4):367–372; doi:10.1093/ajh/hpw168 [Online 1 April 2017]. [DOI] [PMC free article] [PubMed] [Google Scholar]
Devlin RB, Duncan KE, Jardim M, Schmitt MT, Rappold AG, Diaz-Sanchez D.
2012.
Controlled exposure of healthy young volunteers to ozone causes cardiovascular effects. Circulation
126:104–111; doi:10.1161/CIRCULATION AHA.112.094359 [Online 25 June 2012] [DOI] [PubMed] [Google Scholar]
Drechsler-Parks DM.
1995.
The dose–response relationship in older men exposed to ozone. Exp Gerontol
30(1):65–75. [DOI] [PubMed] [Google Scholar]
Fakhri AA, Ilic LM, Wellenius GA, Urch B, Silverman F, Gold DR, et al.
2009.
Autonomic effects of controlled fine particulate exposure in young healthy adults: effect modification by ozone. Environ Health Perspect
117(8):1287-1292; doi:10.1289/ehp.0900541 [Online 24 April 2009]. [DOI] [PMC free article] [PubMed] [Google Scholar]
Fann N, Nolte CG, Dolwick P, Spero TL, Brown AC, Phillips S, et al.
2015.
The geographic distribution and economic value of climate change-related ozone health impacts in the United States in 2030. J Air Waste Manag Assoc
65(5):570–580; doi:10.1080/10962247.2014.996270 [Online May 2015]. [DOI] [PubMed] [Google Scholar]
Fanucchi MV, Plopper CG, Evans MJ, Hyde DM, Van Winkle LS, Gershwin LJ, et al.
2006.
Cyclic exposure to ozone alters distal airway development in infant rhesus monkeys. Am J Physiol Lung Cell Mol Physiol
291(4): L644-L650. [DOI] [PubMed] [Google Scholar]
Forbes LJ, Patel MD, Rudnicka AR, Cook DG, Bush T, Stedman JR, et al.
2009.
Chronic exposure to outdoor air pollution and markers of systemic inflammation. Epidemiology
20(2):245–253; doi:10.1097/EDE.0b013e318190ea3f [Online March 2009]. [DOI] [PubMed] [Google Scholar]
Gong H, Jr, Shamoo DA, Anderson KR, Linn WS.
1997.
Responses of older men with and without chronic obstructive pulmonary disease to prolonged ozone exposure. Arch Environ Health
52:18–25. [DOI] [PubMed] [Google Scholar]
Gong H, Jr, Wong R, Sarma RJ, Linn WS, Sullivan ED, Shamoo DA, et al.
1998.
Cardiovascular effects of ozone exposure in human volunteers. Am J Respir Crit Care Med
158(2):538–546. [DOI] [PubMed] [Google Scholar]
Health Effects Institute. 2017.
State of Global Air. Available: www.stateofglobalair.org [accessed May 26, 2017].
Ito K, De Leon SF, Lippmann M.
2005.
Associations between ozone and daily mortality: analysis and meta-analysis. Epidemiology
16(4):446–457. [DOI] [PubMed] [Google Scholar]
Jerrett M, Brook R, White LF, Burnett RT, Yu J, Su J, et al.
2017.
Ambient ozone and incident diabetes: a prospective analysis in a large cohort of African American women. Environ Int
102:42–47; doi:10.1016/j.envint.2016.12.011 [Online 30 January 2017]. [DOI] [PMC free article] [PubMed] [Google Scholar]
Karlsson PE, Klingberg J, Engardt M, Andersson C, Langner J, Karlsson GP, et al.
Past, present and future concentrations of ground-level ozone and potential impacts on ecosystems and human health in northern Europe. Sci Total Environ
576:22–35; doi:10.1016/j.scitotenv.2016.10.061 [Online 22 October 2016]. [DOI] [PubMed] [Google Scholar]
Kim CS, Alexis NE, Rappold AG, Kehrl H, Hazucha MJ, Lay JC, et al.
2011.
Lung function and inflammatory responses in healthy young adults exposed to 0.06 ppm ozone for 6.6 hours. Am J Respir Crit Care Med
183(9):1215–1221; doi:10.1164/rccm.201011-1813OC [Online 7 January 2011]. [DOI] [PMC free article] [PubMed] [Google Scholar]
Kodavanti UP, Thomas R, Ledbetter AD, Schladweiler MC, Shannahan JH, Wallenborn JG, et al.
2011.
Vascular and cardiac impairments in rats inhaling ozone and diesel exhaust particles. Environ Health Perspect
119(3):312–318; doi:10.1289/ehp.1002386 [Online 27 October 2010]. [DOI] [PMC free article] [PubMed] [Google Scholar]
Metzger KB, Tolbert PE, Klein M, Peel JL, Flanders WD, Todd K, et al.
2004.
Ambient air pollution and cardiovascular emergency department visits. Epidemiology
15(1): 46–56. [DOI] [PubMed] [Google Scholar]
Miller DB, Ghio AJ, Karoly ED, Bell LN, Snow SJ, Madden MC, et al.
2016.
Ozone exposure increases circulating stress hormones and lipid metabolites in humans. Am J Respir Crit Care Med
193:1382–1391; doi: 10.1164/rccm. 201508-1599OC [Online 15 June 2016]. [DOI] [PMC free article] [PubMed] [Google Scholar]
National Academies of Sciences, Engineering and Medicine. 2017.
Controlled Human Inhalation-Exposure Studies at EPA. Washington, DC:The National Academies Press;
doi:10.17226/24618. [PubMed] [Google Scholar]
Peden DB, Boehlecke B, Horstman D, Devlin R.
1997.
Prolonged acute exposure to 0.16 ppm ozone induces eosinophilic airway inflammation in asthmatic subjects with allergies. J Allergy Clin Immunol
100(6 Pt 1):802–808. [DOI] [PubMed] [Google Scholar]
Peel JL, Metzger KB, Klein M, Flanders WD, Mulholland JA, Tolbert PE.
2007.
Ambient air pollution and cardiovascular emergency department visits in potentially sensitive groups. Am J Epidemiol
165(6):625–633
[Online 28 December 2006]. [DOI] [PubMed] [Google Scholar]
Peng RD, Samoli E, Pham L, Dominici F, Touloumi G, Ramsay T, et al.
2013.
Acute effects of ambient ozone on mortality in Europe and North America: results from the APHENA study. Air Qual Atmos Health
6(2):445–453. [DOI] [PMC free article] [PubMed] [Google Scholar]
Power KL, Balmes J, Solomon C.
2008.
Controlled exposure to combined particles and ozone decreases heart rate variability. J Occup Environ Med
50(11):1253–1260; doi: 10.1097/JOM.0b013e3181814239. [DOI] [PubMed] [Google Scholar]
Pryor WA.
1992.
How far does ozone penetrate into the pulmonary air/tissue boundary before it reacts?
Free Radic Biol Med
12(1):83–88. [DOI] [PubMed] [Google Scholar]
Ramanathan G, Yin F, Speck M, Tseng CH, Brook JR, Silverman F, et al.
2016.
Effects of urban fine particulate matter and ozone on HDL functionality. Part Fibre Toxicol
13(1): 26; doi:10.1186/s12989-016-0139-3 [Online 24 May 2016]. [DOI] [PMC free article] [PubMed] [Google Scholar]
Schwartz J.
2000.
The distributed lag between air pollution and daily deaths. Epidemiology
11(3):320–326. [DOI] [PubMed] [Google Scholar]
Schelegle ES, Morales CA, Walby WF, Marion S, Allen RP.
2009.
6.6-hour inhalation of ozone concentrations from 60 to 87 parts per billion in healthy humans. Am J Respir Crit Care Med
180(3):265–272; doi:10.1164/rccm.200809-1484OC [Online 15 May 2009]. [DOI] [PubMed] [Google Scholar]
Sivagangabalan G, Spears D, Masse S, Urch B, Brook RD, Silverman F, et al.
2011.
The effect of air pollution on spatial dispersion of myocardial repolarization in healthy human volunteers. J Am Coll Cardiol
57(2):198–206; doi:10.1016/j.jacc.2010.08.625 [Online 11 January 2011]. [DOI] [PubMed] [Google Scholar]
Thurston GD, Kipen H, Annesi-Maesano I, Balmes J, Brook RD, Cromar K, et al.
2017.
A joint ERS/ATS policy statement: what constitutes an adverse health effect of air pollution? An analytical framework. Eur Respir J
49(1): 1600419; doi:10.1183/13993003.00419-2016 [Online 11 January 2017]. [DOI] [PMC free article] [PubMed] [Google Scholar]
Torres A, Utell MJ, Morow PE, Voter KZ, Whitin JC, Cox C, et al.
1997.
Airway inflammation in smokers and non-smokers with varying responsiveness to ozone. Am J Respir Crit Care Med
156(3 Pt 1):728–736. [DOI] [PubMed] [Google Scholar]
Turner MC, Jerrett M, Pope CA, 3rd, Krewski D, Gapstur SM, Diver WR, et al.
2016.
Long-term ozone exposure and mortality in a large prospective study. Am J Respir Crit Care Med
193(10):1134–1142; doi:10.1164/rccm.201508-1633OC [Online 15 May 2016]. [DOI] [PMC free article] [PubMed] [Google Scholar]
Ultman J, Ben-Jebria A, Arnold S.
2004.
Uptake Distribution of Ozone in Human Lungs: Intersubject Variability in Physiologic Response. Research Report 125. Boston, MA: Health Effects Institute. [PubMed] [Google Scholar]
Urch B, Silverman F, Corey P, Brook JR, Lukic KZ, Rajagopalan S, et al.
2005.
Acute blood pressure responses in healthy adults during controlled air pollution exposures. Environ Health Perspect
113(8):1052–1055. [DOI] [PMC free article] [PubMed] [Google Scholar]
U.S. Environmental Protection Agency. 2013.
Integrated Science Assessment (ISA) for Ozone and Related Photochemical Oxidants (Final Report, Feb 2013). EPA/600/R-10/076F. Washington, DC:U.S. Environmental Protection Agency. [Google Scholar]
Vagaggini B, Taccola M, Cianchetti S, Carnevali S, Bartoli ML, Bacci E, et al.
2002.
Ozone exposure increases eosinophilic airway response induced by previous allergen challenge. Am J Respir Crit Care Med
166(8):1073–1077. [DOI] [PubMed] [Google Scholar]
Zanobetti A, Schwartz J.
2006.
Air pollution and emergency admissions in Boston, MA. J Epidemiol Comm Health
60:890–895. [DOI] [PMC free article] [PubMed] [Google Scholar]
Zhong J, Allen K, Rao X, Ying Z, Braunstein Z, Kankanala SR, et al.
2016.
Repeated ozone exposure exacerbates insulin resistance and activates innate immune response in genetically susceptible mice. Inhal Toxicol
28(9):383–392; doi:10.1080/08958378.2016.1179373 [Online 31 May 2016]. [DOI] [PMC free article] [PubMed] [Google Scholar]
Associated Data
This section collects any data citations, data availability statements, or supplementary materials included in this article.