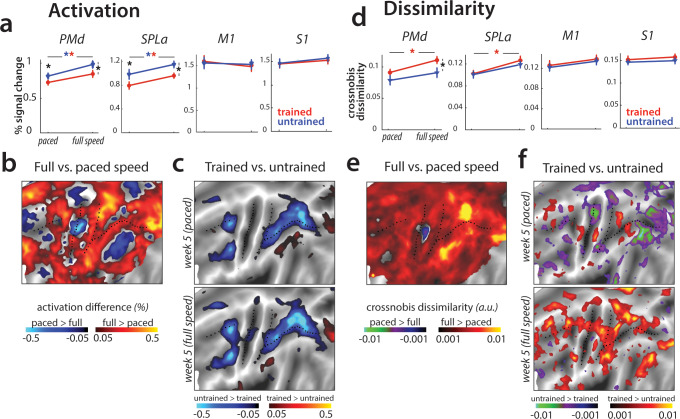
Figure 7. Speed-related changes in activation and dissimilarities.
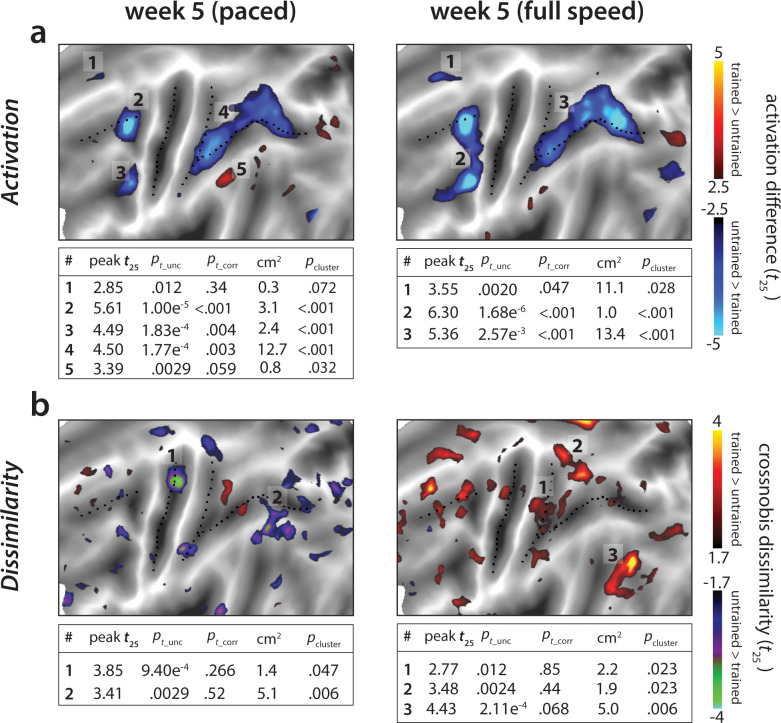
(a) Overall activation in week 5 in paced and full speed sessions for trained (red) and untrained (blue) sequences. Activation was measured as percent signal change over resting baseline (* indicates p<0.05). Error bars indicate standard error across participants. (b) Increase in activation for full speed compared to paced speed in percent signal change, averaged across trained and untrained sequences. Red colors indicate an increase in activity during full speed performance compared to paced performance. Blue colors indicate higher activation during paced compared to full speed performance. (c) Difference in activation elicited for trained relative to untrained sequences, during the paced and full speed sessions (see Figure 7—figure supplement 1a for statistical maps). Trained > untrained is shown in red, untrained > trained in blue. (d) Average crossnobis dissimilarity between sequence-specific patterns in paced and full speed sessions for trained (red) and untrained (blue) sequences. Dissimilarities are significantly larger for trained, as compared to untrained patterns in PMd during the full-speed session (* indicates p<0.05). Error bars indicate standard error across participants. (e) Difference between crossnobis dissimilarities across full speed and paced sessions, averaged across trained and untrained sequences. Higher dissimilarities for full speed than paced session are shown in red, whereas blue/green hues indicate higher dissimilarities during paced than full speed session. (f) Difference in dissimilarities for trained relative to untrained sequences, during the paced and full speed sessions. Trained > untrained is shown in red, untrained > trained in blue/green. Trained sequences elicited higher dissimilarities than untrained in full speed, but not paced session (see Figure 7—figure supplement 1b for statistical t-maps).


