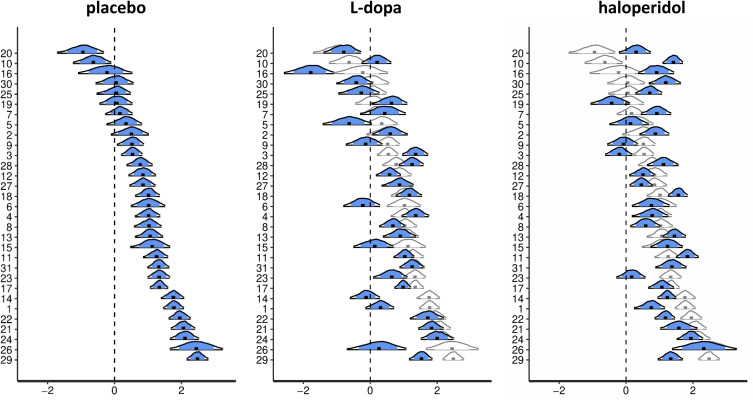
Appendix 1—figure 2. Drug effects for the subject-level parameter estimates of the directed exploration parameter .
Shown are posterior distributions of the subject-level parameter from the best-fitting Bayesian model, separately for each drug condition. Each plot shows the median (black dot), the 80% central interval (blue area), and the 95% central interval (black contours). For the L-dopa and haloperidol conditions, posterior distributions (in blue) are overlaid on the posterior distributions of the placebo condition (in white) for better comparison.

