

Abstract
Low grade, chronic inflammation is a critical risk factor for immunologic dysfunction including autoimmune diseases. However, the multiplicity of complex mechanisms and lack of relevant murine models limit our understanding of the precise role of chronic inflammation. To address these hurdles, we took advantage of multi-omics data and a unique murine model with a low but chronic expression of IFN-γ, generated by replacement of the AU-rich element (ARE) in the 3’ UTR region of IFN-γ mRNA with random nucleotides. Herein, we demonstrate that low but differential expression of IFN-γ in mice by homozygous or heterozygous ARE replacement triggers distinctive gut microbial alterations, of which alteration is female-biased with autoimmune-associated microbiota. Metabolomics data indicates that gut microbiota-dependent metabolites have more robust sex-differences than microbiome profiling, particularly those involved in fatty acid oxidation and nuclear receptor signaling. More importantly, homozygous ARE-Del mice have dramatic changes in tryptophan metabolism, bile acid and long-chain lipid metabolism, which interact with gut microbiota and nuclear receptor signaling similarly with sex-dependent metabolites. Consistent with these findings, nuclear receptor signaling, encompassing molecules such as PPARs, FXR, and LXRs, was detectable as a top canonical pathway in comparison of blood and tissue-specific gene expression between female homozygous vs heterozygous ARE-Del mice. Further analysis implies that dysregulated autophagy in macrophages is critical for breaking self-tolerance and gut homeostasis, while pathways interact with nuclear receptor signaling to regulate inflammatory responses. Overall, pathway-based integration of multi-omics data provides systemic and cellular insights about how chronic inflammation driven by IFN-γ results in the development of autoimmune diseases with specific etiopathological features.
Keywords: multi-omics, interferons, chronic inflammation, gut dysbiosis, nuclear receptors, autophagy, sex-difference, autoimmune diseases
INTRODUCTION
Chronic inflammation lasts for several months to years and is associated with the most prevalent worldwide diseases, including autoimmune diseases [1]. Due to increases in obesity, population aging and environmental toxins as high-risk factors for chronic inflammation, more attention has been focused on understanding the etiological mechanisms that trigger chronic inflammation as well as defining its role in disease. However, understanding the links between etiological and pathological features are poorly defined due to the complexity of the biological processes. Chronic inflammation and autoimmune diseases link together bi-directionally [2]; chronic inflammatory autoimmune disorders result in the production of cytokines and chemokines, which further lead to additional chronic inflammation-mediated disorders. Furthermore, prolonged inflammation, e.g. as a result of failing to clear pathogens, may trigger the development of autoimmune diseases [3]. One example of the consequences of cytokine dysregulation is the constant expression of interferons. Interferons are produced by immune cells to defend against infection and can act as antimicrobial and antiviral agents [4].
Chronic expression of interferons is seen in various autoimmune diseases including SLE, RA, and Sjogren’s Syndrome [5, 6], but the pathological mechanisms controlling interferon expression in autoimmune diseases is still not well understood. We recently engineered a murine model of chronic inflammation as a result of a low, persistent expression of interferon-gamma (IFN-γ) that mimics chronic inflammatory conditions in humans, through substitution of the AU-rich element (ARE) in the IFN-γ 3’ untranslated region (coined ARE-Del) with random nucleotides which results in low but chronic expression of IFN-γ [7]. We observed that the ARE-Del mice have autoimmune manifestations with striking clinical, immunological and histopathological characteristics of human primary biliary cirrhosis (PBC) with a female prevalence [8, 9]. As major autoimmune diseases including SLE, RA, Sjogren’s syndrome, and PBC have a high incidence in women [10], the mechanistic understanding of female-biased inflammatory responses is pivotal for the treatment of autoimmune diseases. Therefore, this model can be utilized for developing a mechanistic understanding of how chronic inflammation leads to autoimmune diseases.
Pathway-based analysis, known as a functional enrichment analysis focusing on biological functions, is a valuable tool to integrate multi-omics studies [11, 12]. Particularly, immune responses are rapidly processed by post-transcriptional or post-translational modification [13, 14], thus pathway analysis rather than individual gene signatures provide more adequate information for predicting immune responses. For example, even when individual gene expression levels (e.g. cytokines and surface markers) are not observed to be changed, their activation can be inferred by down-stream or correlated pathways. Here we present how we applied this tool to integrate different types of data sets and characterize target pathways and molecules in the immune system of mice.
Homozygous or heterozygous alleles at the IFN-γ locus result in differing levels of circulating IFN-γ [7]. The average serum level of IFN-γ in homozygous ARE-Del mice was measured to be ~30 pg/ml, compared to negligible levels of control mice, while heterozygous ARE-Del mice have generally less than ~15 pg/ml. Further, we characterized that the serum level of IFN-γ was more strongly expressed in female than male ARE-Del mice [8]. Phenotypically, both genotypes share similarities with respect to human PBC, such as portal lymphocytic infiltration and antimitochondrial antibody (AMA) production. Whereas, there are distinctive pathological and serological features, including loss of marginal zone B cells (MZB), increases of germinal center (GC) B cells and antinuclear antibody (ANA) production, specifically observed in homozygous ARE-Del mice. Based on our previous report that depletion of macrophages by clodronate liposomes (CLL) in heterozygous ARE-Del mice significantly increase the pathological phenotypes observed in homozygous ARE-Del mice, herein we focused on macrophage function and the mechanistic differences between heterozygous vs homozygous ARE-Del mice.
MATERIALS AND METHODS
Animals
ARE-Del mice were generated and maintained as previously reported [7, 8]. Animal care was provided in accordance with the “Guide for Care and Use of Laboratory Animals” (National Research Council; 2011; National Academy Press: Washington, D.C.). The experimental protocols were approved by National Cancer Institute at Frederick and the University of California at Davis Animal Care and Use Committees. All experiments were performed in group sizes of 4–6, and the numbers in each experiment are noted in the figure legends.
Caecum microbiome analysis
The caecum microbiome composition of homozygous and heterozygous ARE-Del mice and control littermates at 4, 8 and 20 weeks of age were examined. Briefly, a harvested caecum section was rapidly frozen in dry ice and stored in −80°C. Immediately after thawing, DNA was isolated using a Powersoil DNA isolation kit (MO Bio, CA), quantified and stored at −20°C. The V4 region of the 16S rDNA gene (515F-806R) was sequenced; generating partially overlapping, paired-end reads on the Illumina MiSeq platform. The demultiplexed paired-end fastq files were pre-processed and analyzed using QIIME2 [15]. The DADA2 algorithm [16] implemented in QIIME2, was used for error modeling and filtering the raw fastq files. After denoising and chimera removal; a total of 1,656,000 sequences were retained for 51 samples. The taxonomic classification was performed using the QIIME2 feature-classifier plugin trained on the Silva 132 database [17]. The Alpha and Beta-diversity analyses were performed using the diversity plugin at a sampling depth of 24,000 reads per sample. Alpha diversity was calculated by Shannon’s diversity index and observed operational taxonomic units (OTUs). Principal coordinate analyses (PCoA) was performed to calculate Beta diversity using Bray-Curtis distances, and pairwise Permutational Multivariate Analysis of Variance (PERMANOVA) was used to analyze statistical differences in beta diversity with QIIME2.
Blood and tissue-specific gene expression analysis
For global gene expression analysis, spleen, thymus, kidney, and blood were harvested from 3, 6 and 12-week old homozygous and heterozygous ARE-Del mice compared to control littermates (Each group has at least three replicates and total sample numbers are 218). To extract RNA from the spleen, thymus, and kidney, 1 ml of Trizol per 50–100 mg of tissue was homogenized with a TissueRuptor (Qiagen). RNA samples were prepared by the conventional phenol-chloroform RNA extraction. To prepare RNA from peripheral blood mononuclear cells (PBMCs), approximately 1 ml of blood per mouse were collected by cardiac puncture under anesthesia and diluted 1:1 with PBS. PBMCs were then obtained by gradient centrifugation using sterile-filtered histopaque 1077 (Sigma), washed and resuspended in sterile PBS. RNA was then purified as above using 10X volume of Trizol to cell ratio. RNA was quantified by Nanodrop (Thermo Scientific) and assessed by Bioanalyzer 2100 (Agilent Technologies). Transcriptional differences between homozygous and heterozygous ARE-Del mice were compared with control littermates using microarray analysis. Briefly, Cy3-labeled complementary DNA was generated using the Low Input Quick Amp Labeling Kit, one-color (Agilent Technologies) and hybridized to a custom 180k Agilent array with the content of the Human Gene Expression 44K replicated four times (AMADID#026822; Agilent Technologies). Analyses were conducted with log2‐transformed intensities that had been normalized at the array level to have a comparable intensity spectrum. Further statistical analysis of homozygous ARE-Del mice, heterozygotes with control littermates in each tissue and age was performed by Partek Genomics Suite 6.6 (v6.14.006).
Plasma metabolome analysis
Plasma was collected from 16 weeks old male and female homozygous ARE-Del mice (each n=6, total n=12) and control littermates (each n=6, total n=12), and stored at −80°C. Metabolome analysis was performed at Metabolon, Inc (Durham, NC), as previously described [18]. Briefly, sample preparation was conducted using a proprietary series of organic and aqueous extractions to remove the protein fraction while allowing maximum recovery of small molecules. Each sample was then frozen and dried under vacuum. Samples were then prepared for the appropriate instrument, either LC/MS or GC/MS. The LC/MS portion of the platform was based on a Waters Acquity UPLC and a Thermo-Finnigan LTQ-FT mass spectrometer, which consists of an electrospray ionization (ESI) source and a linear ion-trap (LIT) front end and a Fourier transform ion cyclotron resonance (FT-ICR) mass spectrometer backend. Fragmentation spectra (MS/MS) was employed, such as in the case of lower level signals. One aliquot was analyzed using acidic positive ion optimized conditions and the other using basic negative ion optimized conditions in two independent injections using separate dedicated columns. Extracts reconstituted in acidic conditions were gradient eluted using water and methanol both containing 0.1% formic acid, while the basic extracts, which also used water/methanol, contain 6.5mM ammonium bicarbonate. The samples destined for GC/MS analysis were re-dried under vacuum desiccation for a minimum of 24 hours prior to being derivatized under dried nitrogen using bistrimethyl-silyl-triflouroacetamide (BSTFA). The GC column was 5% phenyl and the temperature ramp was from 40° to 300° C in a 16 min ute period. Samples were analyzed on a Thermo-Finnigan Trace DSQ fast-scanning single-quadrupole mass spectrometer using electron impact ionization. For data analysis including the data extraction, quality control, compound identification, curation, and normalization, we used instrument vendor-supplied or in-house software.
MicroRNA expression data analysis
Total RNA enriched with miRNA from tissues (thymus, lymph nodes, and kidney) was extracted using miRNeasy Mini Kit (Qiagen, Hilden, Germany) following the manufacturer’s protocol. 100 ng of RNA was used as input for the NanoString platform (Nanostring, Seattle, WA). DNA sequences called miRtags were ligated to the mature miRNAs and unligated miRtags were removed by enzymatic purification. The miRtagged mature miRNA was hybridized with an nCounter miRNA Expression Assay CodeSet overnight at 65°C. The unhybridized CodeSet was eliminated by automated purification on an nCounter Prep station, and the hybridized CodeSet was analyzed and raw data were collected through a nCounter Digital Analyzer. Data normalization was performed on nSolver and differentially expressed miRNAs were analyzed by Partek Genomics Suite.
Detection of autophagosome formation.
Female homozygous ARE-Del and control littermates were used to isolate bone marrow cells which were flushed from the femur and tibia. To differentiate bone marrow-derived macrophages, cells were cultured with 25 ng/ml murine GM-CSF (Miltenyi Biotech) for 7–10 days. Attached cells were further isolated to measure autophagosomes using Cyto-ID detection kit (Enzo Life Sciences, Farmingdale, NY), which has a cationic amphiphilic tracer dye to stain selectively autophagic vacuoles. Briefly, cells were treated with 3uM rapamycin and incubated at 37°C for 2 hrs. Cells were collected after PBS washing and incubated for 30 min with the detection reagent containing dyes for autophagic vacuoles and nuclear (Hoechst 33342). After PBS washes, the cells were fixed with 4% paraformaldehyde for 20 min in the dark and immediately pictured under a Leica TCS SP8 laser scanning confocal microscope with a 63X objective.
RESULTS
Cecal microbiota are distinctively altered by low, but differential levels of IFNγ
To investigate whether low but chronic expression of IFN-γ affects the gut microbiome, we performed 16S rRNA analysis on caecum microbial populations between sample groups of homozygous, heterozygous ARE-Del mice, and control littermates at 4, 8, and 20 wks of age. Cecal microbial profiling demonstrated that there are distinct differences in the diversity and richness in cecum bacterial populations between these mice. The observed OTUs and Shannon index indicate that there was a significant alteration in homozygotes when compared with heterozygotes and control mice (Figure 1A), while there were no significant changes of these indexes between age groups (Figure 1B). Consistently, the microbial beta diversity represented by PCoA plots with Pairwise Permanova, demonstrated that homozygous ARE-Del mice cluster significantly differently (p < 0.05) from heterozygotes and the control group on axis 1 (17.6%) (Figure 1C). Although there was a slight diversity in the PCoA plot demostrating different age groups (Figure 1D), all pairwise adjusted p values between age groups were < 0.05, indicating age-related changes in the gut microbiome. Significant changes (p < 0.05) in microbiota amongst ARE-Del homo-, heterozygotes, and wild type at the genus level are represented as heat maps, which were separated by log2 fold changes (0 to 5 and 5 to 10) (Figure 1E). The pattern of changes in homozygous ARE-Del was overally reduced when compared to heterozyous ARE-Del and control littermates, indicating the lower microbial diversity in homozygous ARE-Del mice as one of makers for gut dysbiosis. Notably, homozygous mice specifically increased genera, including Desulfovibrio, Roseburia, and Alistipes, that have been associated with various autoimmune diseases.
Figure 1.

Comparison of cecal microbial profiles from homozygous and heterozygous ARE-Del mice. (A) Boxplots of observed OTUs richness and Shannon diversity indexes comparing cecum samples from homozygous (n=27) and heterozygous (n=17) ARE-Del mice with control littermates (n=25) at 20 weeks old. Kruskal-Wallis test was performed to analyze the significance (***p<0.0001). (B) Boxplots of observed OTUs richness and Shannon diversity indexes comparing different ages of 4 weeks (n=17), 8 weeks (n=13) and 20 weeks (n=39). (C) A PCoA plot of cecum samples from homozygous (KO) and heterozygous (Het) mice with control littermates (WT). (D) A PCoA plot of cecum samples collected at 4, 8 and 20 weeks of age. (C-D) Pairwise Permanova was also used to estimate beta group significance. (E) Heat map of relative expression values of normalized counts for the significant changes (p<0.05) at the genus level in female and male homozygous and heterozygous ARE-Del mice compared to control littermates.
Sex-difference in gut dysbiosis with autoimmune disease-associated gut microbiota
Although sex-specific microbial profiles have been reported in human and various mouse strains, it is not well understood whether sex-specific microbial profiles are associated with the development of autoimmune diseases. Thus, we further analyzed microbial changes at the genus level to examine the difference between male and female homozygous ARE-Del mice (Figure 2). Although the observed OTUs and Shannon index (Figure 2A) and beta diversity (Figure 2B) were not significantly different between male and female homozygous ARE-Del mice, there were statistically significant (p < 0.05) diversities when male and female mice were separately analyzed at the genus level (Figure 2C). Female homozygous ARE-Del mice had significantly increased genera of Alistipes, ASF356, Desulfovibrio, Lachnospiraceae UCG-010, Mucispirillum, Ruminococcus 1, Trichomonas, and Tyzzerella 3. However, Alloprevotella, Christensenellaceae R-7 group, GCA-900066575, Lachnospraceae FCS020 group, Muribaculum, Oscillibacter, Parasutterella, Prevotellaceae UCG-001, Rikenellaceae RC9, Ruminiclostridium, Ruminislostridium 5, Ruminislostridium 6, Ruminislostridium 9, Ruminococcaceae UCG-005, and Ruminococcaceae UCG-014 are less abundant in female homozygous ARE-Del mice than control littermates. In male homozyous ARE-Del mice, Lachnospiraceae UCG-001, Lachnospiraceae UCG-010, Tritrichomonas, and Tyzzerella 4 significantly increased, while the abundance of Alloprevotella, GCA-900066575, Lachnospiraceae UCG-006, Parabacteroides, Rikenellaceae RC9 gut group, and Ruminislostridium 6 were suppressed.
Figure 2.

Sex-specific cecal microbial profiles in ARE-Del mice. (A) Boxplots of observed OTUs richness and Shannon diversity indexes and (B) A PCoA plot comparing cecum samples from female (n=40) and male (n=29) mice (all genotypes combined). (C) Bar graphs of sex-specific intestinal bacteria at the genus level. The upper graph presents significantly changed bacteria between female homozygous ARE-Del mice (F_KO) and control female littermates (F_WT). The lower graph presents data comparing male homozygous ARE-Del mice (M_KO) and control male littermates (M_WT). The abundance of genera was converted into log fold ratio (Log2) and each bar shows Mean with SEM. Statistical analysis is performed by multiple t-test (no multiple comparisons), *P<0.05, **P<0.001, ***P<0.001.
Robust sex differences in energy and lipid metabolism in homozygous ARE-Del mice, associated with the gut microbiome and nuclear receptor signaling.
As cecal microbiome was strongly changed as early as 4 weeks old in homozyous ARE-Del mice, we thus further analyzed metabolomics profiles in the plasma at 4 weeks of age between male and female homozyous ARE-Del mice compared to control littermates. This analysis not only explored the interplay between the gut microbiome and host metabolism but also characterized sex different metabolic processes. Table 1 lists overall metabolic changes observed between female vs male ARE-Del mice compared to control littermates at 4 weeks of age as described in the methods section. Each value represents the relative expression ratio transformed to log2 scale, and significantly (p<0.05) up- or down-regulated changes are marked as a red or green color, respectively. Notable changes in both male and female homozyous ARE-Del mice included tryptophan metabolism, bile acid and long-chain lipid metabolism, and gamma-glutamyl transferred peptides. Principal component analysis (PCA) revealed robust sex differences between male vs female in both homozygous ARE-Del mice and control littermates (Figure 3A). Genotypes also strongly affected metabolic profiling, while genotype difference was relatively greater in female than male mice. In detail, changes of identified metabolites in male and female homozygous ARE-Del mice were compared by the positive correlation of a scatter plot (Figure 3B). Strong sex-difference was detectable in three notable areas (marked as red circles) based on correlated metabolites. p-cresol sulfate and 4-ethylphenylsulfate, known as microbial metabolites [19, 20], were more significantly altered in male than female ARE-Del mice. Other two notable areas include metabolites associated with fattiy acid oxidation (FAO) and tauro-conjugated bile acids. As overall fold changes were stronger in female ARE-Del mice, mostly located between +1 and −1 relative fold ratio (dotted lines), metabolites with sex-differences are shown in Figure 3C. Robust sex-differences were visible in amino acid metabolisms including glycine, phenylalanine, tyrosine, and tryptophan metabolism as well as urea cycle. Considering that most of these metabolites contain an aromatic ring, sex-different metabolic processes are likely involved in nuclear receptor-mediated metabolic pathways such as mitochondrial fatty acid oxidation.
Table 1.
Representative fold changes of serum metabolites in male and female homozygous ARE-Del mice compared to wild-type mice. Significant fold changes are marked by red and green colors (p<0.05). All KO; combined male and female homozygous ARE-Del mice (n=12) vs control littermates (n=12), KO F; female homozygous ARE-Del mice (n=6) vs control littermates (n=6), KO M; male homozygous ARE-Del mice (n=6) vs control littermates (n=6).
| SUPER PATHWAY | SUB PATHWAY | BIOCHEMICAL | ALL KO / | KO F / | KO M / |
|---|---|---|---|---|---|
| Amino acid | Alanine and aspartate metabolism | 3-ureidopropionate | 1.12 | 1.11 | 1.13 |
| Butanoate metabolism | 2-aminobutyrate | 0.89 | 0.77 | 1.08 | |
| Cysteine, methionine, SAM, taurine metabolism | 2-hydroxybutyrate (AHB) | 0.85 | 0.77 | 0.99 | |
| methionine | 1.48 | 1.85 | 1.20 | ||
| N-acetylmethionine | 1.41 | 1.64 | 1.20 | ||
| glutamine | 0.85 | 0.88 | 0.81 | ||
| Glutamate metabolism | N-acetylglutamine | 0.77 | 0.98 | 0.64 | |
| beta-hydroxypyruvate | 0.86 | 1.22 | 0.61 | ||
| Glycine, serine and threonine metabolism | betaine | 0.95 | 0.88 | 1.03 | |
| glycine | 1.10 | 1.09 | 1.11 | ||
| N-acetylglycine | 0.68 | 0.47 | 0.95 | ||
| Guanidino and acetamido metabolism | 4-guanidinobutanoate | 1.46 | 1.67 | 1.28 | |
| Histidine metabolism | histidine | 0.89 | 0.97 | 0.82 | |
| urocanate | 0.69 | 0.54 | 1.01 | ||
| Lysine metabolism | lysine | 0.76 | 0.73 | 0.79 | |
| N6-acetyllysine | 1.23 | 1.30 | 1.16 | ||
| pipecolate | 0.88 | 1.06 | 0.76 | ||
| Phenylalanine & tyrosine metabolism | 3-(4-hydroxyphenyl)lactate | 1.37 | 1.44 | 1.27 | |
| 4-hydroxyphenylpyruvate | 1.49 | 1.75 | 1.21 | ||
| N-acetylphenylalanine | 1.32 | 1.55 | 1.06 | ||
| N-acetyltyrosine | 1.38 | 1.84 | 0.99 | ||
| p-cresol sulfate | 0.25 | 0.41 | 0.08 | ||
| phenylalanine | 1.07 | 1.20 | 0.95 | ||
| phenyllactate (PLA) | 1.71 | 1.83 | 1.60 | ||
| tyrosine | 1.20 | 1.39 | 1.03 | ||
| Polyamine metabolism | 5-methylthioadenosine (MTA) | 1.31 | 1.33 | 1.29 | |
| Tryptophan metabolism | 3-indoxyl sulfate | 1.07 | 1.09 | 1.04 | |
| indolelactate | 1.39 | 1.41 | 1.36 | ||
| kynurenine | 3.31 | 2.55 | 5.07 | ||
| N-acetyltryptophan | 0.78 | 0.91 | 0.62 | ||
| serotonin (5HT) | 0.55 | 0.44 | 0.71 | ||
| tryptophan | 0.78 | 0.80 | 0.75 | ||
| Urea cycle; arginine-, proline-, metabolism | citrulline | 1.29 | 1.35 | 1.23 | |
| dimethylglycine | 1.27 | 1.22 | 1.35 | ||
| homocitrulline | 1.52 | 1.22 | 1.88 | ||
| homostachydrine* | 0.81 | 0.79 | 0.82 | ||
| proline | 1.50 | 1.73 | 1.30 | ||
| urea | 1.29 | 1.54 | 1.08 | ||
| Valine, leucine and isoleucine metabolism | 2-hydroxy-3-methylvalerate | 0.96 | 1.30 | 0.83 | |
| 2-methylbutyroylcarnitine | 1.34 | 1.23 | 1.47 | ||
| 3-methyl-2-oxobutyrate | 0.74 | 0.69 | 0.80 | ||
| 3-methyl-2-oxovalerate | 0.61 | 0.57 | 0.65 | ||
| 4-methyl-2-oxopentanoate | 0.62 | 0.63 | 0.61 | ||
| alpha-hydroxyisovalerate | 0.99 | 1.31 | 0.90 | ||
| butyrylcarnitine | 1.46 | 1.57 | 1.31 | ||
| hydroxyisovaleroyl carnitine | 1.20 | 1.18 | 1.24 | ||
| isobutyrylcarnitine | 1.97 | 2.33 | 1.66 | ||
| isoleucine | 0.87 | 0.92 | 0.81 | ||
| isovalerylcarnitine | 1.62 | 1.89 | 1.35 | ||
| propionylcarnitine | 1.74 | 2.11 | 1.42 | ||
| Aminosugars metabolism | erythronate* | 1.16 | 1.27 | 1.07 | |
| Peptide | DiPeptide | alanylalanine | 0.71 | 0.80 | 0.66 |
| gamma-glutamylvaline | 0.95 | 1.03 | 0.90 | ||
| Dipeptide derivative | anserine | 1.53 | 1.77 | 1.42 | |
| g-glutamyl | gamma-glutamylglutamate | 1.39 | 1.17 | 1.60 | |
| gamma-glutamylmethionine* | 1.66 | 1.93 | 1.49 | ||
| gamma-glutamylphenylalanine | 1.54 | 1.64 | 1.45 | ||
| gamma-glutamylthreonine* | 1.14 | 1.12 | 1.16 | ||
| gamma-glutamyltryptophan | 1.31 | 1.21 | 1.45 | ||
| gamma-glutamyltyrosine | 1.58 | 1.65 | 1.52 | ||
| Nucleotide | Purine metabolism, (hypo)xanthine/inosine containing | inosine | 0.32 | 0.52 | 0.28 |
| Purine metabolism, adenine containing | 1-methyladenosine | 0.98 | 0.93 | 1.05 | |
| adenosine | 0.36 | 0.20 | 0.37 | ||
| adenosine 5’-monophosphate (AMP) | 0.39 | 0.96 | 0.38 | ||
| Purine metabolism, guanine containing | guanosine | 0.99 | 1.00 | 0.99 | |
| guanosine 5’- monophosphate (GMP) | 0.86 | 1.00 | 0.84 | ||
| Purine metabolism, urate metabolism | allantoin | 1.23 | 1.25 | 1.22 | |
| urate | 1.33 | 1.26 | 1.40 | ||
| Pyrimidine metabolism, cytidine containing | 2’-deoxycytidine | 1.43 | 1.39 | 1.48 | |
| cytidine | 0.67 | 0.67 | 0.67 | ||
| Pyrimidine metabolism, thymine containing | thymidine | 1.44 | 1.42 | 1.48 | |
| Pyrimidine metabolism, uracil containing | 5,6-dihydrouracil | 1.72 | 2.28 | 1.33 | |
| pseudouridine | 1.25 | 1.17 | 1.35 | ||
| uridine | 0.55 | 0.59 | 0.52 | ||
| Carbohydrate | Fructose, mannose, galactose, starch, and sucrose metabolism | fructose | 0.82 | 0.72 | 0.92 |
| mannose | 0.72 | 0.66 | 0.79 | ||
| Glycolysis, gluconeogenesis, pyruvate metabolism | 1,5-anhydroglucitol (1,5-AG) | 0.56 | 0.61 | 0.52 | |
| glucose | 0.82 | 0.86 | 0.79 | ||
| glycerate | 1.33 | 1.08 | 1.58 | ||
| Nucleotide sugars, pentose metabolism | arabitol | 1.24 | 1.20 | 1.27 | |
| ribitol | 1.49 | 1.75 | 1.25 | ||
| ribulose | 1.75 | 2.40 | 0.89 | ||
| Lipid | Bile acid metabolism | 12-dehydrocholate | 2.84 | 2.15 | 5.60 |
| beta-muricholate | 2.81 | 2.52 | 3.80 | ||
| cholate | 19.28 | 17.52 | 26.94 | ||
| deoxycholate | 5.06 | 4.46 | 5.89 | ||
| tauro-beta-muricholate | 30.85 | 36.17 | 12.80 | ||
| taurochenodeoxycholate | 35.96 | 45.42 | 15.23 | ||
| taurocholate | 28.37 | 32.98 | 17.20 | ||
| taurodeoxycholate | 11.80 | 13.31 | 8.39 | ||
| Carnitine metabolism | 3-dehydrocarnitine* | 1.09 | 1.04 | 1.17 | |
| acetylcarnitine | 0.90 | 0.80 | 1.04 | ||
| carnitine | 0.92 | 0.88 | 0.96 | ||
| deoxycarnitine | 1.12 | 1.07 | 1.20 | ||
| hexanoylcarnitine | 0.95 | 0.72 | 1.41 | ||
| oleoylcarnitine | 1.05 | 0.98 | 1.28 | ||
| Essential fatty acid | dihomo-linolenate (20:3n3 or n6) | 0.69 | 0.80 | 0.63 | |
| docosahexaenoate (DHA; 22:6n3) | 0.74 | 0.69 | 0.80 | ||
| docosapentaenoate (n3 DPA; 22:5n3) | 0.54 | 0.57 | 0.50 | ||
| eicosapentaenoate (EPA; 20:5n3) | 0.78 | 0.89 | 0.68 | ||
| linolenate [alpha or gamma; (18:3n3 or 6)] | 0.75 | 0.70 | 0.80 | ||
| Fatty acid, beta-oxidation | hexanoylglycine | 0.54 | 0.19 | 0.98 | |
| Fatty acid, dicarboxylate | adipate | 0.89 | 1.05 | 0.79 | |
| azelate (nonanedioate) | 0.89 | 0.86 | 0.91 | ||
| sebacate (decanedioate) | 0.90 | 0.87 | 0.93 | ||
| suberate (octanedioate) | 1.02 | 1.01 | 1.02 | ||
| undecanedioate | 0.92 | 0.89 | 0.94 | ||
| Fatty acid, methyl ester | methyl palmitate | 0.99 | 0.96 | 1.01 | |
| Glycerolipid metabolism | glycerol | 0.77 | 0.71 | 0.83 | |
| glycerophosphorylcholine (GPC) | 0.78 | 0.78 | 0.78 | ||
| Inositol metabolism | inositol 1-phosphate (I1P) | 0.79 | 0.90 | 0.72 | |
| myo-inositol | 1.12 | 1.18 | 1.07 | ||
| Ketone bodies | 3-hydroxybutyrate (BHBA) | 0.24 | 0.16 | 0.67 | |
| Long chain fatty acid | 10-heptadecenoate (17:1n7) | 0.71 | 0.68 | 0.74 | |
| 10-nonadecenoate (19:1n9) | 0.57 | 0.51 | 0.65 | ||
| dihomo-linoleate (20:2n6) | 0.75 | 0.67 | 0.85 | ||
| dodecanedioate | 0.91 | 0.89 | 0.92 | ||
| eicosenoate (20:1n9 or 11) | 0.74 | 0.73 | 0.75 | ||
| linoleate (18:2n6) | 0.82 | 0.78 | 0.86 | ||
| myristate (14:0) | 0.60 | 0.54 | 0.66 | ||
| myristoleate (14:1n5) | 0.45 | 0.32 | 0.62 | ||
| oleate (18:1n9) | 0.67 | 0.60 | 0.76 | ||
| palmitate (16:0) | 0.80 | 0.80 | 0.81 | ||
| palmitoleate (16:1n7) | 0.52 | 0.45 | 0.58 | ||
| stearate (18:0) | 0.87 | 0.84 | 0.92 | ||
| Lysolipid | 1-arachidonoylglycerophosphocholine* | 0.74 | 0.77 | 0.70 | |
| 1-arachidoylglycerophosphocholine | 0.94 | 1.46 | 0.74 | ||
| 1-docosahexaenoylglycerophosphocholine* | 0.80 | 0.85 | 0.73 | ||
| 1-eicosatrienoylglycerophosphocholine* | 0.63 | 0.78 | 0.49 | ||
| 1-heptadecanoylglycerophosphocholine | 0.87 | 0.85 | 0.95 | ||
| 1-linoleoylglycerophosphoinositol* | 1.48 | 1.80 | 1.24 | ||
| 1-myristoylglycerophosphocholine | 0.86 | 0.94 | 0.73 | ||
| 1-oleoylglycerophosphate | 0.96 | 1.03 | 0.92 | ||
| 1-palmitoylglycerophosphate | 0.90 | 0.93 | 0.88 | ||
| 1-palmitoylglycerophosphocholine | 0.83 | 0.90 | 0.76 | ||
| 1-palmitoylglycerophosphoinositol* | 1.03 | 0.80 | 1.16 | ||
| 1-stearoylglycerophosphocholine | 0.82 | 0.88 | 0.74 | ||
| 2-linoleoylglycerophosphocholine* | 0.89 | 1.03 | 0.70 | ||
| 2-palmitoylglycerophosphocholine* | 0.75 | 0.92 | 0.57 | ||
| 2-stearoylglycerophosphocholine* | 0.76 | 0.78 | 0.70 | ||
| Medium chain fatty acid | laurate (12:0) | 1.03 | 0.90 | 1.25 | |
| pelargonate (9:0) | 0.98 | 0.98 | 0.99 | ||
| Monoacylglycerol | 1-stearoylglycerol (1-monostearin) | 1.00 | 1.16 | 0.88 | |
| Sterol/Steroid | 7-alpha-hydroxy-3-oxo-4-cholestenoate (7-Hoca) | 1.12 | 1.13 | 1.09 | |
| campesterol | 0.68 | 1.20 | 0.39 | ||
| cholesterol | 0.99 | 1.07 | 0.95 | ||
| corticosterone | 1.87 | 1.94 | 1.72 | ||
| Energy | Krebs cycle | alpha-ketoglutarate | 0.55 | 0.66 | 0.46 |
| cis-aconitate | 1.21 | 1.15 | 1.28 | ||
| citrate | 1.31 | 1.21 | 1.43 | ||
| succinate | 1.04 | 1.31 | 0.83 | ||
| Oxidative phosphorylation | phosphate | 0.70 | 0.72 | 0.67 | |
| pyrophosphate (PPi) | 0.49 | 0.56 | 0.35 | ||
| Cofactors and vitamins | Ascorbate and aldarate metabolism | ascorbate (Vitamin C) | 0.56 | 0.80 | 0.37 |
| gulono-1,4-lactone | 1.10 | 0.99 | 1.16 | ||
| threonate | 1.00 | 0.90 | 1.11 | ||
| Nicotinate and nicotinamide metabolism | nicotinamide | 0.55 | 0.63 | 0.46 | |
| trigonelline (N’-methylnicotinate) | 1.30 | 1.31 | 1.30 | ||
| Pantothenate and CoA metabolism | pantothenate | 1.07 | 1.20 | 0.91 | |
| Xenobiotics | Benzoate metabolism | 4-ethylphenylsulfate | 0.51 | 1.03 | 0.03 |
| 4-vinylphenol sulfate | 2.42 | 3.31 | 1.73 | ||
| catechol sulfate | 1.57 | 2.21 | 1.11 | ||
| Chemical | methyl-alpha-glucopyranoside | 0.30 | 0.24 | 0.33 | |
| Food component/Plant | daidzein | 3.26 | 3.37 | 3.21 | |
| Sugar, sugar substitute, starch | erythritol | 1.16 | 1.24 | 1.11 |
Figure 3.


Sex-specific metabolite profiles in homozygous ARE-Del mice. (A) A PCA plot of the metabolites in male or female homozygous ARE-Del mice vs control littermates. (B) Scatter plot showing the relationship of between overall metabolites (Log2 fold changes) from male or female homozygous ARE-Del mice vs control littermates. Dotted lines point relatively one fold up or down-regulated directions between male vs female homozygous ARE-Del mice. (C) Heatmap of differentially expressed metabolites (p<0.05), which were selected from Figure B and presented by log2 fold change. (p<0.05). (D-E) FAO related metabolites (hexanoylglycine and 3-hydroxybutyrate) in male and female homozygous ARE-Del mice compared to control littermates (each group, n=4–6). Statistical analysis is performed by Mann Whitney test (**p<0.001). Sex-different bile acid composition in male and female homozygous ARE-Del mice (F-G). (F) The relative ratio of bile acids was calculated by comparison of fold changes between male or female homozygous ARE-Del vs control littermates. (G) The relative ratio of Tauro-conjugated vs unconjugated bile acids in male and female ARE-Del−/− mice. CA; cholate, TCA; taurocholate, DCA; deoxycholate, TDCA; taurodeoxycholate, βMCA; beta-muricholate, TβMCA; tauro-beta-muricholate, CDCA; chenodeoxycholate, TCDCA; taurochenodeoxycholate.
As shown in Figure 3D and 3E, the basal expression levels of hexanoglycine and 3-hydoxybutyrate were higher in female wild type mice than male mice. Furthermore, the basal level of hexanoglycine was dramatically suppressed only in female homozyous ARE-Del mice. Not only mitochondiral fatty acid oxidation but other mitochondrial energy metabolic processes were significantly altered with an observed sex-difference. Metabolites linked to these pathways include female-specific increases of succinate and ribulose in homozyous ARE-Del mice (Supplemental Figure 2A and 2B ). Analysis of bile acid composition in homozygous ARE-Del mice demonstrated that tauro-conjugated bile acids including tauro-beta muricholate, taurochenodeoxycholate, taurocholate, and taurodeoxycholate were higher in female than male homozyous ARE-Del mice, while non-conjugated bile acids such as deoxycholate, cholate, beta-muricholate are higher in male homozyous ARE-Del mice (Figure 3F). Further, we compared the ratio of each tauro-conjugated vs non-conjugated bile acid and the most notable differences was found in tauro-beta-muricholate, a natural FXR antagonist, between male and female ARE-Del mice (Figure 3G).
Early alteration of B cell and nuclear signaling in the peripheral blood are correlated with later inflammation in the kidney in female homozygous ARE-Del mice.
As noted, the cecal microbiome was altered in homozygous ARE-Del mice, of which changes were much stonger when compared to the heterozygotes than any sex-differences in these mice. Furthermore, pathological and serological phenotypes such as loss of marginal zone B cells and autoantibody production are distinctive between homozygous and heterozygous ARE-Del mice beyond any sex-differences [7]. Thus, we compared gene expression profiles in female homozyous vs heterozygous ARE-Del mice, at different ages and in different tissues to characterize mechanistic differences. In Figure 4A, a PCA plot shows clusters of gene expression data from all 218 samples, as described in the methods section, based on their similarity. Gene expression profiles in each tissue were distinctive and separated from other tissues with a mild effect of age, thus we further analyzed differentially expressed (DE) genes of female homozygous and heterozygous ARE-Del mice compared to control littermates in each tissue as shown in Figure 4B. The statistical analysis was performed using Partek Genomics Suite 6.6 and the number of DE genes of female homozyous and heterozygous ARE-Del mice in each tissue were generated and compared to control littermates with a p-value threshold of 0.05 and ±2 fold change cut-off. Up-regulated genes (a fold change ≥2 with a p-value <0.05) were marked with an orange color, and down-regulated genes (a fold change ≤−2 with a p-value <0.05) were marked with a blue color, respectively. Among these changes, it was notable that DE genes were highly increased from an early age at 3 weeks, specifically in the blood (PBMC) from both female homozygous and heterozygous ARE-Del mice.
Figure 4.

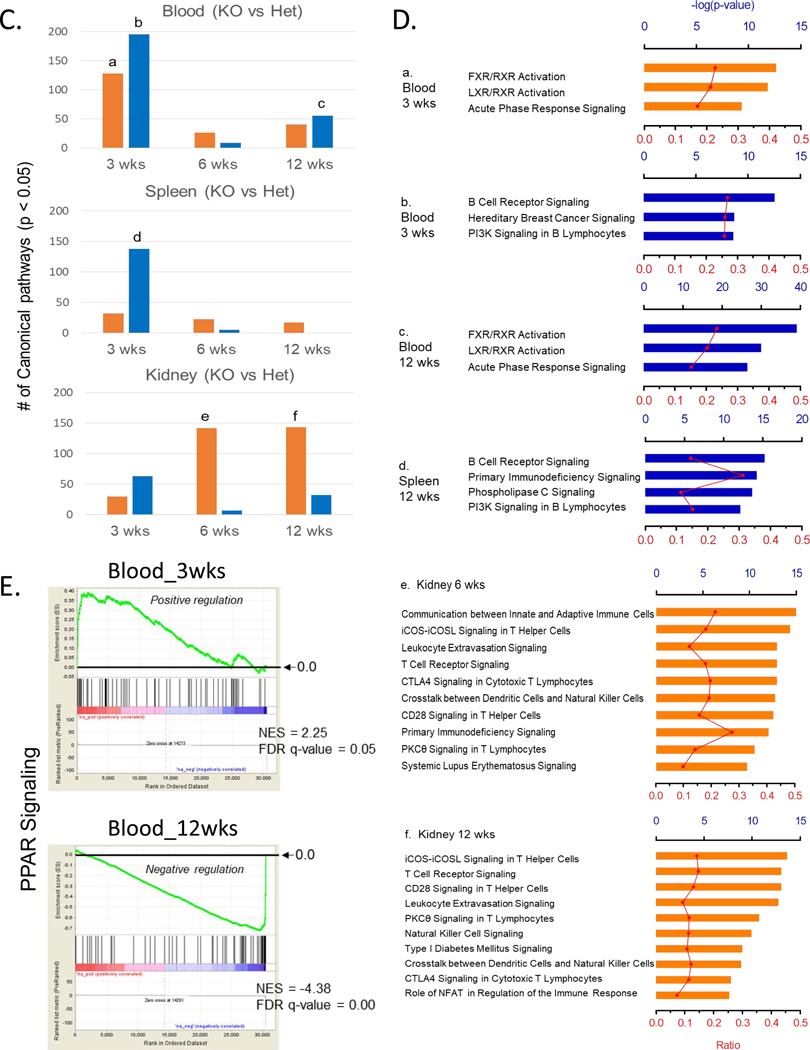
Overall age-and tissue-dependent gene expression profiles in female homozygous and heterozygous ARE-Del mice with control littermates. (A) A PCA plot of overall gene expression in blood, kidney, spleen, and thymus at 3, 6, 12 weeks in homozygous and heterozygous ARE-Del mice with control littermates. (B) Comparison of upregulated or downregulated genes in PBMC, spleen, thymus, and kidney from homozygous and heterozygous ARE-Del mice compared to control littermates at 3, 6, 12 wks. The total height of each bar indicates the number of genes (orange bar; upregulated genes, blue bar; downregulated genes). S; spleen, K; kidney, B; blood, T; thymus. (C) Number of canonical pathways in homozygous ARE-Del mice compared to heterozygous ARE-Del mice in PBMC, spleen, and kidney at 3, 6, and 12 weeks old. The total height of each bar indicates the number of significant canonical pathways derived from upregulated (orange) or downregulated (blue) genes in female homozygous ARE-Del mice compared to heterozygotes. (D) The significant number of canonical pathways from Figure 5A was calculated by –log (p-value) less than 1.5 (relative to p-value < 0.05). Ratio (red line) refers to the number of genes from the data set divided by the total number of genes according to the IPA knkowledge base. a-f; representative top canonical pathways ordered from the highest one in each group. (E) GSEA plots of PPAR signaling in the blood with a comparison between 3 and 12 weeks in female homozygous ARE-Del mice. PPAR signaling gene set was derived from the GSEA database, and enrichment was defined by normalized enrichment score (NES), false discovery rate (FDR) q-value.
Although the number of DE genes indicate how genes in each tissue rapidly responded over a time period, mechanism-based analysis also gives cruicial information to understand how these DE genes are meaningfully connected with mechanistic processes for pathogenic development. Figure 4C presents that the number of significantly changed canonical pathways (p < 0.05) of either up- or down-regulated genes in PBMC, spleen, and kidney over age, analyzed by Ingenuity pathway analysis (IPA). Here, we specifically analyzed differential pathways between female homozygous vs heterozygous ARE-Del mice to characterize homozygous-specific mechanistic changes which can be connected with homozygous-specfic microbial alteration.
As shown in Figure 4D, the top three canonical pathways for up- or downregulated genes in the PBMC and spleen are listed (a-d) and top ten canonical pathways for upregulated genes in the kidney are also listed (e-f) in order. Overally, notable changes in PBMC and spleen were detectable at 3 weeks of age and particularly include macrophage activation (data not shown here) and impaired B cell signaing. Furthermore a sequential increase of T cell signaling was detectable in the kidney from 6 weeks of age, implying that early changes in the peripheral blood immune cells impact later inflammatory responses in the kidney. The highest top canonical pathways in PBMC reflected the finding that nuclear receptor FXR/RXR and LXR/RXR signaling was increased at 3 weeks (a) and oppositely suppressed at 12 weeks (c). A similar pattern was detected in PPAR signaling, driven by gene set enrichment analysis (GSEA) (Figure 4E). A set of genes related to PPAR signaling obtained from GSEA databases was increased at 3 weeks of age and later suppressed at 12 weeks of age in female homozygous ARE-Del mice compared to control littermates. The kidney had highly upregulated cannonical pathways that regulate the development of CD4 T helper cells from 6 weeks old ages (e-f). As mentioned before, another remarkable gene expression change in PBMC was suppression of B cell receptor signaling, detectable at 3 weeks of age (b). A similar but weaker pattern was detectable in the spleen (d) but not in the thymus. Using flow cytometry analysis, a subpopulation of B cells in the spleen from female homozygous ARE-Del mice and control littermates at 4 weeks of age were analyzed (Supplemental Figure 3A). Given that immature B cells (CD21lowCD23low) were higher in ARE-Del mice, while FO (CD21intCD23int) and marginal zone (MZ) B cells (CD21highCD23low) were lower in ARE-Del mice compared to control littermates, it is likely that early suppressed B cell signaling in the gene expression pattern results in impaired B cell differentiation in the secondary lymphoid organs.
mTOR-autophagy pathway is dysregulated in macrophages at early ages, as an initial pathogenic mechanism in female homozygous ARE-Del mice.
Given that macrophage depeletion by CLL significantly reduces splenic MZB cells and increases ANA production, we hypothesized that functional alteration of macrophage at early ages plays a critical role in B cell differentiation in secondary lyphoid organs and development of autoantibodies. To predict each activation level of peripheral blood immune cells, we utilized K-means clustering to sort genes based on patterns of gene expression (Supplemental Figure 4). We clustered into 20 gene sets based on their expression patterns over time and analyzed the most target cells and tissues in each cluster, according to Mouse Gene Atlas. Consistent with pathway analysis, the pattern with early suppression corresponded to follicular B cell signaling (Suplemental Figure 4A). In contrast, the pattern of gene expression revealed early activation as well as persistent activation over time that was consistent with activated macrophage signaling (Supplemental Figure 4B and 4C), suggesting that early altered macrophage function is critical for the disease progression. In addition, dendrtitic cell signaling gradually increased (Supplemental Figure 4D), indicating that chronic DC activation corresponds to pathological development of autoimmune diseases. Based on our obervations, we next focused on evaluating autophagy, which is known as a critical pathway in macrophages, regulating phagocytosis, antigen processing, metabolic processes and inflammatory responses. First, we examined mTOR signaling and autophagy-related genes depending on the age in homozygous ARE-Del mice (Figure 5A). As early as 3 weeks, genes regulating mTOR signaling and autophagy were most affected and dysregulated. To evaluate the dysregulated function of these pathways, we isolated peripheral macrophages and developed bone-marrow derived macrophages from female homozygous ARE-Del mice, in order to examine the formation of autophagosomes in the presence or absence of the mTOR inhibitor, rapamycin (Figure 5B and 5C). In Figure 5B, bone-marrow derived macrophages were treated with rapamycin with or without pre-treatment with bafilomycin to inhibit degradation of LC3-II. LC3-II accumulated in wild type mice upon treatment of rapamycin, indicating increased autophagy processes upon suppression of mTOR signaling. However, the LC3-II complex was not increased in cells from homozygous ARE-Del mice under the same conditions. We further confirmed the autophagosome formation using Cyto-ID staining (Figure 5C). Upon treatment with Rapamycin, autophagosomes stained by green-fluorescent Cyto-ID were increased in born-marrow derived macrophages from wild type mice but not homozygous ARE-Del mice, whereas the basal level of autophagosomes slightly increased in macrophages from homozygous ARE-Del mice compared to control mice.
Figure 5.

Dysregulated autophagy process from female homozygous ARE-Del mice. (A) Heat map of the PBMC gene expression in mTOR signaling and autophagy process in female homozygous ARE-Del mice compared to heterozygotes. (B) Representative images of autophagosome formation after rapamycin treatment in born-marrow derived macrophages from female homozygous ARE-Del mice and control wild type mice. Both normal control and treated cells were stained with Cyto-ID® green dye and Hoechst 33342, followed by the manufacturer’s protocol. (C) Immunoblotting to detect the accumulation of LC3-II upon treatment of rapamycin (3 uM, 2 hrs) with or without pre-treatment of bafilomycin A1 (50 nM, 30 min prior to rapamycin). (D) Gene expression levels of macrophage markers (Marco and Siglec1) comparing homozygous ARE Del mice to control littermates in the PBMCs, kidney, spleen, and thymus according at 3, 6, and 12 weeks old. Statistical analysis is performed by t-test, *P<0.05. (E) GSEA plots of positive regulation of the autophagy process in the kidney from homozygous and heterozygous ARE-Del mice at 12 weeks old.
To characterize autophagy function in macrophages at a systemic level, the expression level of macrophage marker genes, including Marco and Siglec1, were analyzed in blood and tissues over time. They were highly upregulated in the blood and kidneys at 3 weeks old age, with such activation being sustained or gradually decreased with age (Figure 5D). Utilizing pathway analysis, the data indicates that female homozygous ARE-Del mice, as compared to heterozygotes, have more profound alterations of phagosome formation and maturation, and oxidative phosphorylation at 3 weeks old ages (Supplemental Figure 5). Consistently, the gene expression profiles support the model that genes involved in autophagy process were down-regulated in kidney from homozygous ARE-Del mice, while this pathways were not significantly changed in the kidney from heterozygous mice (Figure 5E), thus indicating that levels of IFN-γ can have different effects on host physiology.
Abnormal thymic B cell development and its effect on central T cell tolerance in female homozygous ARE-Del mice.
DE gene profiles showed that there was significant increase of gene expression in the thymus at 12 weeks old age specifically in homozygous ARE-Del mice (Figure 4B). Although pathway analysis did not characterize well the top cannonical pathways in the thymus, possiblly due to the specificity of thymic gene expression, we noticed that thymic B cell markers were changed with a similar pattern of DE gene profiles. Furthermore, CD 19, a surface marker for B cells, gradually increased in the thymus with age, but not other tissues in female homozyougs ARE-Del mice (Figure 6A). Seeing that early B cell receptor signaling was highly suppressed in PBMC, we further compared expression levels of other B cell markers and MHC class II molecules in PBMC and the thymus depending on the genotype at 3, 6 and 12 weeks of age (Figure 6B). Correlated with an early suppressed B cell response in PBMC, the expression of B cell markers and MHC II molecules are much higher in the thymus from female homozygous ARE-Del mice at later ages. Particularly, AIRE, CD40, and CD80 increased along with MHC class II molecules at 12 weeks of age, indicating that abnormal development of thymic B cells may affect central T cell tolerance [21]. We further confirmed the increase of B cell marker (B220) in the thymus by immunohistochemisty (Supplemental Figure 3B). In the integrative analysis of miRNA and mRNA profiles in the thymus, performed by IPA, we noticed that expression levels of significantly changed (p <0.05) miRNA were persistently suppressed and those miRNA that targeted 73 genes were correspondingly increased, matched by age (12 weeks old), in female homozygous ARE-Del mice (Supplemental Table1). The most significantly changed miRNA (p <0.05, fold change cut offs ± 1.5) and target mRNAs were listed in Figure 6C. We performed pathway analysis of 73 miRNA-mRNA target genes by IPA and top cannonical pathways include communication between innate and adaptive immune cells; altered T cell and B cell signaling in rheumatoid arthritis; systemic lupus erythematosus signaling (Figure 6D).
Figure 6.

Correlation between early loss of peripheral B cells and late increase of thymic B cells. (A) Gene expression levels of CD19 comparing homozygous ARE Del mice to control littermates in the PBMCs, kidney, spleen, and thymus at 3, 6, and 12 weeks old. Statistical analysis is performed by t-test, *P<0.05. (B) Heat map of genes for B cell markers and MHC II molecules in PBMCs and thymus according to ages in female homozygous and heterozygous ARE-Del mice compared to control littermates. (C) Heat map of miRNA-mRNA target genes in the thymus. Significantly changed microRNAs in the thymus were selected by p-value (p<0.05) and fold changes (fold change threshold ±1.5). Target genes (21 genes without overlapping) were identified by integration of miRNAs and mRNAs, which significantly changed in the thymus at 12 weeks old, using the IPA’s miRNA target filter. (D) Top cannonical pathways of significantly chanted miRNA-mRNA target genes were analyzed by -log(p-value) and ratio according to IPA. Red shading indicates an increase, green shading indicates a decrease.
DISCUSSION
Emerging studies have focused on the interaction between the gut microbiome alteration (referred as gut dysbiosis hereafter), chronic inflammation and autoimmune diseases [22–27]. Although the association of chronic inflammation with gut dysbiosis and autoimmune diseases is well recognized, the mechanistic interactions are not well understood. Strikingly, our data on homo, hetero and WT mice in diversity and richness of that cecal microbiome (Figure 1A) suggests that chronic expression of IFN-γ has a threshold level to break gut homeostasis. Moreover, gut dysbiosis occurred at early age and is systemically correlated with other pathological mechanistic features found in homozygous ARE-Del mice. In view of the fact that IFN-γ is a critical regulator of gut homeostasis against viral and microbial infection [28], our data indicate that low but chronic expression of IFN-γ has a detrimental role in gut homeostasis depending on the expression level and is pivotal to the pathogenic development of autoimmune diseases.
In addition to gut microbial changes, the metabolic profiles such as amino acid metabolites reflected strong differences between sexes. Consistent with this finding, recent evidence suggests that amino acid metabolism is a major sex-discriminating factor in the liver during fasting in order to provide a fuel to maintain lipid synthesis in mice [29]. We further focused on both sex- and genotype-dependent metabolic processes and found that β-hydroxybutyrate and hexanoylglycine were among the most affected metabolites by both processes (Figure 3B). Given that β-hydroxybutyrate, known as 3-hydroxybutyrate (BHBA), is a indicator for the FAO rate during fasting [30] and hexonoylglycine is also involved in FAO [31], it is expected that FAO plays a critical role in the pathogenetic development of immune responses. Furthermore, the level of acylcarnitine is clearly different between male and female ARE-Del mice. Carnitine is an essential transporter of fatty acid into mitochondria via conversion into acylcarnitine for subsequent mitochondrial fatty acid oxidation in human and mice [32]. As the level of circulating acylcarnitine is positively correlated with the rate of FAO upon fasting condition [33], the different expression level of circulating acylcarnitine in male vs female ARE-Del mice under fasting condition can reflect the activated status of FAO. Due to the fact that FAO is a key metabolic process to modulate inflammatory responses [34, 35], and is modulated by nuclear receptors such as peroxide proliferator-activated receptors (PPARs) and liver X receptors (LXRs), interacting with estrogen receptors [36], these observations point to the significance of nuclear receptor signaling in the development of sex-different inflammatory responses via modulation of lipid metabolic processes in ARE-Del mice.
Here we featured that composition of serum bile acids was dramatically changed in homozygous ARE-Del as compared to control littermates, particularly in the tauro-conjugated bile acid composition. Female mice also have a higher induction than male mice. This feature is consistent with our previous report demonstrating that the increased level of serum total bile acids (TBA) was significantly detectable in homozygous but not heterozygous ARE-Del mice, and this patten is also female-biased. On the basis that the gut microbiome has a critical role in the bile acid metabolism in the gut-liver axis, particularly through nuclear receptor FXR, we further focus on the connection between FXR and bile acid composition being linked to the gut microbiome alteration. Interestingly, the conjugated vs non-conjugated ratio of tauro-β-muricholic acid noticeably increased in female ARE-Del mice (Figure 3G). Tauro-β-muricholic acid is recently identified as a natural competitive and reversible antagonist of FXR [37] and is known to be controlled by the gut microbiome, as shown by the observation that the level of tauro-β-muricholic acid is approximately 10 times higher in bile from germfree than from conventional rats [38]. Since bile acid synthesis is under negative feedback control through activation of FXR, the interplay of the gut microbiome in reducing tauro-β-muricholic acid (a FXR antagonist in this case) can have profound effects on bile acid synthesis via FXR [39, 40]. Given that gene expression profiles of FXR signaling were clearly suppressed in the liver as well as in the PBMC over time period in homozygous ARE-Del mice and predominantly in female mice, our data indicate that FXR plays a critical role in bile acid and lipid metabolism interacting with the gut microbiome in response to chronic expression of IFNγ, eventually affects to liver inflammatory responses and pathological progression of PBC.
Other additional data also support the hypothesis that the gut microbiota modulates host metabolites, which further interact with nuclear receptor signaling and modulate inflammatory responses in ARE-Del mice. One of the notable changes is that tryptophan metabolism is highly altered in homozygous ARE-Del mice, including upregulation of kynurenine and indolelactate as well as suppression of serotonin, N-acetyl tryptophan, and tryptophan (Table 1). Kynurenine is an endogenous ligand of the aryl hydrocarbon receptor (AhR) and indolelactic acid is a bacterial metabolite as a ligand of AhR [41]. Emerging evidence suggests that AhR is a critical modulator for inflammatory responses and intestinal immunity [42, 43] and its activity is linked to several autoimmune diseases [44, 45]. As additional evidence, the plasma level of succinate was differentially changed between male and female ARE-Del mice compared to control littermates (Supplemental Figure 2A). Succinate, involved in the TCA cycle, is known as a metabolic signal in inflammation. Circulating succinate levels increase upon deletion of nuclear receptor4 group A1 (Nr4a1) and consequently induce Th1/Th17 differentiation [46–48]. Regarding that obesity-associated gut microbiota increases circulating levels of succinate [49] and female Nr4a1 deficient mice show increased susceptibility to high fat diet-induced obesity [50], sex-different circulating levels of succinate can be a consequence of the sensitivity to the suppression of Nr4a1. Taken together, our data suggest that nuclear receptors are integrative modulators of lipid metabolism, inflammation, and gut microbial homeostasis as a result of chronic expression of IFN-γ.
Given that nuclear receptors crosstalk with sex-hormone signaling pathways, this feature is also crucial for sex-specific pathogenesis in autoimmune diseases. Particularly, PPARs play a central role in female-biased inflammation and autoimmunity depending on the interaction with sex hormones in immune cells [51, 52], and IFN-γ negatively regulate PPAR gamma expression at the transcription level [53]. Notably, gene expression profiling shows that FXR, LXR and PPAR signaling pathways are among the top canonical pathways detected from the early stage of homozygous ARE Del mice (Figure 4D). As suggested that there is a reciprocal negative crosstalk between LXRs and IFN-γ-stimulated STAT1-dependent transcription [54], and IFN-γ-stimulated STAT1 activation suppresses FXR transcription [55] in macrophages, it is expected that IFN-γ negatively modulates FXR, LXRs, and PPARs expression via the transcriptional suppression of these nuclear receptors. In addition, sex steroid hormones modulate gut microbiota-host interaction and nuclear receptors regulate intestinal inflammatory responses [56, 57]. Our observations support the hypotheses that a sex-different microbial alteration can interact with host nuclear receptor signaling and vice versa. Thereby, IFN-γ targets a variety of nuclear receptor signaling and modulates nuclear receptor signaling directly or indirectly through microbial alterations, resulting in both genotype- as well as sex-biased pathogenesis in autoimmune diseases.
Homozygous ARE-Del mice specifically have a decrease of the splenic B cell population [9] and the loss of splenic marginal zone (MZ) macrophages and B cells [7]. Moreover, the loss of MZBs and antinuclear antibody (ANA) are significantly increased by CLL treatment in heterozygous ARE-Del mice. Given that marginal zone macrophages (MZMs) are required for antigen capture by MZBs [58] and depletion of macrophages by CLL treatment suppresses B cell migration to the follicular perimeter, resulting in the loss of MZBs [59], the current findings support the concept that the antigen-presentation pathways in macrophages are essential for B cell migration and differentiation. The uptake of liposomes is targeted by the mononuclear phagocytic system (MPS), particularly macrophages [60], and liposomal clodronate induces apoptosis when it is released within the phagocytic cells [61]. Regarding that phagocytosis is closely linked to autophagy in its regulatory mechanisms [62, 63], our data reveal that dysregulated autophagy plays a central role in impaired early B cell development and differentiation. Autophagy, a conserved bulk-degradation process of intracellular or extracellular components, centrally regulates antigen presentation and inflammation [64, 65], and polymorphisms of autophagy-related genes have been associated with major autoimmune diseases such as SLE and RA [66, 67] and inflammatory bowel disease, contributing to gut microbial homeostasis [68]. Constantly, deletion of autophagy-related genes (Atg5) dramatically altered the composition of the gut microbiota in a murine model [69]. Thus, we believe that the dysregulated autophagy process, particularly in macrophages has a mechanistic role in the breakdown of B cell self-tolerance mechanisms as well as gut dysbiosis.
We previously reported that adoptive transfer of CD T cells from ARE-Del mice into wild type mice markedly increased pathological phenotypes of PBC as well as the development of germinal center B cells [8, 9], indicating that autoreactive T lymphocytes are key players in autoimmune diseases in ARE-Del mice. In this aspect, we further focus on the immune response in the thymus of homozygous and heterozygous ARE-Del mice. According to the recent report that peripheral B cells migrated to the thymus upon receiving CD40 signaling in the context of cognate interaction with CD4+ T cells and as such can express AIRE and upregulate MHC Class II and CD80 expression [21], our findings imply that B cells, that migrated from the peripheral to thymus can present self-antigens and enhance central T cell tolerance induction. Therefore, our data provides a new insight of how early abnormal macrophage and B cell signaling can affect T cell signaling in the thymus which can break central T cell tolerance sequentially.
In conclusion, we illustrate how these mechanistic features, resulting from chronic IFN-γ expression, interact with each other at both system cellular levels to break immune tolerance (Supplemental Figure 6). Considering that GC B cells are critical for ANA production in lupus-prone mice [70] and homozygous ARE-Del mice have strongly biased GC B cell development [9], understanding the mechanisms to induce GC B cell-dependent autoantibodies will be pivotal for discriminating how host immune system is differently impacted by the modest different expression level of IFN-γ (Supplemental Figure 6A). Although IFN-γ interplays with Type I IFNs that are critical for sex- and genotype-dependent pathological development in ARE-Del mice [9], it is not well understood how IFN-γ increases Type I IFN signaling. According to our findings, we can derive a hypothetical mechanism of how IFN-γ regulates Type I IFNs, thus interfering with autophagy and nuclear receptor signaling at a cellular level (Supplemental Figure 6B). Given that autophagy intersects with Type I and II IFNs and has a suppressive role in Type I IFN activation [71], dysregulated autophagy may play a critical role in Type I IFN production in ARE-Del mice. In support of this hypothesis, abrogation of autophagy induces Type I IFN production as a result of impaired DNA-stimulated STING degradation [72, 73]. Considering the fact that nuclear receptors of PPARα and FXR oppositely modulate FAO as well as autophagy depending on nutrient status in the liver [74, 75] and suppression of PPARγ, LXRs, and RXR signaling by IFN-γ increase intracellular accumulation of cholesterol [76], we hypothesize that suppression of nuclear receptor signaling produces Type I IFNs via altered autophagy and lipid metabolism in ARE-Del mice.
In summary, this study illustrates the etiopathological mechanisms how low but chronic IFN-γ leads to autoimmunity, particularly via host-gut microbiota and metabolic interactions. Interestingly, distinctive mechanistic features induced by differential expression level of IFN-γ as well as sex-specific changes converge into a variety of nuclear receptor signaling pathways, suggesting that nuclear receptor activities are critical to modulate immune responses resulting in the development of autoimmune diseases. Our data also highlight how chronic IFN-γ expression mechanistically reflects chronic inflammation-mediated autoimmune diseases, and as such may be a relevant murine model of chronic inflammation in humans.
Supplementary Material
Supplemenal Figure 1. Microbial alteration in cecum from male and female homozygous ARE-Del mice at 20 weeks old. 20 weeks old. (A) A PCA plot of cecum samples from homozygous ARE-Del mice with control littermates. (B) Relative abundance of genera in homozygous ARE-Del mice (n=8) vs wild-type (n=6). (C) Normalized expression of genera with significance (q<0.1). orange bar: homozygous ARE-Del mice, blue bar: control littermates. (D-E) Bar graphs of significantly changed bacteria at the genus level in female homozygous ARE-Del mice (D) and male homozygous ARE-Del mice (E), compared to control littermates (*p<0.05, **p<0.001).
Supplemental Figure 2. Sex-different expression of sucrose (A), ribulose (B), and kynureine (C) in male and female homozygous ARE-Del mice compared to control littermates (each group, n=5–6). Statistical analysis is performed by Mann Whitney test (*p<0.05, **p<0.001). (D) Diagrams of FXR-mediated hepatic metabolic pathways in male and female homozygous ARE-Del mice. Previous hepatic RNA sequencing data between male and female ARE-Del mice (20 weeks old ages) compared to control littermates were utilized to characterize the transcriptome expression in the liver [8]. Increased hepatic transcriptome expression was marked as a red color in the diagram.
Supplemental Figure 3. Defective early B cell differentiation in the spleen and late increase of B cells in the thymus. (A) Representative image set from flow cytometry analysis of subtypes of B cells in wild type and homozygous ARE-Del mice at 4 weeks old. (B) Representative images of immunohistochemistry staining (B220) of the thymus from female homozygous ARE-Del mice and control littermates at 16 weeks old.
Supplemental Figure 4. Representative gene cluster profiles (a-d) in female ARE-Del homozygotes compared to control littermates. Cluster analysis of DE genes in PBMC was performed using MultiExperiment Viewer (MeV) via the hierachical clustering method. Each plot presents target cells in an order of priority, derived by Enrichr pathway analysis (cell type category: Mouse Gene Atlas) of each clustered genes. Adjusted p-value was converted into -log(p-value) in upper axis and Z-score in lower axis.
Supplemental Figure 5. Homozygote-specific canonical pathways associated with cellular and metabolic functions in macrophages from female ARE-Del mice. Significantly changed genes between female homozygous vs heterozygous ARE-Del mice were overlapped with (A) phagosome formation, (B) phagosome maturation, and (C) oxidative phosphorylation. (red color: up-regulated genes, green color: down-regulated genes)
Supplemenal Figure 6. Proposed mechanisms of homozygote-specific development of autoimmunity in the systemic level (A) and at the cellular level, particullarly in macrophages (B).
Supplemental Table 1. List of miRNA-mRNA taget genes in the thymus. Significantly changed miRNA (p < 0.05) were interacted with DE genes (p < 0.05, Fold change cut off ± 2) in the thymus at 12 weeks old ages, and 73 miRNA-mRNA target genes were listed
Highlights.
Cecal microbiota are distinctively altered by low, but differential levels of IFN-gamma.
Robust sex differences in energy and lipid metabolism in ARE-Del mice, associated with gut microbiome and nuclear receptor signaling.
Early alteration of B cell and nuclear signaling in the peripheral blood are correlated with later inflammation in the kidney in female homozygous ARE-Del mice.
mTOR-autophagy pathway is dysregulated in macrophages at early ages and is an initial pathogenic mechanism in female homozygous ARE-Del mice.
Abnormal thymic B cell development and its effect on central T cell tolerance in female homozygous ARE-Del mice is a model for the development of autoimmune disease
Acknowledgments
We thank Ziaur Rahman and Ogyi Park for their comments on the manuscript. We thank CCR Collaborative Bioinformatics Core at National Cancer Institute for help with genomics and miRNA data analysis. We also thank Charlotte Hanson and Michael Sanford for help with technical assistance. This research was supported by the Intramural Research Program of the NIH, Center for Cancer Research, National Cancer Institute. The authors declare no competing financial interests.
Financial Support: This work has been funded with federal funds from the National Cancer Institute, National Institutes of Health, Intramural Research Program, and supported in part (MEG) by NIH grant DK123262.
Footnotes
Publisher's Disclaimer: This is a PDF file of an unedited manuscript that has been accepted for publication. As a service to our customers we are providing this early version of the manuscript. The manuscript will undergo copyediting, typesetting, and review of the resulting proof before it is published in its final form. Please note that during the production process errors may be discovered which could affect the content, and all legal disclaimers that apply to the journal pertain.
References.
- [1].Hunter P. The inflammation theory of disease. The growing realization that chronic inflammation is crucial in many diseases opens new avenues for treatment. EMBO reports, 2012;13:968–70. [DOI] [PMC free article] [PubMed] [Google Scholar]
- [2].Liu CH, Abrams ND, Carrick DM, Chander P, Dwyer J, Hamlet MRJ et al. Biomarkers of chronic inflammation in disease development and prevention: challenges and opportunities. Nature immunology, 2017;18:1175–80. [DOI] [PubMed] [Google Scholar]
- [3].Ercolini AM, Miller SD. The role of infections in autoimmune disease. Clinical and experimental immunology, 2009;155:1–15. [DOI] [PMC free article] [PubMed] [Google Scholar]
- [4].Samuel CE. Antiviral actions of interferons. Clinical microbiology reviews, 2001;14:778–809, table of contents. [DOI] [PMC free article] [PubMed] [Google Scholar]
- [5].Meyer O. Interferons and autoimmune disorders. Joint, bone, spine : revue du rhumatisme, 2009;76:464–73. [DOI] [PubMed] [Google Scholar]
- [6].Hall JC, Casciola-Rosen L, Berger AE, Kapsogeorgou EK, Cheadle C, Tzioufas AG et al. Precise probes of type II interferon activity define the origin of interferon signatures in target tissues in rheumatic diseases. Proceedings of the National Academy of Sciences of the United States of America, 2012;109:17609–14. [DOI] [PMC free article] [PubMed] [Google Scholar]
- [7].Hodge DL, Berthet C, Coppola V, Kastenmuller W, Buschman MD, Schaughency PM et al. IFN-gamma AU-rich element removal promotes chronic IFN-gamma expression and autoimmunity in mice. Journal of autoimmunity, 2014;53:33–45. [DOI] [PMC free article] [PubMed] [Google Scholar]
- [8].Bae HR, Leung PS, Tsuneyama K, Valencia JC, Hodge DL, Kim S et al. Chronic expression of interferon-gamma leads to murine autoimmune cholangitis with a female predominance. Hepatology, 2016;64:1189–201. [DOI] [PMC free article] [PubMed] [Google Scholar]
- [9].Bae HR, Hodge DL, Yang GX, Leung PSC, Chodisetti SB, Valencia JC et al. The interplay of type I and type II interferons in murine autoimmune cholangitis as a basis for sex-biased autoimmunity. Hepatology, 2018;67:1408–19. [DOI] [PMC free article] [PubMed] [Google Scholar]
- [10].Ngo ST, Steyn FJ, McCombe PA. Gender differences in autoimmune disease. Frontiers in neuroendocrinology, 2014;35:347–69. [DOI] [PubMed] [Google Scholar]
- [11].Cirillo E, Parnell LD, Evelo CT. A Review of Pathway-Based Analysis Tools That Visualize Genetic Variants. Frontiers in genetics, 2017;8:174. [DOI] [PMC free article] [PubMed] [Google Scholar]
- [12].Miller RA, Ehrhart F, Eijssen LMT, Slenter DN, Curfs LMG, Evelo CT et al. Beyond Pathway Analysis: Identification of Active Subnetworks in Rett Syndrome. Frontiers in genetics, 2019;10:59. [DOI] [PMC free article] [PubMed] [Google Scholar]
- [13].Piccirillo CA, Bjur E, Topisirovic I, Sonenberg N, Larsson O. Translational control of immune responses: from transcripts to translatomes. Nature immunology, 2014;15:503–11. [DOI] [PubMed] [Google Scholar]
- [14].Modifying immunity. Nature immunology, 2014;15:483. [DOI] [PubMed] [Google Scholar]
- [15].Caporaso JG, Kuczynski J, Stombaugh J, Bittinger K, Bushman FD, Costello EK et al. QIIME allows analysis of high-throughput community sequencing data. Nat Methods, 2010;7:335–6. [DOI] [PMC free article] [PubMed] [Google Scholar]
- [16].Callahan BJ, McMurdie PJ, Rosen MJ, Han AW, Johnson AJ, Holmes SP. DADA2: High-resolution sample inference from Illumina amplicon data. Nat Methods, 2016;13:581–3. [DOI] [PMC free article] [PubMed] [Google Scholar]
- [17].Quast C, Pruesse E, Yilmaz P, Gerken J, Schweer T, Yarza P et al. The SILVA ribosomal RNA gene database project: improved data processing and web-based tools. Nucleic Acids Res, 2013;41:D590–6. [DOI] [PMC free article] [PubMed] [Google Scholar]
- [18].Evans AM, DeHaven CD, Barrett T, Mitchell M, Milgram E. Integrated, nontargeted ultrahigh performance liquid chromatography/electrospray ionization tandem mass spectrometry platform for the identification and relative quantification of the small-molecule complement of biological systems. Anal Chem, 2009;81:6656–67. [DOI] [PubMed] [Google Scholar]
- [19].Sharon G, Garg N, Debelius J, Knight R, Dorrestein PC, Mazmanian SK. Specialized metabolites from the microbiome in health and disease. Cell metabolism, 2014;20:719–30. [DOI] [PMC free article] [PubMed] [Google Scholar]
- [20].Zhang LS, Davies SS. Microbial metabolism of dietary components to bioactive metabolites: opportunities for new therapeutic interventions. Genome medicine, 2016;8:46. [DOI] [PMC free article] [PubMed] [Google Scholar]
- [21].Yamano T, Nedjic J, Hinterberger M, Steinert M, Koser S, Pinto S et al. Thymic B Cells Are Licensed to Present Self Antigens for Central T Cell Tolerance Induction. Immunity, 2015;42:1048–61. [DOI] [PubMed] [Google Scholar]
- [22].Hevia A, Milani C, Lopez P, Cuervo A, Arboleya S, Duranti S et al. Intestinal dysbiosis associated with systemic lupus erythematosus. mBio, 2014;5:e01548–14. [DOI] [PMC free article] [PubMed] [Google Scholar]
- [23].Mandl T, Marsal J, Olsson P, Ohlsson B, Andreasson K. Severe intestinal dysbiosis is prevalent in primary Sjogren’s syndrome and is associated with systemic disease activity. Arthritis research & therapy, 2017;19:237. [DOI] [PMC free article] [PubMed] [Google Scholar]
- [24].Tang R, Wei Y, Li Y, Chen W, Chen H, Wang Q et al. Gut microbial profile is altered in primary biliary cholangitis and partially restored after UDCA therapy. Gut, 2018;67:534–41. [DOI] [PubMed] [Google Scholar]
- [25].Chen J, Chia N, Kalari KR, Yao JZ, Novotna M, Paz Soldan MM et al. Multiple sclerosis patients have a distinct gut microbiota compared to healthy controls. Scientific reports, 2016;6:28484. [DOI] [PMC free article] [PubMed] [Google Scholar]
- [26].Luo XM, Edwards MR, Mu Q, Yu Y, Vieson MD, Reilly CM et al. Gut Microbiota in Human Systemic Lupus Erythematosus and a Mouse Model of Lupus. Applied and environmental microbiology, 2018;84. [DOI] [PMC free article] [PubMed] [Google Scholar]
- [27].Chen W, Wei Y, Xiong A, Li Y, Guan H, Wang Q et al. Comprehensive Analysis of Serum and Fecal Bile Acid Profiles and Interaction with Gut Microbiota in Primary Biliary Cholangitis. Clinical reviews in allergy & immunology, 2019. [DOI] [PubMed] [Google Scholar]
- [28].Ost KS, Round JL. A Few Good Commensals: Gut Microbes Use IFN-gamma to Fight Salmonella. Immunity, 2017;46:977–9. [DOI] [PubMed] [Google Scholar]
- [29].Della Torre S, Mitro N, Meda C, Lolli F, Pedretti S, Barcella M et al. Short-Term Fasting Reveals Amino Acid Metabolism as a Major Sex-Discriminating Factor in the Liver. Cell metabolism, 2018;28:256–67 e5. [DOI] [PMC free article] [PubMed] [Google Scholar]
- [30].Grabacka M, Pierzchalska M, Dean M, Reiss K. Regulation of Ketone Body Metabolism and the Role of PPARalpha. International journal of molecular sciences, 2016;17. [DOI] [PMC free article] [PubMed] [Google Scholar]
- [31].Wajner M, Amaral AU. Mitochondrial dysfunction in fatty acid oxidation disorders: insights from human and animal studies. Bioscience reports, 2015;36:e00281. [DOI] [PMC free article] [PubMed] [Google Scholar]
- [32].Houten SM, Wanders RJ. A general introduction to the biochemistry of mitochondrial fatty acid beta-oxidation. Journal of inherited metabolic disease, 2010;33:469–77. [DOI] [PMC free article] [PubMed] [Google Scholar]
- [33].Makrecka-Kuka M, Sevostjanovs E, Vilks K, Volska K, Antone U, Kuka J et al. Plasma acylcarnitine concentrations reflect the acylcarnitine profile in cardiac tissues. Scientific reports, 2017;7:17528. [DOI] [PMC free article] [PubMed] [Google Scholar]
- [34].Malandrino MI, Fucho R, Weber M, Calderon-Dominguez M, Mir JF, Valcarcel L et al. Enhanced fatty acid oxidation in adipocytes and macrophages reduces lipid-induced triglyceride accumulation and inflammation. American journal of physiology Endocrinology and metabolism, 2015;308:E756–69. [DOI] [PubMed] [Google Scholar]
- [35].Namgaladze D, Brune B. Macrophage fatty acid oxidation and its roles in macrophage polarization and fatty acid-induced inflammation. Biochimica et biophysica acta, 2016;1861:1796–807. [DOI] [PubMed] [Google Scholar]
- [36].Alaynick WA. Nuclear receptors, mitochondria and lipid metabolism. Mitochondrion, 2008;8:329–37. [DOI] [PMC free article] [PubMed] [Google Scholar]
- [37].Sayin SI, Wahlstrom A, Felin J, Jantti S, Marschall HU, Bamberg K et al. Gut microbiota regulates bile acid metabolism by reducing the levels of tauro-beta-muricholic acid, a naturally occurring FXR antagonist. Cell metabolism, 2013;17:225–35. [DOI] [PubMed] [Google Scholar]
- [38].Wostmann BS. Intestinal bile acids and cholesterol absorption in the germfree rat. J Nutr, 1973;103:982–90. [DOI] [PubMed] [Google Scholar]
- [39].Wahlstrom A. Outside the liver box: The gut microbiota as pivotal modulator of liver diseases. Biochim Biophys Acta Mol Basis Dis, 2019;1865:912–9. [DOI] [PubMed] [Google Scholar]
- [40].Wahlstrom A, Sayin SI, Marschall HU, Backhed F. Intestinal Crosstalk between Bile Acids and Microbiota and Its Impact on Host Metabolism. Cell metabolism, 2016;24:41–50. [DOI] [PubMed] [Google Scholar]
- [41].Gao J, Xu K, Liu H, Liu G, Bai M, Peng C et al. Impact of the Gut Microbiota on Intestinal Immunity Mediated by Tryptophan Metabolism. Frontiers in cellular and infection microbiology, 2018;8:13. [DOI] [PMC free article] [PubMed] [Google Scholar]
- [42].Lamas B, Natividad JM, Sokol H. Aryl hydrocarbon receptor and intestinal immunity. Mucosal immunology, 2018;11:1024–38. [DOI] [PubMed] [Google Scholar]
- [43].Shinde R, McGaha TL. The Aryl Hydrocarbon Receptor: Connecting Immunity to the Microenvironment. Trends in immunology, 2018;39:1005–20. [DOI] [PMC free article] [PubMed] [Google Scholar]
- [44].Crunkhorn S. Autoimmune disease: Aryl hydrocarbon receptor suppresses inflammation. Nature reviews Drug discovery, 2018;17:470. [DOI] [PubMed] [Google Scholar]
- [45].Hao N, Whitelaw ML. The emerging roles of AhR in physiology and immunity. Biochemical pharmacology, 2013;86:561–70. [DOI] [PubMed] [Google Scholar]
- [46].Wang LM, Zhang Y, Li X, Zhang ML, Zhu L, Zhang GX et al. Nr4a1 plays a crucial modulatory role in Th1/Th17 cell responses and CNS autoimmunity. Brain, behavior, and immunity, 2018;68:44–55. [DOI] [PubMed] [Google Scholar]
- [47].Koenis DS, Medzikovic L, van Loenen PB, van Weeghel M, Huveneers S, Vos M et al. Nuclear Receptor Nur77 Limits the Macrophage Inflammatory Response through Transcriptional Reprogramming of Mitochondrial Metabolism. Cell reports, 2018;24:2127–40 e7. [DOI] [PMC free article] [PubMed] [Google Scholar]
- [48].Tannahill GM, Curtis AM, Adamik J, Palsson-McDermott EM, McGettrick AF, Goel G et al. Succinate is an inflammatory signal that induces IL-1beta through HIF-1alpha. Nature, 2013;496:238–42. [DOI] [PMC free article] [PubMed] [Google Scholar]
- [49].Serena C, Ceperuelo-Mallafre V, Keiran N, Queipo-Ortuno MI, Bernal R, Gomez-Huelgas R et al. Elevated circulating levels of succinate in human obesity are linked to specific gut microbiota. The ISME journal, 2018;12:1642–57. [DOI] [PMC free article] [PubMed] [Google Scholar]
- [50].Perez-Sieira S, Martinez G, Porteiro B, Lopez M, Vidal A, Nogueiras R et al. Female Nur77-deficient mice show increased susceptibility to diet-induced obesity. PloS one, 2013;8:e53836. [DOI] [PMC free article] [PubMed] [Google Scholar]
- [51].Park HJ, Choi JM. Sex-specific regulation of immune responses by PPARs. Experimental & molecular medicine, 2017;49:e364. [DOI] [PMC free article] [PubMed] [Google Scholar]
- [52].Park HJ, Park HS, Lee JU, Bothwell AL, Choi JM. Gender-specific differences in PPARgamma regulation of follicular helper T cell responses with estrogen. Scientific reports, 2016;6:28495. [DOI] [PMC free article] [PubMed] [Google Scholar]
- [53].Waite KJ, Floyd ZE, Arbour-Reily P, Stephens JM. Interferon-gamma-induced regulation of peroxisome proliferator-activated receptor gamma and STATs in adipocytes. The Journal of biological chemistry, 2001;276:7062–8. [DOI] [PubMed] [Google Scholar]
- [54].Pascual-Garcia M, Rue L, Leon T, Julve J, Carbo JM, Matalonga J et al. Reciprocal negative cross-talk between liver X receptors (LXRs) and STAT1: effects on IFN-gamma-induced inflammatory responses and LXR-dependent gene expression. Journal of immunology, 2013;190:6520–32. [DOI] [PubMed] [Google Scholar]
- [55].Renga B, Migliorati M, Mencarelli A, Fiorucci S. Reciprocal regulation of the bile acid-activated receptor FXR and the interferon-gamma-STAT-1 pathway in macrophages. Biochimica et biophysica acta, 2009;1792:564–73. [DOI] [PubMed] [Google Scholar]
- [56].Klepsch V, Moschen AR, Tilg H, Baier G, Hermann-Kleiter N. Nuclear Receptors Regulate Intestinal Inflammation in the Context of IBD. Frontiers in immunology, 2019;10:1070. [DOI] [PMC free article] [PubMed] [Google Scholar]
- [57].Garcia-Gomez E, Gonzalez-Pedrajo B, Camacho-Arroyo I. Role of sex steroid hormones in bacterial-host interactions. BioMed research international, 2013;2013:928290. [DOI] [PMC free article] [PubMed] [Google Scholar]
- [58].You Y, Myers RC, Freeberg L, Foote J, Kearney JF, Justement LB et al. Marginal zone B cells regulate antigen capture by marginal zone macrophages. Journal of immunology, 2011;186:2172–81. [DOI] [PMC free article] [PubMed] [Google Scholar]
- [59].Nikbakht N, Shen S, Manser T. Cutting edge: Macrophages are required for localization of antigen-activated B cells to the follicular perimeter and the subsequent germinal center response. Journal of immunology, 2013;190:4923–7. [DOI] [PMC free article] [PubMed] [Google Scholar]
- [60].Kelly C, Jefferies C, Cryan SA. Targeted liposomal drug delivery to monocytes and macrophages. Journal of drug delivery, 2011;2011:727241. [DOI] [PMC free article] [PubMed] [Google Scholar]
- [61].van Rooijen N, Sanders A, van den Berg TK. Apoptosis of macrophages induced by liposome-mediated intracellular delivery of clodronate and propamidine. Journal of immunological methods, 1996;193:93–9. [DOI] [PubMed] [Google Scholar]
- [62].Bonilla DL, Bhattacharya A, Sha Y, Xu Y, Xiang Q, Kan A et al. Autophagy regulates phagocytosis by modulating the expression of scavenger receptors. Immunity, 2013;39:537–47. [DOI] [PMC free article] [PubMed] [Google Scholar]
- [63].Oczypok EA, Oury TD, Chu CT. It’s a cell-eat-cell world: autophagy and phagocytosis. The American journal of pathology, 2013;182:612–22. [DOI] [PMC free article] [PubMed] [Google Scholar]
- [64].Crotzer VL, Blum JS. Autophagy and its role in MHC-mediated antigen presentation. Journal of immunology, 2009;182:3335–41. [DOI] [PMC free article] [PubMed] [Google Scholar]
- [65].Netea-Maier RT, Plantinga TS, van de Veerdonk FL, Smit JW, Netea MG. Modulation of inflammation by autophagy: Consequences for human disease. Autophagy, 2016;12:245–60. [DOI] [PMC free article] [PubMed] [Google Scholar]
- [66].Pierdominici M, Vomero M, Barbati C, Colasanti T, Maselli A, Vacirca D et al. Role of autophagy in immunity and autoimmunity, with a special focus on systemic lupus erythematosus. FASEB journal : official publication of the Federation of American Societies for Experimental Biology, 2012;26:1400–12. [DOI] [PubMed] [Google Scholar]
- [67].Wu DJ, Adamopoulos IE. Autophagy and autoimmunity. Clinical immunology, 2017;176:55–62. [DOI] [PMC free article] [PubMed] [Google Scholar]
- [68].Baxt LA, Xavier RJ. Role of Autophagy in the Maintenance of Intestinal Homeostasis. Gastroenterology, 2015;149:553–62. [DOI] [PMC free article] [PubMed] [Google Scholar]
- [69].Yang L, Liu C, Zhao W, He C, Ding J, Dai R et al. Impaired Autophagy in Intestinal Epithelial Cells Alters Gut Microbiota and Host Immune Responses. Applied and environmental microbiology, 2018;84. [DOI] [PMC free article] [PubMed] [Google Scholar]
- [70].DeFranco AL. Germinal centers and autoimmune disease in humans and mice. Immunology and cell biology, 2016;94:918–24. [DOI] [PMC free article] [PubMed] [Google Scholar]
- [71].Deretic V, Levine B. Autophagy balances inflammation in innate immunity. Autophagy, 2018;14:243–51. [DOI] [PMC free article] [PubMed] [Google Scholar]
- [72].Prabakaran T, Bodda C, Krapp C, Zhang BC, Christensen MH, Sun C et al. Attenuation of cGAS-STING signaling is mediated by a p62/SQSTM1-dependent autophagy pathway activated by TBK1. The EMBO journal, 2018;37. [DOI] [PMC free article] [PubMed] [Google Scholar]
- [73].Kato Y, Park J, Takamatsu H, Konaka H, Aoki W, Aburaya S et al. Apoptosis-derived membrane vesicles drive the cGAS-STING pathway and enhance type I IFN production in systemic lupus erythematosus. Annals of the rheumatic diseases, 2018;77:1507–15. [DOI] [PMC free article] [PubMed] [Google Scholar]
- [74].Lee JM, Wagner M, Xiao R, Kim KH, Feng D, Lazar MA et al. Nutrient-sensing nuclear receptors coordinate autophagy. Nature, 2014;516:112–5. [DOI] [PMC free article] [PubMed] [Google Scholar]
- [75].Preidis GA, Kim KH, Moore DD. Nutrient-sensing nuclear receptors PPARalpha and FXR control liver energy balance. The Journal of clinical investigation, 2017;127:1193–201. [DOI] [PMC free article] [PubMed] [Google Scholar]
- [76].Remmerie A, Scott CL. Macrophages and lipid metabolism. Cellular immunology, 2018;330:27–42. [DOI] [PMC free article] [PubMed] [Google Scholar]
Associated Data
This section collects any data citations, data availability statements, or supplementary materials included in this article.
Supplementary Materials
Supplemenal Figure 1. Microbial alteration in cecum from male and female homozygous ARE-Del mice at 20 weeks old. 20 weeks old. (A) A PCA plot of cecum samples from homozygous ARE-Del mice with control littermates. (B) Relative abundance of genera in homozygous ARE-Del mice (n=8) vs wild-type (n=6). (C) Normalized expression of genera with significance (q<0.1). orange bar: homozygous ARE-Del mice, blue bar: control littermates. (D-E) Bar graphs of significantly changed bacteria at the genus level in female homozygous ARE-Del mice (D) and male homozygous ARE-Del mice (E), compared to control littermates (*p<0.05, **p<0.001).
Supplemental Figure 2. Sex-different expression of sucrose (A), ribulose (B), and kynureine (C) in male and female homozygous ARE-Del mice compared to control littermates (each group, n=5–6). Statistical analysis is performed by Mann Whitney test (*p<0.05, **p<0.001). (D) Diagrams of FXR-mediated hepatic metabolic pathways in male and female homozygous ARE-Del mice. Previous hepatic RNA sequencing data between male and female ARE-Del mice (20 weeks old ages) compared to control littermates were utilized to characterize the transcriptome expression in the liver [8]. Increased hepatic transcriptome expression was marked as a red color in the diagram.
Supplemental Figure 3. Defective early B cell differentiation in the spleen and late increase of B cells in the thymus. (A) Representative image set from flow cytometry analysis of subtypes of B cells in wild type and homozygous ARE-Del mice at 4 weeks old. (B) Representative images of immunohistochemistry staining (B220) of the thymus from female homozygous ARE-Del mice and control littermates at 16 weeks old.
Supplemental Figure 4. Representative gene cluster profiles (a-d) in female ARE-Del homozygotes compared to control littermates. Cluster analysis of DE genes in PBMC was performed using MultiExperiment Viewer (MeV) via the hierachical clustering method. Each plot presents target cells in an order of priority, derived by Enrichr pathway analysis (cell type category: Mouse Gene Atlas) of each clustered genes. Adjusted p-value was converted into -log(p-value) in upper axis and Z-score in lower axis.
Supplemental Figure 5. Homozygote-specific canonical pathways associated with cellular and metabolic functions in macrophages from female ARE-Del mice. Significantly changed genes between female homozygous vs heterozygous ARE-Del mice were overlapped with (A) phagosome formation, (B) phagosome maturation, and (C) oxidative phosphorylation. (red color: up-regulated genes, green color: down-regulated genes)
Supplemenal Figure 6. Proposed mechanisms of homozygote-specific development of autoimmunity in the systemic level (A) and at the cellular level, particullarly in macrophages (B).
Supplemental Table 1. List of miRNA-mRNA taget genes in the thymus. Significantly changed miRNA (p < 0.05) were interacted with DE genes (p < 0.05, Fold change cut off ± 2) in the thymus at 12 weeks old ages, and 73 miRNA-mRNA target genes were listed