Abstract
In December 2019, the outbreak of viral disease labeled as Novel Coronavirus started in Wuhan, China, which later came to be known as Covid-19. The disease has spread in almost every part of the world and has been declared a global pandemic in March 2020 by World Health Organization (WHO). The corona virus outbreak has emerged as one of the deadliest pandemics of all time in human history. The ongoing pandemic of COVID-19 has forced several countries of the world to observe complete lockdown forcing people to live in their homes. India also faced the phase of total lockdown for 21 days (in first phase) to avoid the spread of coronavirus to the maximum possible extent. This lockdown impacted the pollution levels of environment and improved air and water quality in the short span owing to very less human activities. The present work scientifically analyzed the available data for primary air pollutants (PM2.5, NO2, SO2 and CO) from two major Indian cities, Lucknow and New Delhi. The analysis was based on air quality data for before lockdown and after lockdown (first phase of 21 days) periods of 21 days each. The results showed significant decline in the studied air pollution indices and demonstrated improvement of air quality in both the cities. The major impact was seen in the levels of PM2.5, NO2 and CO. The levels of SO2 showed less significant decline during the lockdown period. The results are presented with future perspectives to mitigate air pollution in near future by adopting the short and periodical lockdown as a tool.
Electronic supplementary material
The online version of this article (10.1007/s00128-020-02895-w) contains supplementary material, which is available to authorized users.
Keywords: Air pollution, Air quality, COVID-19, Lockdown, PM2.5
Since the first case of coronavirus, named as COVID-19, in Wuhan, China (Zhu et al. 2020), COVID-19 became a pandemic in a short span of time. As on May 15, 2020 (2.00 am; Indian Standard Time; UTC + 05:30), total 4,258,666 coronavirus cases and 294,190 deaths of coronavirus patients have been reported from 216 countries of the world (WHO 2020). India is hugely populated country with a population of 1.38 billion as of March, 2020, which is second most in the world (Ministry of Statistics and Programme Implementation 2020). The problem of huge population is worsened by the fact this population lives in a country, which is 7th largest in the world (Shabudeen 2011) entailing that the density of people residing in per square km area is high. Indian cities are hugely populated with New Delhi ranking 2nd most populated city in the world (World Urbanization Prospects 2020). Further, Indian healthcare system is also poor and lacks sophisticated facilities and specialized doctors especially in small towns and villages (Ramani and Mavalankar 2006; Banerjee et al. 2008). India, therefore, lies at huge risk from current pandemic of COVID-19. As a safety precautionary measure, Prime Minister of India, Shri Narendra Modi, took an extremely bold decision and declared 21 days complete lockdown in India from midnight of 24 March (25 March, 2020–14 April, 2020). Earlier, “Janta Curfew” (a sort of complete lockdown; maintained by the public for the public; Fig S1, S2) was performed on 22nd March, 2020 in India. Such a lockdown was enforced in China in Wuhan, China on 23rd January, 2020 and was lifted on 8th April, 2020 (total 76 days). This lockdown helped China to reduce the number of infections to close to zero.
During past 3 months, since coronavirus outbreak began, numerous studies have examined COVID-19 infection. A lot of research on the nature of its spread, the mechanisms of its transfer from human to human, the genome of COVID-19, the mechanisms of its infection in human cells and its effects on various tissues has been published (Chen et al. 2020; Guo et al. 2019; Baig et al. 2020; Gu et al. 2020; Driggin et al. 2020). It is apparent that the lockdown and consequent reduced mobility of people and industrial and almost all other human operations would have also impacted air pollution. In fact, several studies have been published during the last few weeks for Europe, China, Latin America (He et al. 2020; Ma et al. 2020; Wang et al. 2020; Nakada and Urban 2020). Indian lockdown is first such event locking almost 1.38 billion people in their homes and closing down almost all activities in such a large country. In India also, a few studies have shown the positive impact of the lockdown on air and water pollution (Sharma et al. 2020; Mahato et al. 2020; Gautam 2020).This article scientifically examines the impact of lockdown on air pollution indices in two major cities of India, New Delhi and Lucknow. New Delhi is the capital of India with an area of 1448 km2 and total population of 21.8 million. Apart from this, seven other cities around New Delhi namely Noida, Ghaziabad, Karnal, Faridabad, Greater Noida, Meerut and Gurgaon make a huge cluster and contribute to human and industrial activities. Lucknow is the capital of Uttar Pradesh with an area of 349 km2 and total population of 2.82 million. Both the cities are known to experience severe pollution load days during early winter for the past 2–3 years. During 05 November, 2019, the air quality index (AQI) in New Delhi and Lucknow ranged from 283–500 to 267–486, respectively, which was poor (Unhealthy) to severe as per National Air Quality Index (NAQI 2014) (Table S2). The present study analyzed air pollution indices for before and after lockdown periods (21 days each) for the two cities.
Materials and Methods
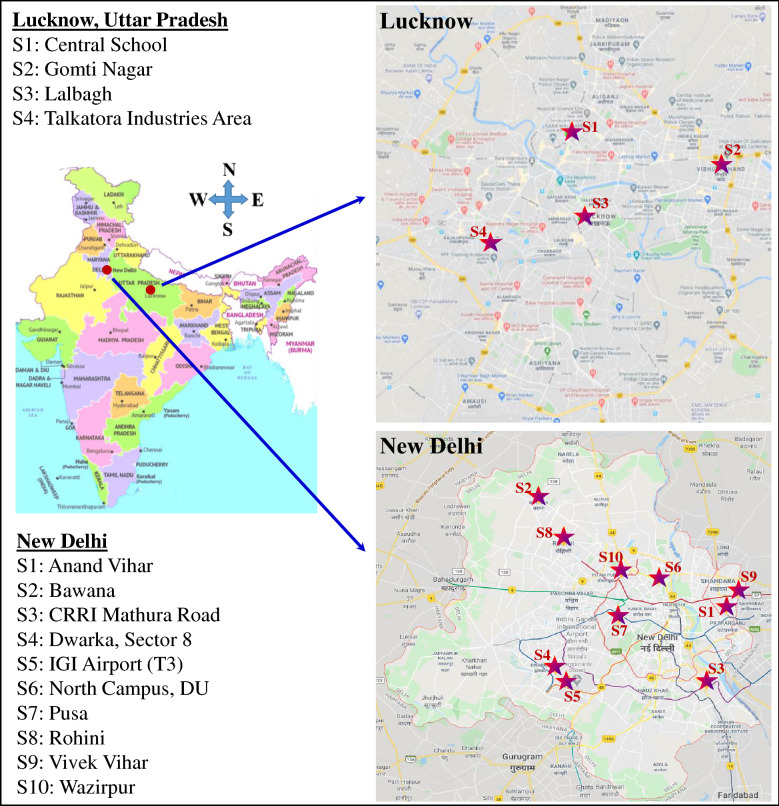
Our present study used a comprehensive air quality data in two cities of India, Lucknow and New Delhi. Air quality data were collected from fourteen sites viz. Central School, Gomti Nagar, Lalbagh and Talkatora of Lucknow city and Anand Vihar, Bawana, CRRI Mathura Road, Dwarka-Sector 8, IGI Airport (T3), DU North Campus, Pusa, Rohini, Vivek Vihar and Wazirpur of Delhi city (Fig. 1). The main concern of the paper was to analyze the trend of concentration of PM2.5, SO2, NO2 and CO at different sites for before (01/02/2020 to 21/02/2020) and after lock down (25/03/2020 to 14/04/2020) periods of 21 days (first phase of lockdown in India). All the data were collected form National Air Quality Index, Central Pollution Control Board of India, website (CPCB 2020).
Fig. 1.
Location of the study area in Lucknow (UP) and New Delhi, India
The air quality index (AQI) is defined as ratios of the measured concentration of the atmospheric pollutants to their standard prescribe values (Deep et al. 2019; Joshi and Mahadev 2011). Mathematically, the AQI can be evaluated by using following equation for primary pollutants, Eq. 1:
| 1 |
The sPM2.5, sSO2, sNO2 are ambient air quality standards as given by the Central Pollution Control Board of India (CPCB) and PM2.5, SO2 and NO2 represent the actual observational values of pollutants (Punith and Nagarajappa 2017). The AQI was calculated by using mass concentration of these three primary pollutants (PM2.5, SO2 and NO2) for all specified locations. The high AQI values represent a higher level of atmospheric pollutants at the monitoring site. According to Deep et al. (2019); Guttikunda et al. (2010) and NAQI (2014), the AQI scale can be divided into six different categories as per the range and associated health impacts (Table S2).
To understand the influence of long-range transportation of atmospheric pollutants at both monitoring zones, the air mass back trajectory analysis was also performed. The air mass back trajectory was extracted from National Oceanic and Atmospheric Administration (NOAA) Air Resources Laboratory (ARL) Hybrid Single-Particle Lagrangian Integrated Trajectory (HYSPLIT) model (Stein et al. 2015). The 5 days air mass back trajectories were calculated for local time 12:00 at the elevation of 800 m from mean sea levels (He et al. 2003; Rozwadowska et al. 2010) for both cities.
Results and Discussion
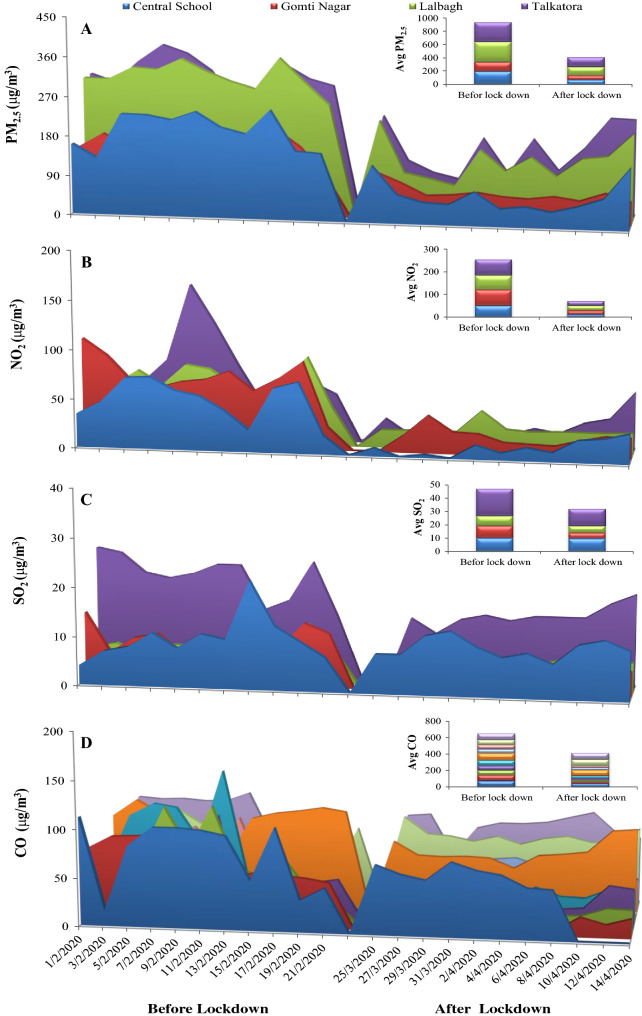
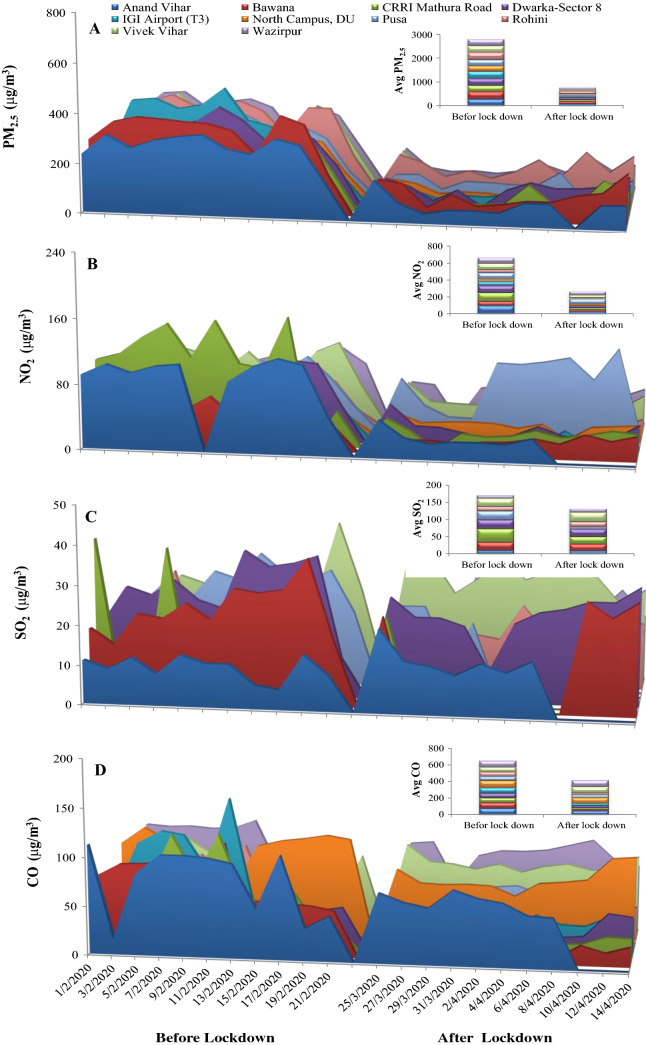
The data of air quality parameters i.e. PM2.5, NO2, SO2 and CO were taken for four locations of Lucknow and ten locations of New Delhi for before lockdown (01/02/2020 to 21/02/2020) and after lockdown (25/03/2020 to 14/04/2020) periods (Tables S1A, B). The level of PM2.5 varied from avg 48–369 μg/m3in four locations of Lucknow before lockdown. On 25th March, 2020, PM2.5 level was the lowest 105 μg/m3at Gomti Nagar and highest 217 μg/m3at Talkatora. On 30th March 2020, PM2.5 levels declined to 58 and 76 μg/m3, respectively in these areas while to 54 and 222 μg/m3, respectively on 14th April, 2020 (Fig. 2a). In New Delhi, the PM2.5 level ranged from 85 to 456 μg/m3 during before lockdown period in different locations. On 25th March, 2020 the range of PM2.5 was 76 to 164 μg/m3 and on 14th April, 2020, it was 47 to 204 μg/m3 (Fig. 3a).
Fig. 2.
a–d The effects of lockdown before and after PM2.5, NO2, SO2 and CO level at Lucknow city
Fig. 3.
a–d The effects of lockdown before and after PM2.5, NO2, SO2 and CO level at Lucknow and Delhi city
The range of NO2 before and after lockdown period in Lucknow was 22–158 μg/m3 and 3–59 μg/m3, respectively denoting a significant decline (Fig. 2b). In New Delhi also, before and after lockdown levels of NO2 were significantly different. Before lockdown, NO2 ranged from 4 to 158 μg/m3 while after lockdown, it ranged from 9 to 112 μg/m3. The low value of 4 μg/m3 in New Delhi before lockdown was from Indira Gandhi International Airport Terminal-3 (Fig. 3b). Thus, even before lockdown, some highly maintained and clean areas had low pollution levels. The levels of SO2, however, did not show much change before and after lockdown in both Lucknow and New Delhi (Figs. 2c, 3c). The level of CO showed decline from 20–199 μg/m3 to 3–55 μg/m3 in Lucknow while from 15–150 μg/m3 to 5–98 μg/m3 in New Delhi (Figs. 2d, 3d).
The average and median (Fig S3) values of all these four parameters were also calculated for both the cities for before and after lockdown period (21 days). The minimum average value of PM2.5 was 140.54 μg/m3 (Gomti Nagar) and 65.09 μg/m3 (Gomti Nagar) before and after lockdown, respectively in Lucknow. For New Delhi, the minimum average values of PM2.5 were 225.63 μg/m3 (North Campus, DU) and 43.18 μg/m3 (North Campus, DU) before and after lockdown, respectively. In case of NO2 the average value was 50.90 μg/m3 (before) and 11.82 μg/m3 (after) in Central School, Lucknow and 28.0 μg/m3 (North Campus DU) and 4.36 μg/m3 (IGI Airport) in New Delhi before and after lockdown, respectively. The minimum average value of SO2 was found to be 7.18 μg/m3 (Central School) and 4.18 μg/m3 (Talkatora) in Lucknow before and after lockdown, respectively. The values of SO2 were 9.90 μg/m3 (Anand Vihar) and 6.0 μg/m3 (Pusa) in New Delhi before and after lockdown, respectively. In case of CO, the minimum average value was 40.0 μg/m3 (Gomati Nagar) and 35 μg/m3 (Gomti Nagar) in Lucknow and 49.91 μg/m3 (Pusa) and 17.18 μg/m3 (Bawana) in New Delhi before and after lockdown, respectively. These 21 days average values of all four major air contaminants for before and after lockdown periods clearly indicate the significant reduction in the concentration of primary air pollutants.
Hence, the trend analysis depicted a decline in air pollution indices in both the cities. However, some areas, like residential colonies, airport terminals and official localities, where the cleanliness is maintained in much better way and vehicular load is less, the pollution was found to be low even during normal phase. Hence, the minimum levels do not clearly indicate the extent of decline in overall pollution across the city during lockdown phase. PM2.5 are submicron size particles, which affect health of people through congestion in lungs (Ma et al. 2017; Li et al. 2018). NO2, SO2 and CO affects human health severely and cause respiratory tract illness, asthma exacerbations and decreased lung function etc. (Harre et al. 1997; Oguntoke and Yussuf 2010). However, even after the decline, the level of PM2.5 remained higher than WHO recommended level of 10 μg/m3 for the annual mean (WHO 2006). Same is true for other parameters, whose WHO safe limits are 40 µg/m3 (NO2), 20 µg/m3 (SO2) and 25 µg/m3 (CO) for the annual mean Nonetheless, such a significant decline in air quality is supposed to lead to improved health of people and avoid air pollution linked health problems and even deaths. He et al. (2020) in a similar study on lockdown induced air pollution effects in China indicated that improvement in air quality might avoid 24,000 to 36,000 premature deaths on a monthly basis. However, they suggested that if indoor air quality becomes toxic during lockdown, it might reduce the presumed benefits (He et al. 2020). The exact benefits of current air pollution decline would come to knowledge in due course of time. Presently, however, it is well clear that reduced human activities have created a much clear and clean air.
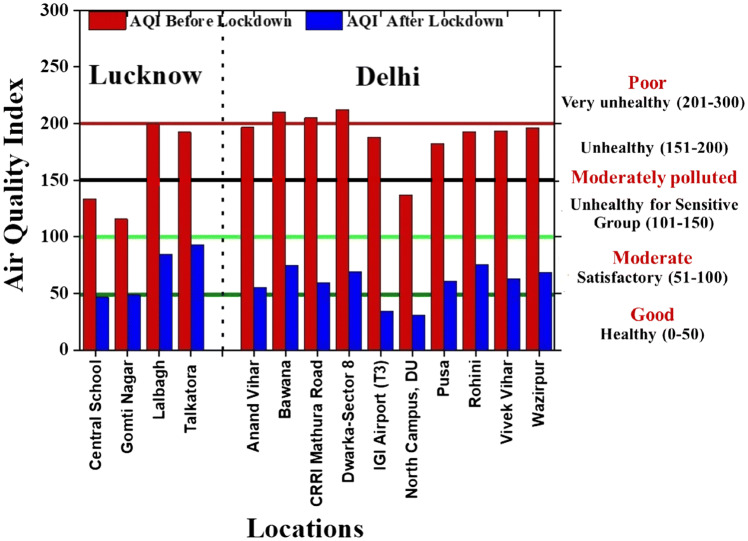
The AQI was also calculated for 14 locations for before and after lockdown in two cities (Fig. 4). The AQI of Lucknow was found to be in the range of 115.80 to 199.50 and remained in the unhealthy moderately polluted to poor range (AQI between 101 and 200) as described in the NAQI (Table S2). After the implication of lockdown, the AQI was significantly changed and was found to be in the range of 46.64 to 93.11 which falls in Good (0–50 at Central School and Gomti Nagar) to satisfactory (51–100 Lalbagh and Talkatora) AQI range.
Fig. 4.
Air Quality Index in Lucknow and Delhi city (Before and After Lockdown). AQI were calculated using PM2.5, SO2 and NO2
In New Delhi, the AQI was found to be poor at Bawana, CRRI Mathura Road and Dwarka-sector 8, as well as at some other monitoring site such as Anand Vihar, IGI airport (T3), North Campus Delhi University (DU), Pusa, Rohini, VivekVihar and Wazipur with the values (137–210) being in moderately polluted to poor AQI range (101 to 200) before the implication of lockdown. However, a dramatic reduction was observed in the AQI at all ten monitoring sites over Delhi with AQI range of 31.07 to 75.50 after lockdown. Thus, AQI values after lockdown fell in the range of good to satisfactory. The drastic change observed AQI values were mainly due to cut down in local anthropogenic emission sources such as industrial units, vehicular movements, transportation, and construction work, etc.
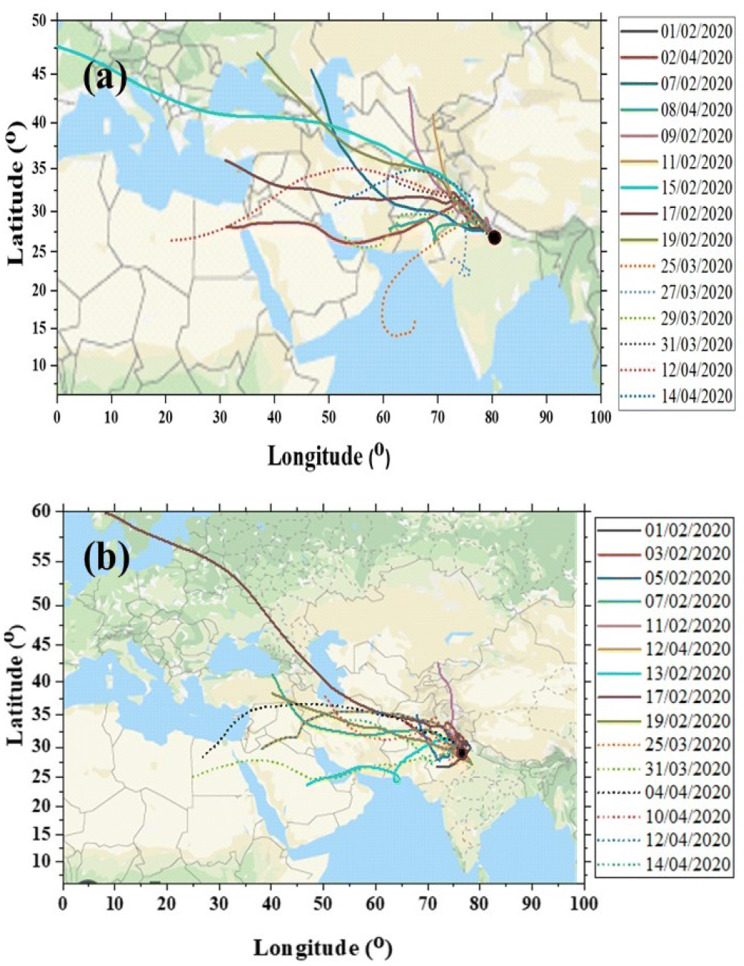
To understand the influence of long-range transportation of atmospheric pollutants at both monitoring zones, the air mass back trajectory analysis was also performed. Air mass trajectories for four locations in Lucknow and ten locations in Delhi were very close to each other and so locations were considered as a single location in both cities. The mass concentration of PM2.5, SO2, NO2 and CO showed significant fluctuation during before lockdown and after lockdown periods (Fig. 5a, b). The air mass travelled from European, African, and Gulf countries as well Afghanistan, Tajikistan, Western Pakistan via Rajasthan, Punjab to Delhi and then to Lucknow during both events. However, few trajectories also originated from the Arabian Sea and the Gujrat state of India in case of Lucknow. In New Delhi, significant contribution was also noticed from local emission entities located in National Capital Region (NCR). So the air quality in both cities was dominantly influenced by long-range transportation, which also contributed to variation in the pollutant load. Air back mass trajectory has been well documented and examined by Tiwari et al. (2016) and Yerramsetti et al. (2013) for ambient air of Delhi and Lucknow, respectively.
Fig. 5.
a, b Air mass back trajectory for Lucknow (a) and Delhi (b) The air trajectory before (solid line) and after lockdown (dotted line)
In conclusion, results of the present study indicate a sharp decline in overall air quality indexes and in the concentration of primary air pollutants. The study needs to be extended to analysis of secondary air pollutants, such as ozone, also. However, such a lockdown cannot be planned in normal conditions in such a huge country and therefore it cannot be considered as a permanent solution. Nevertheless, taking lessons from the present lockdown and emerging and foreseen environmental scenarios, we propose following prospective measures that can be adopted in future to mitigate air pollution.
In every 3 to 6 months, a short 3 to 5 days complete/partial lockdown can be practiced to mitigate environmental pollution especially air pollution. During such a lockdown, people should be encouraged to have regular walk and jogging in nearby areas without vehicular use. In this way, people would not only avoid continuous indoor air and mental stress of lockdown but would also enjoy outside clean air.
Weekly or fortnightly, one “no vehicle day” can be practiced.
Electronic supplementary material
Below is the link to the electronic supplementary material.
Acknowledgements
Authors are thankful to Department of Botany, University of Lucknow. Amit Kumar is thankful to SERB, DST, New Delhi for the award and financial assistance in form of SERB-NPDF.KB acknowledges DST-Science and Engineering Research Board (SERB), New Delhi, India for financial support (EEQ/2017/000476).The authors are thankful to Central Pollution Control Board, New Delhi and Uttar Pradesh Pollution Control Board, Lucknow. The authors are thankful to Ministry of Environment Forest and Climate Change, New Delhi.
Compliance with Ethical Standards
Conflict of interest
The authors declare that they have no conflict of interest.
Footnotes
Publisher's Note
Springer Nature remains neutral with regard to jurisdictional claims in published maps and institutional affiliations.
References
- Baig AM, Khaleeq A, Ali U, Syeda H. Evidence of the COVID-19 virus targeting the CNS: tissue distribution, host–virus interaction, and proposed neurotropic mechanisms. ACS Chem Neurosci. 2020;11:995. doi: 10.1021/acschemneuro.0c00122. [DOI] [PubMed] [Google Scholar]
- Banerjee AV, Duflo E, Glennerster R. Putting a band-aid on a corpse: incentives for nurses in the Indian public health care system. J Eur Econ Assoc. 2008;6(2–3):487–500. doi: 10.1162/JEEA.2008.6.2-3.487. [DOI] [PMC free article] [PubMed] [Google Scholar]
- Central Pollution Control Board, New Delhi, (2020) https://app.cpcbccr.com/AQI_India/; https://www.dpccairdata.com and https://air-quality.com. Accessed 15 April, 2020.
- Chen H, Guo J, Wang C, Luo F, Yu X, Zhang W, Li J, Zhao D, Xu D, Gong Q, Liao J. Clinical characteristics and intrauterine vertical transmission potential of COVID-19 infection in nine pregnant women: a retrospective review of medical records. The Lancet. 2020;395(10226):809–815. doi: 10.1016/S0140-6736(20)30360-3. [DOI] [PMC free article] [PubMed] [Google Scholar]
- Deep A, Pandey CP, Nandan H, Purohit KD, Singh N, Singh J, Ojha N. Evaluation of ambient air quality in Dehradun city during 2011–2014. J Earth Syst Sci. 2019;128(4):96. doi: 10.1007/s12040-019-1092-y. [DOI] [Google Scholar]
- Driggin E, Madhavan MV, Bikdeli B, Chuich T, Laracy J, Bondi-Zoccai G, Brown TS, Der Nigoghossian C, Zidar DA, Haythe J, Brodie D. Cardiovascular considerations for patients, health care workers, and health systems during the coronavirus disease 2019 (COVID-19) pandemic. J Am Col Cardiol. 2020 doi: 10.1016/j.jacc.2020.03.031. [DOI] [PMC free article] [PubMed] [Google Scholar]
- Gautum S. The influence of COVID-19 on air quality in India: a boon or inutile. Bull Environ Contam Toxicol. 2020 doi: 10.1007/s00128-020-02877-y. [DOI] [PMC free article] [PubMed] [Google Scholar]
- Gu J, Han B, Wang J. COVID-19: gastrointestinal manifestations and potential fecal–oral transmission. Gastroenterology. 2020;158:1518. doi: 10.1053/j.gastro.2020.02.054. [DOI] [PMC free article] [PubMed] [Google Scholar]
- Guo YR, Cao QD, Hong ZS, TanYY CSD, Jin HJ, Tan KS, Wang DY, Yan Y. The origin, transmission and clinical therapies on coronavirus disease 2019 (COVID-19) outbreak–an update on the status. Mil Med Res. 2020;7(1):1–10. doi: 10.1186/s40779-020-00240-0. [DOI] [PMC free article] [PubMed] [Google Scholar]
- Guttikunda S (2010) Air quality index (AQI) for Delhi, India: trend analysis & implications for the commonwealth games 2010 & beyond. Sim-Air Working Paper Series, 35–2010.
- Harre ES, Price PD, Ayrey RB, Toop LJ, Martin IR, Town GI. Respiratory effects of air pollution in chronic obstructive pulmonary disease: a three month prospective study. Thorax. 1997;52(12):1040–1044. doi: 10.1136/thx.52.12.1040. [DOI] [PMC free article] [PubMed] [Google Scholar]
- He G, Pan Y, Tanaka T (2020) COVID-19, city lockdown, and air pollution: evidence from China. medRxiv. 10.1101/2020.03.29.20046649
- He Z, Kim YJ, Ogunjobi KO, Hong CS. Characteristics of PM2.5 species and long-range transport of air masses at Taean background station South Korea. Atmos Environ. 2003;37(2):219–230. doi: 10.1016/S1352-2310(02)00834-8. [DOI] [Google Scholar]
- Joshi PC, Mahadev S. Distribution of air pollutants in ambient air of district Haridwar (Uttarakhand), India: a case study after the establishment of State Industrial Development Corporation. Int J Environ Sci. 2011;2(1):237–258. [Google Scholar]
- Li R, Zhou R, Zhang J. Function of PM2.5 in the pathogenesis of lung cancer and chronic airway inflammatory diseases. Oncollet. 2018;15(5):7506–7514. doi: 10.3892/ol.2018.8355. [DOI] [PMC free article] [PubMed] [Google Scholar]
- Ma JH, Song SH, Guo M, Zhou J, Liu F, Peng L, Fu ZR. Long-term exposure to PM2.5 lowers influenza virus resistance via down-regulating pulmonary macrophage Kdm6a and mediates histones modification in IL-6 and IFN-β promoter regions. Biochem Biophys Res Commun. 2017;493(2):1122–1128. doi: 10.1016/j.bbrc.2017.09.013. [DOI] [PubMed] [Google Scholar]
- Ma S, Xiao Z, Zhang Y, Wang L, Shao M. Assessment of meteorological impact and emergency plan for a heavy haze pollution episode in a Core City of North China Plain. Aerosol Air Qual Res. 2020;20:26–42. doi: 10.4209/aaqr.2019.08.0392. [DOI] [Google Scholar]
- Mahato S, Pal S, Ghosh KG. Effect of lockdown amid COVID-19 pandemic on air quality of the megacity Delhi. India Sci Total Environ. 2020;730:139086. doi: 10.1016/j.scitotenv.2020.139086. [DOI] [PMC free article] [PubMed] [Google Scholar]
- Ministry of Statistics and Programme Implementation, Govt. of India, New Delhi, (2020) https://statisticstimes.com/demographics/population-of-india.php. Accessed 30 April, 2020.
- Nakada LYK, Urban RC. COVID-19 pandemic: impacts on the air quality during the partial lockdown in São Paulo state. Brazil Sci Total Environ. 2020;730:139087. doi: 10.1016/j.scitotenv.2020.139087. [DOI] [PMC free article] [PubMed] [Google Scholar]
- National Air Quality Index (2014), Central Pollution Control Board (Ministry of Environment, Forests & Climate Change), New Delhi. https://www.indiaenvironmentportal.org.in/files/file/Air%2520Quality%2520Index.pdf. Accessed 15 April, 2020.
- Oguntoke O, Yussuf AS. Air pollution arising from vehicular emissions and the associated human health problems in Abeokuta Metropolis Nigeria. ASSET. 2010;8(2):119–132. [Google Scholar]
- Punith YN, Nagarajappa DP (2017) Monitoring of SPM, SO2, NO2, and AIR quality index in selected areas of Davangere city during summer season. Glob Res Dev J Eng 2(11):10–18
- Ramani KV, Mavalankar D. Health system in India: opportunities and challenges for improvements. J Health Organ Manag. 2006;20:560. doi: 10.1108/14777260610702307. [DOI] [PubMed] [Google Scholar]
- Rozwadowska A, Zieliński T, Petelski T, Sobolewski P. Cluster analysis of the impact of air back-trajectories on aerosol optical properties at Hornsund Spitsbergen. Atmos Chem Phys. 2010;10:3. doi: 10.5194/acp-10-877-2010. [DOI] [Google Scholar]
- Shabudeen PS. Impact upon the Indian socio-economic fronts by climate change. Ind J Sci Technol. 2011;4(3):192–196. doi: 10.17485/ijst/2011/v4i3.22. [DOI] [Google Scholar]
- Sharma S, Zhang M, Gao J, Zhang H, Kota SH. Effect of restricted emissions during COVID-19 on air quality in India. Sci Total Environ. 2020;728:138878. doi: 10.1016/j.scitotenv.2020.138878. [DOI] [PMC free article] [PubMed] [Google Scholar]
- Stein AF, Draxler RR, Rolph GD, Stunder BJB, Cohen MJ, Ngan F. HYSPLIT atmospheric transport and dispersion modeling system. Bull Am Meteorol Soc. 2015;96(12):2059–2077. doi: 10.1175/BAMS-D-14-00110.1. [DOI] [Google Scholar]
- Tiwari S, Gautam AS, Dumka UC (2016) Assessment of PM 25 and PM 10 over Guwahati in Brahmaputra River Valley: temporal evolution, source apportionment and meteorological dependence, Atmospheric Pollut Res, 1–16.
- Wang P, Chen K, Zhu S, Wang P, Zhang H. Severe air pollution events not avoided by reduced anthropogenic activities during COVID-19 outbreak. Resour Conserv Recycl. 2020;158:104814. doi: 10.1016/j.resconrec.2020.104814. [DOI] [PMC free article] [PubMed] [Google Scholar]
- World Health Organization (WHO) (2006) WHO Air quality guidelines for particulate matter, ozone, nitrogen dioxide and sulfur dioxide: global update 2005: summary of risk assessment (No. WHO/SDE/PHE/OEH/06.02), Geneva
- World Health Organization (2020) Coronavirus disease (COVID-2019) situation reports. World Health Organization, Geneva.https://www.who.int/emergencies/diseases/novel-coronavirus-2019. Accessed 14 May, 2020.
- World Urbanization Prospects, (2020). Population Division, New York, USA.https://worldpopulationreview.com/world-cities/. Accessed 15 April, 2020.
- Yerramsetti VS, Sharma AR, Navlur NG, Rapolu V, Dhulipala NC, Sinha PR. The impact assessment of Diwali fireworks emissions on the air quality of a tropical urban site, Hyderabad, India, during three consecutive years. Environ Monit Assess. 2013;185(9):7309–7325. doi: 10.1007/s10661-013-3102-x. [DOI] [PubMed] [Google Scholar]
- Zhu N, Zhang D, Wang W, Li X, Yang B, Song J, Zhao X, Huang B, Shi W, Lu R, Niu P (2020) A novel coronavirus from patients with pneumonia in China, 2019. N Engl J Med 382(8):727–733 [DOI] [PMC free article] [PubMed]
Associated Data
This section collects any data citations, data availability statements, or supplementary materials included in this article.


